Article

The Influence of Thermal Stress on Cadmium Uptake in Arctic Charr (Salvelinus alpinus) and Its Effects on Indicators of Fish Health and Condition, with Implications for Climate Change

by
Mackenzie Anne Clifford Martyniuk
*,
Camille Garnier
and
Patrice Couture
Institut National de la Recherche Scientifique, Centre Eau Terre Environnement, 490 Rue de la Couronne, Quebec City, QC G1K 9A9, Canada
*
Author to whom correspondence should be addressed.
Environments 2025, 12(6), 176; https://doi.org/10.3390/environments12060176
Submission received: 12 March 2025 / Revised: 6 May 2025 / Accepted: 16 May 2025 / Published: 26 May 2025

Abstract

:
Given the implications of heat stress on contaminant uptake and the importance of salmonid fish to Northern Indigenous peoples, investigating temperature-driven patterns in trace metal bioavailability is essential for assessing climate change risks. Here, juvenile Arctic charr were exposed for 8 weeks to cadmium (Cd) at a nominal concentration of 3 µg·L−1 (measured Cd: 1.81 ± 0.47 µg·L−1) or controls (measured Cd: 0.03 ± 0.03 µg·L−1) at a low (6 °C) or high (16 °C) temperature. Cd concentrations were measured in dorsal muscle, liver, and kidney tissues, and antioxidant (superoxide dismutase (SOD), catalase (CAT)) and anaerobic (lactate dehydrogenase (LDH)) capacities were assessed in liver tissue. Elevated temperatures significantly increased Cd uptake in analyzed tissues. Log10SOD activity decreased in the 6 °C-Cd treatment, while log10CAT activity declined in high-temperature treatments and log10LDH activity was reduced in Cd-exposed groups. The results highlight the influence of temperature, but also of combined thermal and trace metal stressors on Arctic charr’s antioxidant and anaerobic capacities. Biometric data indicate that temperature exerted a stronger negative influence on growth than Cd, with synergistic effects of temperature and Cd on the hepatosomatic index. Overall, this research highlights the thermal stress impacts on Cd uptake and Arctic charr physiology.

Graphical Abstract

1. Introduction

Northern fish are facing increasing pressures associated with climate change. Initially, fish may be able to avoid suboptimal temperatures through displacement to a more suitable habitat, although some species may have little capacity to accommodate thermal changes [1,2]. Furthermore, temperature-induced costs to swimming capacities [3,4], which are directly related to ecologically and physically relevant behaviours, are expected to limit the energy available for growth and reproduction [5,6], with overall implications for fitness and survival. Adding to these challenges, it is suggested that an increase in the frequency and intensity of hot episodes predicted with climate change models will exacerbate and compound trace metal uptake when contaminant and temperature stressors are applied synergistically, as previous research has indicated that when subjected to heat stress, fish become less resistant to contaminants [7,8].
As numerous physiological and behavioural disruptions are associated with elevated tissue trace metal uptake in fish, the combined effect of warming water temperatures and trace metal contamination may pose a significant threat to fish health in populations near contaminant sources. Detoxification and the repair of affected biological tissues or systems result in costs that reduce energetic reserves [9,10], subsequently limiting their availability for other vital functions. A decline in growth efficiency [11,12] can then occur, ultimately diminishing overall fish health and survival. There is also evidence that certain trace metals are biomagnified throughout the food web [13,14] and can reach high concentrations in large-bodied predatory fish. This is of significant concern to Northern Indigenous peoples, who may practice subsistence fishing on traditional territories proximate to sources of potential trace metal contamination and who consume large quantities of fish, especially from the family Salmonidae. Northern salmonids such as Arctic charr (Savlelinus alpinus) are an economic and culturally important food resource [15]. Essential for mitigating Northern food insecurity [16], salmonids are a principal component of the year-round diet of Indigenous people across the circumpolar Arctic. Despite the negative implications of trace metals for fish and human health [17,18], research exploring trace metal contamination in Northern salmonids has been poorly represented in the literature beyond investigations into mercury (Hg) concentrations. In controlled laboratory-based settings, available research again has focused primarily on the uptake, handling, and accumulation of Hg (e.g., [19,20]). This highlights the need to examine the critical thresholds of metal contamination for Northern salmonids in conjunction with temperatures anticipated under climate change scenarios.
To address these shortcomings, here, Arctic charr were exposed for 8 weeks to Cd at both 6 °C and 16 °C, to assess the response of health and condition indicators to heat and metal stressors, as well as their combined effects. Cadmium was selected as it is a non-essential metal, toxic even at low concentrations, with no known biological benefit [21]. Anthropogenic activity, including mining, accounts for the majority of Cd released into receiving aquatic environments [22,23,24]. In fish, uptake occurs across the gills and via digestive and transcutaneous absorption [25,26]. Initial biomarkers of Cd contamination include biochemical or cellular changes which eventually result in whole system physiological and metabolic dysfunction [27,28]. There is also some evidence of Cd biomagnification through aquatic food webs [29,30] and, in humans, acute Cd exposure can result in flu-like symptoms, while prolonged contamination can cause subsequent deleterious nephrotoxic, immunotoxic and carcinogenic effects [31,32].
To assess whether tissue Cd accumulation would be higher in Arctic charr exposed to the combined trace metal and thermal stressors, uptake in consumed tissue (e.g., dorsal muscle) and detoxifying organs (e.g., liver, and kidney) were evaluated. Modifications in the activity levels of the indicators of stressor-induced disruption to antioxidant defence capacities in fish [33,34], superoxide dismutase (SOD) and catalase (CAT) in liver, were used to assess whether co-exposure to thermal stress and Cd resulted in higher activity of oxidative stress marker values from Arctic charr subjected to control, contaminant or temperature stressors alone. Oxidative stress biomarkers have been increasingly recognized as important tools for ecotoxicological research [35,36], as trace metals induce oxidative stress through the generation of reactive oxygen species, which are detoxified by key enzymatic compounds in the antioxidant defence system, such as SOD and CAT [37,38]. Trace metals are also known to impair metabolic and energetic processes [11,39,40], which may have negative implications for essential behaviours and subsequent repercussions for overall fish health and condition. Therefore, we also investigated whether combined thermal and trace metal stressors would prompt a greater reliance on anaerobic metabolism for energetic production in Arctic charr than control, contaminant, or temperature stressors alone. The anaerobic metabolism was evaluated by measuring the activity levels of the glycolytic enzyme LDH, which has been documented to increase after contaminant exposure [41,42].
Additionally, the effects of Cd and thermal stress on integrative whole system responses were evaluated via measured differences in biometric (fork length, whole weight, Fulton’s condition factor (K), and hepatosomatic index (HSI)) variables. Biometric biomarkers, such as K and HSI, can be used as diagnostic tools for determining fish health in contaminant studies. Declines in K [43,44,45] and HSI [46,47,48] values have been consistently documented with the accumulation of trace metals and can suggest a decline in growth efficiency [11,12] with energy resources being allocated to detoxification and depuration [9,10,49]. Correlations between tissue Cd concentrations and biometric and physiological biomarkers of effects were also investigated. Finally, a principal component analysis (PCA) was performed to investigate the relationships between tissue Cd concentrations and SOD, CAT, LDH and biometric biomarkers to reduce the dimensionality of the dataset and to further examine correlations among the studied parameters.

2. Materials and Methods

2.1. Fish and Experimental Design

Exposures were performed following protocols modified from those outlined in Fadhlaoui and Couture [34] and Fadhlaoui, et al. [50]. Juvenile Arctic charr (n = 420) (mass ≈ 20–80 g) were purchased from Pisciculture des Monts-de-Bellechasse Inc. (Saint-Damien-de-Buckland, Québec City, QC, Canada) and held in a multi-unit aquatic housing system custom designed by Aquaneering Inc. (San Diego, CA, USA) in a temperature-controlled room at the Institut National de la Recherche Scientifique—Centre Eau Terre Environnement (INRS-ETE) in Québec City, Québec, Canada. The system includes four closed, recirculating, self-monitoring units with individual temperature control. Each of the four units house three constantly oxygenated 75 L polycarbonate aquaria managed by a four-stage filtration system comprising a mechanical filter, a fluidized bed biofilter, carbon filters, and an ultraviolet light sterilizer.
Aquaria were filled with reverse osmosis water supplied by a reverse osmosis water maker (Aquaneering Inc., San Diego, CA, USA) that combines a carbon pre-filter, sediment filter, and membrane. Water exchanges were performed via mechanical pump connecting a 300 L storage reservoir to the aquaria in the four units. These were completed daily to remove food residues and metabolic wastes, as well as maintain contaminant concentrations, with water volume (approximately 25% of total water volume) being renewed to account for evaporation and exchange volume. Physiochemical parameters (ammonia ( x ¯ = 0.3 mg·L−1), nitrates ( x ¯ = 5 mg·L−1), nitrites ( x ¯ = 0.1 mg·L−1), and water hardness (general hardness (GH) [ x ¯ = 61–100 mg·L−1] and carbonate hardness (KH) [ x ¯ = 20–80 mg·L−1]) were monitored daily, while system pH (7.4) and conductivity [450–685 µS/cm] were continuously monitored with an Aquadose System (Aquaneering Inc., San Diego, CA, USA) that recognizes divergence from pre-programmed pH and conductivity values and will automatically correct levels to ensure consistency in the system. Conductivity and pH values were adjusted with sea salt (crystal sea bioassay formula marine mix, Aquaneering Inc., San Diego, CA, USA) and sodium bicarbonate (powder/certified ACS, Fisher Scientific, Whitby, ON, Canada), respectively.
Prior to beginning the exposure experiments, fish were distributed in each of the 12 tanks (35 fish per tank) to achieve a similar total biomass in each tank. Fish were then acclimatized for 14 days at 11 ± 1.0 °C with a 16 h light and 8 h dark photoperiod. Control acclimatization temperatures were chosen based on previous literature detailing optimal temperatures for laboratory-based growth experiments for Arctic charr [51,52], as well as studies describing temperature preferences and optimal temperatures for growth efficiency under environmental conditions [53,54]. During this period, 35 fish were held in each of the 75 L aquaria, monitored daily, and fed commercial fish pellets ad libitum. After the acclimatization period, water temperature was lowered (in 6 aquaria) or raised (in 6 aquaria) at a rate of 1 °C per day to reach a high temperature treatment of 16 ± 1.0 °C and a cold temperature treatment of 6 ± 1.0 °C. The experimental cold temperature (6 ± 1.0 °C) was chosen to reflect the conditions observed in the high Arctic and optimal thermal preferences [55,56], as well as conditions described in previous literature detailing laboratory-based Arctic charr experiments [19,57,58], while the temperature chosen for the thermal stress treatment (16 °C ± 1.0 °C) was based on projected increases in summer water temperatures modelled for Arctic regions [59,60] and thermal limits for Arctic charr [55,61].
For each temperature, 3 aquaria (one unit) were used as a control (uncontaminated), while 3 aquaria for each temperature were contaminated with Cd. Metal exposure began when experimental temperatures were reached with the addition of 3 µg·L−1 of cadmium chloride (CdCl2) (analytical grade; 99.9% purity) purchased from Sigma Aldrich (Oakville, ON, CA) from a stock solution prepared with Milli-Q water. To balance ecological relevance with experimental sensitivity, a Cd exposure concentration of 3 μg·L−1 was chosen to reflect Cd concentrations in freshwater in areas proximate to mining operations [62,63,64], those used in prior laboratory-based fish exposure studies [65,66,67,68,69], yet remain sufficient to elicit discernible biological responses within the defined timeframe. Throughout the course of the exposure, water chemistry parameters (pH ( x ¯ = 7.4), conductivity [450–685 µS/cm], and temperature) were constantly monitored via the aquatic housing system, while other variables, such as water hardness (general hardness (GH) [ x ¯ = 61–100 mg·L−1] and carbonate hardness (KH) [ x ¯ = 20–80 mg·L−1]), ammonia ( x ¯ = 0.3 mg·L−1) nitrites ( x ¯ = 5 mg·L−1) and nitrates ( x ¯ = 0.1 mg·L−1) were evaluated daily. Fish were fed commercial fish pellets ad libitum during the exposures. Metal concentrations were assessed after every water change to correct and maintain the desired elemental concentrations. For Cd, measured water concentrations were 1.806 ± 0.47 µg∙L−1 (mean ± standard deviation, n = 330; two temperatures, three aquaria per temperature, one sampling from each aquarium per day, beginning on exposure day two). The average concentration of Cd in control aquaria were 0.027 ± 0.03 µg∙L−1 (mean ± standard deviation, n = 330; two temperatures, three aquaria per temperature, one sampling from each aquarium per day, beginning on exposure day two). Additionally, 63 water samples from the control aquaria were determined to be below analytical detection limits.
At the end of the exposure period (8 weeks) fish were sacrificed with a sharp blow to the head. Measurements for fork length (mm) and whole weight (g) were then taken and these measurements used to calculate the condition factor K after confirming isometric growth [70], which was determined after performing standardized weight–length regressions and ensuring that the slope of this regression does not significantly deviate from a value of three [70]. Negative associations between K and trace metal concentrations have been suggested to be reflective of declines in growth efficiency [11,12] with energy resources being allocated to detoxification and depuration [9,10]. K was calculated as follows:
K = W t F L 3 100
where Wt and FL are the respective measured total weight (g) and fork length (mm) of the individual fish [70]. Fish were then dissected on ice with liver weight (±0.1 mg) recorded and used to calculate fish hepatosomatic index (HSI), which is used as a diagnostic tool for determining fish health in contaminant studies [46,47] and may reflect toxicant induced chemical and cellular changes reflective of organ and organismal damage [71,72]. HSI was calculated as follows:
H S I = W L W t 100
where liver weight (g) and fish total weight (g) are represented by WL and Wt, respectively. Samples of dorsal muscle, liver, and kidney tissue were then collected for metal analysis and immediately placed in 15 mL trace metal free tubes and frozen at −20 °C for subsequent analysis of Cd concentrations. For enzyme activity assays and protein concentration determination, liver tissue was sub-sampled and stored in cryogenic tubes at −80 °C. All procedures involving Arctic charr were approved by the INRS-ETE institutional animal care committee.

2.2. Cadmium Analysis

Trace metal analysis was performed at the INRS-ETE. For metal determination of the collected water samples, each sample was acidified to a pH of 2 through the addition of optima grade nitric acid and stored at 4 °C until analysis using inductively coupled plasma mass spectrometry (ICP-MS). Results are reported in µg·L−1. After lyophilisation for 72 h (FTS Systems TMM, Kinetics Thermal Systems, Longueuil, QC, Canada), freeze-dried dorsal muscle, liver, and kidney tissue were weighed to 100–150 mg ± 0.1 mg (XS205 DualRange Analytical Balance, Mettler Toledo, Mississauga, ON, Canada) to determine dry weight (dw). Samples were then digested in 1500 µL nitric acid (70%, v/v, Optima grade, Fisher Scientific, Whitby, ON, Canada) for 3 days at room temperature, then heated at 60 °C for 2 h. After cooling, 750 µL hydrogen peroxide (30%, v/v, Optima grade, Fisher Scientific, Whitby, ON, Canada) was added before dilution with ultrapure water to reach a final digestion volume of 15 mL. Concentrations of Cd were then quantified using ICP-MS (Model x-7, Thermo Elemental, Winsford, England, UK) with all results reported in µg·kg−1 dw. Certified reference materials from the National Research Council of Canada (NRCC, Halifax, NS, Canada) TORT-3 (Lobster hepatopancreas) and DOLT-5 (Dogfish liver), as well as blanks were also subjected to the same digestion procedure and analyzed concurrently to establish accuracy and recovery. Percent recoveries are reported as mean percentage of certified value ± standard deviation. For TORT-3, percent recovery was 94.69 ± 6.04%, while DOLT-5, percent recovery was 90.04% ± 7.22%.

2.3. Enzyme and Protein Assays

For enzyme assays, liver tissue was homogenized in a buffer solution (20 mM HEPES, 1 mM EDTA, and 0.10% Triton X-100) and activities measured in triplicate using a UV/Vis spectrophotometer (Varian Cary 100, Varian Inc., Palo Alto, CA, USA) on a microplate at room temperature (20 °C). To test for possible variations in individual condition that would affect enzyme activity measurements, enzyme activity was normalized to the protein concentration of individual homogenates, which were determined via the Bradford protocol [73] with a Coomassie Protein Assay Kit (No. 23200) (Thermo Fisher Scientific, Waltham, MA, USA) based on the method described in Lowry, et al. [74].). Bovine serum albumin was used as a standard. Enzyme activities are expressed as international units (IU) (µmol of substrate converted to product per min) per g of protein wet weight and all chemicals used in the enzyme assays were purchased from Sigma-Aldrich Canada (Oakville, ON, Canada) or Cayman Chemicals (Ann Arbor, MI, USA). Reaction conditions for the various enzymes are as follows:
Catalase (CAT; EC 1.11.1.6): Catalase activity was measured using an assay kit (No. 284 707002 purchased from Cayman Chemical Company Inc. (Ann Arbor, MI, USA)), following the manufacturer’s protocol at 540 nm.
Superoxide dismutase (SOD; EC 1.15.1.1): Superoxide dismutase activity was performed using an assay kit (No. 706002 purchased from Cayman Chemical Company Inc. (Ann 288 Arbor, MI, USA)), following the manufacturer’s protocol at 450 nm.
Lactate dehydrogenase (LDH; EC 1.1.1.27): Phosphate buffer (100 mM, pH 7.2), β-nicotinamide adenine dinucleotide (β-NADH) 0.16 mM, pyruvate 5.0 mM (omitted in controls) at a wavelength of 340 nm [75,76] for 7 min.

2.4. Statistical Analysis

Statistical analyses were performed using JMP (v. 17.0.0, SAS Institute Canada Inc., ON, Canada) with Type I error set to α = 0.05. Data consistency with normality assumptions was verified using residual diagnostic histograms, visual assessment of Q-Q plots, and the Shapiro–Wilk test [77], while homoscedasticity assumptions were validated using the Bartlett’s test or the Levene’s test. Data that did not meet parametric assumptions were log10 transformed [78]. Linear regressions were used to determine the relationship significance among variables, while generalized linear models (GLMs) with a normal distribution and identity link function were employed to evaluate the effects of tissue Cd concentrations, treatment temperature, and their interaction on measured biometric parameters (fork length, whole weight, K, and HSI) [79,80]. Additional GLMs were performed to investigate the relationship between liver Cd concentrations, temperature, and the interaction between liver Cd and temperature on enzymatic activity levels (SOD, CAT, and LDH). Unpaired, one-way and two-way analysis of variances (ANOVAs), including interaction terms were also used to determine significant differences among exposure treatment conditions [78]. Both ANOVA models were followed by Tukey–Kramer honestly significant difference post hoc tests to assess significant differences between treatment means [78].
Kruskal–Wallis one way analysis of variances, and non-parametric two-way ANOVAs were used when the data did not conform to the required parametric assumptions with Dunn’s test being used for post hoc assessment [78]. Partial eta-squared (ηp²) were additionally calculated for both ANOVA and Kruskal–Wallis models to assess the proportion of variance in investigated parameters (biometric variables, tissue Cd uptake, and measured changes in enzymatic activity) attributed to treatment conditions. Finally, a principal component analysis (PCA) was computed for each exposure-treatment condition to investigate relationships between biomarkers and Cd concentrations in Arctic charr liver tissue to reduce the dimensionality of the dataset. Subsequently, major outputs from the PCA were then evaluated with Spearman correlations (rs) to identify significant relationships between tissue Cd concentrations and biomarkers.

3. Results

3.1. Variation in Biometric Variables and Fish Condition Across Exposure Treatments

Biometric variables for each of the four treatments can be found in Table 1. Fork length varied significantly by treatment (X2(3,406) = 30.59, p < 0.0001), with treatment condition explaining 6.32% of the variability in observed fork length measurements. Fork lengths of fish in 6 °C treatment were significantly greater than those seen with fish held in the 16 °C (p = 0.0002) and 16 °C-Cd treatment (p < 0.0001). Arctic charr in the 6 °C-Cd treatment also had significantly greater average fork lengths than those in the 16 °C (p = 0.0185) and the 16 °C-Cd treatment (p = 0.0003). No significant differences were determined for fork length comparisons between 6 °C and 6 °C-Cd treatments (p = 0.1723), or between 16 °C and 16 °C-Cd treatments (p = 0.3550). Two-way ANOVAs were also performed to evaluate the influences of Cd, temperature, and their interactions on significant differences in measured biometric variables among exposure treatments, with results from these tests also displayed in Table 1. Temperature significantly influenced the variability in fork length measurements observed among treatment conditions, while the effect of Cd and the interaction between temperature and Cd was not significant. Whole weight also varied significantly by treatment (X2(3,409) = 21.09, p = 0.0001) with treatment condition explaining 4.24% of the variability in observed whole weight measurements and with greater values seen in the 6 °C treatment than those observed in the 16 °C (p = 0.0005) and the 16 °C-Cd treatment (p < 0.0001). Arctic charr in the 6 °C-Cd treatment also had significantly greater average whole weights than those in the 16 °C (p = 0.0496) and the 16 °C-Cd treatment (p = 0.0179). No significant differences were determined for fork length comparisons between 6 °C and 6 °C-Cd treatments (p = 0.0838), as well as between 16 °C and 16 °C-Cd treatments (p = 0.8521). A two-way ANOVA again highlighted the significant influence of temperature, but not of Cd, on the variability in whole weight measurements.
Statistical testing of the slope of the standardized weight–length regression confirmed isometric growth, thereby allowing the use of Fulton’s K. However, no significant differences in average K values were observed among treatments (X2(3,409) = 5.802, p = 0.1217) and treatment condition only explained 0.68% of the observed variability in K values. A two-way ANOVA confirmed that neither temperature nor Cd significantly influenced K values, even after removing the interaction factor. Unlike K, HSI values exhibited significant differences among treatments (X2(3,409) = 91.029, p < 0.0001) and treatment condition explained 17.7% of the observed variability in HSI values. Non-parametric post hoc testing indicated that fish maintained at 16 °C exhibited significantly lower HSI values than those at 6 °C, regardless of Cd exposure (p < 0.0001). Arctic charr in the 16 °C-Cd treatment also had significantly lower HSI values than those at 6 °C, regardless of Cd exposure (p < 0.0001). Significant differences in HSI values were also observed between Arctic charr exposed to the 16 °C and 16 °C-Cd treatments (p = 0.0117), while no significant differences were determined between fish held in the 6 °C and 6 °C-Cd treatments (p = 0.1562). Finally, the two-way ANOVA indicated the significant influence of both temperature and Cd on the variability in HSI values observed among treatments. However, the interaction between temperature and Cd was not significant.

3.2. Variation in Cd Uptake in Dorsal Muscle, Liver, and Kidney Tissues and Relationships with Biometric Variables

Significant differences in uptake among exposure conditions for dorsal muscle, liver, and kidney tissues are illustrated in Figure 1. Dorsal muscle Cd concentrations varied significantly by treatment (X2(3,398) = 241.2, p < 0.0001), with treatment condition explaining 37.3% of the variation in observed dorsal muscle Cd concentrations. Cadmium values from fish exposed to the 6 °C-Cd were significantly greater than those observed in the 6 °C treatment (p < 0.0001), and dorsal muscle from the 16 °C-Cd treatment also exhibited significantly greater Cd concentrations than those observed in Arctic charr held in the 6 °C (p < 0.0001) and 6 °C-Cd treatment (p < 0.0001). However, unexpectedly, Cd dorsal muscle concentrations in the 16 °C treatment were also significantly greater than those observed in dorsal muscle of Arctic charr held in the 6 °C (p < 0.0001), 6 °C-Cd (p < 0.0001), and the 16 °C-Cd treatment (p < 0.0001). A two-way ANOVA suggested that while temperature significantly influenced the observed variability in dorsal muscle log10Cd concentrations, Cd as an explanatory variable had no significant effect. However, the interaction between temperature and Cd significantly affected the variability in dorsal muscle Cd concentrations.
Arctic charr liver Cd concentrations also varied significantly by treatment (X2(3,408) = 329.5, p < 0.0001) with 44.5% of the variability in liver Cd concentrations explained by the exposure-treatment condition. Samples from the 6 °C-Cd treatment exhibited significantly greater Cd concentrations than those observed in the 6 °C (p < 0.0001) and 16 °C treatment (p < 0.0001). Liver samples from Arctic charr exposed to 16 °C-Cd conditions also had significantly greater liver Cd concentrations than those in the 6 °C (p < 0.0001) and 16 °C treatment (p < 0.0001). However, liver Cd concentrations measured in the 16 °C-Cd treatment were significantly greater than those from the 6 °C-Cd treatment (p < 0.0001). The influence of temperature on Arctic charr liver Cd uptake was further evident, with liver Cd concentrations being significantly greater in the 16 °C treatment when compared to the concentrations from the 6 °C treatment (p < 0.0001). A two-way ANOVA indicated a significant effect of temperature and Cd on the variability in liver log10Cd concentrations across treatments, yet the interaction between temperature and Cd was non-significant.
Similar to the trends in liver, the kidney Cd concentrations also varied significantly by treatment (X2(3,409) = 363.7, p < 0.0001), with the treatment explaining 47.2% of the observed variation in kidney Cd concentrations. Kidney samples from fish exposed to the 6 °C-Cd treatment demonstrated significantly greater Cd concentrations than those observed in Arctic charr held in the 6 °C (p < 0.0001) and 16 °C treatment (p < 0.0001). Kidney tissue subsampled from the 16 °C-Cd treatment also exhibited greater kidney concentrations than samples originating from the 6 °C (p < 0.0001) and 16 °C treatment (p < 0.0001). Similar to that observed with liver Cd concentrations, kidney Cd concentrations from the 16 °C-Cd treatment were significantly greater than those from the 6 °C-Cd treatment (p < 0.0001). Finally, a two-way ANOVA suggested that temperature, Cd, and the interaction between temperature and Cd significantly influenced the observed variability across the four treatments.
Significant relationships between dorsal muscle, liver, and kidney Cd and biometric variables and the results from the GLMs can be found in Table 2. For dorsal muscle, relationships with Cd concentrations and biometric variables were generally not significant, with the exception of the negative relationship between log10Cd and fork-length in Arctic charr from the 6 °C-Cd treatment. For liver tissue, a greater frequency of significant relationships between Cd concentrations and biometric variables was observed, but mostly for the 6 °C treatments. In the 16 °C treatment, log10Cd liver concentrations significantly increased with associated decreases in HSI values. However, in the 6 °C treatment, liver log10Cd concentrations significantly increased with declines in fork length, whole weight, fish condition, and HSI values. Finally, for the 6 °C-Cd treatment, liver log10Cd concentrations were positively correlated with fork length and whole weight but again liver log10Cd concentrations were negatively correlated with HSI values. Relationships between kidney log10Cd concentrations and biometric correlates were similar to those observed with liver tissue. In the 16 °C treatment, kidney log10Cd concentrations significantly increased with reduced fish condition and HSI values. Again, in the 6 °C treatment, kidney log10Cd concentrations significantly increased with diminishing fork length, whole weight, fish condition, and HSI values. In the 16 °C-Cd treatment, Cd kidney concentrations only correlated positively with fish condition, while in the 6 °C-Cd treatment kidney log10Cd significantly increased with fish weight and somatic condition. Given the limited number of significant relationships identified between Cd concentrations and biometric variables in the linear regression models, GLMs were performed to enhance explanatory power and account for shared variance not captured in the individual regressions. The GLMs revealed significant effects of temperature, Cd exposure, or their interaction on several biometric variables. For dorsal muscle Cd, significant models were observed for fork length, whole weight, and HSI, with Cd and the Cd–temperature interaction significantly contributing to the observed variation in fork length and whole weight measurements. For HSI, temperature was the only independent variable that had a significant effect on this biometric parameter. In liver Cd models, all biometric variables, excluding K, demonstrated significant model effects, with temperature significantly influencing fork length, whole weight, and HSI measurements. For kidney Cd, all biometric variables were associated with significant model outcomes. However, temperature was the only independent variable with a significant effect on HSI in this tissue.

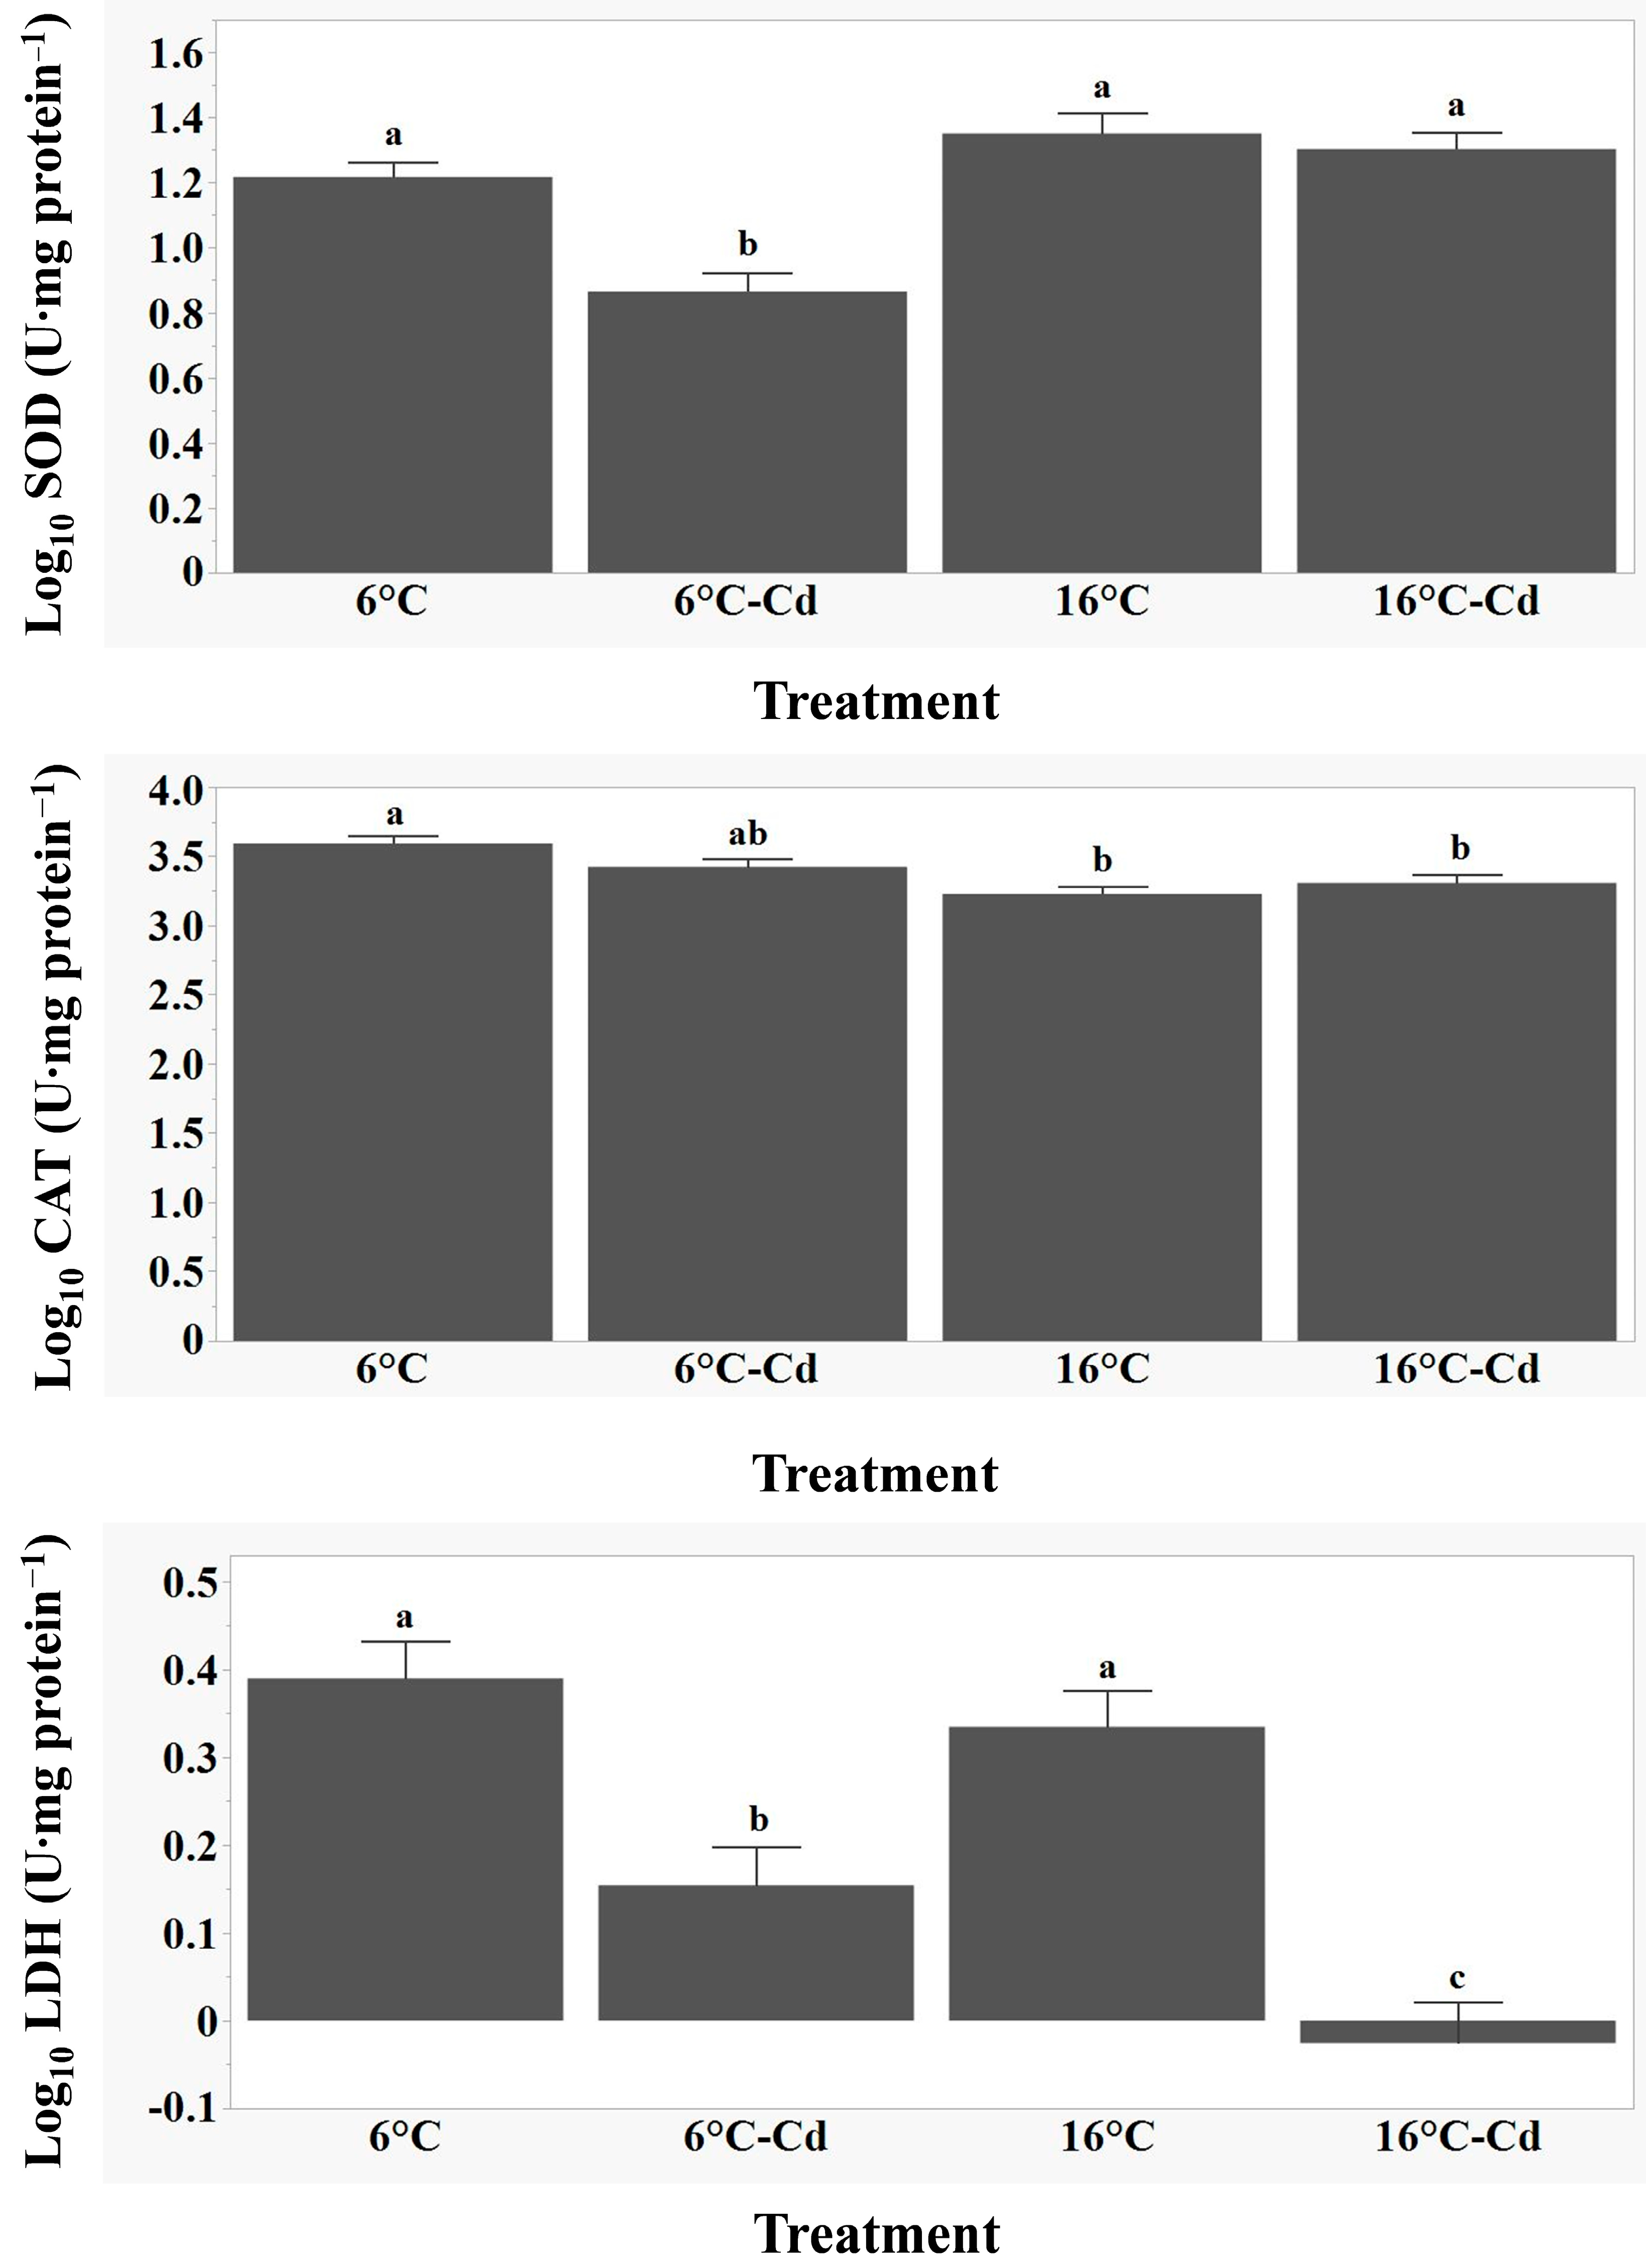
3.3. Variations in SOD, CAT, and LDH Activity and Relationships with Biometric Variables and Tissue Cd Concentrations

Significant differences in the enzyme activities of SOD, CAT, and LDH in Arctic charr liver are illustrated in Figure 2, while relationships between enzyme activities, biometric parameters, and dorsal muscle, liver, and kidney Cd and biometric variables can be found in Table 3. Liver log10SOD activity varied significantly by treatment (F(3,96) = 17.22, p < 0.0001) with treatment conditions explaining 35.0% of the observed variability in log10SOD activity. Log10SOD activity was significantly reduced in Arctic charr from the 6 °C-Cd treatment when compared to this enzyme’s activity in fish from the 6 °C (p < 0.0001), 16 °C (p < 0.0001), and 16 °C-Cd (p < 0.0001) treatment. A two-way ANOVA (F(3,96) = 17.22, p < 0.0001) indicated that temperature (p < 0.0001), Cd (p = 0.0003), and the interaction between temperature and Cd (p = 0.0050) all significantly influenced the observed variability in log10SOD enzymatic activity, across the four treatment conditions.
Liver log10CAT activity also significantly varied by treatment (F(3,96) = 8.235, p < 0.0001) with 20.5% of the variability seen in log10CAT activity explained by exposure treatment. Log10CAT activity was significantly reduced in the high temperature treatments (16 °C (p < 0.0001) and 16 °C-Cd (p = 0.0027)) when compared to the log10CAT activity values that were observed with the 6 °C treatment. For this enzyme, a two-way ANOVA (F(3,96) = 808.4, p < 0.0001) highlighted the influence of temperature (p < 0.0001) and the interaction between temperature and Cd (p = 0.0256) on the observed variability in log10CAT enzymatic activity across the four exposure conditions. However, Cd concentrations did not have a significant effect (p = 0.4510).
The activity of log10LDH varied across the four exposure treatments (F(3,96) = 18.69, p < 0.0001), with 36.9% of the observed variability in log10LDH activity explained by exposure treatment and with reduced log10LDH activity observed in the treatments that exposed Arctic charr to Cd. Arctic charr in the 6 °C-Cd treatment exhibited significantly reduced liver log10LDH activity when compared to fish held in the 6 °C (p = 0.0013) and 16 °C (p = 0.0218) treatments. The same trend was observed with liver log10LDH activity in Arctic charr exposed to the 16 °C-Cd treatment, which was significantly lower than the activity observed in the 6 °C (p < 0.0001) and 16 °C (p < 0.0001) treatments. However, log10LDH activity quantified from Arctic charr from the 16 °C-Cd treatment was also significantly lower compared to the 6 °C-Cd treatment (p = 0.0225). A two-way ANOVA (F(3,96) = 18.69, p < 0.0001) indicated a significant effect of temperature (p = 0.0083) and Cd (p < 0.0001) on the variability in liver log10LDH enzymatic activity exhibited across treatment conditions, yet the interaction between temperature and Cd (p = 0.1564) was non-significant.
There were few relationships between the enzyme activities of investigated biomarkers and biometric variables. Only log10LDH activity was significantly negatively correlated with HSI values in the 6 °C-Cd treatment. Relationships between the enzymatic activities and tissue Cd concentrations were also limited as SOD activity was solely significantly negatively correlated with liver Cd concentrations in Arctic charr housed at 16 °C. CAT activity was also significantly negatively correlated with kidney Cd concentrations, again in the 6 °C-Cd treatment, while LDH significantly declined with increasing Cd dorsal muscle concentrations in the 16 °C-Cd treatment.
Given the limited number of significant relationships between measured enzyme activities and tissue Cd concentrations, GLMs incorporating SOD, CAT, LDH, Cd liver concentrations, temperature, and the interaction between Cd and temperature were employed to enhance explanatory power. For SOD activity, the model was significant (X2(4,95) = 23.10, p = 0.0001), with both temperature (p < 0.0001), and liver Cd concentrations (p = 0.0087) significantly influencing SOD activity. The interaction term was not significant (p = 0.9384). With CAT, model significance was again observed (X2(4,95) = 22.53, p = 0.0002) and both liver Cd concentrations (p = 0.0128) and temperature (p = 0.0029) significantly influencing liver CAT activity, but not their interaction (p = 0.0813). Finally, for LDH, the model was again significant (X2(4,95) = 40.73, p < 0.0001) with liver Cd concentrations significantly driving observed changes to measured LDH activity (p < 0.0001). However, neither the influence of temperature (p = 0.8459), nor the interaction between Cd liver concentrations and temperature (p = 0.6347), were significant.

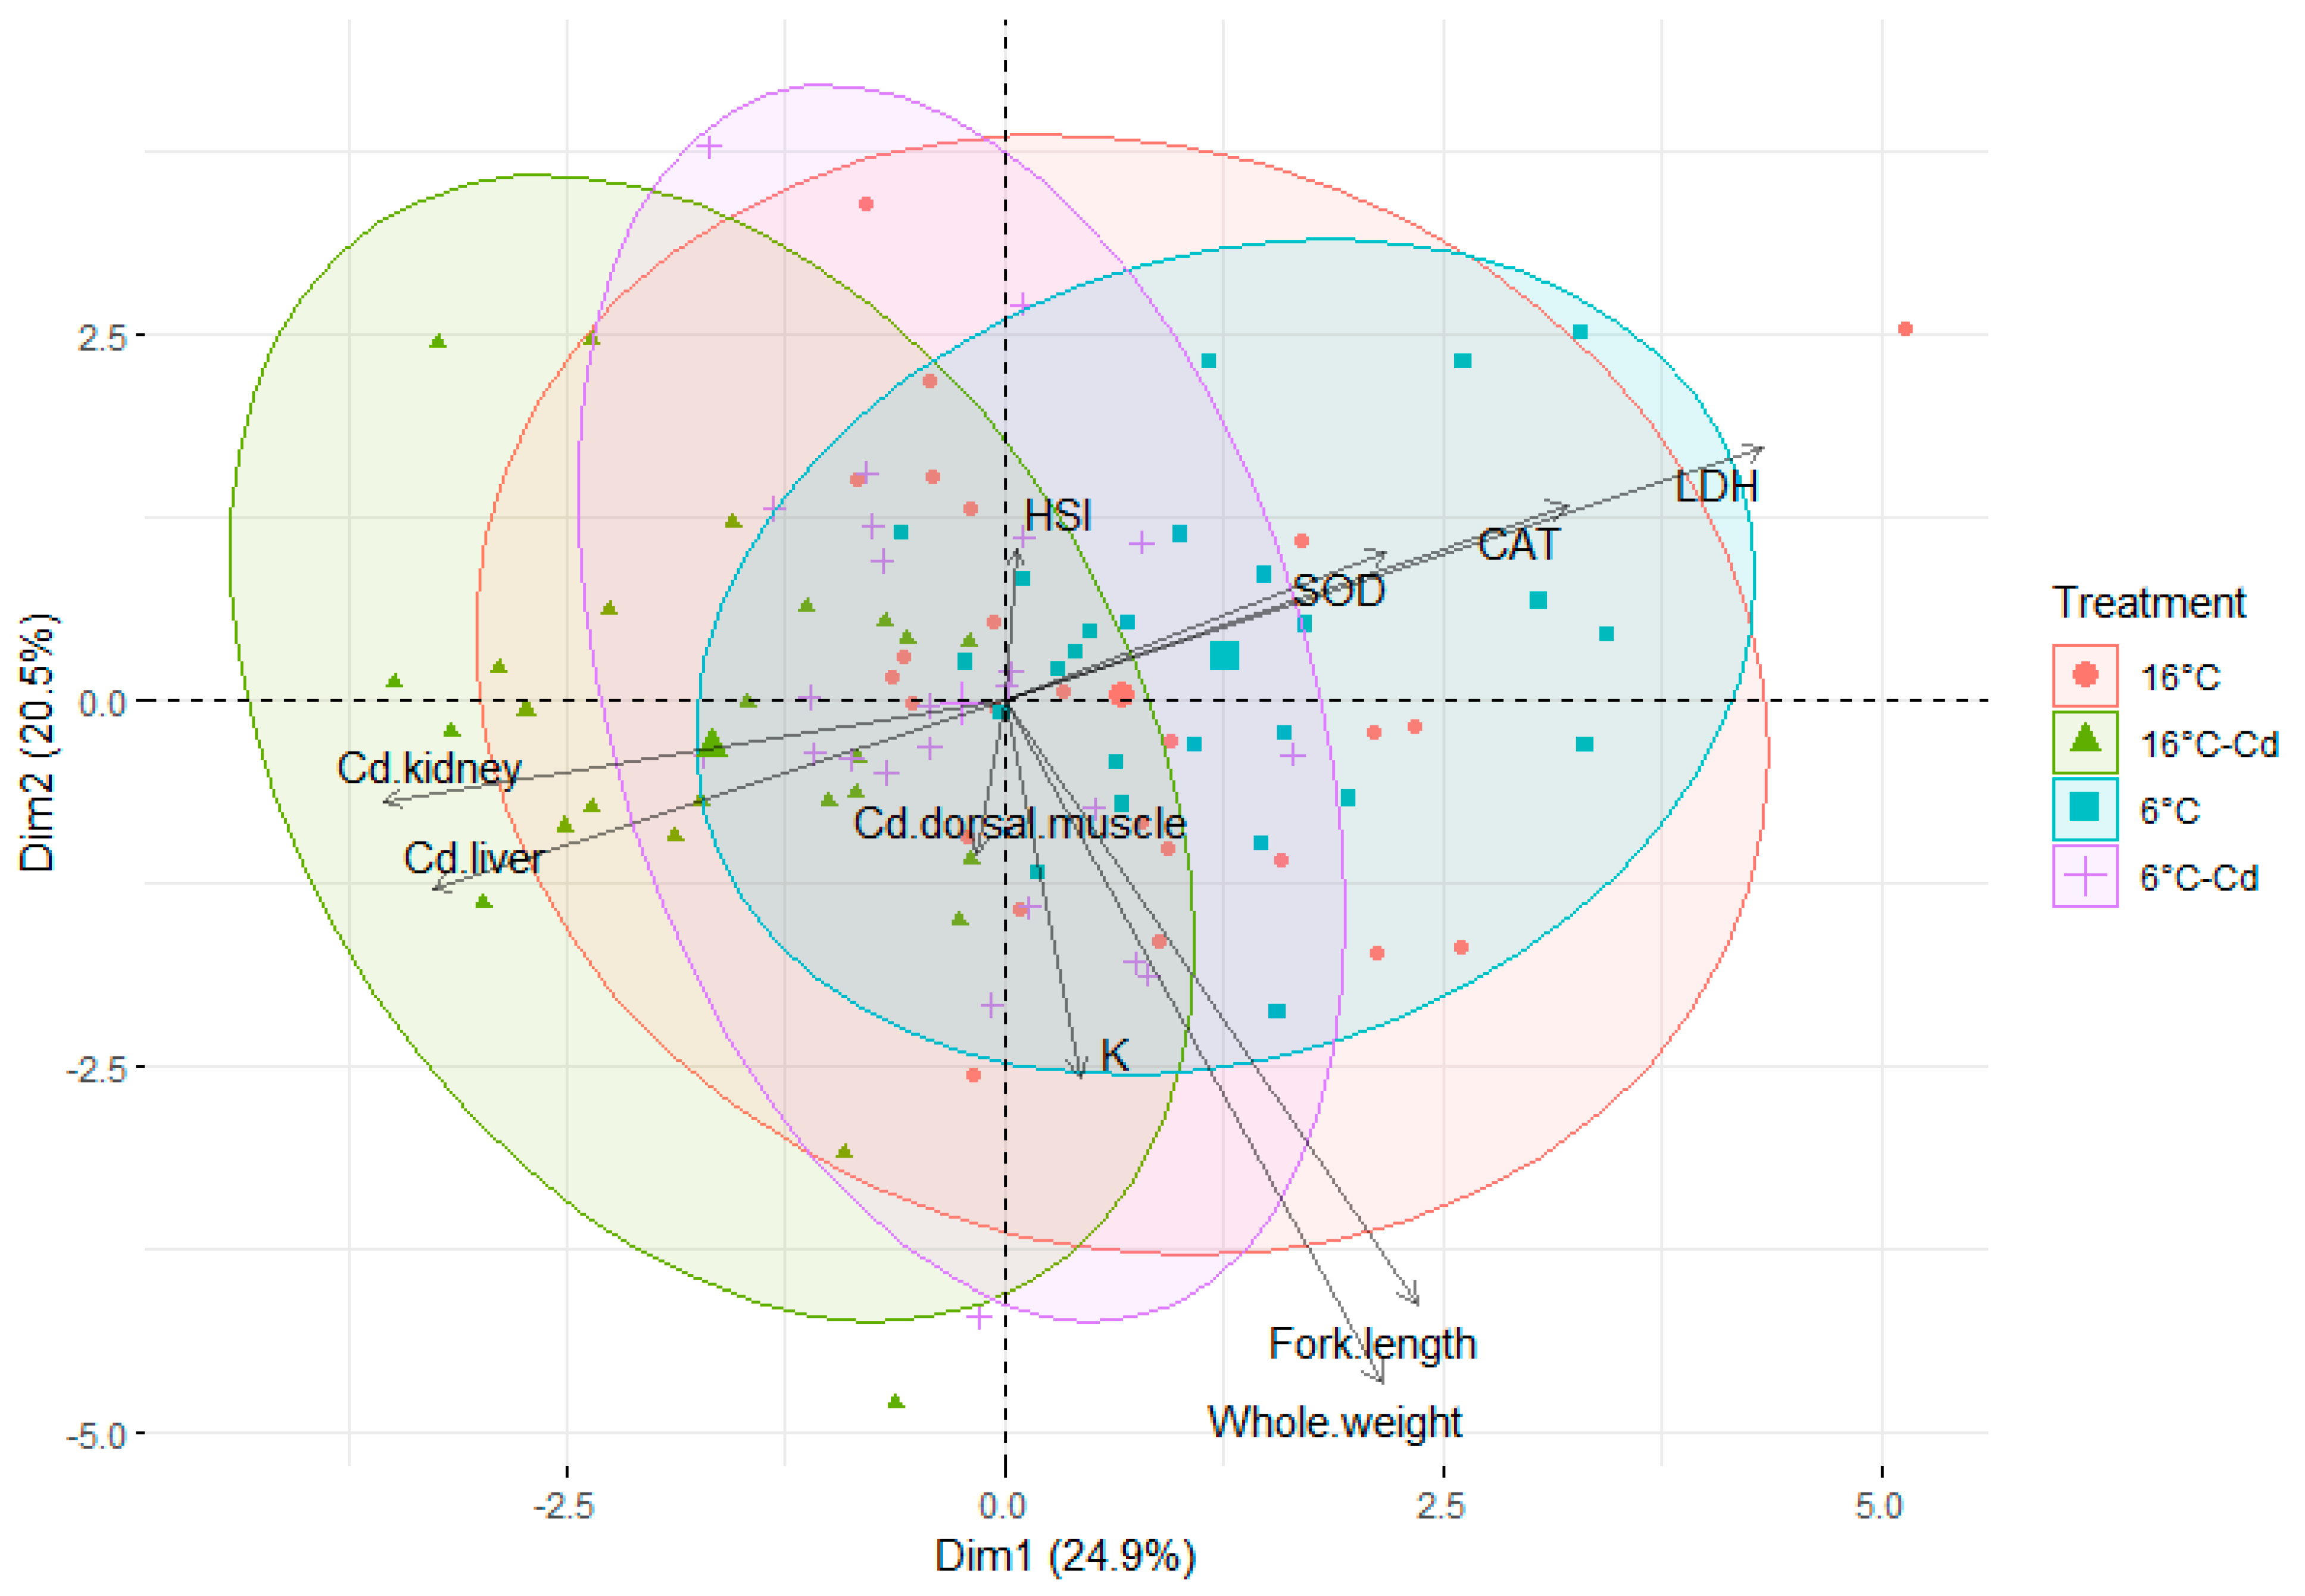
3.4. Principal Component Analysis

The Spearman correlations and PCA performed to assess the relationships between liver Cd concentrations and SOD, CAT, and LDH are presented in Table 4 and Figure 3, respectively. The computed PCA resulted in two principal components explaining 45.4% of the total variability observed. The first dimension (Dim1) explained 24.9% of the overall variance and it also permitted the discrimination between Cd treatments (on the left side) and controls (6 °C and 16 °C) on the right side. Tissue Cd concentrations correlated negatively with Dim1, while biometric variables (fork length, whole weight, as well as K and HSI values) and biomarkers of enzymatic activity (SOD, CAT, and LDH) exhibited a positive correlation with this dimension. The second principal component (Dim2) explained 20.5% of the total variability for the examined variables. Indicators of fish size (fork length, whole weight, and K values) along with tissue Cd concentrations were negatively correlated with Dim2, while HSI values, SOD, CAT, and LDH activities positively correlated with Dim2. The computed Spearman correlations for liver samples confirm the findings of the PCA. Indicators of growth with known biological redundancy (fork length, whole weight and K values) were highly positively correlated, along with liver and kidney Cd concentrations. Kidney Cd concentrations were also negatively correlated with fork length measurements, while CAT actively exhibited a positive correlation with HSI values. Liver and kidney Cd concentrations were significantly negatively correlated with LDH activity, while all enzymatic activity was positively correlated with the activity of the other enzymes assessed (positive correlations observed between SOD with both CAT and LDH activity, as well as positive correlations between CAT and LDH activity).

4. Discussion

4.1. Variation in Biometric Variables and Fish Condition Across Exposure Treatments

Contrary to what was anticipated, Cd appeared to have no effect on fork length and whole weight measurements, while thermal stress significantly drove measured variation of these parameters among the exposure treatments. This trend has been observed previously in studies evaluating the effects of thermal stress on juvenile rainbow trout (Oncorhynchus mykiss), damselfish (Abudefduf saxatilis) and blenny (Scartella cristata) [81,82]. Researchers proposed that after a certain temperature threshold, exposure to semi chronic thermal stress incurs a physiological debt [81], and when coupled with the present study’s outcomes, could suggest elevated temperatures, such as those anticipated with climate warming, will elicit somatic responses in fish that may culminate in smaller body sizes for Arctic charr given chronic exposure. Despite recorded reduced fork length and whole weight measurements in the thermal stress treatments (16 °C and 16 °C-Cd), no changes to K values were observed across experimental conditions. However, this pattern of diminished body size, but maintained somatic condition has been seen in other thermal stress research [83], which authors attributed to energy allocation trade-offs between growth and other energic expenses during physiological responses to thermal stress [84,85].
Unlike fish condition, HSI values varied significantly between exposure treatments with fish exposed to similar temperature conditions (16 °C and 16 °C-Cd) exhibiting similar mean HSI values. The influence of Cd was also observed. with both thermal stress and Cd exposure having previously documented significant negative associations with HSI values in fish [7,34,47]. Though exhibiting temporal variability in response to Cd, HSI typically demonstrates a reduction following sublethal Cd exposure [27,86,87,88]. This has been attributed to the depletion of hepatic energetic reserves [87,88] and hepatocellular injury culminating in cellular necrosis [27]. The latter has been suggested for the Spiny chromis (Acanthochromis polyacanthus) [89], where researchers reported a positive correlation between HSI values and an accompanying upregulation of genes related with inflammation, apoptosis, and tumor suppression [89]. Therefore, this parameter may also indicate potential cellular and chemical changes reflective of stressor-induced liver damage [90,91]. This can have further significant negative repercussions for overall fish health and ultimately survival, with results from our study suggesting that warming water temperatures and anthropogenic contaminant sources pose a risk to Arctic charr health.

4.2. Variation in Cd Uptake in Dorsal Muscle, Liver, and Kidney Tissues and Relationships with Biometric Variables

The results for tissue Cd concentrations obtained from this research appear similar to the limited available ecotoxicological research detailing Cd concentrations in Arctic charr [92,93]. Dorsal muscle Cd concentrations were higher in Arctic charr held in the 16 °C and 16 °C-Cd treatments than those observed in both the 6 °C and 6 °C-Cd treatments, despite only background water Cd concentrations measured in Cd controls. Despite lower Cd concentrations observed in dorsal muscle compared to Arctic charr liver and kidney samples, this uptake pattern was not seen in the latter two tissues, which may signify a tissue specific pattern. Cadmium uptake has also been linked with summer water temperatures and associated increases in metabolic rates in other Arctic charr field studies [93,94], as well as with other fish species [95]. Köck, Triendl and Hofer [94] attributed this to exposure time, uptake dynamics [96,97,98], and ambiguity associated with the relative importance of various Cd depuration channels [99,100,101,102,103]. Given previous associations between temperature and Cd concentrations, the results from this study suggest a risk for Cd uptake in dorsal muscle even at low background environmental concentrations at elevated temperatures in Arctic charr, with thermal stress potentially more effective at increasing dorsal muscle Cd uptake compared to environmental Cd exposure at low temperatures.
With this increased uptake comes the corresponding concern that climate change may elicit consumption risks for Cd in Arctic charr even in locations with no notable sources of Cd contamination. Currently, limited consumption guidelines for Cd in fish tissues exist, but the Food and Agricultural Organization of the United Nations (FAO) recommends a limit of 0.05 mg·kg−1 of total Cd in edible fishery products, though this limit does increase to 0.1 mg·kg−1 with certain species. As nine dorsal muscle samples, all from the high temperature treatments (16 °C and 16 °C-Cd), exhibited Cd concentrations that surpassed the FAO guideline of 0.05 mg·kg−1 after only 8 weeks of Cd exposure, warming water temperatures and Cd may pose a significant threat to this important food resource. However, further research is necessary to evaluate the chronic effects of thermal stress on Cd uptake in dorsal muscle under varying gradients of contamination in the field, as well as the specific implications of prolonged Cd exposure through fish consumption on human health.
Cadmium uptake in liver and kidney tissues was greatest in Cd-exposed fish, with the highest mean Cd concentrations measured in the combined stressor treatment (16 °C-Cd) for both tissues. Other experiments evaluating the interaction of elemental exposure and thermal stress have seen similar trends [34,50], which have been attributed to increased metabolic and respiratory rates at higher temperatures [104]. This has significant implications in the context of climate change as elevated Cd burden in fish has been linked to negative consequences for fish health [27,28], which have subsequent ramifications for overall population health and survival. It is evident that further research is necessary to clarify the mechanisms by which thermal stress facilitates trace metal uptake to gain a broader understanding of the implications of elevated water temperatures on elemental uptake in this species, among others.
The most consistent relationships observed between tissue Cd concentrations and biometric variables were observed in the 6 °C treatment. Liver and kidney Cd concentrations all significantly declined with increasing fork length, whole weight, K and HSI values. In the absence of thermal stress with minimal environmental contamination (6 °C treatment), the decreasing concentration of Cd with increasing body size could be attributed to fish metabolism as rates of uptake and loss of Cd have been demonstrated to vary with metabolic rate in the Stone loach (Noemacheilus barbatulus) [105]. This trend has also been observed with other elements (As, Cd, Cs, Hg, Pb, Se, and Zn) [106,107]. Significant relationships between biological variables and Cd concentrations were also observed in the 6 °C-Cd treatment, but they were less numerous and consistent than those observed in the control treatment for this temperature. The addition of Cd at 6 °C prompted increases in kidney and liver Cd concentrations with fork length and whole weight, which have been observed previously with fish in response to trace metal accumulation [94,108], while declines in HSI values with increasing Cd uptake also remain consistent with previous research [72,109].
Minimal relationships were observed between biometric variables and Cd concentrations in both high temperature treatments (16 °C and 16 °C-Cd). Douben [105] demonstrated that rates of uptake and loss of Cd varied with metabolic rate in the Stone loach and with temperatures exceeding 16 °C; the researchers suggested that thermal stress disrupts normal depuration processes. As Arctic charr is considered one of the least resistant salmonid species to high temperatures [110,111], results obtained from this study suggest that thermal stress may be sufficient to disturb metabolic functioning and depuration processes in this species, prompting the minimal and inconsistent relationships observed here. Furthermore, the lack of consistent single variable relationships between Cd concentrations and fish biometric measurements in the higher temperature treatments (16 °C and 16 °C-Cd treatments) suggests that these variables are not the best descriptors of elemental concentrations when fish are subjected to thermal stress even in the case of Cd exposure. However, further research is necessary to elucidate the mechanisms by which thermal stress modifies relationships between Cd uptake and whole system health biomarkers from those that are observed at optimal temperatures.
While initial linear regression analyses identified few significant associations, the GLMs revealed that temperature, Cd, and their interaction mediated several biometric endpoints, though the significance and nature of these effects varied across tissues and biometric parameters. In dorsal muscle, both Cd and the Cd–temperature interaction significantly contributed to observed variations in fork length and whole weight, reinforcing reported links in previous Arctic charr field studies between temperature and Cd concentrations in this tissue [93,94]. The results from these models also suggest potential impacts on growth and size in Arctic charr populations near Cd contaminant sources, under warming climate scenarios. With liver Cd concentrations, all biometric variables except K exhibited significant associations with temperature, which emphasizes the importance of thermal conditions in shaping indicators of whole system physiological responses to Cd exposure. Kidney Cd models also revealed significant effects across all biometric variables. However, a post hoc evaluation of parameter estimates indicated that only temperature was significantly associated with HSI in this model. Collectively, these results emphasize the need for incorporating temperature as a critical factor in future ecotoxicological assessments, especially for cold-adapted species like Arctic charr, that may be disproportionately affected by the combined pressures of climate change and contaminant exposure in northern ecosystems.

4.3. Variation in SOD, CAT, and LDH Activity, as Well as Relationships with Biometric Variables and Tissue Cd Concentrations

Activities of SOD, CAT, and LDH enzymes exhibited significant variation across exposure conditions. While declines in SOD activity in response to Cd exposure have been seen in other studies [68,112], in our study, significant reductions in SOD activity were only observed in the 6 °C-Cd treatment. Statistically similar SOD activity recorded at 6 °C, 16 °C-Cd, and 16 °C-Cd could suggest thermal inactivation of antioxidant responses to stressors is occurring as temperatures reach species-specific critical thermal maximums (CTMax). As CTMax represents the physiological limit of acute thermal tolerance in fish, antioxidant activity disruption may appear as extreme temperatures promote protein denaturation and degradation, which inactivates and damages the associated enzymes [113,114]. Temperature-dependent effects on enzyme activity have been demonstrated in the pathogenic nematode Meloidogyne arenaria and the sponge Suberites domuncula. In vitro incubations of M. arenaria revealed that superoxide dismutase (SOD) activity exhibited rapid denaturation above the maximal habitat temperature (18–20 °C), with activity losses of 40% at 25 °C and 70% at 30 °C [115]. Similarly, Bachinski, et al. [116] documented in S. domuncula that warming from 21 °C to 31 °C induced heat shock protein 70 (HSP70) and concurrently caused a 40% decrease in glutathione S-transferase activity within 5 min, followed by a 50% reduction in glutathione concentration within 15 min. This hypothesis could also assist with the interpretation of CAT results, since at low temperatures Cd did not appear to be sufficient to elicit a response in CAT activity, but declines in CAT activity were seen in both high temperature treatments (16 °C and 16 °C-Cd treatments), which is consistent with previous research [34,117]. Overall, results from this study highlight the potential risks of warming water temperatures on Arctic charr antioxidant capacities and suggest negative implications for fish health and survival.
Contrary to initial expectations, LDH activity was significantly reduced in Cd exposed fish (6 °C-Cd and 16 °C-Cd treatments), with the performed PCA also revealing negative associations between LDH activity and Cd concentrations in both liver and kidney. As LDH is a key enzyme in the glycolytic pathway that functions under oxygen-limited conditions [118], these results suggest that Cd exposure at the concentrations applied in this research may have negative implications for Arctic charr anaerobic metabolism. Diminished capacity for anaerobic metabolism in these fish could infer adverse consequences for essential behaviours in fish, such as swimming, predator avoidance, and foraging abilities [3,4,119]. The addition of thermal stress to Cd exposure further reduced liver LDH activity in Arctic charr and may serve to highlight the threat of warming water temperatures on Arctic charr metabolic performance in locations proximate to sources of Cd contamination. Finally, significant relationships between activities of all enzymes and biometric variables, as well as tissue Cd concentrations were minimal in linear regression models. This suggests that regulation of enzyme activity is generally responsive to the presence of stressors as opposed to the magnitude of elemental tissue deposition, while indicators of whole system health may not be reflective of changes to antioxidant and anaerobic responses.
However, the results of the GLMs demonstrated that enzymatic activity in Arctic charr was significantly associated with liver Cd concentrations and modulated by temperature. Liver Cd concentrations were a significant predictor of enzyme activity for SOD, CAT, and LDH while temperature also emerged as a consistent driver of activity across models for SOD and CAT. However, as the Cd–temperature interaction term was not significant, this indicates that the effects of liver Cd and temperature were generally additive, and that temperature may influence enzyme activity independently of Cd burden. These results suggest that climate warming may modify physiological responses to metal exposure by altering enzymatic regulation and contaminant dynamics. The temperature-dependent relationships observed highlight the potential for compounded stress in cold-adapted species, again reinforcing the essentiality of incorporating climate change associated variables into ecotoxicological assessments to more accurately predict the impacts of contaminant exposure in a warming Arctic.

5. Conclusions

This research demonstrated the negative influence of elevated temperature on tissue Cd burden in Arctic charr, but also on indicators of fish health and metabolic performance. Thermal stress significantly increased liver and kidney Cd concentrations in comparison to Cd exposure at simulated current Arctic water temperatures, while even at low background environmental concentrations, temperature appears sufficient to promote Cd uptake in dorsal muscle tissues. As Arctic charr are a culturally and economically important species for Northern Indigenous people and are an essential component of subsistence fisheries throughout the circumpolar globe, this could pose significant risks for people consuming large quantities of fish even if no significant sources of Cd contamination are evident. Thermal stress also appeared to inhibit proper functioning of antioxidant responses and limit anaerobic metabolism, which could have significant harmful implications for fish health and behaviours essential for survival. To inform future management decisions, additional research is necessary to clarify the mechanisms through which thermal stress facilitates trace metal uptake and modifies antioxidant and anaerobic metabolism responses in fish and specifically Arctic charr. Furthermore, additional research examining the combined influences of thermal stress and contamination from other trace elements and their effects on other enzymatic and genetic biomarkers of fish health and function is required to assist in clarifying the potential influential magnitude these combined stressors may have on this culturally and economically important species.

Author Contributions

Conceptualization, M.A.C.M. and P.C.; Methodology, M.A.C.M., C.G. and P.C.; Validation, M.A.C.M., C.G. and P.C.; Formal analysis, M.A.C.M.; Investigation, M.A.C.M. and C.G.; Resources, M.A.C.M., C.G. and P.C.; Data curation, M.A.C.M.; Writing—original draft, M.A.C.M.; Writing—review & editing, C.G. and P.C.; Visualization, M.A.C.M.; Supervision, P.C.; Project administration, M.A.C.M. and P.C.; Funding acquisition, P.C. All authors have read and agreed to the published version of the manuscript.

Funding

Environment and Climate Change Canada: Environmental damages fund; Natural Sciences and Engineering Research Council: Patrice Couture.

Data Availability Statement

The raw data supporting the conclusions of this article will be made available by the authors on request.

Acknowledgments

We wish to thank Environment and Climate Change Canada—Environmental Damages Fund and the Natural Sciences and Engineering Research Council (discovery grant awarded to P. Couture) for financial support. Additionally, we wish to extend our gratitude to individuals at the Institut National de la Recherche Scientifique—Centre Eau Terre Environnement for help with laboratory analysis.

Conflicts of Interest

The authors declare no conflict of interest.

References

  1. Reist, J.D.; Wrona, F.J.; Prowse, T.D.; Power, M.; Dempson, J.B.; Beamish, R.J.; King, J.R.; Carmichael, T.J.; Sawatzky, C.D. General effects of climate change on Arctic fishes and fish populations. Ambio J. Hum. Environ. 2006, 35, 370–380. [Google Scholar] [CrossRef]
  2. Murdoch, A.; Power, M. The effect of lake morphometry on thermal habitat use and growth in Arctic charr populations: Implications for understanding climate-change impacts. Ecol. Freshw. Fish 2013, 22, 453–466. [Google Scholar] [CrossRef]
  3. Pimentel, M.S.; Faleiro, F.; Marques, T.; Bispo, R.; Dionísio, G.; Faria, A.M.; Machado, J.; Peck, M.A.; Pörtner, H.; Pousão-Ferreira, P. Foraging behaviour, swimming performance and malformations of early stages of commercially important fishes under ocean acidification and warming. Clim. Change 2016, 137, 495–509. [Google Scholar] [CrossRef]
  4. Anwar, S.B.; Cathcart, K.; Darakananda, K.; Gaing, A.N.; Shin, S.Y.; Vronay, X.; Wright, D.N.; Ellerby, D.J. The effects of steady swimming on fish escape performance. J. Comp. Physiol. A 2016, 202, 425–433. [Google Scholar] [CrossRef]
  5. Fenkes, M.; Shiels, H.A.; Fitzpatrick, J.L.; Nudds, R.L. The potential impacts of migratory difficulty, including warmer waters and altered flow conditions, on the reproductive success of salmonid fishes. Comp. Biochem. Physiol. Part A Mol. Integr. Physiol. 2016, 193, 11–21. [Google Scholar] [CrossRef]
  6. Pörtner, H.O.; Peck, M. Climate change effects on fishes and fisheries: Towards a cause-and-effect understanding. J. Fish Biol. 2010, 77, 1745–1779. [Google Scholar] [CrossRef]
  7. Grasset, J.; Ollivier, É.; Bougas, B.; Yannic, G.; Campbell, P.G.C.; Bernatchez, L.; Couture, P. Combined effects of temperature changes and metal contamination at different levels of biological organization in yellow perch. Aquat. Toxicol. 2016, 177, 324–332. [Google Scholar] [CrossRef]
  8. Aissia, E.; Blier, P.U.; Fadhlaoui, M.; Couture, P. Thermal modulation of mitochondrial function is affected by environmental nickel in rainbow trout (Oncorhynchus mykiss). Aquat. Toxicol. 2023, 257, 106451. [Google Scholar] [CrossRef]
  9. Couture, P.; Pyle, G. Live fast and die young: Metal effects on condition and physiology of wild yellow perch from along two metal contamination gradients. Hum. Ecol. Risk Assess. 2008, 14, 73–96. [Google Scholar] [CrossRef]
  10. Smith, R.W.; Blaney, S.C.; Dowling, K.; Sturm, A.; Jönsson, M.; Houlihan, D.F. Protein synthesis costs could account for the tissue-specific effects of sub-lethal copper on protein synthesis in rainbow trout (Oncorhynchus mykiss). Aquat. Toxicol. 2001, 53, 265–277. [Google Scholar] [CrossRef]
  11. Sherwood, G.D.; Rasmussen, J.B.; Rowan, D.J.; Brodeur, J.; Hontela, A. Bioenergetic costs of heavy metal exposure in yellow perch (Perca flavescens): In situ estimates with a radiotracer (137Cs) technique. Can. J. Fish. Aquat. Sci. 2000, 57, 441–450. [Google Scholar] [CrossRef]
  12. Laflamme, J.-S.; Couillard, Y.; Campbell, P.G.; Hontela, A. Interrenal metallothionein and cortisol secretion in relation to Cd, Cu, and Zn exposure in yellow perch, Perca flavescens, from Abitibi lakes. Can. J. Fish. Aquat. Sci. 2000, 57, 1692–1700. [Google Scholar] [CrossRef]
  13. Ikemoto, T.; Tu, N.P.; Okuda, N.; Iwata, A.; Omori, K.; Tanabe, S.; Tuyen, B.C.; Takeuchi, I. Biomagnification of trace elements in the aquatic food web in the Mekong Delta, South Vietnam using stable carbon and nitrogen isotope analysis. Arch. Environ. Con. Tox. 2008, 54, 504–515. [Google Scholar] [CrossRef] [PubMed]
  14. Zhao, L.Q.; Yang, F.; Yan, X.W. Biomagnification of trace elements in a benthic food web: The case study of Deer Island (Northern Yellow Sea). Chem. Ecol. 2013, 29, 197–207. [Google Scholar] [CrossRef]
  15. Blanchet, C.; Rochette, L. Nutrition and food consumption among the Inuit of Nunavik. Nunavik Inuit health survey 2004, Qanuippitaa? How are we? 2550526325; Institut national de santé publique du Québec (INSPQ) & Nunavik Regional Board of Health and Social Services (NRBHSS): Québec, QC, Canada, 2008. [Google Scholar]
  16. Huet, C.; Rosol, R.; Egeland, G.M. The prevalence of food insecurity is high and the diet quality poor in Inuit communities. J. Nutr. 2012, 142, 541–547. [Google Scholar] [CrossRef]
  17. Mergler, D.; Anderson, H.A.; Chan, L.H.M.; Mahaffey, K.R.; Murray, M.; Sakamoto, M.; Stern, A.H. Methylmercury exposure and health effects in humans: A worldwide concern. Ambio J. Hum. Environ. 2007, 36, 3–11. [Google Scholar] [CrossRef]
  18. Smith, A.H.; Steinmaus, C.M. Health effects of arsenic and chromium in drinking water: Recent human findings. Annu. Rev. Public Health 2009, 30, 107–122. [Google Scholar] [CrossRef]
  19. de Oliveira Ribeiro, C.A.; Belger, L.; Pelletier, E.; Rouleau, C. Histopathological evidence of inorganic mercury and methyl mercury toxicity in the arctic charr (Salvelinus alpinus). Environ. Res. 2002, 90, 217–225. [Google Scholar] [CrossRef]
  20. de Oliveira Ribeiro, C.A.; Rouleau, C.; Pelletier, E.; Audet, C.; Tjälve, H. Distribution kinetics of dietary methylmercury in the arctic charr (Salvelinus alpinus). Environ. Sci. Technol. 1999, 33, 902–907. [Google Scholar] [CrossRef]
  21. Nordberg, G.; Fowler, B.; Nordberg, M.; Friberg, L. Cadmium. In Handblook on the Toxicology of Metals, 3rd ed.; Academic Press: Cambridge, MA, USA, 2014; pp. 446–486. [Google Scholar]
  22. Li, C.; Wang, H.; Liao, X.; Xiao, R.; Liu, K.; Bai, J.; Li, B.; He, Q. Heavy metal pollution in coastal wetlands: A systematic review of studies globally over the past three decades. J. Hazard. Mater. 2022, 424, 127312. [Google Scholar] [CrossRef]
  23. Bharagava, R.N.; Saxena, G.; Mulla, S. Bioremediation of Industrial Waste for Environmental Safety; Springer: Berlin/Heidelberg, Germany, 2020; Volume 1. [Google Scholar]
  24. Cesar Minga, J.; Elorza, F.J.; Rodriguez, R.; Iglesias, A.; Esenarro, D. Assessment of water resources pollution associated with mining activities in the Parac subbasin of the Rimac River. Water 2023, 15, 965. [Google Scholar] [CrossRef]
  25. Kwong, R.W.M.; Andrés, J.A.; Niyogi, S. Molecular evidence and physiological characterization of iron absorption in isolated enterocytes of rainbow trout (Oncorhynchus mykiss): Implications for dietary cadmium and lead absorption. Aquat. Toxicol. 2010, 99, 343–350. [Google Scholar] [CrossRef] [PubMed]
  26. Sloman, K.A.; Scott, G.R.; Diao, Z.; Rouleau, C.; Wood, C.M.; McDonald, D.G. Cadmium affects the social behaviour of rainbow trout, Oncorhynchus mykiss. Aquat. Toxicol. 2003, 65, 171–185. [Google Scholar] [CrossRef]
  27. Messaoudi, I.; Barhoumi, S.; Saïd, K.; Kerken, A. Study on the sensitivity to cadmium of marine fish Salaria basilisca (Pisces: Blennidae). J. Environ. Sci. 2009, 21, 1620–1624. [Google Scholar] [CrossRef]
  28. Zheng, J.-L.; Yuan, S.-S.; Wu, C.-W.; Li, W.-Y. Chronic waterborne zinc and cadmium exposures induced different responses towards oxidative stress in the liver of zebrafish. Aquat. Toxicol. 2016, 177, 261–268. [Google Scholar] [CrossRef]
  29. Croteau, M.N.; Luoma, S.N.; Stewart, A.R. Trophic transfer of metals along freshwater food webs: Evidence of cadmium biomagnification in nature. Limnol. Oceanogr. 2005, 50, 1511–1519. [Google Scholar] [CrossRef]
  30. Zhang, H.; Reynolds, M. Cadmium exposure in living organisms: A short review. Sci. Total Environ. 2019, 678, 761–767. [Google Scholar] [CrossRef]
  31. Lipmann, M. Human Exposures and Their Health Effects, 2nd ed.; Wiley Intersciences: Hoboken, NJ, USA, 2000. [Google Scholar]
  32. Nordberg, G.F. Historical perspectives on cadmium toxicology. Toxicol. Appl. Pharmacol. 2009, 238, 192–200. [Google Scholar] [CrossRef]
  33. Defo, M.A.; Bernatchez, L.; Campbell, P.G.; Couture, P. Waterborne cadmium and nickel impact oxidative stress responses and retinoid metabolism in yellow perch. Aquat. Toxicol. 2014, 154, 207–220. [Google Scholar] [CrossRef]
  34. Fadhlaoui, M.; Couture, P. Combined effects of temperature and metal exposure on the fatty acid composition of cell membranes, antioxidant enzyme activities and lipid peroxidation in yellow perch (Perca flavescens). Aquat. Toxicol. 2016, 180, 45–55. [Google Scholar] [CrossRef]
  35. Wepener, V.; Van Vuren, J.; Chatiza, F.; Mbizi, Z.; Slabbert, L.; Masola, B. Active biomonitoring in freshwater environments: Early warning signals from biomarkers in assessing biological effects of diffuse sources of pollutants. Phys. Chem. Earth 2005, 30, 751–761. [Google Scholar] [CrossRef]
  36. Van der Oost, R.; Beyer, J.; Vermeulen, N.P. Fish bioaccumulation and biomarkers in environmental risk assessment: A review. Environ. Toxicol. Pharmacol. 2003, 13, 57–149. [Google Scholar] [CrossRef] [PubMed]
  37. Fridovich, I. Superoxide dismutases. An adaptation to a paramagnetic gas. J. Biol. Chem. 1989, 264, 7761–7764. [Google Scholar] [CrossRef] [PubMed]
  38. Deisseroth, A.; Dounce, A.L. Catalase: Physical and chemical properties, mechanism of catalysis, and physiological role. Physiol. Rev. 1970, 50, 319–375. [Google Scholar] [CrossRef]
  39. Audet, D.; Couture, P. Seasonal variations in tissue metabolic capacities of yellow perch (Perca flavescens) from clean and metal-contaminated environments. Can. J. Fish. Aquat. Sci. 2003, 60, 269–278. [Google Scholar] [CrossRef]
  40. Garnier, C.; Blier, P.U.; Couture, P. Evaluation of the combined effects of manganese and thermal stress on the metabolic capacities of Arctic charr (Salvelinus alpinus). Ecotoxicol. Environ. Saf. 2025, 292, 117895. [Google Scholar] [CrossRef]
  41. Liu, X.J.; Luo, Z.; Xiong, B.X.; Liu, X.; Zhao, Y.H.; Hu, G.F.; Lv, G.J. Effect of waterborne copper exposure on growth, hepatic enzymatic activities and histology in Synechogobius hasta. Ecotoxicol. Environ. Saf. 2010, 73, 1286–1291. [Google Scholar] [CrossRef]
  42. Carvalho, C.d.S.; Fernandes, M.N. Effect of copper on liver key enzymes of anaerobic glucose metabolism from freshwater tropical fish Prochilodus lineatus. Comp. Biochem. Physiol. Part A Mol. Integr. Physiol. 2008, 151, 437–442. [Google Scholar] [CrossRef]
  43. Swanson, H.K.; Kidd, K.A. Mercury concentrations in Arctic food fishes reflect the presence of anadromous Arctic charr (Salvelinus alpinus), species, and life history. Environ Sci Technol 2010, 44, 3286–3292. [Google Scholar] [CrossRef]
  44. Maes, G.; Raeymaekers, J.; Pampoulie, C.; Seynaeve, A.; Goemans, G.; Belpaire, C.; Volckaert, F. The catadromous European eel Anguilla anguilla (L.) as a model for freshwater evolutionary ecotoxicology: Relationship between heavy metal bioaccumulation, condition and genetic variability. Aquat. Toxicol. 2005, 73, 99–114. [Google Scholar] [CrossRef]
  45. Eastwood, S.; Couture, P. Seasonal variations in condition and liver metal concentrations of yellow perch (Perca flavescens) from a metal-contaminated environment. Aquat Toxicol 2002, 58, 43–56. [Google Scholar] [CrossRef] [PubMed]
  46. Kim, J.-H.; Kang, J.-C. The lead accumulation and hematological findings in juvenile rock fish Sebastes schlegelii exposed to the dietary lead (II) concentrations. Ecotoxicol. Environ. Saf. 2015, 115, 33–39. [Google Scholar] [CrossRef] [PubMed]
  47. Zheng, J.-L.; Luo, Z.; Chen, Q.-L.; Liu, X.; Liu, C.-X.; Zhao, Y.-H.; Gong, Y. Effect of waterborne zinc exposure on metal accumulation, enzymatic activities and histology of Synechogobius hasta. Ecotoxicol. Environ. Saf. 2011, 74, 1864–1873. [Google Scholar] [CrossRef]
  48. Gagnon, A.; Jumarie, C.; Hontela, A. Effects of Cu on plasma cortisol and cortisol secretion by adrenocortical cells of rainbow trout (Oncorhynchus mykiss). Aquat. Toxicol. 2006, 78, 59–65. [Google Scholar] [CrossRef]
  49. Heath, A.G. Water Pollution and Fish Physiology; CRC press: Boca Raton, FL, USA, 1995. [Google Scholar]
  50. Fadhlaoui, M.; Pierron, F.; Couture, P. Temperature and metal exposure affect membrane fatty acid composition and transcription of desaturases and elongases in fathead minnow muscle and brain. Ecotoxicol. Environ. Saf. 2018, 148, 632–643. [Google Scholar] [CrossRef]
  51. Larsson, S. Thermal preference of Arctic charr, Salvelinus alpinus, and brown trout, Salmo trutta—Implications for their niche segregation. Environ. Biol. Fishes 2005, 73, 89–96. [Google Scholar] [CrossRef]
  52. Larsson, S.; Berglund, I. Growth and food consumption of 0+ Arctic charr fed pelleted or natural food at six different temperatures. J. Fish Biol. 1998, 52, 230–242. [Google Scholar] [CrossRef]
  53. Rikardsen, A.H.; Diserud, O.H.; Elliott, J.M.; Dempson, J.B.; Sturlaugsson, J.; Jensen, A.J. The marine temperature and depth preferences of Arctic charr (Salvelinus alpinus) and sea trout (Salmo trutta), as recorded by data storage tags. Fish. Oceanogr. 2007, 16, 436–447. [Google Scholar] [CrossRef]
  54. Larsson, S.; Berglund, I. The effect of temperature on the energetic growth efficiency of Arctic charr (Salvelinus alpinus L.) from four Swedish populations. J. Therm. Biol. 2005, 30, 29–36. [Google Scholar] [CrossRef]
  55. Hansen, A.K.; Byriel, D.B.; Jensen, M.R.; Steffensen, J.F.; Svendsen, M.B.S. Optimum temperature of a northern population of Arctic charr (Salvelinus alpinus) using heart rate Arrhenius breakpoint analysis. Polar Biol. 2017, 40, 1063–1070. [Google Scholar] [CrossRef]
  56. Harris, L.N.; Yurkowski, D.J.; Gilbert, M.J.; Else, B.G.; Duke, P.J.; Ahmed, M.M.; Tallman, R.F.; Fisk, A.T.; Moore, J. Depth and temperature preference of anadromous Arctic char Salvelinus alpinus in the Kitikmeot Sea, a shallow and low-salinity area of the Canadian Arctic. Mar. Ecol. Prog. Ser. 2020, 634, 175–197. [Google Scholar] [CrossRef]
  57. Devaux, A.; Fiat, L.; Gillet, C.; Bony, S. Reproduction impairment following paternal genotoxin exposure in brown trout (Salmo trutta) and Arctic charr (Salvelinus alpinus). Aquat. Toxicol. 2011, 101, 405–411. [Google Scholar] [CrossRef] [PubMed]
  58. Quinn, N.L.; McGowan, C.R.; Cooper, G.A.; Koop, B.F.; Davidson, W.S. Identification of genes associated with heat tolerance in Arctic charr exposed to acute thermal stress. Physiol. Genom. 2011, 43, 685–696. [Google Scholar] [CrossRef]
  59. Crawford, A.; Stroeve, J.; Smith, A.; Jahn, A. Arctic open-water periods are projected to lengthen dramatically by 2100. Commun. Earth Environ. 2021, 2, 109. [Google Scholar] [CrossRef]
  60. Han, J.-S.; Park, H.-S.; Chung, E.-S. Projections of central Arctic summer sea surface temperatures in CMIP6. Environ. Res. Lett. 2023, 18, 124047. [Google Scholar] [CrossRef]
  61. Beuvard, C.; Imsland, A.K.; Thorarensen, H. The effect of temperature on growth performance and aerobic metabolic scope in Arctic charr, Salvelinus alpinus (L.). J. Therm. Biol. 2022, 104, 103117. [Google Scholar] [CrossRef]
  62. Stephenson, M.; Mackie, G. Total cadmium concentrations in the water and littoral sediments of central Ontario lakes. Water Air Soil Pollut. 1988, 38, 121–136. [Google Scholar] [CrossRef]
  63. Couture, P.; Busby, P.; Gauthier, C.; Rajotte, J.W.; Pyle, G.G. Seasonal and regional variations of metal contamination and condition indicators in yellow perch (Perca flavescens) along two polymetallic gradients. I. Factors influencing tissue metal concentrations. Hum. Ecol. Risk Assess. 2008, 14, 97–125. [Google Scholar] [CrossRef]
  64. Loon, J.C.V.; Beamish, R.J. Heavy-Metal Contamination by Atmospheric Fallout of Several Flin Flon Area Lakes and the Relation to Fish Populations. J. Fish. Res. Board Can. 1977, 34, 899–906. [Google Scholar] [CrossRef]
  65. Cao, L.; Huang, W.; Liu, J.; Yin, X.; Dou, S. Accumulation and oxidative stress biomarkers in Japanese flounder larvae and juveniles under chronic cadmium exposure. Comp. Biochem. Physiol. C 2010, 151, 386–392. [Google Scholar] [CrossRef]
  66. Hollis, L.; McGeer, J.C.; McDonald, D.G.; Wood, C.M. Cadmium accumulation, gill Cd binding, acclimation, and physiological effects during long term sublethal Cd exposure in rainbow trout. Aquat. Toxicol. 1999, 46, 101–119. [Google Scholar] [CrossRef]
  67. Xie, D.; Li, Y.; Liu, Z.; Chen, Q. Inhibitory effect of cadmium exposure on digestive activity, antioxidant capacity and immune defense in the intestine of yellow catfish (Pelteobagrus fulvidraco). Comp. Biochem. Physiol. C 2019, 222, 65–73. [Google Scholar] [CrossRef] [PubMed]
  68. Lu, K.; Qiao, R.; An, H.; Zhang, Y. Influence of microplastics on the accumulation and chronic toxic effects of cadmium in zebrafish (Danio rerio). Chemosphere 2018, 202, 514–520. [Google Scholar] [CrossRef] [PubMed]
  69. Driessnack, M.K.; Jamwal, A.; Niyogi, S. Effects of chronic waterborne cadmium and zinc interactions on tissue-specific metal accumulation and reproduction in fathead minnow (Pimephales promelas). Ecotoxicol. Environ. Saf. 2017, 140, 65–75. [Google Scholar] [CrossRef]
  70. Ricker, W.E. Computation and interpretation of biological statistics of fish populations. Bull. Fish. Res. Board Can. 1975, 191, 154–155. [Google Scholar]
  71. Laurén, D.J.; Wails, D. Liver structural alterations accompanying chronic toxicity in fishes: Potential biomarkers of exposure. In Biomarkers of Environmental Contamination; CRC Press: Boca Raton, FL, USA, 2018; pp. 17–57. [Google Scholar]
  72. Larose, C.; Canuel, R.; Lucotte, M.; Di Giulio, R.T. Toxicological effects of methylmercury on walleye (Sander vitreus) and perch (Perca flavescens) from lakes of the boreal forest. Comp. Biochem. Physiol. C 2008, 147, 139–149. [Google Scholar] [CrossRef]
  73. Bradford, M.M. A rapid and sensitive method for the quantitation of microgram quantities of protein utilizing the principle of protein-dye binding. Anal. Biochem. 1976, 72, 248–254. [Google Scholar] [CrossRef]
  74. Lowry, O.H.; Rosebrough, N.J.; Farr, A.L.; Randall, R.J. Protein measurement with the Folin phenol reagent. J. Biol. Chem. 1951, 193, 265–275. [Google Scholar] [CrossRef]
  75. Lapointe, D.; Pierron, F.; Couture, P. Individual and combined effects of heat stress and aqueous or dietary copper exposure in fathead minnows (Pimephales promelas). Aquat. Toxicol. 2011, 104, 80–85. [Google Scholar] [CrossRef]
  76. Gauthier, C.; Campbell, P.G.C.; Couture, P. Physiological correlates of growth and condition in the yellow perch (Perca flavescens). Comp. Biochem. Physiol. Part A Mol. Integr. Physiol. 2008, 151, 526–532. [Google Scholar] [CrossRef]
  77. Shapiro, S.S.; Wilk, M.B. An analysis of variance test for normality (complete samples). Biometrika 1965, 52, 591–611. [Google Scholar] [CrossRef]
  78. Zar, J.H. Biostatistical Analysis, 5th ed.; Prentice Hall, Inc.: Upper Saddle River, NJ, USA, 2007. [Google Scholar]
  79. Quinn, G.P.; Keough, M.J. Experimental design and data analysis for biologists; Cambridge University Press: London, UK, 2002. [Google Scholar]
  80. McCullagh, P. Generalized Linear Models; Routledge: London, UK, 2019. [Google Scholar]
  81. Kammerer, B.D.; Heppell, S.A. The effects of semichronic thermal stress on physiological indicators in steelhead. Trans. Am. Fish. Soc. 2013, 142, 1299–1307. [Google Scholar] [CrossRef]
  82. Madeira, D.; Narciso, L.; Cabral, H.N.; Vinagre, C.; Diniz, M.S. Influence of temperature in thermal and oxidative stress responses in estuarine fish. Comp. Biochem. Physiol. Part A Mol. Integr. Physiol. 2013, 166, 237–243. [Google Scholar] [CrossRef] [PubMed]
  83. Madeira, C.; Mendonça, V.; Leal, M.C.; Flores, A.A.V.; Cabral, H.N.; Diniz, M.S.; Vinagre, C. Thermal stress, thermal safety margins and acclimation capacity in tropical shallow waters—An experimental approach testing multiple end-points in two common fish. Ecol. Indic. 2017, 81, 146–158. [Google Scholar] [CrossRef]
  84. Angilletta, M.J.; Wilson, R.S.; Navas, C.A.; James, R.S. Tradeoffs and the evolution of thermal reaction norms. Trends Ecol. Evol. 2003, 18, 234–240. [Google Scholar] [CrossRef]
  85. Donelson, J.M.; Munday, P.L.; McCormick, M.I.; Nilsson, G.E. Acclimation to predicted ocean warming through developmental plasticity in a tropical reef fish. Glob. Change Biol. 2011, 17, 1712–1719. [Google Scholar] [CrossRef]
  86. Drąg-Kozak, E.; Pawlica-Gosiewska, D.; Gawlik, K.; Socha, M.; Gosiewski, G.; Łuszczek-Trojnar, E.; Solnica, B.; Popek, W. Cadmium-induced oxidative stress in Prussian carp (Carassius gibelio Bloch) hepatopancreas: Ameliorating effect of melatonin. Environ. Sci. Pollut. Res. 2019, 26, 12264–12279. [Google Scholar] [CrossRef]
  87. Kwong, R.W.M.; Andrés, J.A.; Niyogi, S. Effects of dietary cadmium exposure on tissue-specific cadmium accumulation, iron status and expression of iron-handling and stress-inducible genes in rainbow trout: Influence of elevated dietary iron. Aquat. Toxicol. 2011, 102, 1–9. [Google Scholar] [CrossRef]
  88. Çiftçi, N.; Ay, Ö.; Karayakar, F.; Cicik, B.; Erdem, C. Effects of zinc and cadmium on condition factor, hepatosomatic and gonadosomatic index of Oreochromis niloticus. Fresenius Environ. Bull. 2015, 24, 1–4. [Google Scholar]
  89. Bernal, M.A.; Donelson, J.M.; Veilleux, H.D.; Ryu, T.; Munday, P.L.; Ravasi, T. Phenotypic and molecular consequences of stepwise temperature increase across generations in a coral reef fish. Mol. Ecol. 2018, 27, 4516–4528. [Google Scholar] [CrossRef]
  90. Mohapatra, S.; Kumar, R.; Sundaray, J.K.; Patnaik, S.T.; Mishra, C.; Rather, M.A. Structural damage in liver, gonads, and reduction in spawning performance and alteration in the haematological parameter of Anabas testudineus by glyphosate-a herbicide. Aquac. Res. 2021, 52, 1150–1159. [Google Scholar] [CrossRef]
  91. Rossi, A.; Bacchetta, C.; Cazenave, J. Effect of thermal stress on metabolic and oxidative stress biomarkers of Hoplosternum littorale (Teleostei, Callichthyidae). Ecol. Indic. 2017, 79, 361–370. [Google Scholar] [CrossRef]
  92. Dallinger, R.; Egg, M.; Kock, G.; Hofer, R. The role of metallothionein in cadmium accumulation of Arctic char (Salvelinus alpinus) from high alpine lakes. Aquat. Toxicol. 1997, 38, 47–66. [Google Scholar] [CrossRef]
  93. Martyniuk, M.A.C.; Couture, P.; Tran, L.; Beaupré, L.; Urien, N.; Power, M. A seasonal comparison of trace metal concentrations in the tissues of Arctic charr (Salvelinus alpinus) in Northern Québec, Canada. Ecotoxicology 2020, 29, 1327–1346. [Google Scholar] [CrossRef]
  94. Köck, G.; Triendl, M.; Hofer, R. Seasonal patterns of metal accumulation in Arctic char (Salvelinus alpinus) from an oligotrophic Alpine lake related to temperature. Can. J. Fish. Aquat. Sci. 1996, 53, 780–786. [Google Scholar] [CrossRef]
  95. Douben, P.E. A mathematical model for cadmium in the stone loach (Noemacheilus barbatulus L.) from the River Ecclesbourne, Derbyshire. Ecotoxicol. Environ. Saf. 1990, 19, 160–183. [Google Scholar] [CrossRef]
  96. Olsson, P.-E.; Haux, C.; Förlin, L. Variations in hepatic metallothionen, zinc and copper levels during an annual reproductive cycle in rainbow trout, Salmo gairdneri. Fish Physiol. Biochem. 1987, 3, 39–47. [Google Scholar] [CrossRef]
  97. Overnell, J.; McIntosh, R.; Fletcher, T. The levels of liver metallothionein and zinc in plaice, Pleuronectes platessa L., during the breeding season, and the effect of oestradiol injection. J. Fish Biol. 1987, 30, 539–546. [Google Scholar] [CrossRef]
  98. Povlsen, A.F.; Korsgaard, B.; Bjerregaard, P. The effect of cadmium on vitellogenin metabolism in estradiol-induced flounder(Platichthys flesus(L.)) males and females. Aquat. Toxicol. 1990, 17, 253–262. [Google Scholar] [CrossRef]
  99. Giles, M.A. Accumulation of cadmium by rainbow trout, Salmo gairdneri, during extended exposure. Can. J. Fish. Aquat. Sci. 1988, 45, 1045–1053. [Google Scholar] [CrossRef]
  100. Harrison, S.; Klaverkamp, J. Uptake, elimination and tissue distribution of dietary and aqueous cadmium by rainbow trout (Salmo gairdneri Richardson) and lake whitefish (Coregonus clupeaformis Mitchill). Environ. Toxicol. Chem. Int. J. 1989, 8, 87–97. [Google Scholar] [CrossRef]
  101. Glynn, A.W.; Andersson, L.; Gabring, S.; Runn, P. Cadmium turnover in minnows, Phoxinus phoxinus, fed 109Cd-labeled Daphnia magna. Chemosphere 1992, 24, 359–368. [Google Scholar] [CrossRef]
  102. Varanasi, U.; Markey, D. Uptake and release of lead and cadmium in skin and mucus of Coho salmon (Oncorhynchus kisutch). Comp. Biochem. Physiol. C 1978, 60, 187–191. [Google Scholar] [CrossRef]
  103. Oronsaye, J. The uptake and loss of dissolved cadmium by the stickleback, Gasterosteus aculeatus L. Ecotoxicol. Environ. Saf. 1987, 14, 88–96. [Google Scholar] [CrossRef]
  104. Black, M.C.; Millsap, D.S.; McCarthy, J.F. Effects of acute temperature change on respiration and toxicant uptake by rainbow trout, Salmo gairdneri (Richardson). Physiol. Zool. 1991, 64, 145–168. [Google Scholar] [CrossRef]
  105. Douben, P.E.T. Metabolic rate and uptake and loss of cadmium from food by the fish Noemacheilus barbatulus L. (stone loach). Environ. Pollut. 1989, 59, 177–202. [Google Scholar] [CrossRef]
  106. Zhang, L.; Wang, W.-X. Waterborne cadmium and zinc uptake in a euryhaline teleost Acanthopagrus schlegeli acclimated to different salinities. Aquat Toxicol 2007, 84, 173–181. [Google Scholar] [CrossRef]
  107. Ward, D.M.; Nislow, K.H.; Chen, C.Y.; Folt, C.L. Reduced trace element concentrations in fast-growing juvenile Atlantic salmon in natural streams. Environ. Sci. Technol. 2010, 44, 3245–3251. [Google Scholar] [CrossRef]
  108. Yi, Y.-J.; Zhang, S.-H. Heavy metal (Cd, Cr, Cu, Hg, Pb, Zn) concentrations in seven fish species in relation to fish size and location along the Yangtze River. Environ. Sci. Pollut. Res. 2012, 19, 3989–3996. [Google Scholar] [CrossRef]
  109. Ramos-Osuna, M.; Patiño-Mejía, C.; Ruelas-Inzunza, J.; Escobar-Sánchez, O. Bioaccumulation of mercury in Haemulopsis elongatus and Pomadasys macracanthus from the SE Gulf of California: Condition indexes and health risk assessment. Environ. Monit. Assess. 2020, 192, 704. [Google Scholar] [CrossRef]
  110. Baroudy, E.; Elliott, J. The critical thermal limits for juvenile Arctic charr Salvelinus alpinus. J. Fish Biol. 1994, 45, 1041–1053. [Google Scholar] [CrossRef]
  111. Thyrel, M.; Berglund, I.; Larsson, S.; Näslund, I. Upper thermal limits for feeding and growth of 0+ Arctic charr. J. Fish Biol. 1999, 55, 199–210. [Google Scholar] [CrossRef]
  112. Wen, B.; Jin, S.-R.; Chen, Z.-Z.; Gao, J.-Z.; Liu, Y.-N.; Liu, J.-H.; Feng, X.-S. Single and combined effects of microplastics and cadmium on the cadmium accumulation, antioxidant defence and innate immunity of the discus fish (Symphysodon aequifasciatus). Environ. Pollut. 2018, 243, 462–471. [Google Scholar] [CrossRef]
  113. Kregel, K.C. Invited review: Heat shock proteins: Modifying factors in physiological stress responses and acquired thermotolerance. J. Appl. Physiol. 2002, 92, 2177–2186. [Google Scholar] [CrossRef]
  114. Abele, D.; Puntarulo, S. Formation of reactive species and induction of antioxidant defence systems in polar and temperate marine invertebrates and fish. Comp. Biochem. Physiol. Part A Mol. Integr. Physiol. 2004, 138, 405–415. [Google Scholar] [CrossRef]
  115. Abele, D. Toxic oxygen: The radical life-giver. Nature 2002, 420, 27. [Google Scholar] [CrossRef]
  116. Bachinski, N.; Koziol, C.; Batel, R.; Labura, Z.; Schröder, H.C.; Müller, W.E. Immediate early response of the marine sponge Suberites domuncula to heat stress: Reduction of trehalose and glutathione concentrations and glutathione S-transferase activity. J. Exp. Mar. Biol. Ecol. 1997, 210, 129–141. [Google Scholar] [CrossRef]
  117. Lushchak, V.I.; Bagnyukova, T.V. Temperature increase results in oxidative stress in goldfish tissues. 2. Antioxidant and associated enzymes. Comp. Biochem. Physiol. C 2006, 143, 36–41. [Google Scholar] [CrossRef]
  118. Härtig, E.; Jahn, D. Regulation of the Anaerobic Metabolism in Bacillus subtilis. In Advances in Microbial Physiology, Poole, R.K., Ed.; Academic Press: Cambridge, MA, USA, 2012; Volume 61, pp. 195–216. [Google Scholar]
  119. Castro-Santos, T. Optimal swim speeds for traversing velocity barriers: An analysis of volitional high-speed swimming behavior of migratory fishes. J. Exp. Biol. 2005, 208, 421–432. [Google Scholar] [CrossRef]
Figure 1. Means ± standard error of Cd concentrations (µg·kg−1 dry weight) in dorsal muscle (top), liver (middle), and kidney (bottom) from Arctic charr (n = 410) for each treatment after 8 weeks. Different letters indicate significant differences among treatments.
Environments 12 00176 g001
Figure 2. Means ± standard error for enzyme activities of log10SOD (top), log10CAT (middle), and log10LDH (bottom) biomarkers in the livers of Arctic charr (n = 100) from each treatment after 8 weeks. Different letters indicate significant differences among treatments (p < 0.05).
Environments 12 00176 g002
Figure 3. Principal component analysis (PCA) of Cd concentrations in dorsal muscle, liver, and kidney tissues, biometric variables (fork length, whole weight, fish somatic condition (K), and HSI) and enzymatic biomarkers (SOD, CAT, and LDH) in the liver of juvenile Arctic charr (n = 100) from the different exposure treatments. Each point indicates an individual fish and ellipses represent individuals from the same exposure treatment.
Environments 12 00176 g003
Table 1. Means ± standard deviations and ranges (minimum; maximum) for fork length (mm), total weight (g), somatic condition (K), and hepatosomatic index (HSI) of Arctic charr for each treatment. Sample sizes (n) are indicated in brackets. Different letters indicate significant differences among treatments with bolded values identifying significant models and significant effects of independent variables for the two-way ANOVA.
Exposure TreatmentTwo-Way ANOVA
6 °C
(101)
6 °C-Cd
(105)
16 °C
(99)
16 °C-Cd
(105)
ModelTemperatureCdInteraction
Fork length165 ± 12 a
126;197
162 ± 13 a
117;191
159 ± 12 b
128;190
157 ± 11 b
125;192
F(3,409)   = 9.158
p  < 0.0001
<0.00010.06420.6521
Whole weight40.6 ± 9.8 a
19.0;78.0
38.3 ± 10.0 ab
12.0;71.0
35.5 ± 9.1 b
15.0;64.0
35.2 ± 7.8 b
16.0;65.0
F(3,409)  = 7.600
p  < 0.0001
<0.00010.16400.2866
K0.90 ± 0.07 a
0.69;1.08
0.88 ± 0.79 a
0.63;1.13
0.87 ± 0.09 a
0.67;1.09
0.90 ± 0.08 a
0.73;1.13
F(2,407) = 0.6009
p = 0.5488
0.73140.2993-
HSI1.16 ± 0.22 a
0.55;2.00
1.22 ± 0.22 a
0.69;1.96
0.98 ± 0.16 c
0.44;1.38
1.04 ± 0.18 b
0.64;1.66
F(3,409)   = 31.75
p   < 0.0001
<0.00010.00160.8906
Table 2. Linear regressions between dorsal muscle, liver, and kidney Cd concentrations (µg·kg−1 dry weight) and biometric variables (fork length, total weight, somatic condition (K), and hepatosomatic index (HSI)) from the four exposure treatments combined (n = 410). Positive significant relationships are bolded and negative significant relationships are bolded and underlined (p < 0.05). Bolded values also identify significant models and significant effects of independent variables for the generalized linear models (GLMs).
Dorsal Muscle Cd
Linear Regressions GLMs
6 °C6 °C-Cd16 °C16 °C-CdModelTemperatureCdInteraction
Fork lengthr2(1,93) = 0.011
p = 0.2937
r2(1,102) = 0.051
p = 0.0218
r2(1,94) = 0.000
p = 0.4927
r2(1,103) = 0.011
p = 0.2750
X2(4,397)= 32.79
p  < 0.0001
0.05430.00250.0028
Whole weightr2(1,93) = 0.020
p = 0.1690
r2(1,102 = 0.027
p = 0.0975
r2(1,94) = 0.001
p = 0.7898
r2(1,103) = 0.016
p = 0.1930
X2(4,397)= 27.14
p   < 0.0001
0.06820.00490.0057
Kr2(1,93) = 0.009
p = 0.3516
r2(1,102) = 0.001
p = 0.7348
r2(1,94) = 0.000
p = 0.8559
r2(1,103) = 0.016
p = 0.1930
X2(4,397) = 1.972
p = 0.7409
0.22660.2528-
HSIr2(1,93) = 0.009
p = 0.3721
r2(1,102) = 0.032
p = 0.0697
r2(1,94) = 0.000
p = 0.1881
r2(1,103) = 0.001
p = 0.7364
X2(4,397)= 77.06
p  < 0.0001
0.00060.12070.0973
Liver Cd
Linear regressionsGLMs
6 °C6 °C-Cd16 °C16 °C-CdModelTemperatureCdInteraction
Fork lengthr2(1,98) = 0.113
p = 0.0006
r2(1,103) = 0.085
p   = 0.0025
r2(1,96) = 0.005
p = 0.4591
r2(1,101) = 0.006
p = 0.4503
X2(4,404)= 23.61
p  < 0.0001
<0.00010.77040.4906
Whole weightr2(1,98) = 0.139
p = 0.0001
r2(1,103) = 0.069
p= 0.0066
r2(1,96) = 0.013
p = 0.2673
r2(1,101) = 0.022
p = 0.1363
X2(4,404)= 19.07
p  < 0.0001
<0.00010.98920.9681
Kr2(1,98) = 0.073
p = 0.0066
r2(1,103) = 0.007
p = 0.4063
r2(1,96) = 0.013
p = 0.2649
r2(1,101) = 0.036
p = 0.0549
X2(4,404) = 7.573
p = 0.1085
0.96690.2252-
HSIr2(1,98) = 0.224
p < 0.0001
r2(1,103) = 0.056
p = 0.0151
r2(1,96) = 0.059
p = 0.0153
r2(1,101) = 0.000
p = 0.9893
X2(4,404)= 80.60
p  < 0.0001
<0.00010.23900.2036
Kidney Cd
Linear regressionsGLMs
6 °C6 °C-Cd16 °C16 °C-CdModelTemperatureCdInteraction
Fork lengthr2(1,97) = 0.219
p < 0.0001
r2(1,102) = 0.028
p = 0.0896
r2(1,97) = 0.000
p = 0.9144
r2(1,103) = 0.000
p = 0.9902
X2(4,404)= 25.17
p  < 0.0001
0.19580.3226-
Whole weightr2(1,97) = 0.293
p <0.0001
r2(1,102) = 0.044
p= 0.0320
r2(1,97) = 0.007
p = 0.4179
r2(1,103) = 0.004
p = 0.5620
X2(4,404)= 20.33
p  = 0.0004
0.26030.3157-
Kr2(1,97) = 0.130
p = 0.0002
r2(1,102) = 0.042
p  = 0.0379
r2(1,97) = 0.054
p = 0.0211
r2(1,103) = 0.044
p  = 0.0313
X2(4,404)= 10.67
p  = 0.0305
0.91810.9824-
HSIr2(1,97) = 0.081
p = 0.0043
r2(1,102) = 0.000
p = 0.9283
r2(1,97) = 0.086
p = 0.0033
r2(1,103) = 0.002
p = 0.6416
X2(4,404)= 83.91
p  < 0.0001
<0.00010.05500.3410
Table 3. Linear regressions between liver enzyme activities (SOD, CAT, and LDH) and biometric variables (fork length, total weight, somatic condition (K), and hepatosomatic index (HSI)), as well as Cd concentrations (µg·kg−1 dry weight) in dorsal muscle, liver, and kidney tissues (n = 100). Positive significant relationships are bolded and negative significant relationships are bolded and underlined (p < 0.05).
SOD
6 °C6 °C-Cd16 °C16 °C-Cd
Fork lengthr2(1,24) = 0.025
p = 0.4475
r2(1,24) = 0.022
p = 0.4832
r2(1,24) = 0.019
p = 0.5109
r2(1,24) = 0.050
p = 0.2832
Whole weightr2(1,24) = 0.068
p = 0.2089
r2(1,24) = 0.031
p = 0.3691
r2(1,24) = 0.050
p = 0.2837
r2(1,24) = 0.052
p = 0.2724
Kr2(1,24) = 0.030
p = 0.4077
r2(1,24) = 0.004
p = 0.7668
r2(1,24) = 0.036
p = 0.3618
r2(1,24) = 0.001
p = 0.9135
HSIr2(1,24) = 0.027
p = 0.4288
r2(1,24) = 0.017
p = 0.5395
r2(1,24) = 0.001
p = 0.5709
r2(1,24) = 0.111
p = 0.1032
Cd dorsal muscler2(1,24) = 0.000
p = 0.9209
r2(1,24) = 0.071
p = 0.1965
r2(1,23) = 0.050
p = 0.2843
r2(1,24) = 0.000
p = 0.9182
Cd liverr2(1,24) = 0.021
p = 0.4933
r2(1,23) = 0.012
p = 0.6089
r2(1,22) = 0.344
p = 0.0033
r2(1,24) = 0.129
p = 0.0788
Cd kidneyr2(1,24) = 0.007
p = 0.6845
r2(1,24) = 0.003
p = 0.7834
r2(1,24) = 0.079
p = 0.1722
r2(1,24) = 0.031
p = 0.4016
CAT
6 °C6 °C-Cd16 °C16 °C-Cd
Fork lengthr2(1,24) = 0.006
p = 0.7180
r2(1,24) = 0.010
p = 0.6351
r2(1,24) = 0.032
p = 0.3957
r2(1,24) = 0.034
p = 0.3776
Whole weightr2(1,24) = 0.002
p = 0.8427
r2(1,24) = 0.002
p = 0.8489
r2(1,24) = 0.078
p = 0.1772
r2(1,24) = 0.078
p = 0.1752
Kr2(1,24) = 0.001
p = 0.8595
r2(1,24) = 0.144
p = 0.0612
r2(1,24) = 0.079
p = 0.1791
r2(1,24) = 0.004
p = 0.7767
HSIr2(1,24) = 0.011
p = 0.6189
r2(1,24) = 0.053
p = 0.2574
r2(1,24) = 0.003
p = 0.7791
r2(1,24) = 0.044
p = 0.3128
Cd dorsal muscler2(1,24) = 0.033
p = 0.3866
r2(1,24) = 0.014
p = 0.5675
r2(1,24) = 0.028
p = 0.4213
r2(1,24) = 0.140
p = 0.0650
Cd liverr2(1,24) = 0.046
p = 0.3046
r2(1,23) = 0.156
p = 0.0537
r2(1,24) = 0.027
p = 0.4311
r2(1,24) = 0.058
p = 0.2450
Cd kidneyr2(1,24) = 0.081
p = 0.1684
r2(1,24) = 0.174
p = 0.0382
r2(1,24) = 0.080
p = 0.1720
r2(1,24) = 0.000
p = 0.9896
LDH
6 °C6 °C-Cd16 °C16 °C-Cd
Fork lengthr2(1,24) = 0.001
p = 0.6593
r2(1,24) = 0.001
p = 0.8613
r2(1,24) = 0.004
p = 0.7628
r2(1,24) = 0.018
p = 0.5180
Whole weightr2(1,24) = 0.000
p = 0.8288
r2(1,24) = 0.015
p = 0.5603
r2(1,24) = 0.020
p = 0.4980
r2(1,24) = 0.027
p = 0.4299
Kr2(1,24) = 0.000
p = 0.9241
r2(1,24) = 0.025
p = 0.4539
r2(1,24) = 0.024
p = 0.4629
r2(1,24) = 0.003
p = 0.7950
HSIr2(1,24) = 0.014
p = 0.5770
r2(1,24) = 0.161
p = 0.0469
r2(1,24) = 0.000
p = 0.9434
r2(1,24) = 0.001
p = 0.8729
Cd dorsal muscler2(1,24) = 0.059
p = 0.2398
r2(1,24) = 0.027
p = 0.4293
r2(1,23) = 0.000
p = 0.9629
r2(1,24) = 0.179
p = 0.0353
Cd liverr2(1,24) = 0.021
p = 0.4920
r2(1,23) = 0.152
p = 0.0601
r2(1,24) = 0.025
p = 0.4471
r2(1,24) = 0.000
p = 0.9223
Cd kidneyr2(1,24) = 0.030
p = 0.4098
r2(1,24) = 0.026
p = 0.4442
r2(1,24) = 0.044
p = 0.3130
r2(1,24) = 0.065
p = 0.2195
Table 4. Spearman correlations (rs) among Cd concentrations (µg·kg−1 dry weight), biometric variables (fork length (mm), total weight (g), somatic condition (K), and hepatosomatic index (HSI)), and enzymatic biomarkers (SOD, CAT, and LDH) in the liver of juvenile Arctic charr (n = 100) from each of the four treatments combined. Significant correlations (p < 0.05) are bolded.
Fork lengthWhole weightKHSIDorsal muscle CdLiver CdKidney CdSODCATLDH
Fork length1.0000
-
Whole weight0.9162
<0.0001
1.0000
-
K0.1142
0.2578
0.4613
<0.0001
1.0000
-
HSI−0.1047
0.3001
−0.0894
0.3763
0.0294
0.7713
1.0000
-
Dorsal muscle Cd0.0891
0.3781
0.0724
0.4742
−0.0261
0.7964
−0.1695
0.0919
1.0000
-
Liver Cd−0.0736
0.4667
−0.0029
0.9771
0.1344
0.1825
0.0313
0.7574
−0.0588
0.5609
1.0000
-
Kidney Cd0.2002
0.0458
−0.1303
0.1963
0.1294
0.1995
−0.0675
0.5045
−0.0605
0.5496
0.6848
<0.0001
1.0000
-
SOD−0.0396
0.6960
−0.0029
0.9772
0.1283
0.2034
−0.1456
0.1482
−0.0198
0.8451
−0.0635
0.5302
0.0377
0.7093
1.0000
-
CAT0.1099
0.2765
0.0612
0.5453
−0.0283
0.7795
0.2034
0.0423
−0.1924
0.0551
−0.1290
0.2007
−0.1615
0.1084
0.2543
0.0107
1.0000
-
LDH0.0651
0.5201
0.0463
0.6474
0.0186
0.8541
0.0058
0.9544
−0.0198
0.4636
0.4094
<0.0001
0.4365
< 0.0001
0.5535
<0.0001
0.6476
<0.0001
1.0000
-
Disclaimer/Publisher’s Note: The statements, opinions and data contained in all publications are solely those of the individual author(s) and contributor(s) and not of MDPI and/or the editor(s). MDPI and/or the editor(s) disclaim responsibility for any injury to people or property resulting from any ideas, methods, instructions or products referred to in the content.

