Article

Groundwater Quality in a Rural and Urbanized Region in Limpopo Province, South Africa

1
Department of Biochemistry, Microbiology and Biotechnology, University of Limpopo, Private Bag X1106, Sovenga 0727, South Africa
2
Aquaculture Research Unit, School of Agricultural and Environmental Sciences, Faculty of Science and Agriculture, University of Limpopo, Turfloop Campus, Private Bag X1106, Sovenga 0727, South Africa
*
Author to whom correspondence should be addressed.
Environments 2025, 12(6), 174; https://doi.org/10.3390/environments12060174
Submission received: 3 April 2025 / Revised: 15 May 2025 / Accepted: 19 May 2025 / Published: 23 May 2025
(This article belongs to the Special Issue Research Progress in Groundwater Contamination and Treatment)

Abstract

The Limpopo Province, situated in the northern part of South Africa, is mainly comprising rural areas that lack adequate facilities for drinking water. Boreholes are the main source of drinking water in rural and urbanized areas of Limpopo Province. Sixty-three water samples, from three locations in Limpopo Province, namely Mankweng, Dalmada, and Polokwane, plus two samples from a river in Magoebaskloof and still water as controls, were collected and subjected to analysis. The Sodium Absorption Ratio (SAR) analysis ranged from 1.4 to 35.6, revealing that 25% of the samples from Mankweng bear low quality with a high amount of sodium. Piper plot showed that two major water types exist in the samples, 33% and 67% of the water samples were of Na-Cl and Ca-Cl types, respectively. To identify the leading natural and anthropogenic processes causing variation in groundwater chemistry, principal component analysis (PCA) was used. The most detected heavy metal was V (vanadium) with 0.00 to 0.59 (mg/mL). The PCA results grouped all water samples from Dalmada together. However, the water samples from Mankweng were divided into three groups by PCA, with borehole samples showing a correlation with heavy metals. In conclusion, the study revealed that natural and anthropogenic activities cause groundwater variation in the Limpopo Province. All the boreholes sampled showed the presence of total coliform, but no E. coli was detected. In addition, regarding microbial contamination, water samples were suitable for drinking and irrigation purposes.

1. Introduction

The World Health Organization (WHO) [1] has highlighted a concerning issue regarding limited access to drinking water in the Sub-Saharan region. However, the lack of proper water quality management has resulted in several health problems and environmental issues. Water quality is a key factor in ensuring that it is suitable for meeting various needs, including human consumption. As pointed out by Jakeman et al. [2], it is just as important as the availability and quantity of water. The quality of groundwater can be influenced by various factors, including natural ones such as the type of rock, groundwater velocity, geochemical reactions, and soluble salts. Additionally, human activities such as agriculture and industrialization can also have an impact on the quality of water that is recharged into aquifers. This can be seen in the example of WHO [1], where human intervention has resulted in changes to the chemical and physical properties of the groundwater. In order to implement appropriate treatment methods, it is important to identify and understand the sources of pollution that may exist within the groundwater system. This knowledge is essential for effective groundwater management and ensuring its safe use [3]. To ensure that water is safe to drink and use for irrigation, it is necessary to analyze its physicochemical properties. This analysis provides crucial information about the interactions between water and water-bearing rocks, which can have a significant impact on the quality and availability of water. By understanding the mechanics and nature of these chemical reactions, we can develop effective strategies to protect and manage our water resources. This, in turn, can help ensure that everyone has access to clean and safe drinking water while also supporting sustainable agricultural practices [4]. Water quality plays a crucial role in determining the suitability of soil for crop cultivation and population centers [5]. Previous studies have demonstrated that human activity can lead to microbial contamination of groundwater [6,7].
In South Africa, the degradation of improved water sources often occurs due to insufficient operational procedures and inadequate maintenance practices. As a result, these issues lead to frequent system failures and subsequent contamination of the water supply [8]. The Limpopo Province serves as a quintessential example of a predominantly rural area and stands out as one of the poorest provinces in South Africa, characterized by its limited water resources. Nearly all of the available water sources within the province are currently fully exploited and allocated, leaving minimal room for further resource development. This is primarily due to the region’s arid climate, challenging topography, presence of sandy rivers, and constraints on increased groundwater [9]. In addition, in the Limpopo Province of South Africa, research studies have revealed concerning findings about the quality of borehole water used by local communities for drinking purposes. The studies detected contamination and identified risks associated with the presence of E. coli in this water source. These findings raise important concerns about the safety and suitability of the water supply for the affected communities [10].
In Limpopo Province, there are two main settlements, which include rural and urban areas. In both regions, the primary source of drinking water and irrigation is boreholes [9]. However, it is difficult to distinguish the source of any contamination. Additionally, both areas have the same underground geological plateau. The studies indicate that Limpopo Province, particularly the area around Polokwane, is characterized by supracrustal rocks. Beneath the surface, gneisses and granites from the Swazian to Randian age form the foundation of the region. The supracrustal rocks consist of various types, including schists, quartzite, magnetic quartzite, shale, metavolcanics, serpentinite, and metapyroxenite. Additionally, in the northern part of the region, highly deformed keels made up of marble, calc-silicate rocks, metaquartzite, metapelite, and amphibolite can be found within the gneisses [11]. Therefore, it is less likely that contamination is due to dissolution from the underground plateau. On the other hand, agriculture and mining activities could potentially be the source of contamination for the underground water system. Therefore, it is crucial to analyze the water systems in these areas and identify the sources of pollution using various approaches, such as multivariate analysis.
However, the few studies on groundwater quality in Southern Africa have been highly localized [4,8,9,10,12]. Studies on groundwater in South Africa showed that arsenic, lead, and chlorine were the chemicals most commonly detected [4]. In addition, through a tool development for using groundwater in the Vhembe district of Limpopo Province [8], results showed that the quantitative availability of drinking water was a problem due to poorly constructed boreholes. Another study conducted in Siloam Village, located in the Vhembe district of Limpopo Province, showed a negative impact of high fluoride on human health in the mentioned location [9]. The microbial analysis of the groundwater in the Vhembe district of Limpopo Province showed that remarkable levels of total coliforms, including fecal coliforms, fecal enterococci, Clostridium perfringens, and somatic coliphages, were detected for community and privately owned borehole water [10]. Additionally, water source information in South Africa is required to register the available data to the national Blue Drop System (BDS) of South Africa [12], which, due to the insufficient information, creates a challenge in monitoring the country’s water system.
A comprehensive assessment of global groundwater quality is crucial in light of the increasing threats posed by anthropogenic (human-made) and geogenic (naturally occurring) contaminants. This evaluation should encompass a thorough analysis of various pollutants, including heavy metals, agricultural runoff, and industrial chemicals, as well as naturally occurring substances like arsenic and fluoride. Understanding the extent and impact of these contaminants on groundwater sources is vital for safeguarding public health and ensuring the sustainability of freshwater resources [13].
Limpopo Province is characterized predominantly by its vast rural areas, with Mankweng being one of the major locations. This region is notable for its agricultural activities, which are essential to the local community’s livelihood. However, it is important to highlight that nearby urban areas, such as Dalmada, are facing significant challenges related to water quality. Dalmada, while more urbanized, grapples with pollution and contamination issues that affect the health and well-being of its residents. Addressing these water quality concerns is crucial for ensuring safe access to clean water for all inhabitants in both Mankweng and Dalmada. The water quality in South Africa has been the subject of numerous studies [4,8,9,10,12]; however, the specific regions of Mankweng and Dalmada have not been thoroughly examined. This gap in research presents a unique opportunity for the current study, which aims to assess and provide comprehensive insights into the water quality of these areas. Understanding the water quality in Mankweng and Dalmada is crucial, as it can offer valuable information that supports various applications, including agricultural practices, public health initiatives, and local economic development. By addressing this underexplored topic, the study seeks to contribute significantly to the existing body of knowledge and promote sustainable water management in these communities.
Therefore, the study aims to (1) identify the physicochemical linkages with groundwater resources in Limpopo Province, South Africa, and (2) investigate microbial contamination of the water samples from Limpopo Province.

2. Materials and Methods

2.1. Study Sites

Limpopo Province is located in the northern region of South Africa, and it has been divided into five districts, as shown in Figure S1. The study sites were in the Capricorn district, namely Mankweng, Dalmada, and Polokwane regions of the Limpopo Province, South Africa. Mankweng is a rural area, and Dalmada is an urbanized area close to Polokwane, the capital of Limpopo Province. Both sites relied on boreholes for drinking purposes. From March 2022 to December 2022, twenty-one water samples were randomly selected to capture the main dominant natural and anthropogenic factors of the underground water in Limpopo Province. The water samples were included (1) seven boreholes from Dalmada, (2) eleven boreholes from Mankweng in the Capricorn district, (3) one still water sample from Turfloop campus, which was prepared by water facilities of the University of Limpopo, South Africa) as a control, (4) one samples from a borehole in Polokwane, and (5) one sample from a river in Magoebaskloof mountains. The maps in Figure 1A,B were generated using open-source QGIS (http://www.qgis.org (accessed on 1 April 2023)). Water samples were collected from these boreholes and analyzed for physico-chemical parameters. For quality analysis, a sterilized plastic bottle was utilized, while sterilized glass sampling bottles were employed for bacterial analysis. The GPS coordinates of the samples were recorded and are listed in Figure 1 (Table S1). The water samples were collected in 1 L sample bottles and were transported to the laboratory on ice for analysis.

2.2. Physico-Chemical Analysis

Water samples were analyzed in the water analysis laboratory of the University of Limpopo. A volume of 100 mL of each water sample was passed through 0.45 μm pore size, 47 mm diameter sterile filter membranes. The membranes were placed on the appropriate substrate medium and incubated. The water samples were analyzed using standard APHA [14] methods. The metals were analyzed according to USEPA PhosVer 3, and the results were obtained in mg/L [15].
pH, electrical conductivity (measured in mS/cm), salinity (measured in ppt), and turbidity were measured on-site using a handheld multiparameter meter (Professional plus YSI 605000) and a WTW turbidity meter (Turb 430 IR; Xylem, Weilheim, Germany), respectively. Alkalinity as bicarbonate (measured in mg/L) and carbonate (measured in mg/L; Method 2320 B), potassium as K (measured in mg/L; Method 3120 B and EPA method 200.7) were analyzed [14]. Total nitrogen as N (measured in mg/L) was analyzed using spectroquant nitrogen test number 1.14537.0001, ammonia and ammonium (measured in mg/L; spectroquant ammonium-test 1.14752.0001/1.14752.0002/1.00683.0001 method), total phosphate as P (measured in mg/L; spectroquant test 1.14848.0001), and chemical oxygen demand (measured in mg/L; spectroquant test 1.14848.0001 and spectroquant 1.14541.0001 closed reflux method).
The level of hardness was measured using calcium and magnesium; Calmagite Colorimetric Method 8030 of DOC316.53.01043. Nitrate was measured using the Cadmium reduction method no. 8171 of DOC316.53.01069. Phosphate, ammonia, and copper were measured using USEPA PhosVer 3 as per the guidelines of HACH [15]. The results were reported in mg/L. The analysis of all samples was conducted using analytical reagent grade chemicals, and the same quality assurance/quality control procedures were applied to all samples.
For metal analysis, samples were filtered using a pre-washed 0.45 µm pore membrane filter to remove all solid materials before analysis. The trace metals were determined using an Inductively Coupled Plasma-Mass Spectrometer (ICP-MS: NexION 300D, Perkin Elmer, Waltham, MA, USA).
To assess water quality for irrigation, sodium adsorption ratio (SAR) [16] using Equation (1), soluble sodium percentage (SSP) [17] using Equation (2), Magnesium adsorption ratio (MAR) [18] using Equation (3), and Kelley’s ratio (KR) [19] using Equation (4), were measured. The equations for the ratios are indicated below:
SAR = N a + ( C a 2 + + M g 2 + ) / 2
SSP = N a + + K + N a + + K + + C a 2 + + M g 2 + × 100
MAR = M g 2 + C a 2 + + M g 2 + × 100
KR = N a + C a 2 + + M g 2 +

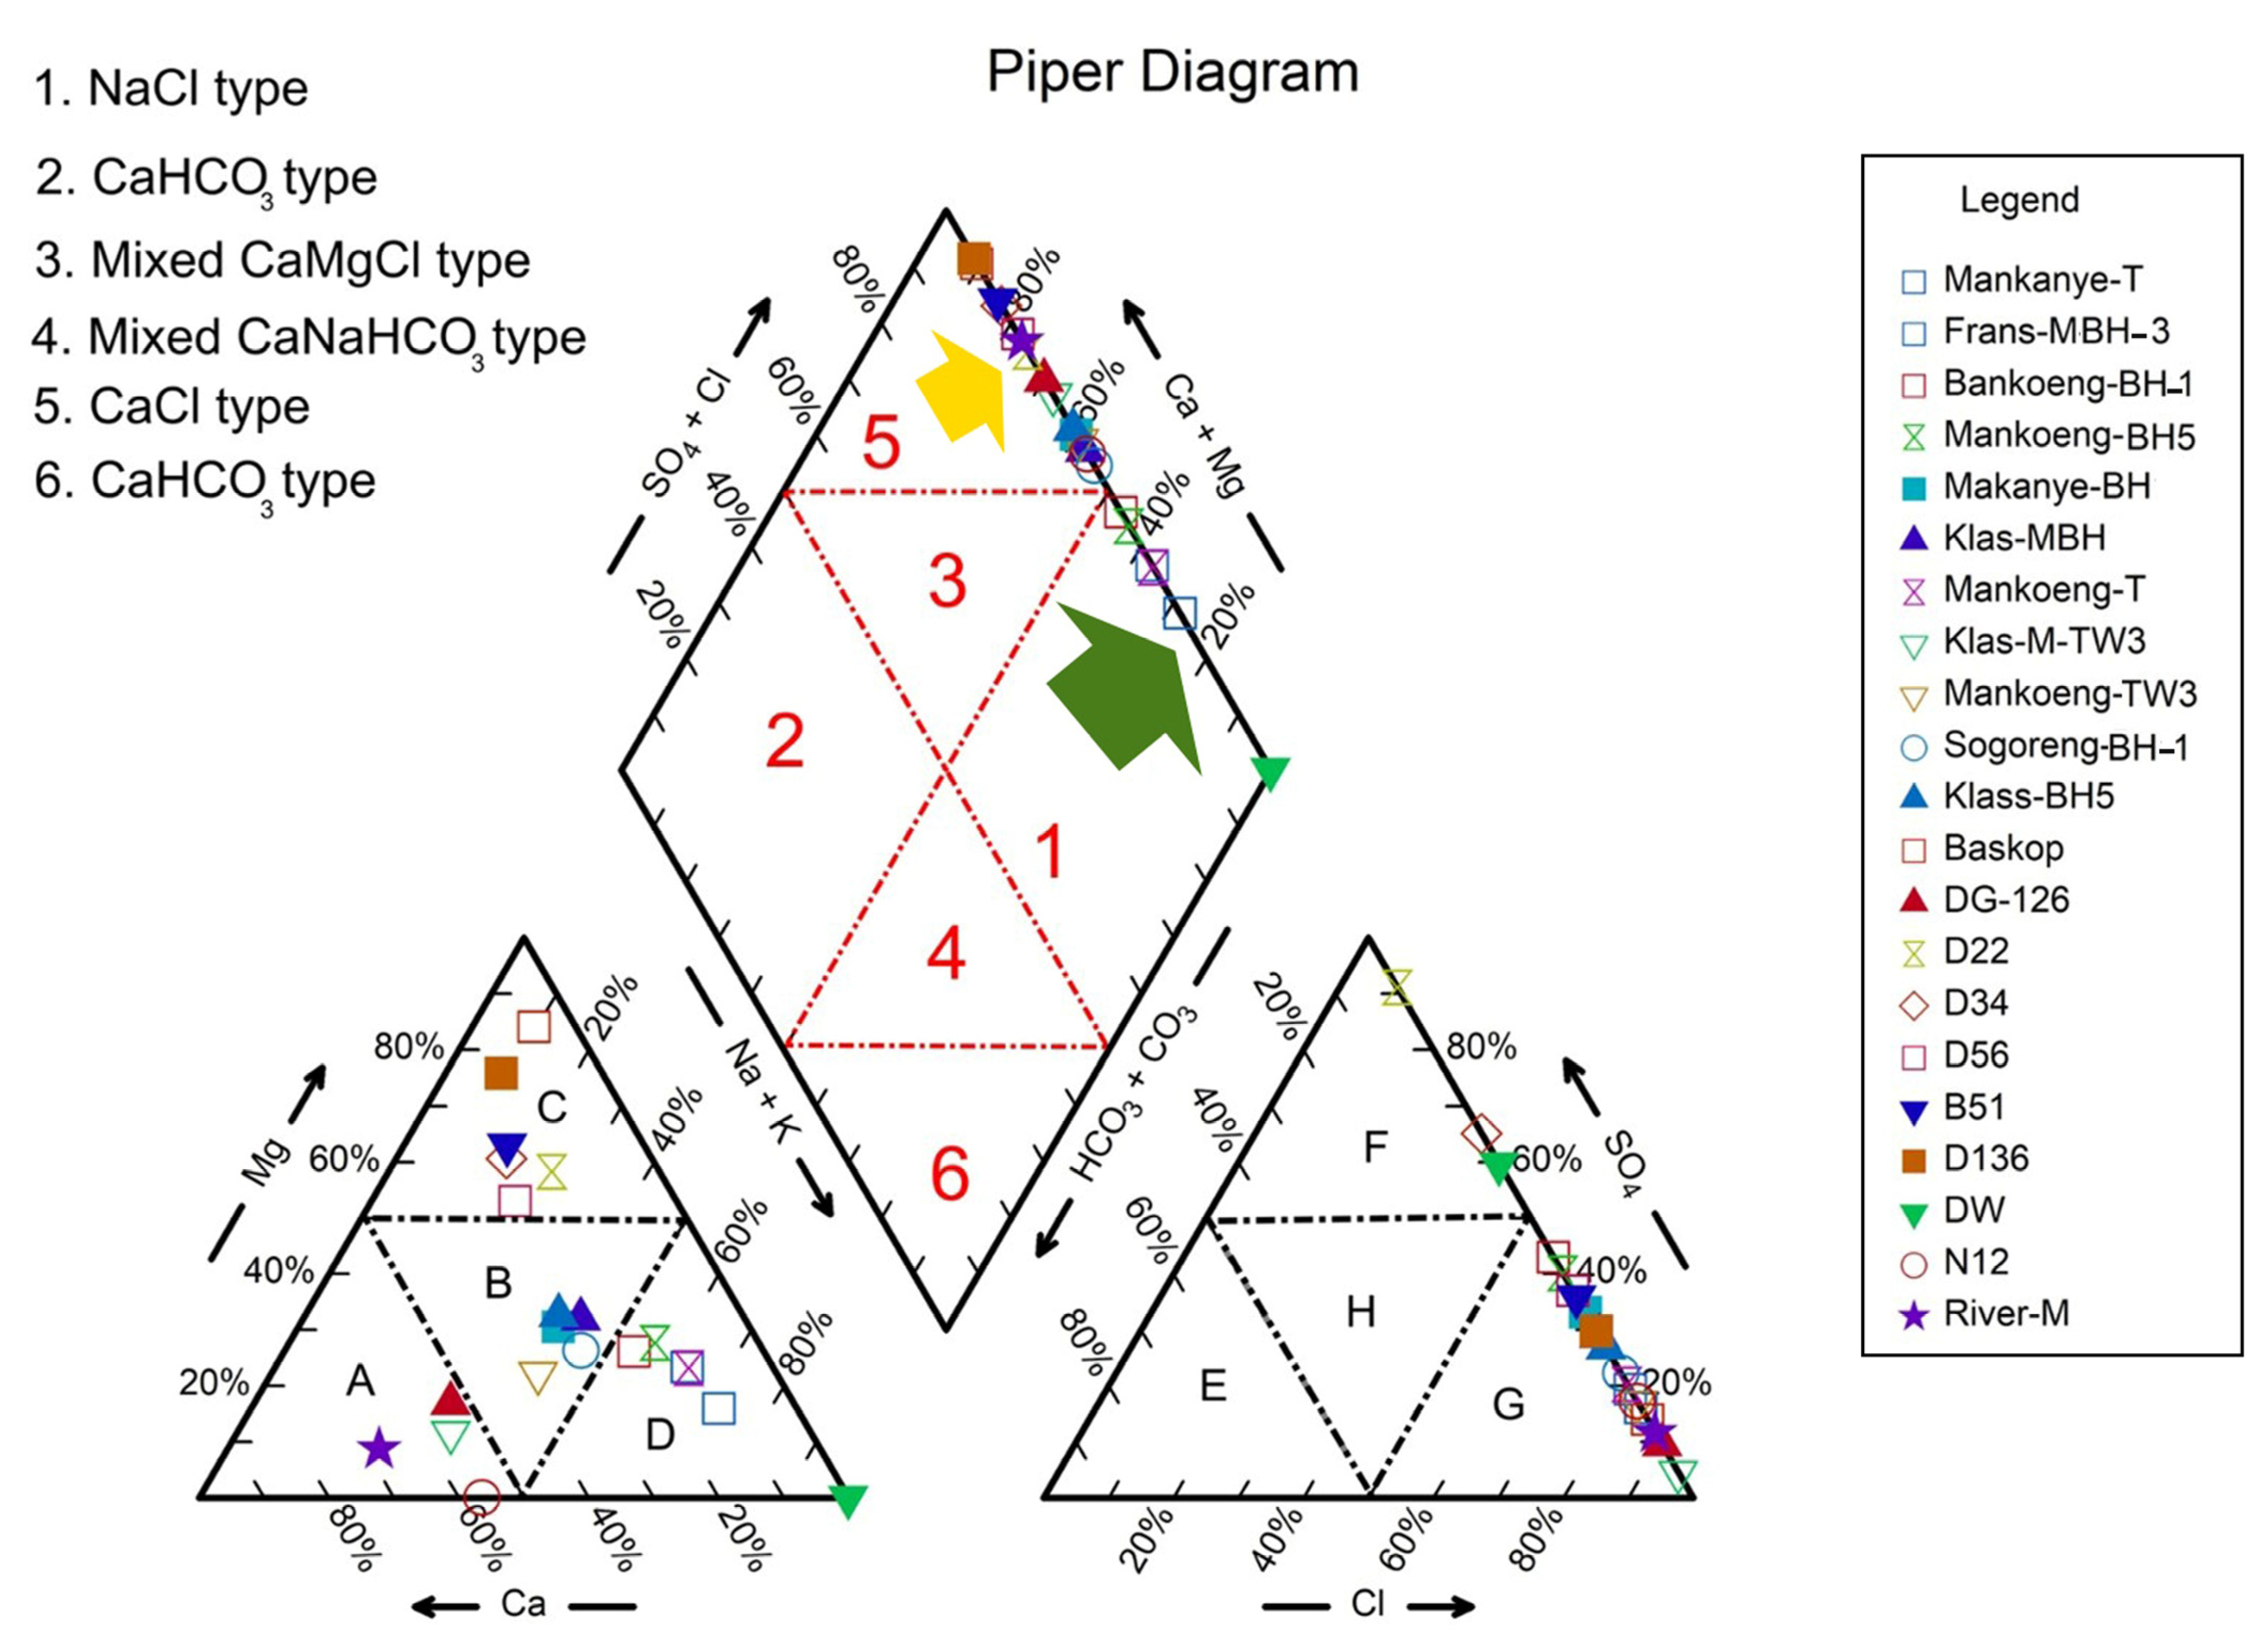
2.3. Water Character Analysis

The Aquachem software V. 10 [20] was used to submit the sample sites and variables, and the Piper plot was extracted. To ensure quality assurance (QA) and quality control (QC), standard reference materials were utilized. Each batch of samples included a blank and a standard for quality control. The accuracy of the analysis was confirmed using certified standards from De-Bruyn spectropic solutions (500 MUL20-50STD2), and the recoveries were within 10% of the certified values.

2.4. Statistical Analysis

The study examined the correlation between the samples by using a Pearson correlation through XLSTAT software [21]. To evaluate the relationship between the water physicochemical properties and sampling sites, a principal component analysis (PCA) was conducted. Measures were normalized using XLSTAT software. Score values were calculated for each variable based on principal components. The first two components were used to create a two-dimensional plot (F1 and F2) based on eigenvalues provided by XLSTAT.

2.5. Bacterial Contamination

After filtering the water samples using a 0.45 µm pore size cellulose ester membrane, 100 mL of the sample was filtered. Next, incubate total coliform plates at 37 °C for 24 h, fecal coliform plates at 44.5 °C for 24 h, fecal enterococci plates at 37 °C for 48 h, and Clostridium perfringens plates at 37 °C for 24 h under micro-aerophilic conditions using Anaerogen sachets. Once the incubation period is over, count the resulting colonies to identify the types of bacteria present.
For counting E. coli, place membranes from fecal coliform agar plates onto Nutrient MUG agar plates and incubate them in an aerobic environment at 37 °C for 24 h. Count fluorescent colonies as presumptive E. coli bacteria and confirm them using Gram staining and indole tests with Kovac’s reagent. Any Gram-negative, indole-positive colonies were recorded as E. coli isolates according to the techniques described by MacFaddin [22].

3. Results

3.1. Water Quality Parameters

Typical properties of groundwater in the examined regions of Limpopo Province are shown in Table 1. Groundwater pH tends to be slightly alkaline. According to the Piper diagram, chloride is the primary anion in the majority of groundwater samples (about 86%), as illustrated in Figure 2G.
In addition, 14% of the groundwater samples contain sulfate (Figure 2F). However, in the case of cations, 29% of samples had more sodium (Figure 2D), 19% had more calcium (Figure 2A), and 29% had more magnesium. In contrast, 23% of samples contain no dominant cations. The study area showed that the average trends for cations and anions were Na+ > Mg2+ > Ca2+ > K+ > Fe2+ and Cl > SO4, respectively. The collected water samples were broadly classified into two types, NaCl type (Figure 2; green arrow) and CaCl type (Figure 2; yellow arrow), with 29% and 71% of the total samples, respectively. The Piper diagram (Figure 2) showed that the Mankweng water samples represented NaCl type, whereas the Dalmada water samples represented CaCl type. The results showed that 25% of the water samples collected from the Mankweng area had a Na:Ca ratio over 3, indicating poor soil infiltration. However, the rest of the samples showed a Na:Ca ratio below 3, which means no infiltration might occur in the soil where the water samples were collected.
According to the Pearson correlation shown in Figure 3 (Table S2), there was a strong positive correlation between EC and TDS (r = 1.00), total hardness (r = 0.881), chloride (r = 0.794), calcium (r = 0.810), magnesium (r = 0.801), vanadium (r = 0.728), and silica (r = 0.852). In addition the result indicated a positive significant correlation of the following properties, including fluride with sodium (r = 0.862), sulfate with EC and TDS (r = 0.591), chromium and sulfate (r = 0.894) and boron (r = 0.803), magnesium with total hardness (r = 0.975), vanadium with barium (r = 0.813) and total hardness (r = 0.935), sodium with fluoride (r = 0.862), aluminum with iron (r = 0.836), and barium with magnesium (r = 0.829). However, pH does not correlate with the anions and cations of the groundwater samples, except with sodium (r = 0.635) and zinc (r = −0.425).

3.2. Water Quality Indices

Regarding the water quality indices (Table 2), the highest SAR value was 35.6 found for Frans-MBH-3 located in Mankweng, where the concentration of Na+ (169.7 mg/L) was also the highest among all locations. In contrast, the lowest SAR value was 1.6, which was found for a borehole (DG-126) in Dalmada with a concentration of Na+ (2.67 mg/L), which was within the standard level and very good for irrigation. Overall, the samples from Mankweng had higher SAR values than Dalmada water samples, indicating that there was a higher amount of sodium and EC in the Mankweng water samples. Regarding the soluble sodium percentage (SSP) values, suitability ranged from 79.5 (Frans-MBH-3 in Mankweng) to 15.1 (D136 in Dalmada). The result indicated a higher SSP of Mankweng water samples than Dalamad, showing a higher amount of sodium in the groundwater samples.
Regarding the MAR, the result ranged from 0.0 (N12 sample in Polokwane) to 88.9 (Baskop sample, Dalmada). On the other hand, the result indicated a higher amount of Mg in Dalamada groundwater samples than in Mankweng and Polokwane. A very low amount of Mg was detected in a sample taken from Polokwane. In 52% of the water samples, MAR was higher than 50, indicating an infiltration problem in the area studied.
KR indicated balance among Na+, Ca2+, and Mg2+ ions in water; the result ranged from 0.9 (N12 sample in Polokwane) to 118.6 (Baskop sample, Dalmada). In 90% of the water samples, the KR value measured was over 1.0, indicating an excessive amount of sodium in the water of the locations studied (Table 2).

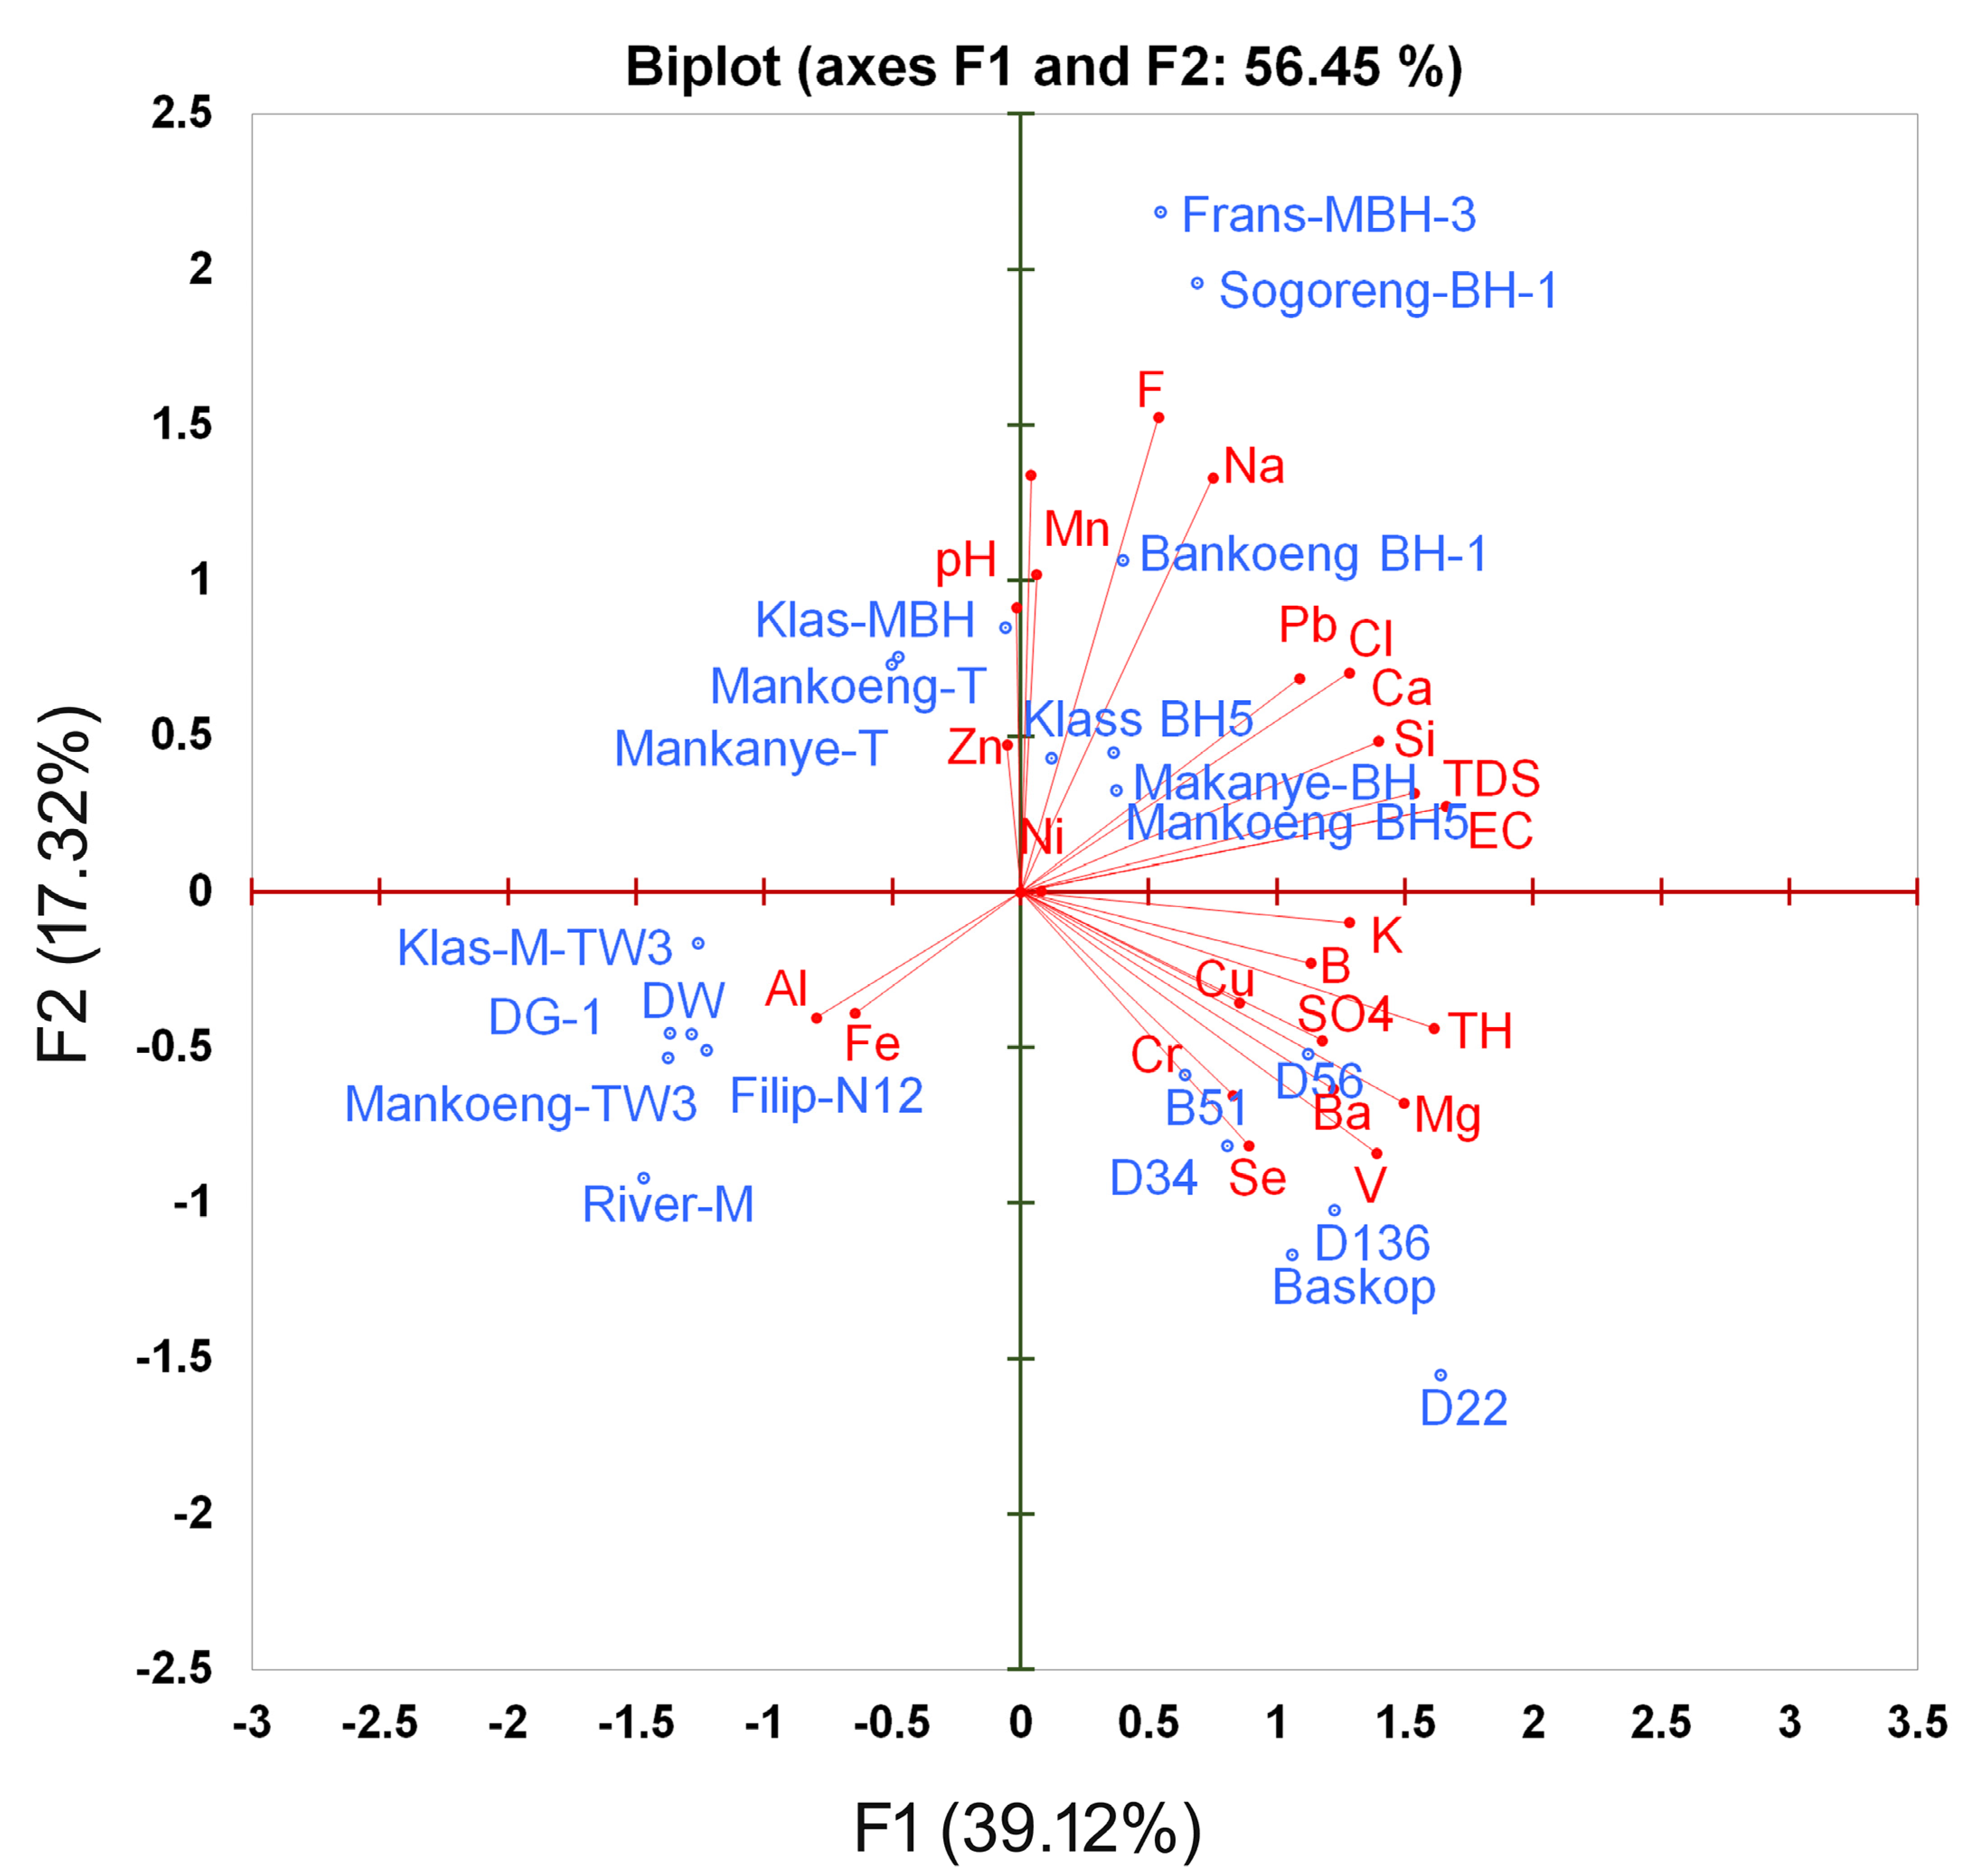
3.3. Multivariate Analysis

The analysis revealed that the Dalmada samples were linked to total hardness and sulfate, while the Mankweng samples were associated with sodium, pH, chloride, fluoride, total dissolved solids, EC, and calcium. Furthermore, the PCA indicated that two samples from Mankweng (klas-M-TW3 and Mankoeng-TW3), one sample from Dalmada (DG-1), a sample from the Magoebaskloof river, a sample from Polokwane (N12), and a still water sample, which was used as a control, only showed correlations with aluminum and iron (Figure 4).
The PCA accounted for 56.45% of the variability in the water quality parameters in the Mankweng, Dalmada, and Polokwane regions of Limpopo Province (Figure 4). The result indicated that 39.12% was explained by F1 and 17.32% was explained by F2, of which the water quality parameters had a significant effect on the tested water in the Mankweng and Dalmada regions of Limpopo Province. The highest contribution of the variability in F1 was measured for EC and TDS with 9.4%. The lowest contribution to the variability in F1 was measured for Zinc (0.009%) (Table 3). In contrast, the highest variability contribution in F2 was measured for fluoride and sodium, with 17.8% and 13.6%, respectively. The lowest contribution to the variability in F2 was measured for Nickel (0.0%) (Table 3).
The contribution of inorganic, physical, and metal components of the tested water and sampling locations indicated that Dalmada samples were correlated with heavy metals such as chromium, selenium, and barium (Figure 4; Table 2). The factor score, representing the variability in F1, was highest for D22 (5.128) in Dalmada and lowest for River-M (−4.596) in Magoebaskloof. In contrast, the factor score of the F2 was measured as the highest for Frans-MBH-3 (4.543) in Mankweng and D22 (−3.238) in Dalmada (Figure 4; Table 4).

3.4. Microbiology Analysis

The water from all the boreholes in different locations was found to be of acceptable microbiological quality for irrigation, as shown in Table 5. However, some of the water samples, such as Bankoeng-BH-1, Mankoeng-BH5, and Klas-MBH in Mankweng, and Baskop, D22, and D136 in Dalmada TC, were detected to have over 201 cfu per 100 mL, which is not safe for drinking purposes. Similarly, in River-M in Magoebaskloof, a high number of TC (>201) per 100 mL was detected. It is noteworthy that no high cfu per 100 mL of E. coli was found in any of the water samples (Table 5).

4. Discussion

This research study provides detailed insights into the characteristics of borehole water quality in specific rural and urbanized areas within South Africa’s Limpopo Province. The results of the study were based on the physicochemical, microbiological, and trace metal properties of the water samples collected from Mankweng, Dalmada, and Polokwane.
The inhabitants of rural and economically disadvantaged communities often rely on water sources that have been found to possess substandard quality. This issue has gained international recognition as a pressing concern for public health [23]. The effective operation and maintenance of these water supplies may be hindered by insufficient resources and a lack of understanding of the various factors that can influence water quality [8]. Mankweng is a rural area located in the Limpopo Province, known for its ongoing development initiatives. The inhabitants of this area rely primarily on boreholes as their main source of water supply. Dalmada is an urbanized location with boreholes as the main source of water for the majority of inhabitants. Therefore, water quality is crucial for both of these areas.

4.1. Water Quality Indices and Parameters

SAR is an indicator that shows the level of sodium hazard in a water sample. High levels of sodium ions in water can impact the soil’s permeability and cause infiltration problems. The SAR value of irrigation water is a crucial factor that affects the amount of sodium absorbed by the soil. Higher SAR values in irrigation water can lead to an increase in the amount of sodium absorbed by the soil, which can impact soil quality and crop growth. Therefore, it is important to monitor and manage SAR values in irrigation water to ensure optimal soil health [24]. The SAR index classifies water into four categories: S1 (<10; excellent), S2 (10–18; good), S3 (18–26; doubtful), and S4 (>26; unsuitable). The results of a recent study indicated that in the Mankweng area, 20% of the rural area of Mankweng had a SAR value of over 20. This means that the water is doubtful for use, but still suitable for maize production, which is the dominant crop in this region.
When water with high levels of sodium (Na+) and low levels of calcium (Ca2+) is used for irrigation, the cation exchange complex in the soil may become overwhelmed with sodium. This can destroy the soil structure due to the dispersion of clay particles, leading to soil erosion and decreased fertility. The cation exchange complex is responsible for holding onto important nutrients like calcium and magnesium for plant uptake. However, when sodium levels are high, they can displace these essential nutrients and wreak havoc on the soil’s physical and chemical properties. Therefore, it is essential to monitor the quality of water used for irrigation to prevent soil degradation and ensure long-term productivity [17]. Additionally, sodium reacts with the soil, thus altering the soil’s permeability. Furthermore, high levels of sodium in the soil make it alkaline and also cause a deficiency of calcium. In rainy seasons, excess amounts of sodium make the soil sticky, which is often observed in rural areas like Mankweng, where the SAR value was over 20. However, in Dalmada, the water SAR value was below 10, which is excellent for irrigation purposes. A study of the SAR values of water samples in Limpopo Province [25] indicated that most sampling sites were suitable for irrigating various crops. This finding aligns with the current study, which identified only five sites in Mankweng that had a high SAR value, showing that most of the sample sites were suitable for the irrigation of various crops. This is in agreement with the present study, in which only five sites of Mankweng had a high value of SAR.
Measuring the concentrations of calcium (Ca+2), magnesium (Mg+2), and sodium (Na+) is essential for producing accurate predictions of the SAR value, a key parameter in assessing water quality for irrigation [26]. Understanding SAR is particularly important in the context of irrigation practices as it influences soil structure, fertility, and plant health. This approach is directly aligned with the findings of the current study, which provides critical insights into the optimal irrigation strategies for a diverse range of crops cultivated in the Limpopo Province of South Africa. Such information is vital for enhancing agricultural productivity and sustainability in the region, where effective water management practices can significantly impact crop yield and overall farm viability.
When the concentration of sodium solution (SSP) rises in water, it can adversely affect both plant growth and the soil’s capacity to absorb and distribute water. This means that the plants may not be able to grow to their full potential, and the soil may become more compacted, making it harder for water to penetrate the surface. Therefore, it is important to monitor the level of SSP value in water to ensure healthy plant growth and maintain proper soil permeability [27,28].
Groundwater is the water that fills the spaces between soil and rock particles underground. It is common for groundwater to contain sodium, as most rocks and soils have sodium compounds that easily dissolve in it. Despite this, the concentration of sodium in groundwater is typically lower than that of calcium and magnesium in freshwater. Calcium and magnesium are essential minerals for human health, whereas high levels of sodium in drinking water can be harmful to health [29]. The general consensus is that consuming higher amounts of dietary sodium is connected to an increased risk of developing hypertension within the general population. Furthermore, elevated blood pressure has been found to be associated with greater salinity levels in drinking water [29]. Therefore, it is important to monitor the levels of these minerals in our drinking water [29]. Elevated levels of sodium in groundwater primarily originate from three main sources. The first source is the weathering of rocks that contain sodium, which can leach into the groundwater. The second source is irrigation returns, where the excess water used in irrigation may contain high levels of sodium that can infiltrate into the groundwater. Lastly, pollution from sewage effluent and seawater intrusion can also contribute to elevated levels of sodium in groundwater. These sources can significantly impact the quality and safety of groundwater for human consumption [30]. In contrast, in Dalmada, the urbanized area, the primary source of sodium is likely rocks or irrigation return [31]. Furthermore, Limpopo Province is situated within a Granulite-facies rock belt, which is a source of both sodium and calcium [11,31].
The MAR causes a harmful effect on the soil when it exceeds 50 [32]. The result indicated that in 52% of the water samples, the MAR value was over 50 [33]. In areas with high amounts of Mg2+, the soil faces an infiltration problem [34]. Furthermore, the MAR value plays a significant role in influencing the alkalinity of the soil, which can negatively impact soil quality and ultimately diminish crop yields [26,35]. A comprehensive study conducted in the Limpopo Province of South Africa revealed that a majority of the water samples analyzed exhibited a MAR value of less than 50. This indicates a favorable condition for irrigation practices [25]. However, these findings are in contrast to those observed in the current study, highlighting potential discrepancies in water quality and usability for agricultural purposes.
This suggests that, while the groundwater resources might generally be deemed suitable for irrigation based on MAR assessments, there are underlying challenges that must be addressed to optimize their use. In particular, the potential effects of rising alkalinity on soil health warrant careful consideration. Therefore, it is imperative to implement continuous monitoring of calcium, magnesium, water quality, and soil conditions, coupled with effective management strategies, to ensure sustainable agricultural practices and safeguard crop productivity in the face of varying environmental factors. A comprehensive analysis of groundwater quality in Yemen has disclosed that 55.17% of the sampled sites are deemed unsuitable for irrigation purposes, primarily due to elevated levels of alkalinity [36]. This significant finding underscores persistent concerns regarding soil and water management in arid regions. Moreover, it aligns with ongoing research emphasizing the importance of global monitoring and assessment of key mineral levels, specifically calcium (Ca+2) and magnesium (Mg+2). Monitoring these elements is crucial as they play vital roles in soil health and plant growth, impacting agricultural productivity and food security in vulnerable regions. The results call for the implementation of effective strategies to address the challenges associated with water quality and sustainable irrigation practices.
Calcium and magnesium are essential minerals that play a vital role in numerous biological processes, including bone formation, muscle contraction, and nerve function [32]. They are widely available in nature, and their presence in all-natural water sources makes them easily accessible to living organisms. Groundwater is a significant source of these minerals, including calcium and magnesium [37]. These minerals primarily originate from the weathering of rocks, particularly limestone and dolomite. The presence of these minerals in groundwater can have significant implications for water quality, as high concentrations can have adverse effects on human health and the environment. Several epidemiological studies have provided evidence of a correlation between the hardness of drinking water or its magnesium and calcium content, and an increased risk for cardiovascular disease, growth retardation, reproductive failure, and other health issues [38].
Magnesium was detected in higher amounts in Dalmada than in Mankweng. The previous result indicated more limestone distribution in the Capricorn district than in other locations in Limpopo Province [39]. Therefore, more magnesium was detected in Dalmada than in Mankweng.
Based on the KR value, which balances Na+, Ca2+, and Mg2+, a KR value over 1 indicates an excess amount of Na+ [19]. The result of the present study indicated that Polokwane and Magoebaskloof water samples had excellent quality for irrigation purposes.
Calcium is a vital mineral that is essential for healthy bones and teeth. The primary sources of this important nutrient are carbonate rocks, such as limestones and dolomites [40]. These rocks dissolve in groundwater that contains carbonic acid, which releases calcium ions into the water. The dissolved calcium is then available for uptake by plants and animals, and ultimately ends up in the food chain. Without these sources of calcium, life as we know it would not be possible [41]. The geological map of Limpopo Province revealed a high distribution of limestone in Dalmada, a reason why this area has more calcium than other localities [42]. As groundwater infiltrates or flows through rocks, it has the potential to dissolve naturally occurring minerals such as calcium carbonate (CaCO3) or calcium magnesium carbonate (CaMg (CO3)2). This process can result in an increase in the concentration of Ca2+ and Mg2+ ions present in the water. These ions, commonly referred to as hardness ions, can have an impact on water quality and may lead to problems such as scale buildup in plumbing systems [43].

4.2. Correlation and Principal Component Analysis

The results of the present study indicated a positive correlation between pH and sodium, while a negative correlation was found between pH and zinc. Similar findings were reported by Zou et al. [44] and Zhao et al. [45], who showed that pH was negatively correlated with zinc levels in China. Additionally, electrical conductivity (EC) exhibited a positive correlation with TDS and zinc, consistent with previous studies.
The accumulation of heavy metals in aquatic environments poses significant risks to aquatic ecosystems [46]. In this study, neither pH nor EC showed a significant correlation with nickel (Ni). Zinc is an essential trace metal; it is a necessary nutrient for many organisms and is found in the tissues and organs of humans [47]. South Africa recommends a maximum of 5 mg/L for zinc and 0.07 mg/L for nickel in drinking water, and 2 mg/L in effluent water samples [48]. It is important to note that the toxicity of zinc in water samples is minimal and is unlikely to cause secondary pollution in the receiving surface water used for irrigation or drinking purposes.
In regard to anthropogenic pollution in the groundwater of the Limpopo region, previous research [49] has revealed concerning findings regarding water quality. Specifically, the study identified the presence of several contaminants in river water samples collected from the area, including elevated levels of salt, phosphate, vanadium, lead, and silicon (Figure S3). These contaminants can significantly alter the chemical composition of the tested water samples, potentially posing risks to both environmental health and human safety. The detection of these substances highlights the ongoing challenges of managing water quality in this region, emphasizing the need for effective monitoring and remediation strategies to mitigate the impact of pollution on the groundwater resources. The PCA suggested that groundwater quality is mainly controlled by TDS, EC, and sodium in the areas studied. Water hardness was high in the samples collected from Dalmada, reflecting the high concentrations of calcium and magnesium.
When assessing the quality of water for irrigation purposes, electrical conductivity is a crucial parameter to consider. It directly relates to salinity issues and reflects the TDS present in groundwater. As it indicates the salinity hazard to crops, measuring electrical conductivity is an excellent way to evaluate water quality for irrigation [50]. Groundwater TDS concentrations of the present study ranged from 5.8 to 841.0 mg/L (avg. 456.3 mg/L), all within desirable limits according to South African Water Quality Guidelines (SAWQG) [51] and WHO [52] standards. Safe EC range for health is 0–150 mS/m and acceptable TDS range is 0–1000. Therefore, EC and TDS of the water samples in Dalmada and Mankweng were acceptable for irrigation and drinking. PCA in hydro-geochemical characteristics of groundwater quality in the Gwayi area of Zimbabwe showed a high concentration of calcium and magnesium, contributing to the hardness of the water [7].
Hard water is high in calcium and magnesium, common in dolomitic aquifers. It causes mineral buildup in kettles and wastes soap and synthetic detergents. This character was observed in Dalmada, where the total hardness of the water ranges from 404.9 to 583.0. The highest acceptable level for total hardness (TH) is 500 mg/L. However, the preferred level is 100 mg/L [52]. Continued use of hard water in irrigation can increase soil pH, affecting plants that require acidic conditions. However, high TH in the water does not pose a health risk [7].
Regarding elements such as iron and manganese, WHO reports that in 2023, 0.30 mg/L of iron and 0.05 mg/L of manganese were recommended in drinking water. However, they did not exceed the recommended limits in all the sampled areas. Chloride levels in one sample (Sogoreng-BH; Mankweng) were higher than 100 mg/L. Again, a high amount of Fluoride levels was detected in one sample (Sogoreng-BH; Mankweng). According to WHO [53], high fluoride may cause various health problems. Fluorite, mica, and hornblende are the most common fluoride-bearing minerals found in thin sections of rock from western Bushveld areas of South Africa [54].
Fluoride in water can come from nature or humans. High levels cause fluorosis, affecting teeth and bones [55,56]. Based on WHO [42], the amount of fluoride above 1500 µg/l has a chronic effect, in which one sample in Mankweng was detected with 1730 µg/l. However, the remaining water samples were acceptable for drinking and irrigation purposes.

4.3. Bacterial Analysis

The microbial contamination in the water samples may be attributed to the depth of the boreholes. The minimum depth of the sampled borehole was 55 m in B51 (Dalmada). As groundwater moves through the first 30 m of saturated sand or unfissured rock, it effectively cleanses and purifies itself by filtering out surface microbial contamination [7]. According to Moyo [7], in the unsaturated zone, purifying groundwater may require no more than 3 m of filtration. Nevertheless, if there is a fractured aquifer, microbial contaminants can quickly pass through the unsaturated zone and reach the water table. In such cases, the efficiency of the purifying process is reduced. Studies carried out in Southern Africa have revealed that certain boreholes contain contaminated water [7,47]. Moyo [7] suggested that the borehole depth affected the water samples in Zimbabwe, as no significant amount of coliform bacteria were detected in the higher depth of borehole water samples. In contrast, water samples from Magoebaskloof River contain a high number of coliform bacteria, as indicated by Potgieter et al. [57]. This is due to the animal community of the Magoebaskloof, which uses the river as a natural resource, and the low depth of the river, for not filtered through the natural process. The presence of E. coli in water is typically an indicator of recent fecal contamination or poor hygienic practices. This signifies a potential risk of waterborne diseases due to the presence of harmful bacteria [58]. Fecal contamination, inadequate sanitation measures, and improper storage conditions can all contribute to the proliferation and persistence of E. coli, posing a public health concern. Therefore, effective control and prevention strategies are necessary to mitigate the impact of these factors on the prevalence of E. coli in water. Generally, in the studied areas of Limpopo Province, no potential risk of E. coli was detected. However, constant monitoring is necessary for a healthy water system.
All water samples were collected from the same aquifer (Figure S2) [59], albeit from varying depths (Table 2). This indicates that the aquifer can impact contamination levels, mineral composition, and overall groundwater quality. Although the water samples from Mankweng exhibited lower quality compared to those from Dalmada, they still demonstrated low microbial contamination. Continuous monitoring is crucial to detect any changes in water quality.

5. Environmental, Animal, and Human Effects on Analysis

The present study faced a few challenges, primarily related to accessing certain boreholes, which complicated the collection of water samples. Water samples were obtained from boreholes at depths ranging from 60 to 120 m (Table S1), with the distilled water serving as a control sample. The only environmental factor that could potentially influence the results was temperature; however, all samples were collected during the same season to mitigate this effect. As a result, the data gathered is not influenced by animal or human activities.

6. Conclusions

The physical and chemical properties of the borehole water showed that two water types are available, namely Na-Cl and Ca-Cl, neither of which conforms to the acceptable range of SSP (<50%) and KR (<1). Hence, it is crucial to constantly monitor the water sources of the studied areas for their chemical composition. Additionally, ion exchange can also be a source of sodium ions, while the Ca2+/Mg2+ ratio indicated that calcium was more prevalent than magnesium. Based on the SAR values, 60% of the water samples showed excellent quality for drinking, and 40% showed good quality for irrigation. During the current study, it was observed that certain boreholes in Mankweng were inadequately maintained. Consequently, it is recommended that these boreholes receive proper maintenance. Despite the low presence of bacteria such as E. coli in the water samples from Mankweng and Dalmada, regular microbiological analysis of water sources is necessary to mitigate the negative impact on the health system of Limpopo Province. The limitation of the study was access to the borehole water. For future perspective, it is strongly recommended that the South African government, in collaboration with local municipalities in the Capricorn district of Limpopo Province, take proactive measures to implement sustainable water management practices. Key strategies should include the regulation of groundwater pumping rates to prevent over-extraction, the establishment of stringent guidelines to prevent water contamination, and the development of comprehensive educational campaigns aimed at raising public awareness about responsible water use. By fostering community involvement and promoting sustainable habits, this initiative can contribute significantly to the preservation of vital water resources for future generations.

Supplementary Materials

The following supporting information can be downloaded at https://www.mdpi.com/article/10.3390/environments12060174/s1, Table S1: The locations of the samples were used for the water analysis from Mankweng and Dalmada, Limpopo Province, South Africa; Table S2: Pearson correlation matrix for the water samples parameters, Figure S1: Location of sampling in Limpopo Province, South Africa [59], Figure S2. Sampling site of the water samples from Limpopo Province, South Africa (Source: Council for Geosciences; Johnson et al., 2006 [59]), where prominent aquifers are marked (red circle), Figure S3. Distribution of mineral across the Limpopo River basin (Source: https://limpopocommission.org/maps/maps-the-river-basin [60]).

Author Contributions

Conceptualization, E.S. and N.M.; methodology, E.S. and N.M.; software, E.S.; investigation, E.S. and N.M.; resources, E.S. and N.M.; writing—original draft preparation, E.S.; writing—review and editing, E.S. and N.M.; funding acquisition, E.S. and N.M. All authors have read and agreed to the published version of the manuscript.

Funding

This research was funded by RNA-UL-2022, provided by the University of Limpopo, South Africa.

Data Availability Statement

The original contributions presented in this study are included in the article/Supplementary Material. Further inquiries can be directed to the corresponding authors. All data provided in the paper or as a Supplementary File.

Acknowledgments

The authors acknowledge the University of Limpopo for the funds and facilities for water analysis.

Conflicts of Interest

The authors declare no conflicts of interest.

References

  1. WHO. Guidelines for Drinking Water Quality, 4th ed.; WHO: Geneva, Switzerland, 2017. [Google Scholar]
  2. Jakeman, A.J.; Barreteau, O.; Hunt, R.; Rinaudo, J.D.; Ross, A.; Arshad, M.; Hamilton, S. Integrated Groundwater Management: An Overview of Concepts and Challenges. In Integrated Groundwater Management; Jakeman, A.J., Barreteau, O., Hunt, R.J., Rinaudo, J.D., Ross, A., Eds.; Springer: Cham, Switzerland, 2016. [Google Scholar] [CrossRef]
  3. Levallois, P.; Villanueva, C.M. Drinking Water Quality and Human Health: An Editorial. Int. J. Environ. Res. Public Health 2019, 16, 631. [Google Scholar] [CrossRef] [PubMed]
  4. Verlicchi, P.; Grillini, V. Surface and Groundwater Quality in South African Area—Analysis of the Most Critical Pollutants for Drinking Purposes. Proceedings 2020, 48, 3. [Google Scholar] [CrossRef]
  5. Gavrilescu, M. Water, Soil, and Plants Interactions in a Threatened Environment. Water 2021, 13, 2746. [Google Scholar] [CrossRef]
  6. Pitchard, M.; Mkandawire, T.; Óneill, T.G. Assessment of groundwater quality in shallow wells within the southern districts of Malawi. In Proceedings of the 8th WaterNet/WARFSA/GWP-SA Annual Symposium, Lusaka, Zambia, 31 October – 2 November 2007. [Google Scholar]
  7. Moyo, N. An analysis of the chemical and microbiological quality of ground water from boreholes and shallow wells in Zimbabwe. Phys. Chem. Earth 2013, 66, 27–32. [Google Scholar] [CrossRef]
  8. Rietveld, L.C.; Haarhoff, J.; Jagals, P. A tool for technical assessment of rural water supply systems in South Africa. Phys. Chem. Earth Parts A/B/C 2009, 34, 43–49. [Google Scholar] [CrossRef]
  9. Odiyo, J.O.; Makungo, R. Fluoride concentrations in groundwater and impact on human health in Siloam Village, Limpopo province, South Africa. Water SA 2012, 38, 731–736. [Google Scholar] [CrossRef]
  10. Potgieter, N.; Mudau, L.S.; Maluleke, F.R.S. The microbiological quality of private and communal boreholes in the Tshitale- hlanganani region of the Limpopo province, South Africa. Water Sci. Technol. 2006, 54, 371–377. [Google Scholar] [CrossRef]
  11. Vegter, J.R. Hydrogeology of Groundwater Region 7 Polokwane/Pietersburg Plateau; WRC Consultancy No. K8/466; Water Research Commission: Pretoria, South Africa, 2003; 53p. [Google Scholar]
  12. Rivett, U.; Champanis, M.; Wilson-Jones, T. Monitoring drinking water quality in South Africa: Designing information systems for local needs. Water SA 2013, 39, 409–414. Available online: http://www.scielo.org.za/scielo.php?script=sci_arttext&pid=S1816-79502013000300010&lng=en (accessed on 6 March 2025). [CrossRef]
  13. Misstear, B.; Vargas, C.R.; Lapworth, D.; Ouedraogo, I.; Podgorski, J. A global perspective on assessing groundwater quality. Hydrogeol. J. 2023, 31, 11–14. [Google Scholar] [CrossRef]
  14. APHA. Standard Methods for the Examination of the Water and Wastewater, 20th ed.; American Public Health Association: Washington, DC, USA, 1998. [Google Scholar]
  15. Hach. Water Analysis Handbook, 7th ed.; Hach Company: Loveland, CO, USA, 2012; 1796p. [Google Scholar]
  16. US Salinity Laboratory. Diagnosis and Improvement of Saline and Alkaline Soils; Richards, L.A., Ed.; Handbook No. 60; US Department of Agriculture: Washington, DC, USA, 1954. [Google Scholar]
  17. Todd, D.K. Groundwater Hydrology; Wiley: New York, NY, USA, 1980. [Google Scholar]
  18. Raghunath, H.M. Groundwater; Wiley Eastern: New Delhi, India, 1987. [Google Scholar]
  19. Kelley, W.P. Use of saline irrigation water. Soil. Sci. 1963, 95, 355–391. [Google Scholar] [CrossRef]
  20. Waterloo Hydrogeologic. Water Quality Data Analysis and Reporting Software. 2021. Available online: https://www.waterloohydrogeologic.com/products/aquachem/ (accessed on 1 January 2023).
  21. Addinsoft. XLSTAT, Analyse de Données et Statistique Avec MS Excel; Addinsoft: New York, NY, USA, 2007. [Google Scholar]
  22. MacFaddin, J.F. Biochemical Tests for Identification of Medical Bacteria, 2nd ed.; Williams and Wilkons: Baltimore, MD, USA, 1980; 527p. [Google Scholar]
  23. Bain, R.; Cronk, R.; Hossain, R.; Bonjour, S.; Onda, K.; Wright, J.; Yang, H.; Slaymaker, T.; Hunter, P.; Prüss-Ustün, A.; et al. Global assessment of exposure to faecal contamination through drinking water based on a systematic review. Trop. Med. Int. Health 2014, 19, 917–927. [Google Scholar] [CrossRef]
  24. Raihan, F.; Alam, J.B. Assessment of groundwater quality in Sunamganj Bangladesh. Iran. J. Environ. Health Sci. Eng. 2008, 6, 155–166. [Google Scholar]
  25. Mukonazwothe, M.; Munyai, L.F.; Mutoti, M.I. Groundwater quality evaluation for domestic and irrigation purposes for the Nwanedi Agricultural Community, Limpopo Province, South Africa. Heliyon 2022, 8, e09203. [Google Scholar] [CrossRef]
  26. Monira, U.; Sattar, G.S.; Mostafa, M.G. Assessment of surface water quality using the Water Quality Index (WQI) and multivariate statistical analysis (MSA), around tannery industry effluent discharge areas. H2Open J. 2024, 7, 130–148. [Google Scholar] [CrossRef]
  27. Wantasen, S.; Luntungan, J.N.; Tarore, A.E. Determination of the water quality of panasen river as a source of irrigation water. IOP Conf. Series Earth Environ. Sci. 2019, 314, 012034. [Google Scholar] [CrossRef]
  28. Joshi, D.M.; Kuman, A.; Agrawal, N. Assessment of the irrigation water quality of River Ganga in Haridwar district. Indian J. Chem. 2009, 2, 285–292. [Google Scholar]
  29. Bispham, N.Z.; Nowak, K.L. Drinking Water: The Saltier The Better? J. Am. Heart Assoc. 2019, 8, e012758. [Google Scholar] [CrossRef] [PubMed]
  30. Dinka, M.O.; Loiskand, W.; Ndambuki, J.M. Hydrochemical characterization of various surface water and groundwater resources available in Matahara areas, Fantalle Woreda of Oromiya region. J. Hydrol. Reg. Stud. 2015, 3, 444–456. [Google Scholar] [CrossRef]
  31. Van Reenen, D.D.; Roering, C.; Brand, G.; Smit, C.A.; Barton, J.M. The granulite-facies rocks of the Limpopo belt, Southern Africa. In Granulites and Crustal Evolution; Vielzeuf, D., Vidal, P., Eds.; NATO ASI Series; Springer: Dordrecht, The Netherlands, 1990; Volume 311. [Google Scholar] [CrossRef]
  32. Ayers, R.S.; Westcot, D.W. Water Quality for Agriculture, Irrigation and Drainage (Paper No. 29); FAO: Rome, Italy, 1985. [Google Scholar]
  33. Tanvir Rahman, M.A.T.M.; Saadat, A.H.M.; Islam, M.S.; Al-Mansur, M.A.; Ahmed, S. Groundwater characterization and selection of suitable water type for irrigation in the western region of Bangladesh. Appl. Water Sci. 2017, 7, 233–243. [Google Scholar] [CrossRef]
  34. Ali, A.A.H. Overview of the vital roles of macro minerals in the human body. J. Trace Elem. Miner. 2023, 4, 100076. [Google Scholar] [CrossRef]
  35. Mohammed, S.; Arshad, S.; Bashir, B.; Vad, A.; Alsalman, A.; Harsányi, E. Machine learning driven forecasts of agricultural water quality from rainfall ionic characteristics in Central Europe. Agric. Water Manag. 2024, 293, 108690. [Google Scholar] [CrossRef]
  36. Hakami, R.A.; Naser, R.S.; El-Bakkali, M.; Othman, M.D.M.; Yahya, M.S.; Raweh, S.; Belghyti, D. Groundwater quality deterioration evaluation for irrigation using several indices and geographic information systems: A case study. Desalination Water Treat. 2024, 320, 100645. [Google Scholar] [CrossRef]
  37. Nur, A.; Ishaku, J.; Yusuf, S. Groundwater Flow Patterns and Hydrochemical Facies Distribution Using Geographical Information System (GIS) in Damaturu, Northeast Nigeria. Int. J. Geosci. 2012, 3, 1096–1106. [Google Scholar] [CrossRef]
  38. Sengupta, P. Potential health impacts of hard water. Int. J. Prev. Med. 2013, 4, 866–875. [Google Scholar]
  39. Council for Geoscience (CGS). Limestone and Dolomite Map. 2023. Available online: https://login.mdpi.com/login?_target_path=https%3A%2F%2Fwww.preprints.org%2Fproduction%2Flayout%3FauthAll%3Dtrue (accessed on 1 January 2023).
  40. Bucher, K. Metamorphic Rocks. In Petrogenesis of Metamorphic Rocks; Springer Textbooks in Earth Sciences, Geography and Environment; Springer: Cham, Switzerland, 2023. [Google Scholar] [CrossRef]
  41. Zabala, M.; Manzano, M.; Vives, L. The origin of groundwater composition in the Pampeano aquifer underlying the Del Azul Creek basin, Argentina. Sci. Total Environ. 2015, 518, 168–188. [Google Scholar] [CrossRef]
  42. Viljoen, M. The Mpumalanga/Limpopo Escarpment: Geology and Fluvial Landforms. In Landscapes and Landforms of South Africa; Grab, S., Knight, J., Eds.; World Geomorphological Landscapes; Springer: Cham, Switzerland, 2015. [Google Scholar] [CrossRef]
  43. Elango, L.; Kannan, R. Rock–water interaction and its control on chemical composition of groundwater. Dev. Environ. Sci. 2007, 5, 229–243. [Google Scholar]
  44. Zou, Y.; Lou, S.; Zhang, Z.; Liu, S.; Zhou, X.; Zhou, F.; Radnaeva, L.D.; Nikitina, E.; Fedorova, I.V. Predictions of heavy metal concentrations by physiochemical water quality parameters in coastal areas of Yangtze river estuary. Mar. Pollut. Bull. 2024, 199, 115951. [Google Scholar] [CrossRef]
  45. Zhao, S.; Zhao, Y.; Cui, Z.; Zhang, H.; Zhang, J. Effect of pH, Temperature, and Salinity Levels on Heavy Metal Fraction in Lake Sediments. Toxics 2024, 12, 494. [Google Scholar] [CrossRef]
  46. Li, L.; He, Y.; Song, K.; Xie, F.; Li, H.; Sun, F. Derivation of water quality criteria of zinc to protect aquatic life in Taihu Lake and the associated risk assessment. J. Environ. Manag. 2021, 296, 113175. [Google Scholar] [CrossRef]
  47. Bakare, B.F.; Adeyinka, G.C. Evaluating the Potential Health Risks of Selected Heavy Metals across Four Wastewater Treatment Water Works in Durban, South Africa. Toxics 2022, 10, 340. [Google Scholar] [CrossRef]
  48. Malan, M.; Müller, F.; Cyster, L.; Raitt, L.; Aalbers, J. Heavy metals in the irrigation water, soils and vegetables in the Philippi horticultural area in the Western Cape Province of South Africa. Environ. Monit. Assess. 2014, 185, 4085. [Google Scholar] [CrossRef] [PubMed]
  49. Ashton, P.; Love, D.; Mahachi, H.; Dirks, P. An Overview of the Impact of Mining and Mineral Processing Operations on Water Resources and Water Quality in the Zambezi, Limpopo and Olifants Catchments in Southern Africa; Report to Minerals, Mining and Sustainable Development Project, Southern Africa; MMSD: Birnam Park, South Africa, 2001; 338p. [Google Scholar]
  50. Malakar, A.; Snow, D.D.; Ray, C. Irrigation Water Quality—A Contemporary Perspective. Water 2019, 11, 1482. [Google Scholar] [CrossRef]
  51. Department of Water Affairs and Forestry (DWAF). South African Water Quality Guidelines, 2nd ed.; Holmes, S., Ed.; Department of Water Affairs and Forestry: Pretoria, South Africa, 1996; Volume 1. [Google Scholar]
  52. WHO. Guidelines for Drinking Water Quality, 4th ed.; WHO: Geneva, Switzerland, 2011. [Google Scholar]
  53. WHO. Guidelines for Drinking Water Quality, 4th ed.; WHO: Geneva, Switzerland, 2023. [Google Scholar]
  54. McCaffrey, L.P. Distribution and origin of high fluoride groundwater in the Western Bushveld Areas. In Fluoride and Fluorosis: The Status of South African Research; University of Cape Town: Cape Town, South Africa, 1995; Volume 2. [Google Scholar]
  55. Grobler, S.R.; Dreyer, A.G.; Blignaut, R.J. Drinking water in South Africa: Implications for fluoride supplementation. J. South African Dent. Assoc. 2001, 56, 557–559. [Google Scholar]
  56. Shaji, E.; Bindu, J.V.; Thambi, D. High fluoride in groundwater of Palghat District, Kerala. Curr. Sci. 2007, 92, 240. [Google Scholar]
  57. Potgieter, N.; Becker, P.J.; Ehlers, M.M. Evaluation of the CDC safe water-storage intervention to improve the microbiological quality of point-of-use drinking water in rural communities in South Africa. Water SA 2009, 35, 505–516. [Google Scholar] [CrossRef]
  58. Odonkor, S.T.; Mahami, T. Escherichia coli as a tool for disease risk assessment of drinking water sources. Int. J. Microbiol. 2020, 2020, 2534130. [Google Scholar] [CrossRef]
  59. Johnson, M.R.; Anhaeusser, C.R.; Thomas, R.J. (Eds.) The Geology of South Africa; The Geological Society of South Africa; Council for Geosciences: Pretoria, South Africa, 2006; 691p. [Google Scholar]
  60. LIMCOM (Limpopo Watercourse Commission) Maps—The River Basin. Available online: https://limpopocommission.org/maps/maps-the-river-basin (accessed on 1 April 2025).
Figure 1. Sampling sites for the water analysis in Limpopo Province, South Africa. (A): South Africa map; (B): Limpopo map; (C): sampling sites (Table S1: site number: 1–21; red dots).
Environments 12 00174 g001
Figure 2. Piper diagram of the borehole water samples from Mankweng and Dalmada, Limpopo Province, South Africa. [A: calcium type; B, H: no dominant type; C: magnesium type; D: sodium type; E: bicarbonate type; F: sulfate type; G: chloride type].
Environments 12 00174 g002
Figure 3. Correlation of the physicochemical properties of the water samples from Mankweng and Dalmada, Limpopo Province, South Africa. All measurements were expressed in mg/L, except for electrical conductivity (EC), which was measured in mS/m.
Environments 12 00174 g003
Figure 4. Principal component analysis (PCA) of the relationship between the physicochemical and the sampling location from Mankweng and Dalmada, Limpopo Province, South Africa.
Environments 12 00174 g004
Table 1. General characteristics of groundwater studied from Mankweng and Dalmada, Limpopo Province, South Africa. The amount of the measures is mg/mL, except for EC, which is mS/m [- = zero or not detected].
LocationMankwengMankwengMankwengMankwengMankwengMankwengMankwengMankwengMankwengMankwengMankweng
Sample codeMankanye-TFrans-MBH-3Bankoeng BH-1Mankoeng BH5Makanye-BHKlas-MBHMankoeng-TKlas-M-TW3Mankoeng-TW3Sogoreng-BH-1Klass BH5
pH8.408.068.157.937.587.048.337.667.297.887.38
EC63.30104.20115.50114.8080.8061.0063.104.006.63112.9064.50
TDS411.45677.30750.80746.20525.20396.50410.1526.0043.10733.85419.25
TH119.27146.04284.14237.78238.33168.64116.6516.4721.28321.75190.88
F0.401.730.680.780.650.420.390.000.001.390.51
Cl22.2167.2053.2864.1060.9344.2522.044.895.73111.4958.06
SO47.2217.3154.3458.0740.8424.217.570.311.5943.2628.72
K1.785.891.941.8715.098.021.750.680.914.877.86
Ca17.2225.1649.2234.9246.7529.8016.835.455.3066.4735.53
Mg18.5020.1839.1036.5229.4822.8518.100.691.9537.7624.77
Na94.22169.69151.86140.5364.4253.5293.673.326.31121.3051.85
Zn-0.010.03-0.100.58---0.140.27
Pb0.010.010.01-0.010.01---0.010.01
Mn-0.01-------0.02-
V0.060.070.110.140.080.060.060.000.000.100.09
Cu---0.01-----0.010.01
Fe---0.00-------
Ni---0.45------0.01
B-0.140.030.05-----0.030.03
Se0.160.550.632.05-0.180.190.200.230.230.06
Ba0.020.050.030.010.060.030.020.020.020.040.03
Si6.5114.119.929.6012.0013.176.361.601.997.5212.53
LocationDalmadaDalmadaDalmadaDalmadaDalmadaDalmadaDalmadaControlPolokwaneMagobeskloof
Sample codeBaskopDG-1 26D22D34D56B51D136DWFilip-N12River-M
pH7.327.407.317.627.547.837.357.637.117.82
EC116.704.92123.40104.4099.5097.10129.400.901.305.73
TDS758.5531.98802.10678.60646.75631.15841.105.858.4537.24
TH519.3516.17462.64431.41404.94423.10583.04--23.95
F0.17-0.100.080.100.11----
Cl84.094.1816.6729.4057.9457.5378.620.072.132.98
SO418.420.59228.3873.9645.9543.5045.060.140.600.53
K7.040.9610.987.3412.306.166.160.150.100.77
Ca14.594.9040.9446.4151.7642.4039.61-2.308.50
Mg117.200.9587.4576.5566.8876.97117.48-0.000.66
Na21.152.6765.5536.6845.7933.4921.78-1.982.91
Zn0.010.250.020.010.020.010.02--0.01
Pb0.01-0.010.010.01-0.01---
Mn0.000.01--------
V0.560.010.430.370.260.310.59---
Al---------0.04
Cr--0.030.010.01-----
Cu-0.010.000.010.030.030.02--0.01
Fe-0.08-------0.12
Ni0.01-0.01-0.010.010.02--0.10
B0.02-0.220.100.080.040.04--0.01
Se2.161.211.881.750.730.441.260.46-0.42
Ba0.170.010.090.040.090.080.08--0.04
Si10.281.7012.2310.6613.8612.8513.11-0.182.38
Electrical conductivity as EC; total dissolved solids as TDS; total hardness as TH; fluoride as F; chloride as Cl; sulfate as SO4; potassium as K; calcium as Ca; magnesium as Mg; sodium as Na; zinc as Zn; lead as Pb; manganese as Mn; vanadium as V; aluminum as Al; chromium as Cr; copper as Cu; iron as Fe; nickel as Ni; boron as B; selenium as Se; barium as Ba; silica as Si.
Table 2. Water quality indices for the groundwater samples from Mankweng and Dalmada, Limpopo Province, South Africa. [sodium adsorption ratio (SAR); soluble sodium percentage (SSP); Magnesium adsorption ratio (MAR); Kelley’s ratio (KR)].
Sample LocationSample CodeSample Depth (m)SARSSPMARKRNa/Ca
MankwengMankanye-T7022.372.951.824.05.5
MankwengFrans-MBH-37035.679.544.526.96.7
MankwengBankoeng-BH-17022.963.544.342.23.1
MankwengMankoeng BH57023.566.651.140.54.0
MankwengMakanye-BH7010.451.138.730.91.4
MankwengKlas-MBH7010.453.943.424.61.8
MankwengMankoeng-T7022.473.251.823.75.6
MankwengKlas-M-TW3701.939.411.21.30.6
MankwengMankoeng-TW3703.349.926.93.11.2
MankwengSogoreng-BH-17016.854.836.239.61.8
MankwengKlass BH5709.449.841.126.21.5
DalmadaBaskop1002.617.688.9118.61.4
DalmadaDG-126501.638.316.21.50.5
DalmadaD22608.237.368.189.11.6
DalmadaD341204.726.462.377.30.8
DalmadaD561805.932.956.467.80.9
DalmadaB51554.324.964.577.80.8
DalmadaD136702.515.174.8118.00.5
PolokwaneFilip-N12701.847.50.00.90.9
MagoebaskloofRiver-M11.428.77.21.00.3
Table 3. Contribution of the variables (%) of the water samples from Mankweng and Dalmada, Limpopo Province, South Africa.
PropertiesF1F2
pH0.0016.379
EC9.4030.570
TDS9.4030.570
Total Hardness8.8651.478
F0.98217.844
Cl5.5963.801
SO44.7211.752
K5.6110.076
Ca6.6441.795
Mg7.6033.536
Na1.92313.603
Zn0.0091.700
Pb4.0253.613
Mn0.0137.973
V6.5595.415
Al1.4191.178
Cr2.3383.298
Cu2.4940.975
Fe2.1621.256
Ni0.0210.000
B4.3720.404
Se2.7065.130
Ba5.0843.089
Si8.0390.767
Table 4. Factor score of the water samples from Mankweng and Dalmada, Limpopo Province, South Africa.
LocationSample CodeF1F2
MankwengMankanye-T−1.4871.569
MankwengFrans-MBH-31.7174.543
MankwengBankoeng-BH-11.2602.214
MankwengMankoeng-BH51.1720.675
MankwengMakanye-BH1.1380.928
MankwengKlas-MBH−0.1761.765
MankwengMankoeng-T−1.5671.518
MankwengKlas-M-TW3−3.933−0.349
MankwengMankoeng-TW3−3.825−1.062
MankwengSogoreng-BH-12.1574.071
MankwengKlass-BH50.3780.890
DalmadaBaskop3.320−2.428
DalmadaDG-126−4.007−0.956
DalmadaD225.128−3.238
DalmadaD342.524−1.703
DalmadaD563.512−1.089
DalmadaB512.018−1.230
DalmadaD1363.841−2.135
TurfloopDW−4.276−0.950
PolokwaneN12−4.300−1.114
MagoebaskloofRiver-M−4.596−1.919
Table 5. Total coliform (TC) and E. coli in the water samples from Mankweng and Dalmada, Limpopo Province, South Africa.
Location.Sample CodeTC (cfu/100 mL)E. coli (cfu/100 mL)
MankwengMankanye-T<1<1
MankwengFrans-MBH-3<1<1
MankwengBankoeng-BH-1>201<1
MankwengMankoeng-BH5>201<1
MankwengMakanye-BH<1<1
MankwengKlas-MBH>201<1
MankwengMankoeng-T<1<1
MankwengKlas-M-TW3<1<1
MankwengMankoeng-TW3<1<1
MankwengSogoreng-BH-1<1<1
MankwengKlass-BH5<1<1
DalmadaBaskop>2011
DalmadaDG-126<1<1
DalmadaD22>201<1
DalmadaD3436<1
DalmadaD5695<1
DalmadaB51118<1
DalmadaD136>201<1
TurfloopDW<1<1
PolokwaneN124<1
MagoebaskloofRiver-M>201<1
Disclaimer/Publisher’s Note: The statements, opinions and data contained in all publications are solely those of the individual author(s) and contributor(s) and not of MDPI and/or the editor(s). MDPI and/or the editor(s) disclaim responsibility for any injury to people or property resulting from any ideas, methods, instructions or products referred to in the content.

