
Bridging the Gap: Evaluating Farmers’ Sustainability Perceptions, Their Agricultural Practices, and Measured Soil Indicators Towards Promoting a Sustainable Viticulture

 ,
,  ,
,
Abstract
1. Introduction
2. Materials and Methods
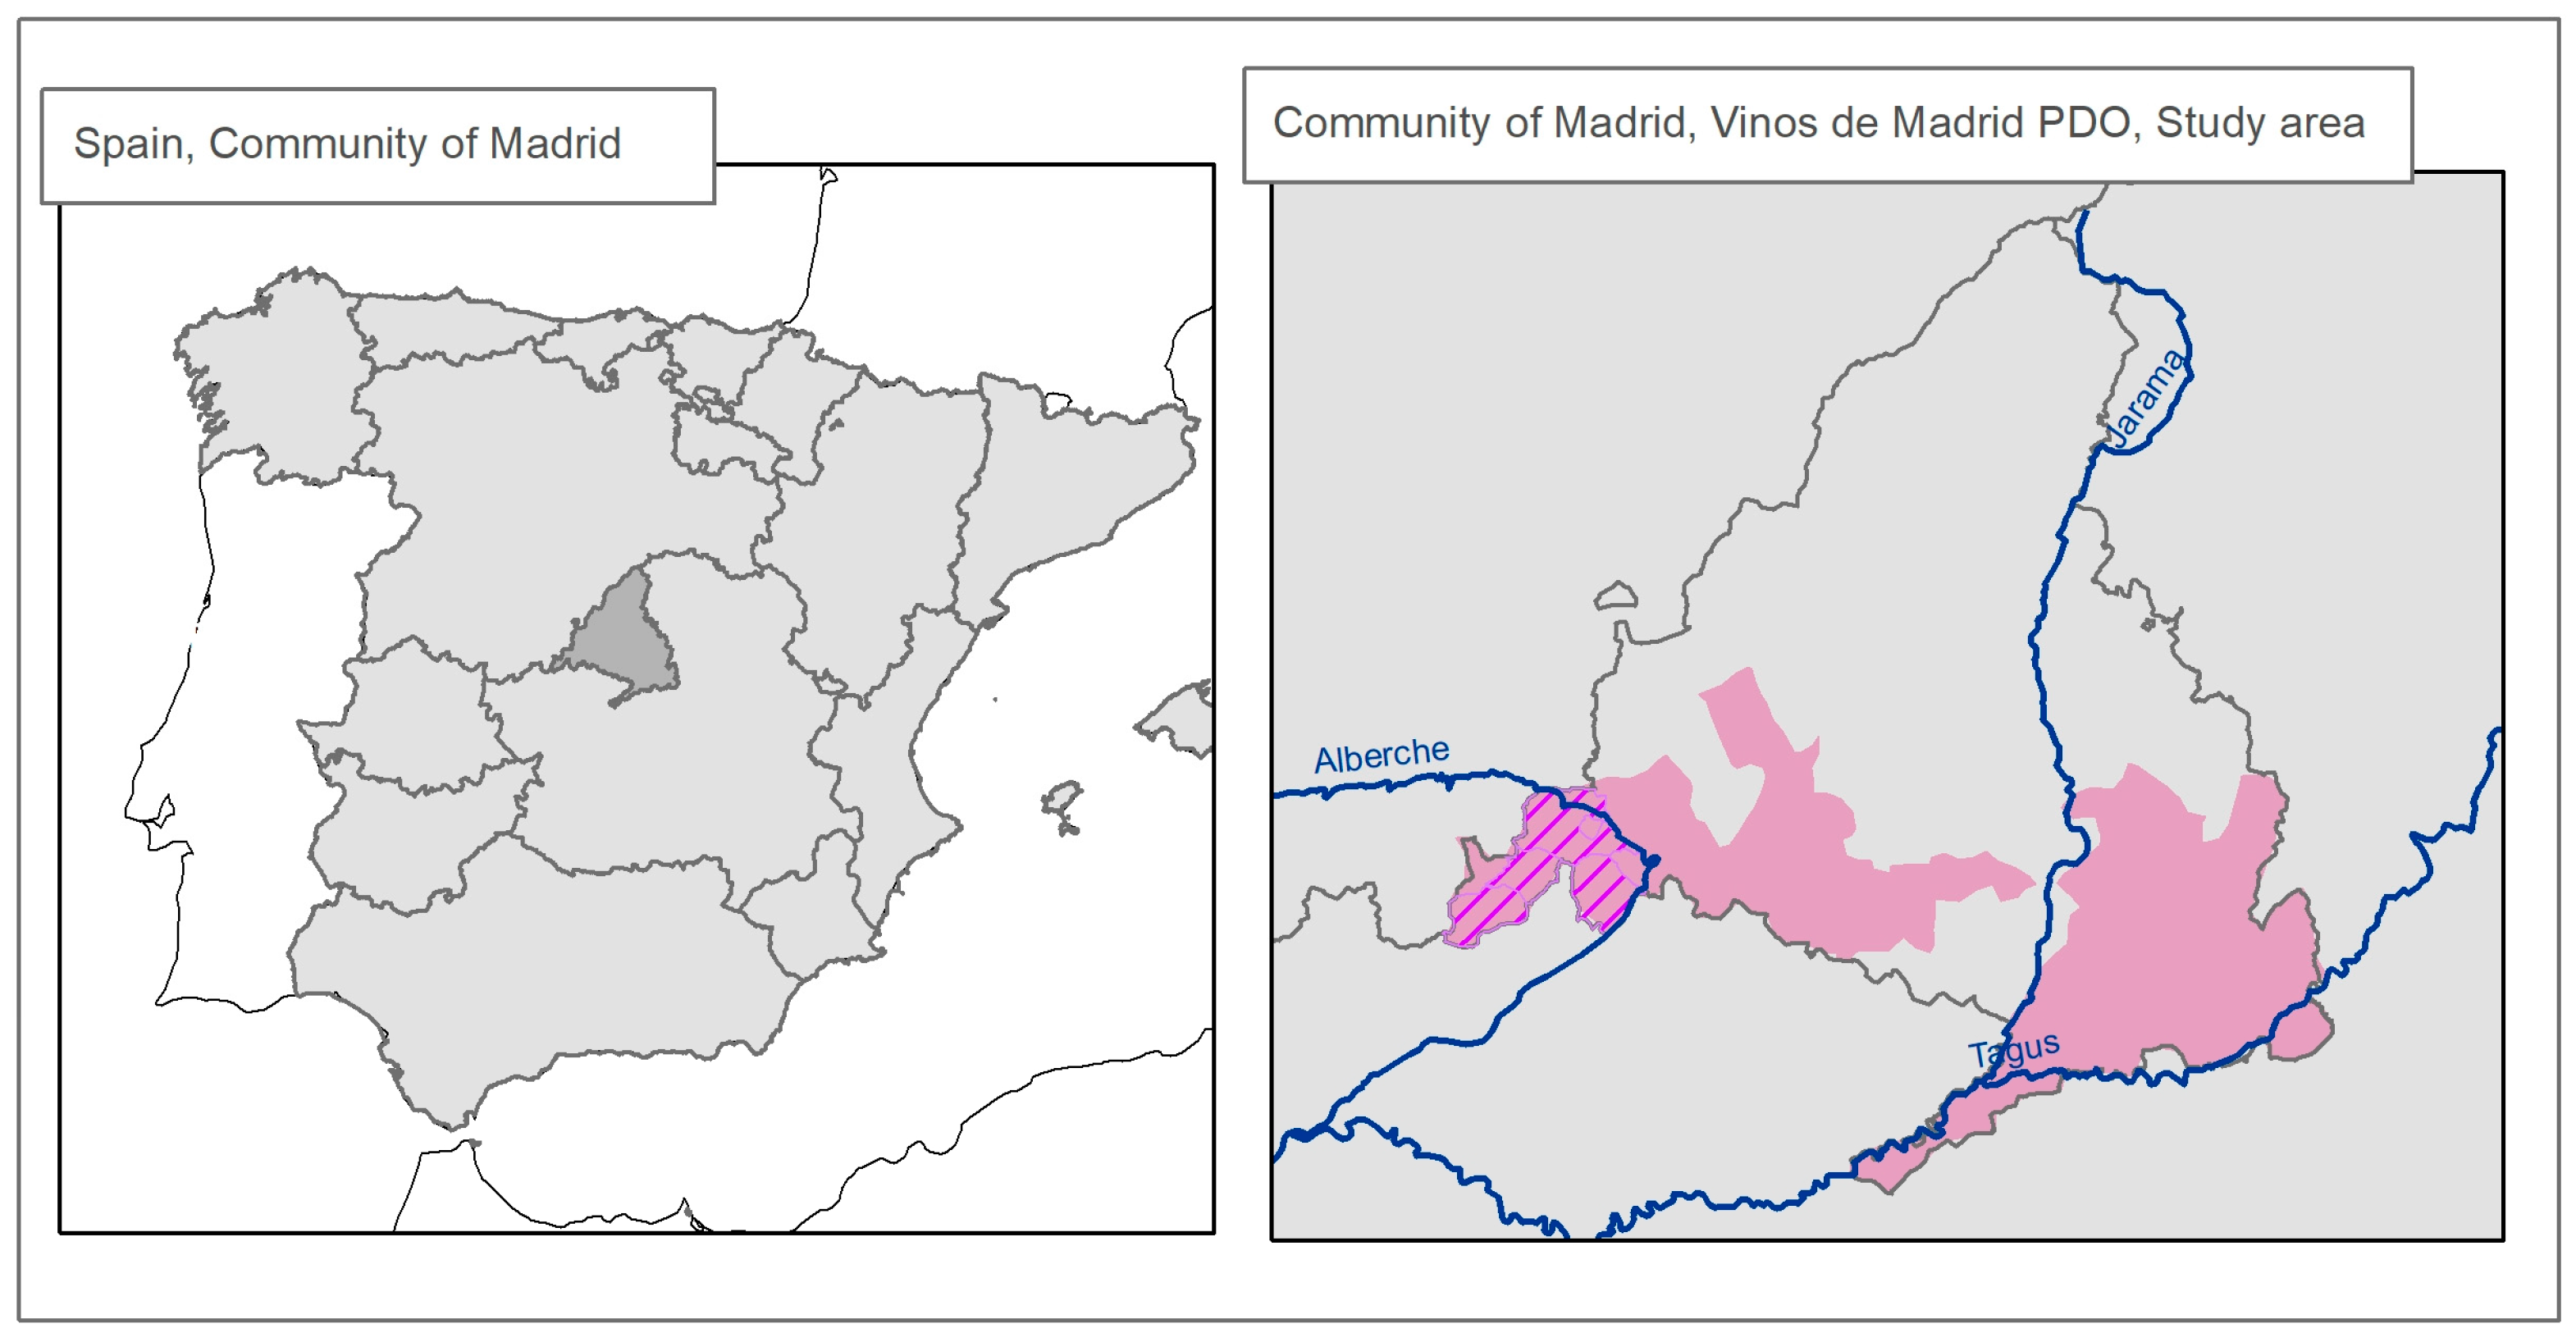
2.1. Site Description
2.2. Study Design
2.2.1. Chemical and Physical Soil Analyses
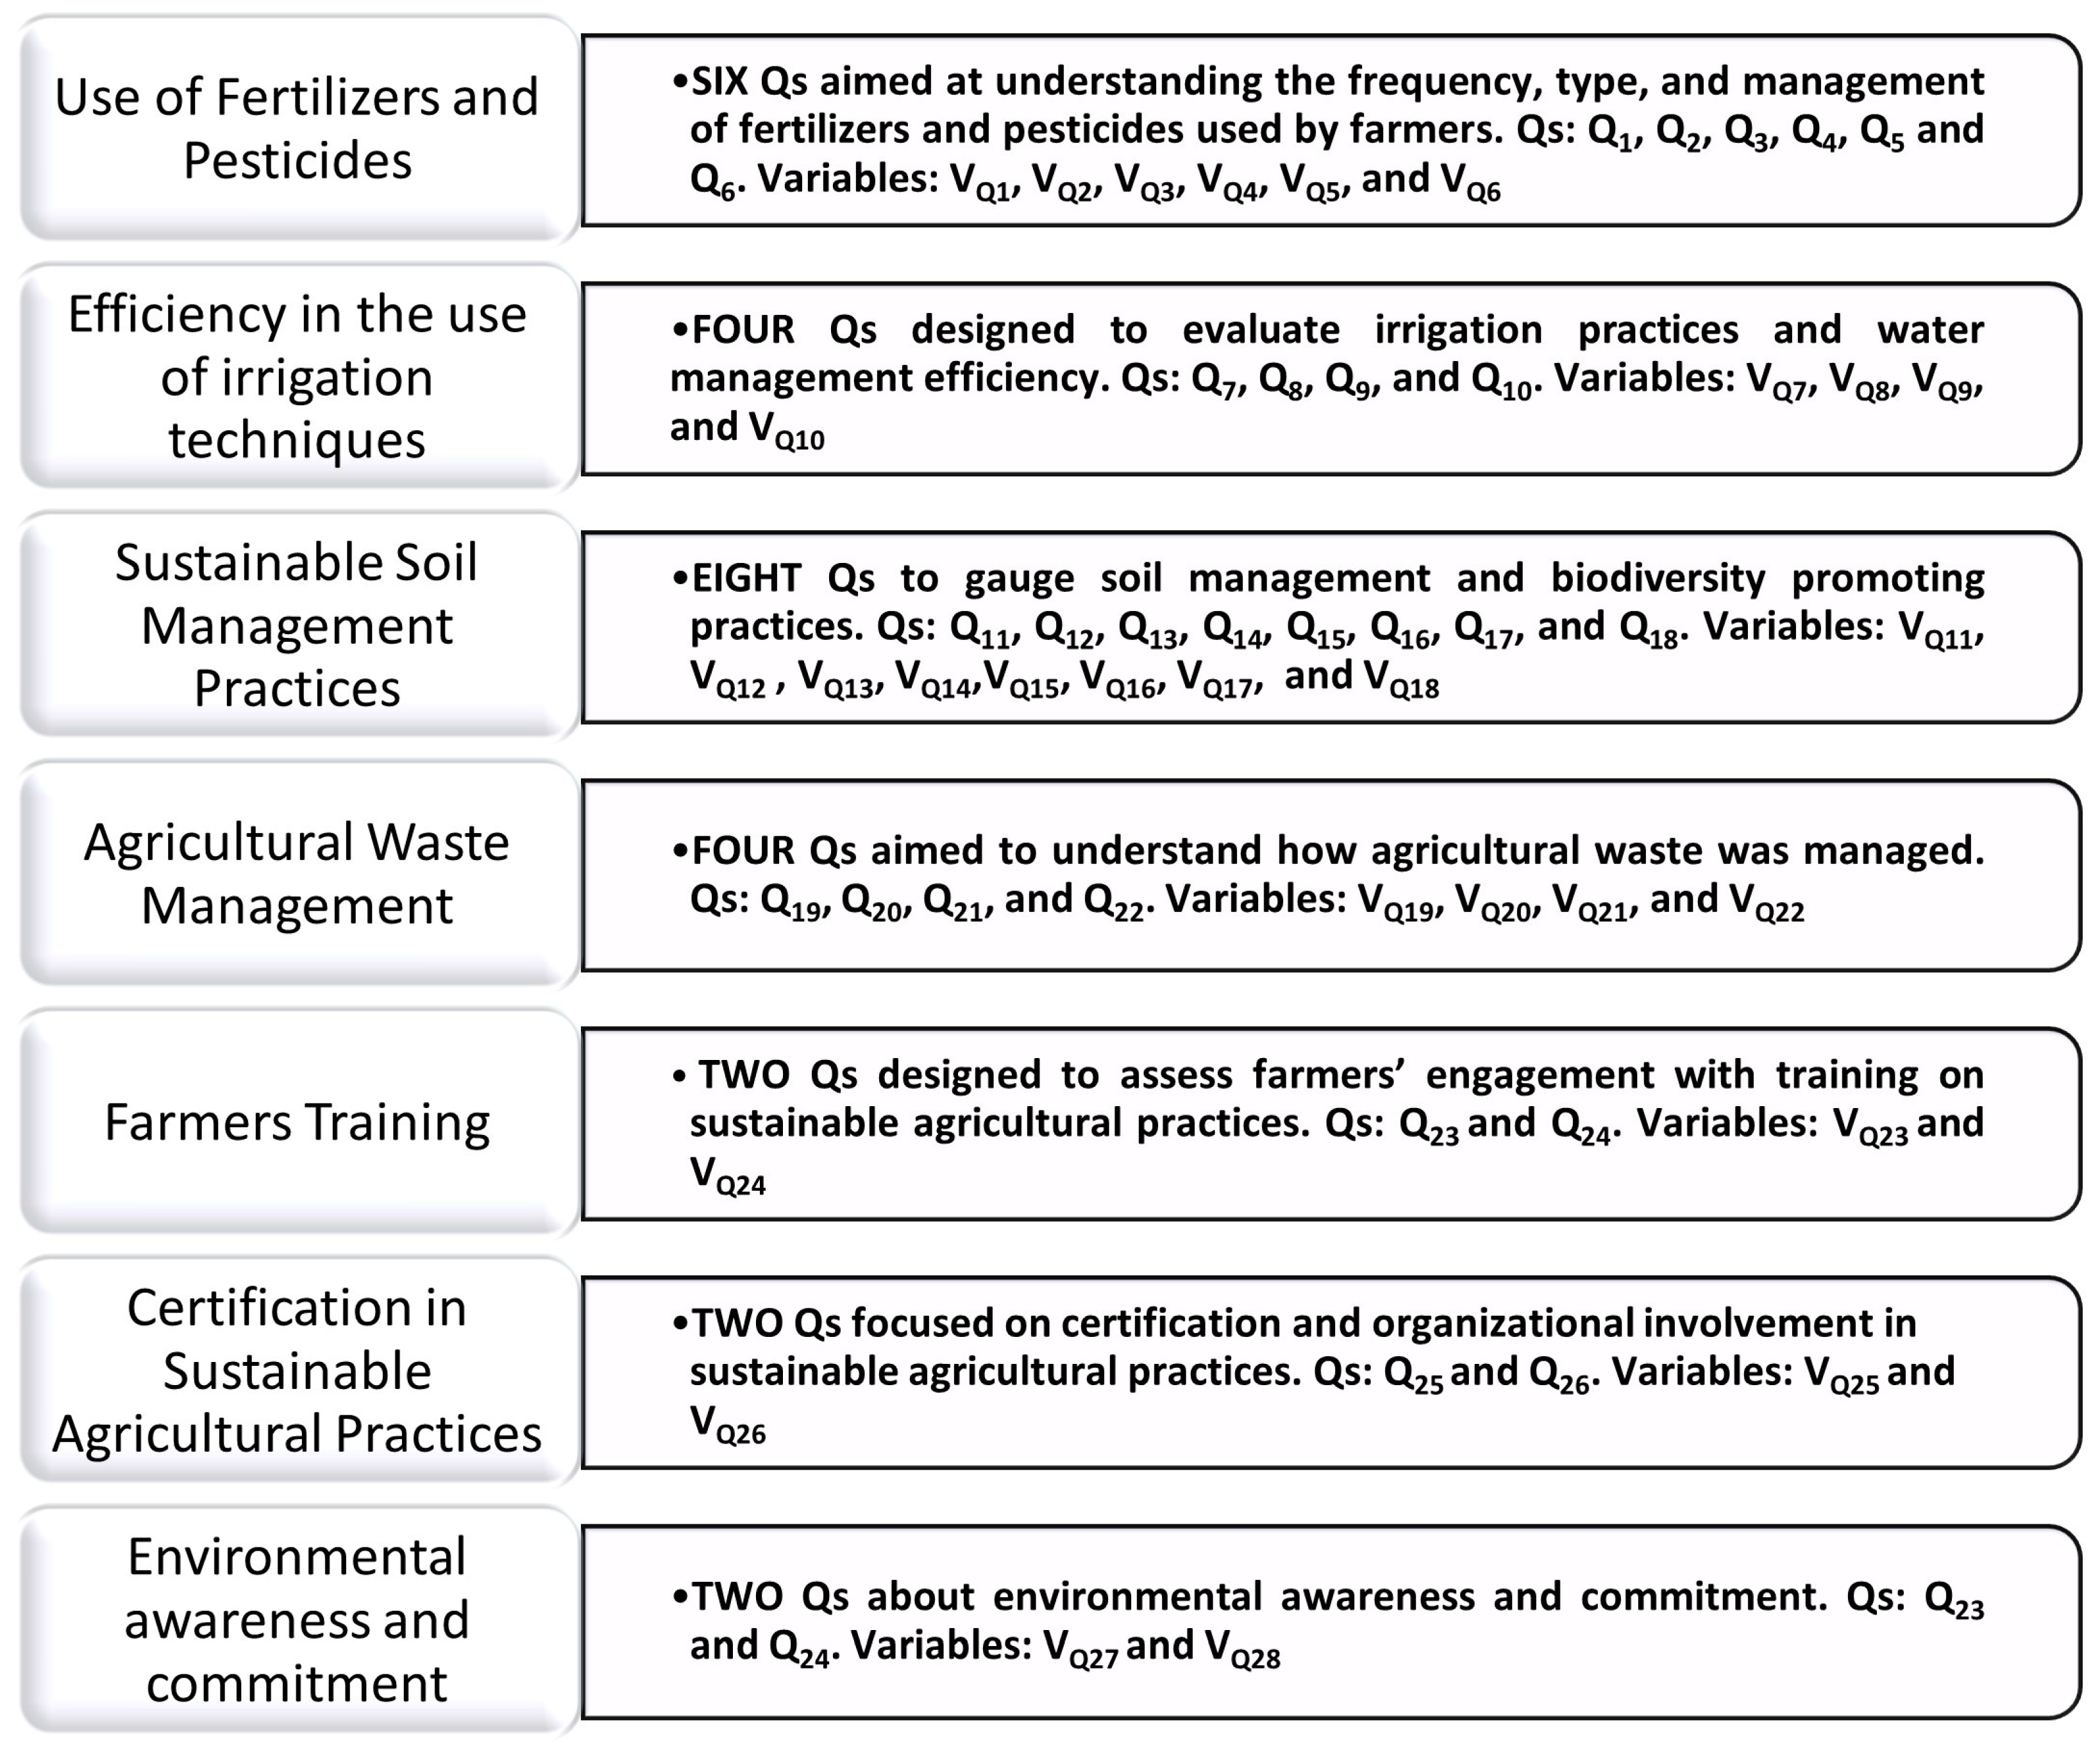
2.2.2. Agri-Environmental Practices Questionnaire
3. Results
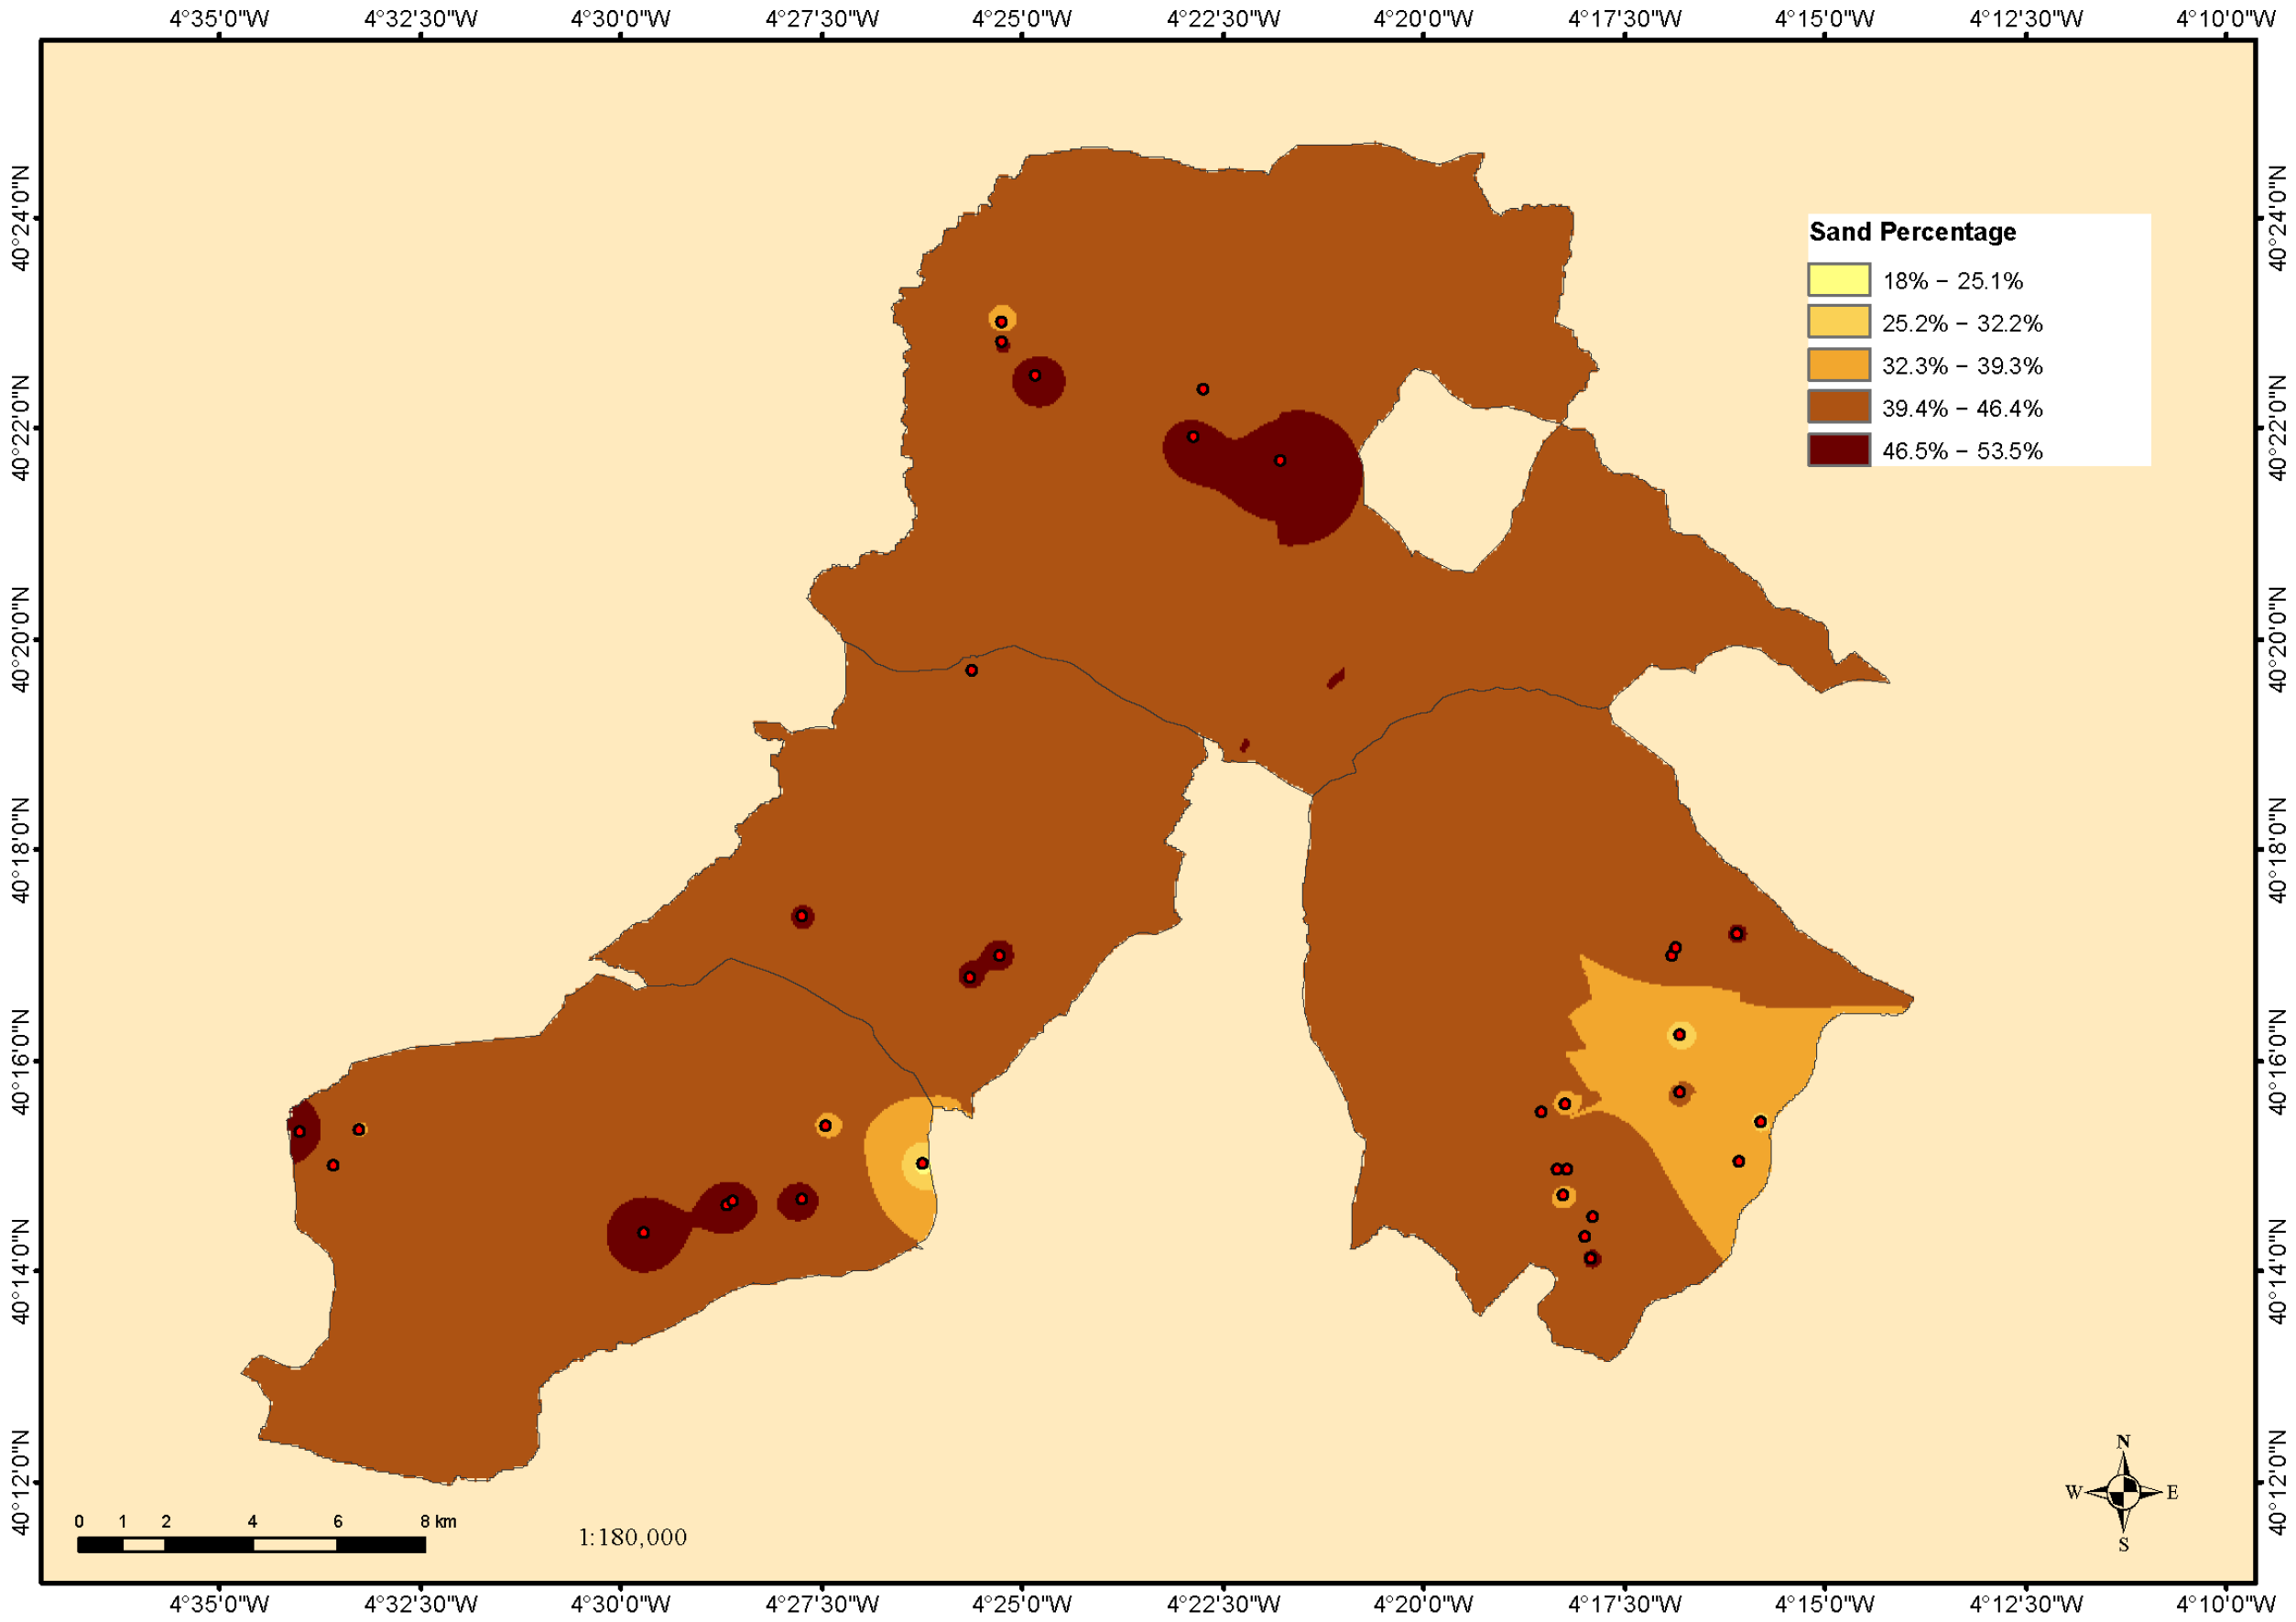
3.1. Soil Composition Analysis
3.2. Survey Responses and Soil Data
3.2.1. Survey Pesticide Application Frequency Responses and Heavy Metal Levels
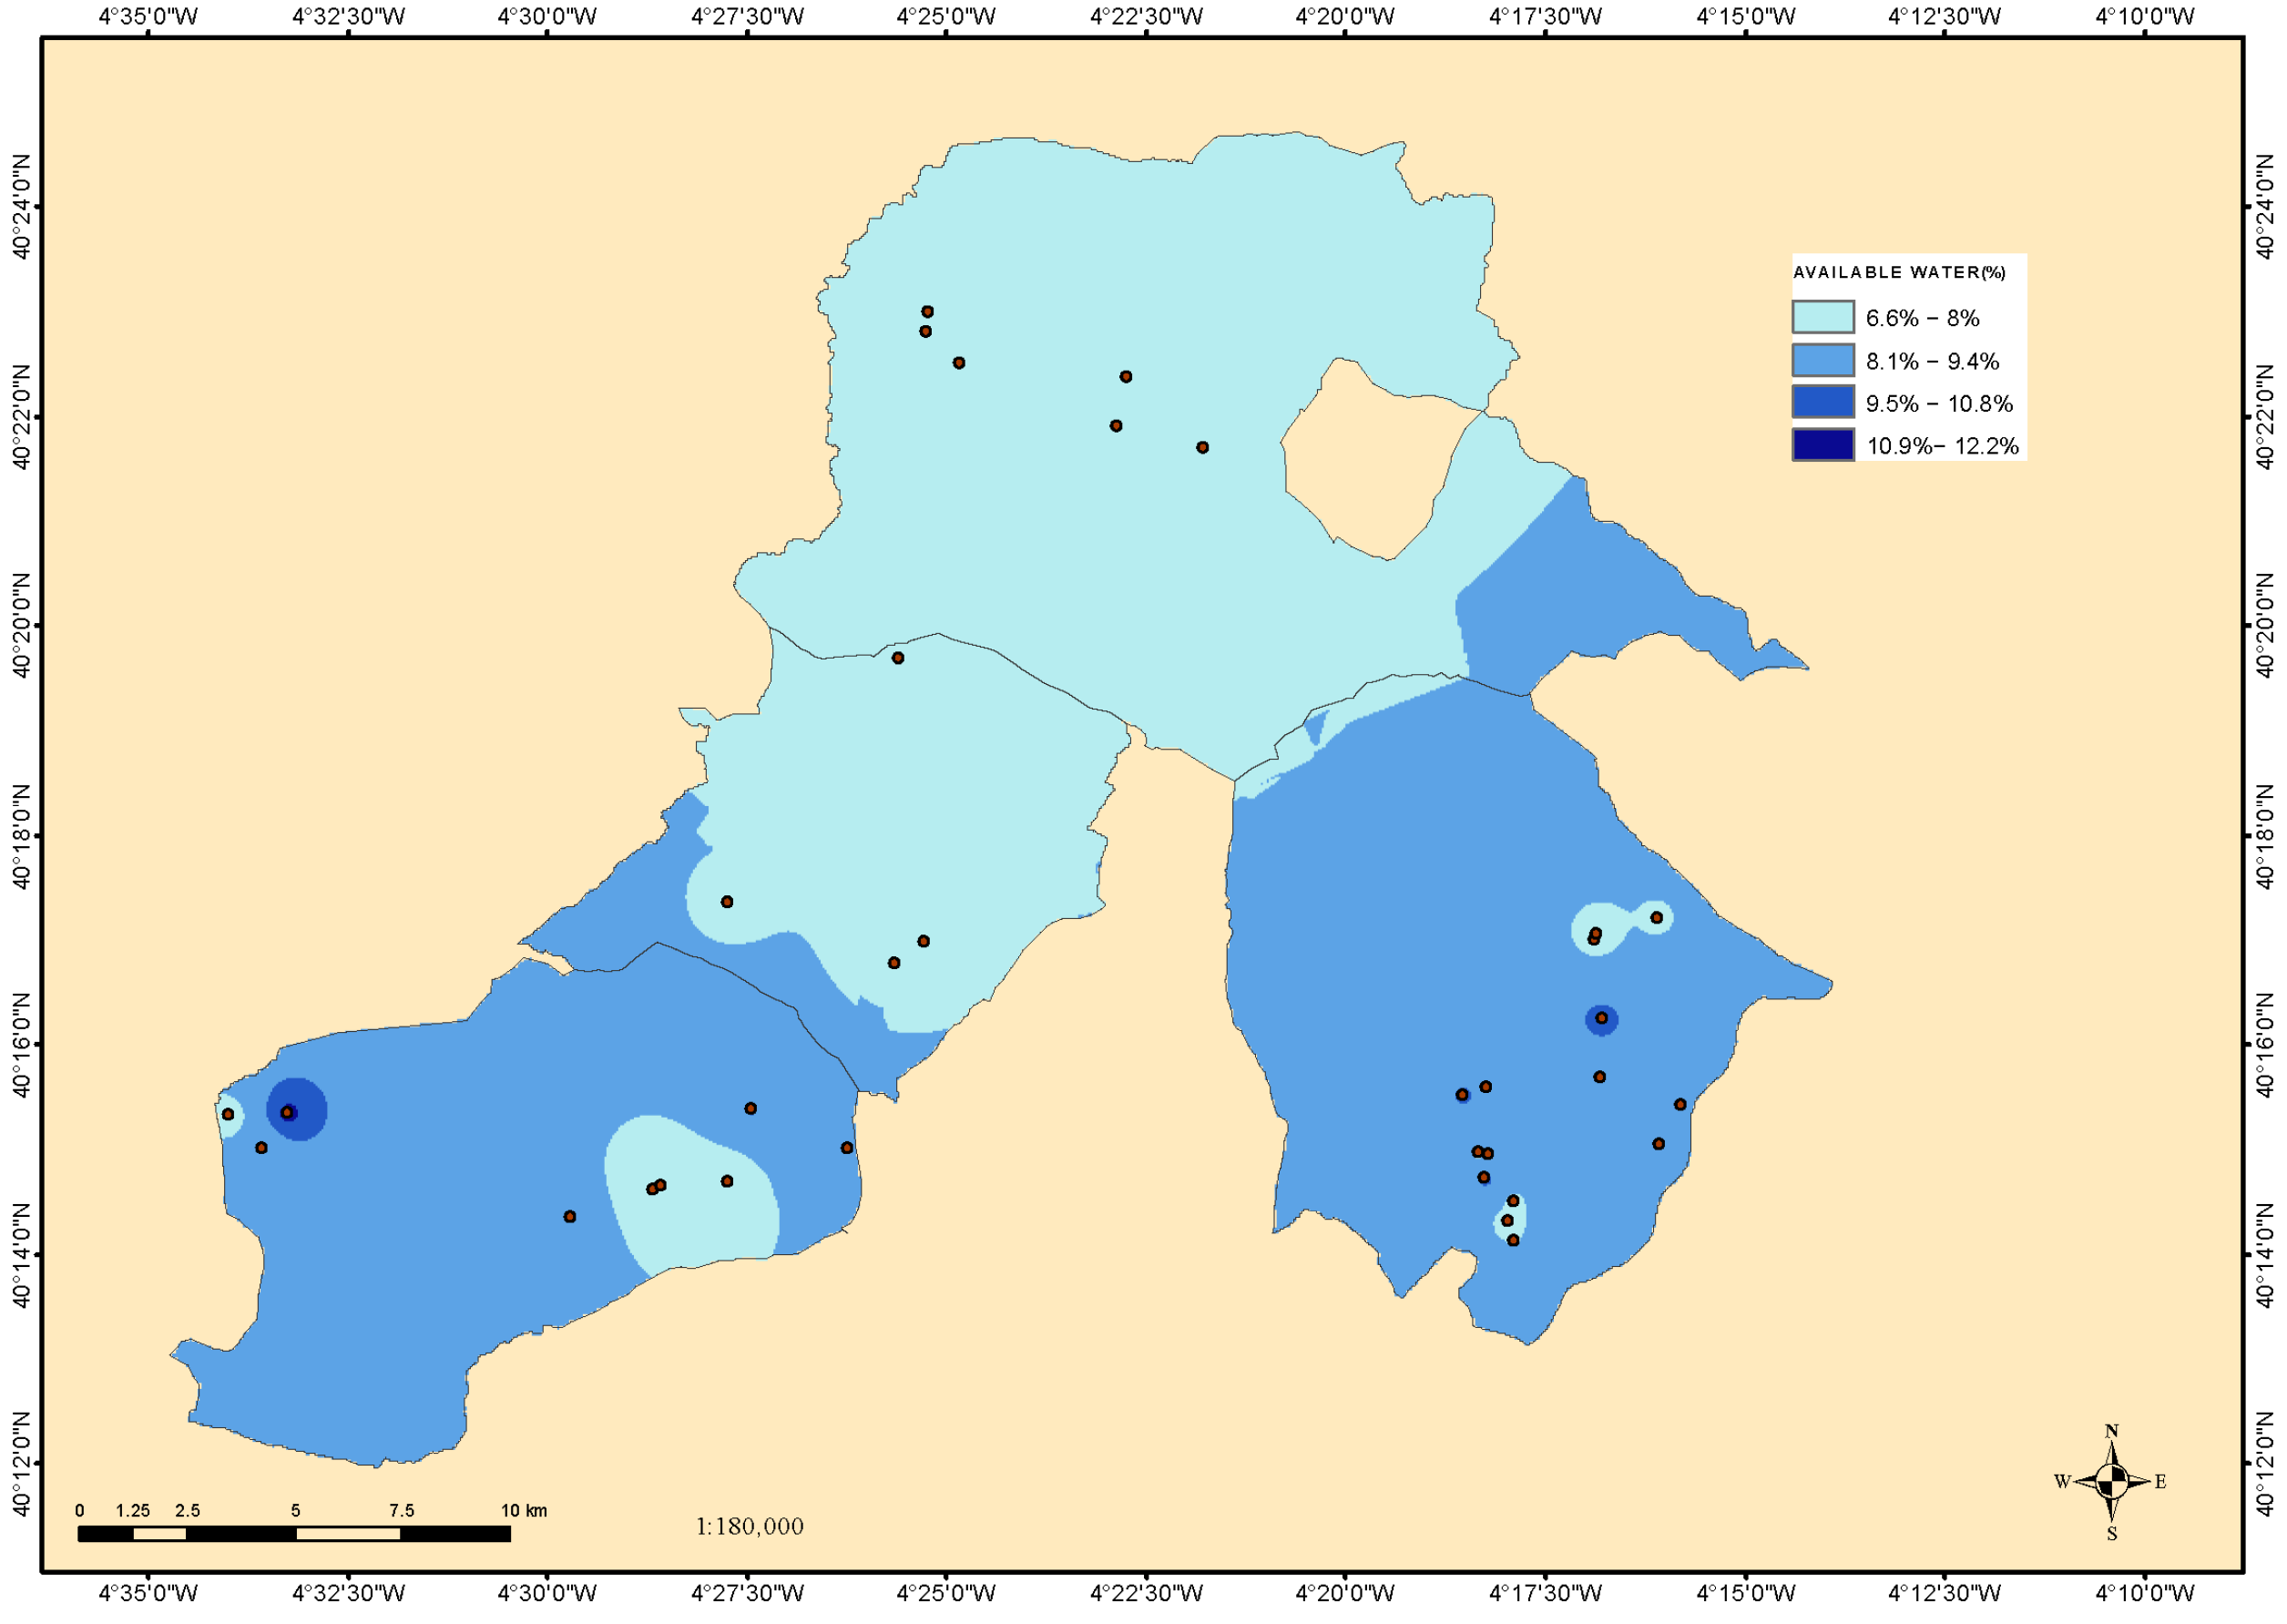
3.2.2. Survey Irrigation Practices Responses and Soil Moisture Retention
3.2.3. Survey Sustainable Practices Responses and Soil Health
4. Discussion
Strength and Limitation of the Study
5. Conclusions
Author Contributions
Funding
Data Availability Statement
Conflicts of Interest
Appendix A. Data on the Soils of the Vineyards Plots
| Order | Vineyard Plot | pH | EC (µS/cm) | Sand (%) | Silt (%) | Clay (%) | Texture | Field Capacity (%) | Wilting Point (%) | Plant Available Water (%) |
| 1 | CEN-P23-16-2V | 4.54 | 153 | 50 | 44 | 6 | Sandy Loam | 19.9 | 10.8 | 9.1 |
| 2 | VILLA P44-117-117-VI | 5.84 | 49 | 40 | 40 | 20 | Loam | 23.0 | 12.5 | 10.5 |
| 3 | VILLA P22-22-1-OL | 5.77 | 37 | 56 | 40 | 4 | Sandy Loam | 15.8 | 8.6 | 7.2 |
| 4 | VILLA P22-69-1-VI | 6.19 | 73 | 44 | 52 | 4 | Silt Loam | 16.5 | 9.0 | 7.6 |
| 5 | VILLA P9-86-1-VI | 6.39 | 32 | 44 | 54 | 2 | Silt Loam | 15.0 | 8.2 | 6.9 |
| 6 | P15-35-3-V | 6.08 | 147 | 36 | 60 | 4 | Silt Loam | 21.7 | 11.8 | 9.9 |
| 7 | VILLA P43-102-1-VI | 6.34 | 33 | 48 | 48 | 4 | Sandy Loam | 15.1 | 8.2 | 6.9 |
| 8 | VILLA P40-97-OL | 6.07 | 41 | 44 | 52 | 4 | Silt Loam | 17.4 | 9.5 | 7.9 |
| 9 | P39-37-1-VI | 6.22 | 33 | 28 | 56 | 16 | Silt Loam | 24.2 | 13.2 | 11.0 |
| 10 | CEN P19-2-VI | 5.96 | 34 | 52 | 44 | 4 | Sandy Loam | 14.6 | 7.9 | 6.7 |
| 11 | CAD P4-24-2-VI | 5.83 | 56 | 44 | 52 | 4 | Silt Loam | 16.6 | 9.0 | 7.6 |
| 12 | P17-29-2-VI | 7.65 | 87 | 32 | 64 | 4 | Silt Loam | 19.5 | 10.6 | 8.9 |
| 13 | VILLA P22-10-1-OL | 5.65 | 50 | 40 | 56 | 4 | Silt Loam | 17.1 | 9.3 | 7.8 |
| 14 | SMV-P51-162-1-VI | 5.91 | 31 | 28 | 70 | 2 | Silt Loam | 18.5 | 10.0 | 8.4 |
| 15 | CEN-P18-111-1-VI | 5.34 | 59 | 48 | 48 | 4 | Sandy Loam | 16.0 | 8.7 | 7.3 |
| 16 | SMV-P58-157-VI | 6.02 | 27 | 44 | 52 | 4 | Sandy Loam | 16.0 | 8.7 | 7.3 |
| 17 | CEN-P18-111-1-VI | 5.84 | 34 | 48 | 49 | 3 | Sandy Loam | 15.3 | 8.3 | 7.0 |
| 18 | SMV PS1-54-1-VI | 6.01 | 22 | 52 | 44 | 4 | Sandy Loam | 14.7 | 8.0 | 6.7 |
| 19 | SMV P36-392-1-VI | 6.35 | 17 | 48 | 50 | 2 | Sandy Loam | 14.3 | 7.8 | 6.5 |
| 20 | CEN-P2-24-1-VI | 5.97 | 40 | 36 | 46 | 18 | Loam | 27.4 | 14.9 | 12.5 |
| 21 | CAD P15-54-3-VI | 5.96 | 50 | 48 | 48 | 4 | Sandy Loam | 17.2 | 9.3 | 7.8 |
| 22 | CEN P14-53-3-VI | 6.08 | 46 | 16 | 82 | 2 | Loam | 19.7 | 10.7 | 9.0 |
| 23 | SMV P50-90-1-VI | 6.63 | 50 | 52 | 46 | 2 | Sandy Loam | 14.6 | 7.9 | 6.6 |
| 24 | CEN P1-76-3-VI | 6.43 | 54 | 54 | 44 | 2 | Sandy Loam | 14.3 | 7.8 | 6.5 |
| 25 | SMV P36-392-1-VI | 6.33 | 20 | 48 | 48 | 4 | Sandy Loam | 17.0 | 9.2 | 7.8 |
| 26 | VILLA P39-29-1-VI | 6.24 | 57 | 20 | 63 | 17 | Silt Loam | 24.6 | 13.3 | 11.2 |
| 27 | VILLA P43-96-VI | 6.38 | 51 | 52 | 44 | 4 | Sandy Loam | 17.3 | 9.4 | 7.9 |
| 28 | VILLA P9-119-1-VI | 6.39 | 42 | 44 | 54 | 2 | Loam | 16.1 | 8.7 | 7.3 |
| 29 | CEN P1-11-1-VI | 5.8 | 57 | 44 | 53 | 3 | Loam | 17.5 | 9.5 | 8.0 |
| 30 | VILLA P17-76-VI-OL | 6.39 | 31 | 28 | 64 | 8 | Silt Loam | 20.7 | 11.2 | 9.4 |
| 31 | VILLA P10-35-VI | 6.2 | 36 | 52 | 46 | 2 | Sandy Loam | 16.3 | 8.9 | 7.4 |
| 32 | CAD P17-27-1-VI | 5.6 | 64 | 48 | 50 | 2 | Sandy Loam | 15.9 | 8.6 | 7.2 |
| 33 | P26-138-4-VI-OL | 6.01 | 32 | 48 | 50 | 2 | Sandy Loam | 16.6 | 9.0 | 7.6 |
| 34 | VILLA P44-112-VI | 6.02 | 38 | 36 | 60 | 4 | Silt Loam | 18.3 | 10.0 | 8.4 |
| Order | Vineyard Plot | N (%) | P mg/kg | C Org (%) | OM Easy (%) | TOM (%) | K mg/kg | Cu mg/k | Ni mg/k | Zn mg/kg | Cr mg/kg | Cd mg/kg | Pb mg/kg |
| 1 | CEN-P23-16-2V | 0.06 | 228 | 1.36 | 2.35 | 2.91 | 4156 | 0.00 | 0 | 0 | 0 | 0 | 0 |
| 2 | VILLA P44-117-117-VI | 0.07 | 86 | 0.76 | 1.31 | 3.84 | 2022 | 0.03 | 139 | 10 | 0 | 0 | 0 |
| 3 | VILLA P22-22-1-OL | 0.09 | 12 | 0.77 | 1.33 | 4.03 | 2334 | 0.00 | 0 | 145 | 0 | 0 | 0 |
| 4 | VILLA P22-69-1-VI | 0.04 | 73 | 0.57 | 0.99 | 1.78 | 1571 | 0.00 | 0 | 2.1 | 0 | 0 | 0 |
| 5 | VILLA P9-86-1-VI | 0.03 | 39 | 0.38 | 0.66 | 1.92 | 1376 | 0.00 | 0 | 0 | 0 | 0 | 0 |
| 6 | P15-35-3-V | 0.13 | 108 | 1.48 | 2.55 | 5.41 | 3511 | 0.00 | 0 | 0 | 0 | 0 | 0 |
| 7 | VILLA P43-102-1-VI | 0.04 | 81 | 0.38 | 0.66 | 1.68 | 1602 | 0.00 | 0 | 0 | 0 | 0 | 0 |
| 8 | VILLA P40-97-OL | 0.08 | 31 | 0.77 | 1.32 | 2.55 | 1328 | 0.00 | 0 | 0 | 0 | 0 | 0 |
| 9 | P39-37-1-VI | 0.08 | 35 | 0.94 | 1.61 | 3.85 | 3125 | 0.00 | 0 | 1.0 | 0 | 0 | 0 |
| 10 | CEN P19-2-VI | 0.05 | 52 | 0.39 | 0.67 | 3.90 | 4076 | 0.00 | 0 | 0 | 0 | 0 | 0 |
| 11 | CAD P4-24-2-VI | 0.06 | 400 | 0.58 | 1.01 | 3.44 | 6258 | 0.00 | 0 | 0 | 0 | 0 | 0 |
| 12 | P17-29-2-VI | 0.14 | 103 | 0.86 | 1.49 | 3.94 | 2818 | 0.00 | 0 | 0 | 0 | 0 | 0 |
| 13 | VILLA P22-10-1-OL | 0.08 | 174 | 0.58 | 1.00 | 3.70 | 1740 | 0.00 | 0 | 0 | 0 | 0 | 0 |
| 14 | SMV-P51-162-1-VI | 0.04 | 16 | 0.65 | 1.12 | 2.79 | 5721 | 0.00 | 0 | 0 | 0 | 0 | 0 |
| 15 | CEN-P18-111-1-VI | 0.05 | 200 | 0.59 | 1.01 | 3.54 | 4006 | 0.00 | 0 | 0 | 0 | 0 | 0 |
| 16 | SMV-P58-157-VI | 0.03 | 1073 | 0.46 | 0.79 | 1.89 | 3416 | 0.01 | 0 | 0 | 0 | 0 | 0 |
| 17 | CEN-P18-111-1-VI | 0.07 | 543 | 0.49 | 0.84 | 2.64 | 2458 | 0.00 | 0 | 0 | 0 | 0 | 0 |
| 18 | SMV PS1-54-1-VI | 0.03 | 625 | 0.41 | 0.70 | 1.98 | 6262 | 0.00 | 0 | 0 | 0 | 0 | 0 |
| 19 | SMV P36-392-1-VI | 0.04 | 412 | 0.34 | 0.58 | 1.64 | 5308 | 0.00 | 0 | 0 | 0 | 0 | 0 |
| 20 | CEN-P2-24-1-VI | 0.06 | 516 | 1.76 | 3.03 | 3.37 | 2347 | 0.00 | 0 | 0 | 0 | 0 | 0 |
| 21 | CAD P15-54-3-VI | 0.06 | 417 | 0.84 | 1.44 | 4.22 | 899 | 0.00 | 0 | 0 | 0 | 0 | 0 |
| 22 | CEN P14-53-3-VI | 0.06 | 886 | 0.56 | 0.96 | 2.58 | 3865 | 0.00 | 0 | 0 | 0 | 0 | 0 |
| 23 | SMV P50-90-1-VI | 0.04 | 330 | 0.52 | 0.89 | 3.19 | 1531 | 0.00 | 0 | 0 | 0 | 0 | 0 |
| 24 | CEN P1-76-3-VI | 0.05 | 408 | 0.52 | 0.89 | 3.15 | 4219 | 0.00 | 0 | 11 | 0 | 0 | 0 |
| 25 | SMV P36-392-1-VI | 0.03 | 242 | 0.80 | 1.37 | 2.06 | 4808 | 0.00 | 0 | 79 | 0 | 0 | 0 |
| 26 | VILLA P39-29-1-VI | 0.05 | 26 | 0.70 | 1.20 | 5.04 | 4534 | 0.00 | 0 | 0 | 0 | 0 | 0 |
| 27 | VILLA P43-96-VI | 0.06 | 26 | 1.00 | 1.72 | 2.55 | 600 | 0.08 | 0 | 0 | 0 | 0 | 0 |
| 28 | VILLA P9-119-1-VI | 0.04 | 102 | 0.61 | 1.05 | 1.84 | 886 | 0.00 | 0 | 0 | 0 | 0 | 0 |
| 29 | CEN P1-11-1-VI | 0.01 | 33 | 0.86 | 1.47 | 2.71 | 6534 | 0.00 | 0 | 0 | 0 | 0 | 0 |
| 30 | VILLA P17-76-VI-OL | 0.02 | 103 | 0.72 | 1.24 | 3.19 | 3408 | 0.06 | 0 | 0 | 0 | 0 | 0 |
| 31 | VILLA P10-35-VI | 0.05 | 101 | 0.91 | 1.56 | 12.41 | 116 | 0.00 | 0 | 0 | 0 | 0 | 0 |
| 32 | CAD P17-27-1-VI | 0.04 | 83 | 0.69 | 1.19 | 3.39 | 3328 | 0.00 | 0 | 0 | 0 | 0 | 0 |
| 33 | P26-138-4-VI-OL | 0.08 | 53 | 0.86 | 1.48 | 4.49 | 3787 | 0.00 | 0 | 0 | 0 | 0 | 0 |
| 34 | VILLA P44-112-VI | 0.07 | 165 | 0.73 | 1.26 | 2.86 | 2532 | 0.00 | 0 | 0 | 0 | 0 | 0 |
Appendix B. Maps


Appendix C. Sustainable Agricultural Practices Evaluation Survey
- Do you use chemical fertilizers in your crop?
- 2.
- If you use fertilizers, do you conduct soil analysis to determine the nutritional needs of your crops?
- 3.
- What type of fertilizer do you most frequently use in your crops?
- 4.
- How often do you apply pesticides in your crops?
- 5.
- Do you implement measures to reduce pesticide drift, such as applying in suitable weather conditions and using anti-drift nozzles?
- 6.
- Which of the following pesticides do you use for pest and disease control in your crops?
- 7.
- Do you use irrigation in your vineyard and/or olive grove?
- 8.
- If you irrigate, what is your primary source of water for irrigation?
- 9.
- If you irrigate, do you use efficient irrigation systems, such as drip irrigation or low-pressure sprinkler irrigation?
- 10.
- Do you monitor the amount of water used in your fields and adjust your irrigation accordingly?
- 11.
- Do you maintain areas of natural vegetation on your land to promote biodiversity?
- 12.
- How often do you till the land?
- 13.
- What type of tillage practice do you prefer for your crop?
- 14.
- Do you consider factors like soil type and weather conditions when deciding when to till the land?
- 15.
- Have you experimented with no-tillage or minimum tillage practices in your vineyard and/or olive grove?
- 16.
- How do you think tillage affects the sustainability of your vineyard and/or olive grove?
- 17.
- Have you implemented conservation agriculture techniques in your vineyard and olive grove crops?
- 18.
- How many litres of fuel do you typically use for land tilling per year?
- 19.
- How do you manage pruning waste in your vineyards/olive groves?
- 20.
- Have you explored the possibility of using agricultural waste for the production of by-products, such as fertilizer or artisanal goods?
- 21.
- Do you have an agricultural waste management plan to minimize soil and water contamination?
- 22.
- Do you recycle or reuse agricultural materials, such as pesticide containers and irrigation equipment?
- 23.
- Have you received training on sustainable agricultural practices in the last two years?
- 24.
- If yes, what training did you receive?
- 25.
- Do you participate in cooperatives or associations that promote agricultural sustainability?
- 26.
- Have you obtained any certification or recognition related to sustainable and/or organic agricultural practices?
- 27.
- Would you like to receive additional information on reducing the environmental impact of your agricultural practices?
- 28.
- Do you consider it important to reduce the ecological footprint of agriculture in the Sierra Oeste of Madrid?
References
- Billen, G.; Aguilera, E.; Einarsson, R.; Garnier, J.; Gingrich, S.; Grizzetti, B.; Lassaletta, L.; Le Noë, J.; Sanz-Cobena, A. Beyond the Farm to Fork Strategy: Methodology for designing a European agro-ecological future. Sci. Total Environ. 2024, 908, 168160. [Google Scholar] [CrossRef] [PubMed]
- Schebesta, H.; Bernaz, N.; Macchi, C. The European Union Farm to Fork Strategy. Eur. Food Feed Law Rev. 2020, 15, 420–427. [Google Scholar]
- European Commission. Farm to Fork Strategy for a Fair, Healthy and Environmentally-Friendly Food System; COM(2020) 381 final; European Commission: Brussels, Belgium, 2020. [Google Scholar]
- European Council. Council Regulation (EC) No 834/2007 of 28 June 2007 on organic production and labelling of organic products and repealing Regulation (EEC) No 2092/91. Off. J. Eur. Union 2007, L 189. Available online: https://eur-lex.europa.eu/legal-content/EN/TXT/HTML/?uri=CELEX:32007R0834 (accessed on 5 April 2025).
- European Parliament. Regulation (EC) No 178/2002 of the European Parliament and of the Council of 28 January2002 laying down the general principles and requirements of food law, establishing the European Food Safety Authority and laying down procedures in matters of food safety. Off. J. Eur. Communities 2002, L 31. Available online: https://eur-lex.europa.eu/legal-content/EN/TXT/HTML/?uri=CELEX:32002R0178 (accessed on 5 April 2025).
- European Parliament. Regulation (EC) No 1107/2009 of the European Parliament and of the Council of 21 October 2009 concerning the placing of plant protection products on the market and repealing Council Directives 79/117/EEC and 91/414/EE. Off. J. Eur. Union 2009, L 309. Available online: https://eur-lex.europa.eu/legal-content/EN/TXT/HTML/?uri=CELEX:32009R1107 (accessed on 5 April 2025).
- European Parliament Annex to the Communication from the Commission to the European Parliament, The Council, The European Economic and Social Committee and the Committee of the Regions. EU Biodiversity Strategy for 2030; COM(2020) 380 final. 2020. Available online: https://eur-lex.europa.eu/legal-content/EN/TXT/HTML/?uri=CELEX:52020DC0380 (accessed on 5 April 2025).
- European Parliament Communication from the Commission to the European Parliament, The Council, The European Economic and Social Committee and the Committee of the Regions. EU Biodiversity Strategy for 2030 Bringing Nature Back into Our Lives. COM(2020) 380 final. 2020. Available online: https://eur-lex.europa.eu/legal-content/EN/TXT/HTML/?uri=CELEX:52020DC0380 (accessed on 5 April 2025).
- Arabska, E. From farm to fork: Human health and well-being through sustainable agri-food systems. J. Life Econ. 2021, 8, 11–27. [Google Scholar] [CrossRef]
- Gierling, F.; Blanke, M. Carbon reduction strategies for regionally produced and consumed wine: From farm to fork. J. Environ. Manag. 2021, 278, 111453. [Google Scholar] [CrossRef]
- Naz, M.; Dai, Z.; Hussain, S.; Tariq, M.; Danish, S.; Khan, I.U.; Qi, S.; Du, D. The soil pH and heavy metals revealed their impact on soil microbial community. J. Environ. Manag. 2022, 321, 115770. [Google Scholar] [CrossRef]
- Pahalvi, H.N.; Rafiya, L.; Rashid, S.; Nisar, B.; Kamili, A.N. Chemical fertilizers and their impact on soil health. In Microbiota and Biofertilizers: Ecofriendly Tools for Reclamation of Degraded Soil Environs; Springer: Cham, Switzerland, 2021; Volume 2, pp. 1–20. [Google Scholar]
- Yadav, D.S.; Jaiswal, B.; Gautam, M.; Agrawal, M. Soil acidification and its impact on plants. In Plant Responses to Soil Pollution; Springer: Singapore, 2020; pp. 1–26. [Google Scholar]
- Piwowar, A. The use of pesticides in Polish agriculture after integrated pest management (IPM) implementation. Environ. Sci. Pollut. Res. 2021, 28, 26628–26642. [Google Scholar] [CrossRef]
- Pergner, I.; Lippert, C. On the effects that motivate pesticide use in perspective of designing a cropping system without pesticides but with mineral fertilizer—A review. Agron. Sustain. Dev. 2023, 43, 24. [Google Scholar] [CrossRef]
- Beckman, J.; Ivanic, M.; Jelliffe, J.L.; Baquedano, F.G.; Scott, S.G. Economic and Food Security Impacts of Agricultural Input Reduction Under the European Union Green Deal’s Farm to Fork and Biodiversity Strategies; United States Department of Agriculture (USDA): Washington, DC, USA, 2020. [Google Scholar]
- Marek, C.; Tosun, J. Tackling the Environmental and Climate Footprint of Food Systems: How “Transformative” Is the EU’s Farm to Fork Strategy? In Sustainability Transformations, Social Transitions and Environmental Accountabilities; Palgrave Macmillan: Cham, Switzerland, 2023; pp. 265–297. [Google Scholar]
- Longin, C.F.H.; Afzal, M.; El Hassouni, K. From farm to fork: Future supply chains need to measure and trade nutrient content. Trends Plant Sci. 2023, 28, 1237–1244. [Google Scholar] [CrossRef]
- Kiran, B.R.; Prasad, M.N.V.; Mohan, S.V. Farm to fork: Sustainable agrifood systems. In Sustainable and Circular Management of Resources and Waste Towards a Green Deal; Elsevier: Amsterdam, The Netherlands, 2023; pp. 25–38. [Google Scholar]
- EC–European Commission Proposal for a Directive of the European Parliament and of the Council on Soil Monitoring and Resilience (Soil Monitoring Law). COM(2023) 2023, 416. Available online: https://eur-lex.europa.eu/legal-content/EN/TXT/HTML/?uri=CELEX:52023PC0416 (accessed on 5 April 2025).
- Doran, J.W.; Parkin, T.B. Defining and assessing soil quality. Defin. Soil Qual. A Sustain. Environ. 1994, 35, 1–21. [Google Scholar]
- Lehmann, J.; Bossio, D.A.; Kögel-Knabner, I.; Rillig, M.C. The concept and future prospects of soil health. Nat. Rev. Earth Environ. 2020, 1, 544–553. [Google Scholar] [CrossRef]
- Panagos, P.; Montanarella, L.; Barbero, M.; Schneegans, A.; Aguglia, L.; Jones, A. Soil priorities in the European Union. Geoderma Reg. 2022, 29, e00510. [Google Scholar] [CrossRef]
- Maikhuri, R.K.; Rao, K.S. Soil quality and soil health: A review. Int. J. Ecol. Environ. Sci. 2012, 38, 19–37. [Google Scholar]
- Doran, J.W.; Zeiss, M.R. Soil health and sustainability: Managing the biotic component of soil quality. Appl. Soil Ecol. 2000, 15, 3–11. [Google Scholar] [CrossRef]
- Bünemann, E.K.; Bongiorno, G.; Bai, Z.; Creamer, R.E.; De Deyn, G.; De Goede, R.; Fleskens, L.; Geissen, V.; Kuyper, T.W.; Mäder, P. Soil quality—A critical review. Soil Biol. Biochem. 2018, 120, 105–125. [Google Scholar] [CrossRef]
- Matuštík, J.; Kočí, V. What is a footprint? A conceptual analysis of environmental footprint indicators. J. Clean. Prod. 2021, 285, 124833. [Google Scholar] [CrossRef]
- Syrovátka, M. On sustainability interpretations of the Ecological Footprint. Ecol. Econ. 2020, 169, 106543. [Google Scholar] [CrossRef]
- Gerke, J. Reducing Greenhouse Gas Emissions from Arable Land and Grassland: The Case for Organic Farming—A Critical Review. Sustainability 2025, 17, 1886. [Google Scholar] [CrossRef]
- Banerjee, A.; Jhariya, M.K.; Meena, R.S.; Yadav, D.K. Ecological footprints in agroecosystem: An overview. In Agroecological Footprints Management for Sustainable Food System; Springer: Singapore, 2021; pp. 1–23. [Google Scholar]
- Consejo Regulador Denominación de Origen Vinos de Madrid Denominación de Origen Vinos de Madrid. Available online: https://vinosdemadrid.es/denominacion-de-origen-vinos-de-madrid/ (accessed on 22 December 2024).
- Asiamah, N.; Mensah, H.K.; Oteng-Abayie, E. Non-Probabilistic Sampling in Quantitative Clinical Research: A Typology and Highlights for Students and Early Career Researchers. Int. J. Appl. Res. Public Health Manag. 2022, 7, 1–18. [Google Scholar] [CrossRef]
- Ayhan, H. Ö Non-probability Sampling Survey Methods. In International Encyclopedia of Statistical Science; Springer: Berlin/Heidelberg, Germany, 2014; pp. 979–982. [Google Scholar]
- Carter, M.R.; Gregorich, E.G. Soil Sampling and Methods of Analysis; CRC Press: Boca Raton, FL, USA, 2007. [Google Scholar]
- Tan, K.H. Soil Sampling, Preparation, and Analysis; CRC Press: Boca Raton, FL, USA, 2005. [Google Scholar]
- Chaney, R.L. Toxic element accumulation in soils and crops: Protecting soil fertility and agricultural food-chains. In Inorganic Contaminants in the Vadose Zone; Springer: Berlin/Heidelberg, Germany, 1989; pp. 140–158. [Google Scholar]
- Ashraf, M.A.; Maah, M.J.; Yusoff, I. Soil contamination, risk assessment and remediation. In Environmental Risk Assessment of Soil Contamination; IntechOpen: London, UK, 2014; Volume 1, pp. 3–56. [Google Scholar]
- Thomas, G.W. Soil pH and soil acidity. In Methods of Soil Analysis: Part 3 Chemical Methods; Soil Science Society of America: Madison, WI, USA, 1996; Volume 5, pp. 475–490. [Google Scholar]
- Rhoades, J.D. Salinity: Electrical conductivity and total dissolved solids. In Methods of Soil Analysis: Part 3 Chemical Methods; Soil Science Society of America: Madison, WI, USA, 1996; Volume 5, pp. 417–435. [Google Scholar]
- Nelson, D.W.; Sommers, L.E. Total carbon, organic carbon, and organic matter. In Methods of Soil Analysis: Part 3 Chemical Methods; Soil Science Society of America: Madison, WI, USA, 1996; Volume 5, pp. 961–1010. [Google Scholar]
- Nelson, D.A.; Sommers, L. Total carbon, organic carbon, and organic matter. In Methods of Soil Analysis: Part 2 Chemical and Microbiological Properties; Soil Science Society of America: Madison, WI, USA, 1983; Volume 9, pp. 539–579. [Google Scholar]
- Bremner, J.M. Nitrogen-total. In Methods of Soil Analysis: Part 3 Chemical Methods; Soil Science Society of America: Madison, WI, USA, 1996; Volume 5, pp. 1085–1121. [Google Scholar]
- Watanabe, F.S.; Olsen, S.R. Test of an ascorbic acid method for determining phosphorus in water and NaHCO3 extracts from soil. Soil Sci. Soc. Am. J. 1965, 29, 677–678. [Google Scholar] [CrossRef]
- Element, C. Method 3051A microwave assisted acid digestion of sediments, sludges, soils, and oils. Z. Anal. Chem. 2007, 111, 362–366. [Google Scholar]
- Merchant, A.; Antonio, C. Métodos de Laboratorio Para el Análisis de Suelos; Universidad Nacional Autónoma de México: Mexico City, Mexico, 2024. [Google Scholar]
- Richards, L.A. Diagnosis and Improvement of Saline and Alkali Soils; US Government Printing Office: Washington, DC, USA, 1954. [Google Scholar]
- Zhu, A.; Hudson, B.; Burt, J.; Lubich, K.; Simonson, D. Soil mapping using GIS, expert knowledge, and fuzzy logic. Soil Sci. Soc. Am. J. 2001, 65, 1463–1472. [Google Scholar] [CrossRef]
- Lucà, F.; Buttafuoco, G.; Terranova, O. GIS and Soil. In Comprehensive Geographic Information Systems; Elsevier Inc.: Amsterdam, The Netherlands, 2018; Volume 3, pp. 37–50. [Google Scholar]
- Clemmens, A.J.; Dedrick, A.R. Irrigation techniques and evaluations. In Management of Water Use in Agriculture; Springer: Berlin/Heidelberg, Germany, 1994; pp. 64–103. [Google Scholar]
- Miháliková, M.; Dengiz, O. Towards more effective irrigation water usage by employing land suitability assessment for various irrigation techniques. Irrig. Drain. 2019, 68, 617–628. [Google Scholar] [CrossRef]
- Evans, R.G.; Sadler, E.J. Methods and technologies to improve efficiency of water use. Water Resour. Res. 2008, 44, W00E04. [Google Scholar] [CrossRef]
- Komatsuzaki, M.; Ohta, H. Soil management practices for sustainable agro-ecosystems. Sustain. Sci. 2007, 2, 103–120. [Google Scholar] [CrossRef]
- Droogers, P.; Bouma, J. Soil survey input in exploratory modeling of sustainable soil management practices. Soil Sci. Soc. Am. J. 1997, 61, 1704–1710. [Google Scholar] [CrossRef]
- Medhekar, A. Circular economy in agriculture and sustainable development. In Circular Economy and Manufacturing; Woodhead Publishing: Cambridge, UK, 2024; pp. 15–31. [Google Scholar]
- Velasco-Muñoz, J.F.; Aznar-Sánchez, J.A.; López-Felices, B.; Román-Sánchez, I.M. Circular economy in agriculture. An analysis of the state of research based on the life cycle. Sustain. Prod. Consum. 2022, 34, 257–270. [Google Scholar] [CrossRef]
- Cohn, A.S.; O’Rourke, D. Agricultural certification as a conservation tool in Latin America. J. Sustain. For. 2011, 30, 158–186. [Google Scholar] [CrossRef]
- Piñeiro, V.; Arias, J.; Dürr, J.; Elverdin, P.; Ibáñez, A.M.; Kinengyere, A.; Opazo, C.M.; Owoo, N.; Page, J.R.; Prager, S.D. A scoping review on incentives for adoption of sustainable agricultural practices and their outcomes. Nat. Sustain. 2020, 3, 809–820. [Google Scholar] [CrossRef]
- Gikunda, R.M.; Lawver, D.E. Effect of Certification on Adoption and Sustainability of Organic Agricultural Practices. J. Int. Agric. Ext. Educ. 2020, 27, 64–78. [Google Scholar] [CrossRef]
- Mills, J.; Gaskell, P.; Ingram, J.; Dwyer, J.; Reed, M.; Short, C. Engaging farmers in environmental management through a better understanding of behaviour. Agric. Hum. Values 2017, 34, 283–299. [Google Scholar] [CrossRef]
- Despotović, J.; Rodić, V.; Caracciolo, F. Farmers’ environmental awareness: Construct development, measurement, and use. J. Clean. Prod. 2021, 295, 126378. [Google Scholar] [CrossRef]
- Wang, W.; Wang, L.; Gu, L.; Zhou, G. Understanding farmers’ commitments to carbon projects. Sci. Total Environ. 2021, 784, 147112. [Google Scholar] [CrossRef]
- Abascal, E.; Grande, I. Análisis de Encuestas; Libros Profesionales de Empresa; ESIC Editorial: Madrid, Spain, 2005; pp. 26–29. [Google Scholar]
- Vasantha Raju, N.; Harinarayana, N.S. Online survey tools: A case study of Google Forms. In Proceedings of the National Conference on Scientific, Computational & Information Research Trends in Engineering, GSSS-IETW, Mysore, India, 30 January 2016. [Google Scholar]
- Cataldo, E.; Salvi, L.; Sbraci, S.; Storchi, P.; Mattii, G.B. Sustainable viticulture: Effects of soil management in Vitis vinifera. Agronomy 2020, 10, 1949. [Google Scholar] [CrossRef]
- Cataldo, E.; Fucile, M.; Mattii, G.B. A review: Soil management, sustainable strategies and approaches to improve the quality of modern viticulture. Agronomy 2021, 11, 2359. [Google Scholar] [CrossRef]
- Hawk, J.; Martinson, T.E. Sustainable viticulture: Optimizing nitrogen use in vineyards. N. Y. Fruit Q. 2007, 15, 25–29. [Google Scholar]
- Baronti, S.; Magno, R.; Maienza, A.; Montagnoli, A.; Ungaro, F.; Vaccari, F.P. Long term effect of biochar on soil plant water relation and fine roots: Results after 10 years of vineyard experiment. Sci. Total Environ. 2022, 851, 158225. [Google Scholar] [CrossRef]
- Bolan, N.S.; Hedley, M.J. Role of carbon, nitrogen, and sulfur cycles in soil acidification. In Handbook of Soil Acidity; CRC Press: Boca Raton, FL, USA, 2003; pp. 43–70. [Google Scholar]
- Powlson, D.S.; Gregory, P.J.; Whalley, W.R.; Quinton, J.N.; Hopkins, D.W.; Whitmore, A.P.; Hirsch, P.R.; Goulding, K.W. Soil management in relation to sustainable agriculture and ecosystem services. Food Policy 2011, 36, S72–S87. [Google Scholar] [CrossRef]
- Calegari, A.; Tiecher, T.; Hargrove, W.L.; Ralisch, R.; Tessier, D.; de Tourdonnet, S.; de Fatima Guimaraes, M.; dos Santos, D.R. Long-term effect of different soil management systems and winter crops on soil acidity and vertical distribution of nutrients in a Brazilian Oxisol. Soil Tillage Res. 2013, 133, 32–39. [Google Scholar] [CrossRef]
- López-Santiago, J.; García, A.I.G.; Villarino, A.G.; Som, A.M.; Gómez-Villarino, M.T. Assessing wineries’ performance in managing critical control points for arsenic, lead, and cadmium contamination risk in the wine-making industry: A survey-based analysis utilizing performance indicators as a results tool. Heliyon 2024, 10, e22962. [Google Scholar] [CrossRef] [PubMed]
- García-Salgado, S.; García-Casillas, D.; Quijano-Nieto, M.A.; Bonilla-Simón, M.M. Arsenic and heavy metal uptake and accumulation in native plant species from soils polluted by mining activities. Water Air Soil Pollut. 2012, 223, 559–572. [Google Scholar] [CrossRef]
- Díez, M.; Simón, M.; Dorronsoro, C.; García, I.; Martín, F. Background arsenic concentrations in Southeastern Spanish soils. Sci. Total Environ. 2007, 378, 5–12. [Google Scholar] [CrossRef]
- Vitali Čepo, D.; Pelajić, M.; Vinković Vrček, I.; Krivohlavek, A.; Žuntar, I.; Karoglan, M. Differences in the levels of pesticides, metals, sulphites and ochratoxin A between organically and conventionally produced wines. Food Chem. 2018, 246, 394–403. [Google Scholar] [CrossRef]
- Eschnauer, H.; Neeb, R. Micro-element analysis in wine and grapes. In Wine Analysis; Springer: Berlin/Heidelberg, Germany, 1988; pp. 67–91. [Google Scholar]
- Schreiner, R.P.; Osborne, J. Defining phosphorus requirements for pinot noir grapevines. Am. J. Enol. Vitic. 2018, 69, 351–359. [Google Scholar] [CrossRef]
- Hossain, M.E.; Shahrukh, S.; Hossain, S.A. Chemical fertilizers and pesticides: Impacts on soil degradation, groundwater, and human health in Bangladesh. In Environmental Degradation: Challenges and Strategies for Mitigation; Springer: Cham, Switzerland, 2022; pp. 63–92. [Google Scholar]
- Jia, S.; Yuan, D.; Li, W.; He, W.; Raza, S.; Kuzyakov, Y.; Zamanian, K.; Zhao, X. Soil chemical properties depending on fertilization and management in China: A meta-analysis. Agronomy 2022, 12, 2501. [Google Scholar] [CrossRef]
- International Organisation of Vine and Wine. Resolution OIV-OENO 630-2020. OIV Guide to Identify Hazards, Critical Control Points and Their Management in the Wine Industry; OIV Standards and Technical Documents; OIV: Dijon, France, 2020. [Google Scholar]
- International Organisation of Vine and Wine OIV-MA-AS322-10 Cadmium. Available online: https://www.oiv.int/standards/annex-a-methods-of-analysis-of-wines-and-musts/section-3-chemical-analysis/section-3-2-non-organic-compounds/section-3-2-2-cations/cadmium-%28type-iv%29 (accessed on 13 November 2024).
- Stockley, C.; Paschke-Kratzin, A.; Teissedre, P.; Restani, P.; Tejedor, N.G.; Quini, C. OIV Collective Expertise Lead in Wine: A review; OIV Publications: Dijon, France, 2020. [Google Scholar]
- Gurr, G.M.; Lu, Z.; Zheng, X.; Xu, H.; Zhu, P.; Chen, G.; Yao, X.; Cheng, J.; Zhu, Z.; Catindig, J.L. Multi-country evidence that crop diversification promotes ecological intensification of agriculture. Nat. Plants 2016, 2, 16014. [Google Scholar] [CrossRef]
- Abd–Elrahman, S.H.; Saudy, H.S.; El–Fattah, D.A.A.; Hashem, F.A. Effect of irrigation water and organic fertilizer on reducing nitrate accumulation and boosting lettuce productivity. J. Soil Sci. Plant Nutr. 2022, 22, 2144–2155. [Google Scholar] [CrossRef]
- Hobbs, P.R.; Sayre, K.; Gupta, R. The role of conservation agriculture in sustainable agriculture. Philos. Trans. R. Soc. B Biol. Sci. 2008, 363, 543–555. [Google Scholar] [CrossRef]
- Lal, R. Restoring soil quality to mitigate soil degradation. Sustainability 2015, 7, 5875–5895. [Google Scholar] [CrossRef]
- Alcántara, V.; Don, A.; Well, R.; Nieder, R. Deep ploughing increases agricultural soil organic matter stocks. Glob. Change Biol. 2016, 22, 2939–2956. [Google Scholar] [CrossRef]
- Petrović, A.; Lisov, N.; Čakar, U.D.; Marković, N.; Matijašević, S.; Cvejić, J.M.; Atanacković, M.; Gojković-Bukarica, L. The effects of Prokupac variety clones and vinification method on the quantity of resveratrol in wine. Food Feed Res. 2019, 46, 189–198. [Google Scholar] [CrossRef]
- Saha, L.; Bauddh, K. Sustainable agricultural approaches for enhanced crop productivity, better soil health, and improved ecosystem services. In Ecological and Practical Applications for Sustainable Agriculture; Springer: Singapore, 2020; pp. 1–23. [Google Scholar]
- Pereira, P.; Bogunovic, I.; Muñoz-Rojas, M.; Brevik, E.C. Soil ecosystem services, sustainability, valuation and management. Curr. Opin. Environ. Sci. Health 2018, 5, 7–13. [Google Scholar] [CrossRef]
- Bienes, R.; Marques, M.J.; Sastre, B.; García-Díaz, A.; Esparza, I.; Antón, O.; Navarrete, L.; Hernánz, J.L.; Sánchez-Girón, V. Sánchez del Arco, María J Tracking changes on soil structure and organic carbon sequestration after 30 years of different tillage and management practices. Agronomy 2021, 11, 291. [Google Scholar] [CrossRef]
- Carretta, L.; Tarolli, P.; Cardinali, A.; Nasta, P.; Romano, N.; Masin, R. Evaluation of runoff and soil erosion under conventional tillage and no-till management: A case study in northeast Italy. Catena 2021, 197, 104972. [Google Scholar] [CrossRef]
- Topi, D.; Arapi, D.; Seiti, B. Vine Pruning Residues and Wine Fermentation By-Products: A Non-Exploited Source of Sustainable Agriculture, Albania Case. Resources 2025, 14, 29. [Google Scholar] [CrossRef]
- Brito, C.; Pereira, S.; Martins, S.; Monteiro, A.; Moutinho-Pereira, J.M.; Dinis, L. Strategies for achieving the sustainable development goals across the wine chain: A review. Front. Sustain. Food Syst. 2024, 8, 1437872. [Google Scholar] [CrossRef]
- Gomes, M.J.; Sousa, A.; Novas, J.; Jordão, R.V.D. Environmental sustainability in viticulture as a balanced scorecard perspective of the wine industry: Evidence for the Portuguese region of Alentejo. Sustainability 2021, 13, 10144. [Google Scholar] [CrossRef]
- Masson, J.E.; Soustre-Gacougnolle, I.; Perrin, M.; Schmitt, C.; Henaux, M.; Jaugey, C.; Teillet, E.; Lollier, M.; Lallemand, J.; Schermesser, F. Transdisciplinary participatory-action-research from questions to actionable knowledge for sustainable viticulture development. Humanit. Soc. Sci. Commun. 2021, 8, 24. [Google Scholar] [CrossRef]
- López-Santiago, J.; Md Som, A.; Asyadi Bin Md Yusof, F.; Mazarrón, F.R.; Gómez-Villarino, M.T. Exploring Sustainability in Wineries: Evaluating Food Safety and Environmental Management Aligning with the Farm to Fork Strategy. Agriculture 2024, 14, 330. [Google Scholar] [CrossRef]

| Soil Property | Method | Reference |
|---|---|---|
| pH and Electrical Conductivity | Extract 1:2.5 | [38,39] |
| Total Organic Matter | 560 °C Calcination | [40,41] |
| Easily Oxidizable Organic Matter | Walkley y Black | |
| Organic Carbon | ||
| Nitrogen (N) | Kjeldahl Method | [42] |
| Phosphorus (P) | Olsen Method | [43] |
| Potasium (K) | Acid Digestion with HCl/HNO3 | [44] |
| Total Metals | ||
| Texture | Densímeter of Bouyoucos | [45] |
| Field Capacity (moisture retention at 33 kPa), Wilting Point (moisture retention at 1500 kPa, Available Water) | Richards Membrane (1954), measuring water retained in the sample at 33 and 1500 kPa | [46] |
| Soil Parameter | Units | Mean (YES) | Mean (NO) | p-Value |
|---|---|---|---|---|
| Nitrogen (N) | % | 0.090 | 0.040 | 0.035 |
| Phosphorus (P) | mg/kg | 125 | 65 | 0.020 |
| Potassium (K) | mg/kg | 3100 | 1550 | 0.015 |
| Nickel (Ni) | mg/kg | 0.13 | 0.18 | 0.045 |
| Lead (Pb) | mg/kg | 0.04 | 0.04 | 0.950 |
| Cadmium (Cd) | mg/kg | 0.09 | 0.09 | 0.880 |
| Pesticide Application Frequency | % Farmers | Average Pb (mg/kg) | Average Cd (mg/kg) |
|---|---|---|---|
| Never | 29.6 | 0 | 0 |
| Rarely | 70.4 | 0 | 0 |
| Use of Efficient Irrigation Systems | % Farmers | Average Soil Moisture (%) |
|---|---|---|
| Yes | 11.5 | 10.79 |
| No | 88.5 | 7.80 |
| Agricultural Practice | Results |
|---|---|
| Use of Chemical Fertilizers | 55.6% of respondents reported using chemical fertilizers. |
| Common types of fertilizers used include ammonium nitrate, diammonium phosphate, urea, and potassium sulphate. | |
| Soil Testing | 66.7% of respondents do not conduct soil testing to determine the nutritional needs of their crops. |
| Pesticide Application: | Frequency of pesticide application varied, with 70.4% applying rarely; and 29.6% that never applied. |
| Irrigation Practices: | 11.5% of respondents use irrigation. |
| 83.3% reported using efficient irrigation systems like drip irrigation. | |
| Sustainable Practices | 70.4% maintain areas of natural vegetation to promote biodiversity. |
| 29.6% practice conservation agriculture techniques such as soil cover. | |
| 37% considered tillage contributes positively to vineyard sustainability and 48.1% reported that it depends on the specific tillage practice used. | |
| 41.7% reported that they used more than 500 L for land tilling per year, in contrast to 33.3% that used between 0 and 100 L per year | |
| Waste management | 66.7% burned pruning waste in the field |
| 50% explored using waste for firewood (fuel) and 33.3% used it as fertilizer | |
| 74.1% did not have an agricultural waste management plan | |
| 69.6% recycled or reused agricultural materials, such as pesticide containers and irrigation equipment | |
| Training | 81.5% have not received training on sustainable agricultural practices in the last two years |
| Certification and Recognition | 66.7% participate in cooperatives or associations that promote agricultural sustainability |
| 92.6% reported that they have not obtained any certification or recognition related to sustainable and/or organic agricultural practices | |
| Environmental Commitment | 76.9% informed us that they would like to receive additional information on reducing the environmental impact of their agricultural practices |
| 88.9% considered it important to reduce the ecological footprint of agriculture in the Sierra Oeste of Madrid |
Disclaimer/Publisher’s Note: The statements, opinions and data contained in all publications are solely those of the individual author(s) and contributor(s) and not of MDPI and/or the editor(s). MDPI and/or the editor(s) disclaim responsibility for any injury to people or property resulting from any ideas, methods, instructions or products referred to in the content. |
© 2025 by the authors. Licensee MDPI, Basel, Switzerland. This article is an open access article distributed under the terms and conditions of the Creative Commons Attribution (CC BY) license (https://creativecommons.org/licenses/by/4.0/).
Share and Cite
Santiago, J.L.; Iglesias-Merchán, C.; Navarro, R.C.; Gómez-Villarino, M.T. Bridging the Gap: Evaluating Farmers’ Sustainability Perceptions, Their Agricultural Practices, and Measured Soil Indicators Towards Promoting a Sustainable Viticulture. Environments 2025, 12, 155. https://doi.org/10.3390/environments12050155
Santiago JL, Iglesias-Merchán C, Navarro RC, Gómez-Villarino MT. Bridging the Gap: Evaluating Farmers’ Sustainability Perceptions, Their Agricultural Practices, and Measured Soil Indicators Towards Promoting a Sustainable Viticulture. Environments. 2025; 12(5):155. https://doi.org/10.3390/environments12050155
Chicago/Turabian StyleSantiago, Jesús López, Carlos Iglesias-Merchán, Roberto Cordero Navarro, and María Teresa Gómez-Villarino. 2025. "Bridging the Gap: Evaluating Farmers’ Sustainability Perceptions, Their Agricultural Practices, and Measured Soil Indicators Towards Promoting a Sustainable Viticulture" Environments 12, no. 5: 155. https://doi.org/10.3390/environments12050155
APA StyleSantiago, J. L., Iglesias-Merchán, C., Navarro, R. C., & Gómez-Villarino, M. T. (2025). Bridging the Gap: Evaluating Farmers’ Sustainability Perceptions, Their Agricultural Practices, and Measured Soil Indicators Towards Promoting a Sustainable Viticulture. Environments, 12(5), 155. https://doi.org/10.3390/environments12050155