Abstract
In 2020, California banned the sale and agricultural use of chlorpyrifos, an organophosphate pesticide (OP) associated with neurotoxicity and other adverse health outcomes. We primarily assessed changes in chlorpyrifos associated with this policy and secondarily explored how other OP exposures changed. The participants were from California’s Central Valley, 18 years or older, and English- or Spanish-speaking. The surveys and urine samples were collected pre-ban (December 2020) and post-ban (February–April 2022). The urine samples were analyzed for a chlorpyrifos-specific metabolite (TCPy), six dialkyl phosphates (DEP, DMTP, DETP, DMDTP, DMP, DEDTP), and total DE and DM. The pre- and post-ban metabolite concentrations were compared via Wilcoxon signed-rank tests and natural log-transformed paired differences in linear mixed effects regression, adjusted for covariates. Forty-nine participants had repeated biomarker data. The mean age of the study population was 46.8 years (SD: 16), 61% female, 67% Spanish-speaking, 100% Hispanic/Latino(a), and 47% had less than a high school education. Six urinary metabolites (TCPy, DEP, DMP, DMTP, total DE and total DM) had sufficient variation for further analysis, while DMDTP, DEDTP, and DETP were undetected. The paired differences in adjusted models showed statistically significant increases in TCPy and DMP associated with the policy change (e.g., TCPy estimated ratio of geometric means: 4.53 (95% CI 2.66, 7.69)) Reductions in metabolites of chlorpyrifos exposure were not observed following California’s chlorpyrifos ban, suggesting ongoing exposure to chlorpyrifos from other sources.
1. Introduction
The use of agricultural pesticides dates back thousands of years to control insects, fungi, weeds, and other organisms that reduced or destroyed crops and impacted food quality [1,2]. The development of synthetic pesticides increased during World War II (1939–1945), coinciding with the need to improve food production, eliminate insect-borne diseases, and explore potential agents of chemical warfare [1]. In 2021, approximately 3.5 million metric tons (7.7 billion pounds) of agricultural pesticides were used worldwide, with the U.S. ranked second only to Brazil for the largest pesticide-consuming country [3]. Although agricultural pesticides can benefit crop protection and food production, less than 1% of all pesticides reach their target pests due to soil absorption, spray drift, volatilization, off-target deposition, surface run-off, and photodegradation, which can lead to environmental contamination and adverse health effects in humans [1,2].
Organophosphate pesticides (OPs), first introduced in 1938, are a class of chemical pesticides widely used in agriculture, as well as in indoor and industrial settings [4,5]. OPs work by inhibiting the enzyme acetylcholinesterase in the nervous system of pests, leading to a buildup of acetylcholine, disrupting nerve impulses and causing paralysis and death. Despite being an effective pesticide, evidence of toxic effects to non-target mammals, birds, fish, other insects, and humans are well established [6]. In humans, direct exposure can occur through the skin, mouth, eyes, and respiratory system, and indirectly by ingesting contaminated food and water [4]. The level of toxicity depends on intensity, frequency, and duration of exposure, which can result in acute poisoning and chronic diseases and disorders and even death. OP exposure has been associated with cancer [7,8], neurodegenerative diseases [9,10,11], impaired neurocognitive development in children [12,13], and adverse respiratory outcomes [14,15,16,17].
Chlorpyrifos is an OP that has been one of the most used insecticides worldwide [18] and in the United States [19]. Chlorpyrifos has been associated with neurotoxicity in toxicology studies [11,20], decreased birthweight and birth length [21], neurodevelopmental deficits in childhood [22,23], impaired neurological function [24], and cancer [25] in observational epidemiological studies. Given the widespread use and toxic effects of chlorpyrifos, the U.S. Environmental Protection Agency banned it from indoor use in 2000 and revoked all tolerance for any chlorpyrifos presence in food in August 2021, although this revocation rule was later vacated in 2023 [26,27]. Despite there being an allowance of chlorpyrifos use agriculturally within tolerated amounts in the U.S. currently [26], in 2019, the State of California implemented a state-specific ban on the sale of chlorpyrifos starting 6 February 2020, and a ban on agricultural applications starting 1 January 2021 [28]. This policy resulted in a unique observational study to investigate changes in exposure to chlorpyrifos in the state. As the Central Valley of California is one of the most agriculturally active regions in the world, this shift in pesticide use may have short-term and long-term effects on Valley residents with chronic exposure based on residential proximity to agricultural operations.
In partnership with a long-standing environmental justice community organization in the region, the Central California Environmental Justice Network (CCEJN), we leveraged this statewide intervention to primarily assess if the environmental policy to ban chlorpyrifos in California changed personal exposure among residents of agricultural communities and an urban community in the Central Valley. Since a replacement pesticide for chlorpyrifos was not designated, we further conducted a secondary analysis of changes in other OPs during both time points given the uncertainty of potential replacement pesticides for chlorpyrifos. The indicators of personal exposures were collected from urinary metabolites at two time points, pre-ban (2020) and post-ban (2022), including a targeted chlorpyrifos metabolite, 3,4,6-trichloro-2-pyridinol (TCPy), and general measures of OP exposure (i.e., dialkyl phosphates (DAPs)) [5]. These urinary biomarkers, which are a common method to assess OP exposure in epidemiological studies [5] as a proxy of cumulative OP exposure [29], were investigated to see if the policy to remove a widely used chemical from application had measurable impacts at an individual level. For our primary question, we hypothesized a decrease in TCPy associated with the policy ban, and for our secondary question, we hypothesized an increase in other OPs given they might have been potential replacements for chlorpyrifos following the ban.
2. Materials and Methods
2.1. Study Population and Participants
The study region was the Central Valley of California, including Fresno and Tulare Counties. This area is one of the most fertile and productive agricultural regions of the world; Fresno and Tulare Counties are the top two ranked for agricultural products in the U.S. [30,31]. This region consistently has some of the highest levels of agricultural pesticide use in the U.S., particularly OPs. The majority of farmworkers in the state are immigrants (90.8%), mostly Latino/a and Spanish-speaking, and over half (58.3%) self-reported to be undocumented [32,33].
The study participants included adult residents, aged 18 or older, who were English- or Spanish-speaking and able to give autonomous informed consent. The participants were originally recruited by CCEJN from an earlier National Institutes of Health-funded study, “The Study of Environmental Mixtures in Periurban Respiratory Outcomes (SEMIPRO)” [34,35,36]. These participants lived in agricultural and urban communities in the Central Valley and were recruited through door-to-door campaigns and at community meetings and events, with information booths and representatives via CCEJN. For the agricultural communities, participants were eligible if they had lived for more than one year within 61 m (200 feet) of an active field in the study region. For the urban community, participants were eligible if they lived in the southwest Fresno urban area, an area designated by California Assembly Bill (AB) 617 as an environmental justice community.
This study received human subjects’ approval by the CSU Institutional Review Board (IRB #2643) and all study procedures were performed in compliance with Institutional Review Board guidelines. The participants gave informed consent prior to the data collection and study procedures ensured privacy rights of all participants. Each participant received $60 in cash per visit, for a total of $120 if they participated in both study visits.
2.2. Sampling Periods
The data collection took place remotely due to COVID-19 pandemic travel restrictions for the pre-ban phase from 1–30 December 2020, and in-person for the post-ban phase from 19 February to 22 April 2022. For the remote data collection during the pre-ban phase, surveys were conducted over the phone and participants received a sampling kit in the mail to collect urine, with full instructions on collection, storage, and pick-up procedures. For the in-person data collection during the post-ban phase, all surveys and samples were collected at a home visit.
2.3. Biomarkers of Exposure: Urinary Metabolites
The spot urine samples were collected on two consecutive mornings as first voids using the standard protocol for the Midstream Collection System. The participants were provided with a sterile urine container (120 mL), a towelette, and instructions (English/Spanish) to void urine into the container until it was approximately half full. We followed best practice procedures to freeze urine samples prior to aliquoting and limiting the freeze-thaw cycles as best as possible. The participants stored urine samples labeled and double-bagged in a home freezer until picked-up by research staff in coolers with ice packs. In the pre-ban campaign, samples were shipped on the same day on dry ice to Colorado State University (CSU), where samples were stored in the Magzamen-Reynolds-Schaeffer Lab’s −80 °C freezer prior to aliquoting samples for analysis. For the post-ban at home visits, urine samples were stored in biohazard bags at a −80 °C in a freezer in the Bush Lab in the Department of Biology at Fresno State University and then shipped to CSU on dry ice and stored in the Magzamen-Reynolds-Schaeffer Lab’s −80 °C freezer.
Duplicate urine samples were analyzed separately and then averaged for analysis, grouped by pre-ban and post-ban sessions. The urine samples were analyzed for TCPy for the primary analysis, and six DAPs for the secondary analysis, which represented exposure to other OPs (dimethylphosphate (DMP), diethylphosphate (DEP), dimethylthiophosphate (DMTP), diethylthiophosphate (DETP), dimethyldithiophosphate (DMDTP), and diethyldithiophosphate (DEDTP)), and total diethyl alkylphosphate (total DE) and total dimethyl alkylphosphate (total DM) metabolites following published methods and protocols established in the CSU Analytical Toxicology Lab [36]. While TCPy was the primary metabolite specific to chlorpyrifos (as well as potentially chlorpyrifos methyl exposure, which was not studied here), DEP and DETP can also form as chlorpyrifos undergoes metabolism [5]. The detection of the DAPs explored in this study does not pinpoint the parent compound, because the DAPs listed above are common breakdown products of numerous OPs, including malathion, which is also used in this study area.
The DAPs and TCPy concentrations were provided in ng/mL. For samples in which a DAP or TCPy concentration was not detectable, the value was assigned as zero. The urine samples that had detectable levels of DAP or TCPy below the limit of quantification (LOQ) were assigned a value equal to the LOQ/2. The LOQs for TCPy, DEDTP, and all other DAPs were 0.1 ng/mL, 1.0 ng/mL, and 0.5 ng/mL, respectively. The DAP and TCPy concentrations were then normalized by creatinine concentration. Creatinine concentration was analyzed by the Core Lab at the Clinical Translation Research Centers at University of Colorado, Anschutz Medical Campus. A detailed description of laboratory methods for DAPs and TCPy, specifically the LC-MS/MS analysis for DAPs and GC-MS/MS analysis for TCPy, can be found in Supplemental Information.
2.4. Survey Data
Additional data were collected from participants via surveys using secure, web-based REDCap (Research Electronic Data Capture) tools hosted by the Colorado Clinical & Translational Sciences Institute [37]. The demographic characteristics included age, sex, race and ethnicity, current home address and amount of time spent there, and estimated time spent living in other agricultural communities near pesticide applications. The indicators of socioeconomic status included education, employment status, home type and ownership, and housing materials. The age in years was calculated as of the 2022 field visit. The household addresses were geocoded using Google maps.
Other potential sources of pesticide and environmental chemical exposures were investigated in the surveys, including sources of heating and cooling the home, use of chemical products in the home or near the home to exterminate weeds and pests, in-home applications of pet treatment, household members working in agriculture or other jobs with pesticide exposure, first- or second-hand cigarette exposure, and wildfire smoke exposure. Lastly, participants were asked about health conditions and previous doctor diagnoses, asked to rate their health, and describe other concerns they have about their environment.
2.5. Data Management and Statistical Analysis
All data were managed and analyzed in R (v.4.2.2) and RStudio (v.2024.12.1+563). After merging the English and Spanish survey versions, removing duplicate records, and removing records with missing ID numbers or urine sample IDs, there were a total of n = 219 observations in the initial dataset across both campaigns (n = 110, 50% at campaign 1, and n = 109, 50% at campaign 2). The dataset for analysis was filtered to include only those participants who had repeated data from both time points (n = 136 total observations; n = 68 at campaign 1 and n = 68 at campaign 2). We then further filtered the data to include only participants with valid pre- and post-ban biomarker measures for a final analysis, which was a total of 98 observations (n = 49 at campaign 1 and n = 49 at campaign 2), with 98 valid TCPy concentrations, and 96 urinary metabolite concentrations for all other biomarkers due to two non-valid samples (DEP, DETP, DEDTP, DMDTP, DMP, DMTP, total DE, total DM). All analyses and modeling included n = 98 and n = 96 observations for TCPy and all other DAPs, respectively.
The survey results and biomarker concentrations were first investigated descriptively with the mean and standard deviation (SD), median, quartile, range, and n (%) summarized. The Spearman correlation coefficients were calculated between age and all biomarkers. Given the high percentage of null values, we assessed biomarkers for further analysis in statistical models if the percentage of null values was less than 65% for at least one campaign, resulting in a focus on TCPy, DEP, DMP, DMTP, total DE and total DM. The biomarker concentrations compared between pre- and post-ban phases were visualized using box-and-whisker plots, and changes in the median concentrations between time points were visualized with line plots. We conducted descriptive analyses using the Wilcoxon paired sign-rank test to determine changes in the median levels of TCPy, DAPs, total DE and total DM metabolites from pre- to post-ban.
We ran crude linear mixed effects regression (LMER) models with TCPy as the outcome, a random effect for subject, and several potential covariates of interest as the independent variable: age, sex, urban vs. agricultural neighborhood, work in agriculture (self), and any household indoor and/or outdoor pesticide use (any use of pesticides for insects, rodents, weeds, outdoor pests, or pet fleas/ticks). The biomarker concentrations were natural log-transformed (Ln) to meet the assumptions of linear regression, all with 0.01 added to the log transformation calculation due to values with concentrations of 0.0000.
For the primary analysis of TCPy and the secondary analysis with other OPs, we used a linear mixed effects model to evaluate differences in urinary biomarker concentrations (Ln biomarker), across study time points, adjusting for participant and household characteristics, including age, sex, neighborhood, and work in agriculture (self), with subject included as a random effect to account for repeated measurements (Equation (1)). Household pesticide use was missing two observations from campaign 1 and therefore reduced the paired sample size to n = 46. Following that, we ran a sensitivity analysis with household pesticide used as an additional covariate (Equation (2)):
where Ln(biomarker) was the natural log-transformed concentration of the biomarker, β0 was an intercept, x1 was the campaign number (post-ban vs. pre-ban (reference)), x2 was sex (male vs. female (reference)), x3 was age (continuous variable in years), x4 was neighborhood (urban vs. agricultural (reference)), x5 was working in agriculture (yes vs. no (reference)), x6 was household pesticide use (none vs. any (reference), added for the sensitivity analysis), and ui was the random intercept term accounting for clustering by subject (participant ID).
Ln(biomarker) = β0 + β1x1 + β2x2 + β3x3 + β4x4 + β5x5 + ui
Ln(biomarker) = β0 + β1x1 + β2x2 + β3x3 + β4x4 + β5x5 + β6x6 + ui
Regression results were expressed as estimates and 95% confidence interval (CI) as a log-fold change, and back-transformed (i.e., exponentiated) as an estimate and 95% CI to offer a more meaningful interpretation of results as a geometric mean ratio.
3. Results
3.1. Study Sample Overview
The baseline characteristics of the study sample are shown in Table 1. There were minimal differences at baseline between the full sample of participants (n = 110), those who had data at two time points (n = 68), and those with valid TCPy biomarker data at both time points included in this analysis (n = 49). For example, the percentages between the sampling datasets included female sex (56 to 61%), Spanish-speaking (65 to 68%), Hispanic ethnicity (98 to 100%), high school education (47 to 53%), et cetera (Table 1). This provides some confirmation that there was likely no selection bias in our sample among those who were able to participate in both time points and provide valid urinary metabolite data (Table 1).

Table 1.
Baseline study sample characteristics.
Among the study participants for biomarker analysis, there was a wide range of ages (mean 46.8 years (SD 16), ranging from 21 to 79 years). The majority of participants were female (n = 30, 61%) and Spanish-speaking (n = 33, 67%). All participants self-identified as Hispanic or Latino(a) ethnicity (n = 49, 100%), and most (n = 47, 96%) identified as an “Other” racial category. Nearly half of the sample (n = 23, 47%) had less than a high school level of education. The vast majority (n = 45, 92%) resided in an agricultural area and 39% (n = 19) worked in agriculture. Most participants (n = 29, 62%) used some type of household pesticide whether indoors and/or outdoors (Table 1).
3.2. Urinary Metabolite Results
Full descriptive summaries and graphics of pre- and post-ban urinary metabolite data can be found in Supplemental Information. Table S1 summarizes all pre- and post-ban biomarker concentrations (n, minimum, median, 25th to 75th quartiles, maximum values, and count (%) of null values). The box-and-whisker plots in Figure S1 show increases in the 75th quartiles for TCPy, DMP, and total DM. The line plots from Figure S2 clearly highlight increases in median concentrations from pre- to post-ban timepoints for TCPy and total DM, with no median changes for the other biomarkers, despite some variation in changes in the quartiles. Table S2 displays Spearman correlation coefficients, showing mostly weak to moderate correlations between biomarkers, and no correlations with age. Total DE and total DM had strong correlations with other biomarkers since they were composite of each group of DE and DM.
Table 2 summarizes the descriptive results from the Wilcoxon paired signed-rank tests, showing median (Q1, Q3) pre- and post-ban values. Contrary to our primary hypothesis, TCPy showed a significant increase in median values post-ban. For the secondary analysis, total DM increased in median values post-ban and DMP showed a significant increase in its 75th percentile concentrations. There was no evidence of significant differences between pre- and post-ban concentrations for the other biomarkers (i.e., DEP, DMTP, and total DE) (Table 2 and Table S1, Figures S1 and S2).
Table 2.
Results from the Wilcoxon paired signed-rank test among the biomarkers with pre- and post-ban concentrations (median (Q1, Q3) ng/mL) that showed enough detectable values for further assessment.
From the crude (unadjusted) LMER models, none of the covariates were significantly associated with TCPy (i.e., all 95% CI included the null value of 0.0). However, given potential impacts on chlorpyrifos and other OP exposure, they were still included in the final LMER models. Table 3 summarizes the findings from the primary analysis of the multivariable LMER models, adjusted for age, sex, urban vs. agricultural neighborhood, and work in agriculture, with subject as a random effect. Overall, the results from the adjusted LMER models were consistent with results from the Wilcoxon paired signed-rank tests, showing a significant increase in TCPy and DMP, and suggestive increases in total DM post-ban, while there were no other differences observed for other biomarkers. After back-transforming the results to interpret the geometric mean ratio, the largest increases were seen with TCPy and DMP. For example, the geometric mean of TCPY was 4.53 times higher (95% CI: 2.66, 7.69) in the post-ban phase compared to the pre-ban phase, after adjusting for covariates. DMP had a geometric mean 7.24 times higher (95% CI: 2.41, 21.98) in the post-ban phase compared to the pre-ban phase (Table 3). In brief, our primary hypothesis was refuted for TCPy, as there was an unexpected increase post-ban, and our secondary hypothesis was supported for DMP with an increase post-ban, although no significant increases were seen with the other OPs.
Table 3.
Results from the multivariable linear mixed effects regression model for impacts of chlorpyrifos ban timepoint on urinary metabolite concentrations. All models adjusted for age, sex, urbanicity, and agriculture work, with subject as a random effect. Biomarker values were natural log-transformed.
Figure 1 displays the primary LMER model results for TCPy as a forest plot, showing that among all the variables in the model, only the timing of the policy change for the chlorpyrifos ban had an impact on TCPy, with significantly higher average concentrations post-ban vs. pre-ban, while all other variables included the null value (Figure 1).
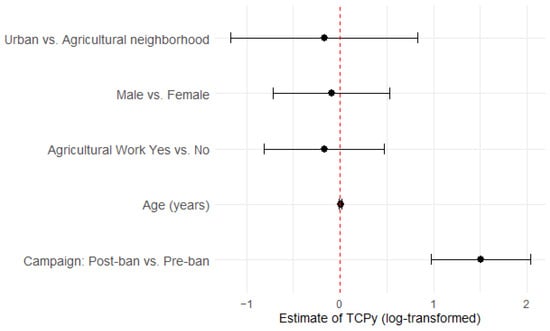
Figure 1.
Forest plot showing estimates of TCPy (natural log-transformed) from the primary linear mixed effects regression model. The red dashed line represents the null value (0.0).
The sensitivity analyses included household pesticide use as a covariate and after re-running the LMER models, there was no impact on the results, suggesting robustness of the primary LMER models (Table S3).
4. Discussion
4.1. Overview
Given growing concerns of the widespread use of OPs, particularly chlorpyrifos, and its established associations with adverse health effects among infants, children, and adults, California took an unprecedented step for a statewide ban of chlorpyrifos’ sale in February 2020 and agricultural applications by the end of the 2020 calendar year. This unique environmental policy to ban a pesticide from use statewide offered an opportunistic observational study to investigate changes in chlorpyrifos and other OP exposures among residents living in areas with likely high exposure, particularly those in agricultural communities, plus an urban region. California applied approximately 16,135 metric tons of chlorpyrifos over the past 27 years, leading to a potentially drastic reduction in exposure among residents following the ban. The aim of our study was to assess the impacts of this policy ban among residents in the Central Valley of California by measuring pre- and post-ban personal biomarkers of exposure to the chlorpyrifos-specific metabolite (TCPy) and other general markers of OP exposure (DAPs) as potential replacement pesticides for chlorpyrifos.
4.2. Key Findings
Contrary to our primary hypothesis, we did not observe reductions in the chlorpyrifos metabolite, TCPy, following the chlorpyrifos ban among the 49 participants with pre- and post-ban valid biomarker data. In fact, there was a significant increase in post-ban concentrations for TCPy in the Wilcoxon paired signed-rank tests, with results supported by the LMER models and not impacted by age, sex, urbanicity, agricultural work, or household pesticide use. For the secondary analysis of other OPs, there was support of our hypothesis of a significant increase in DMP found in the LMER models, despite other OPs not showing meaningful increases. The urban southwest Fresno neighborhood had reduced concentrations of DEP, total DE, and suggestively DMTP and total DM concentrations compared to agricultural neighborhoods, which was consistent with expectations as the proximity to agricultural operations are often considered a primary source of exposure [38,39].
There are several reasons that may help explain the lack of observed reductions in TCPy following California’s ban of sale and agricultural use. Chlorpyrifos is known to rapidly metabolize in humans, and urine samples may not accurately capture true exposure at different timepoints, which is also true of other OPs [40]. Urinary DAPs are not specific to the OP from which they are derived, and the increased post-ban levels that we observed could potentially reflect other sources via food or other environmental exposures [5]. For example, chlorpyrifos is known to wash easily into ground and surface waters, which leads to sediment accumulation and can contaminate aquatic systems, leading to exposure through contaminated water [18,41]. Chlorpyrifos has also been detected in residues in many agricultural products, including fruits and vegetables, which can then lead to exposure through ingestion [42,43]. Given the U.S. E.P.A.’s 2023 reversal of the ban to revoke any tolerance of chlorpyrifos on food [26,27], it is likely that people eating food produced outside of California will have ongoing exposure. Lastly, the OP urinary metabolites investigated in this paper can be formed as a natural byproduct of human metabolism, leading to a potential overestimate of the true OP exposure [44].
4.3. Pesticide Use Registry
California’s annual pesticide data are tracked through the publicly available agricultural pesticide application database, the California Pesticide Use Registry (PUR), managed by the California Department of Pesticide Regulation. While the PUR is useful for regulating and monitoring pesticide use in California, individual-level measures of biomarkers of personal exposure are needed for direct assessments but are difficult to obtain. The data from the PUR demonstrated sharp reductions in the OP used in this study region even prior to the ban, particularly chlorpyrifos. OP application in Fresno and Tulare Counties peaked in 2013 with 260,000 kg and 128,000 kg applied, respectively. In the years since, OP application dropped significantly; however, there were notably higher OP applications in the study region of Fresno and Tulare Counties comparing the pre-ban campaign (1–30 December 2020) with 697 kg vs. the post-ban campaign (19 February to 22 April 2022) with 3659 kg [45]. This difference is likely attributable to seasonal variation in OP application as the post-ban campaign was conducted as OP application began to increase for the growing season. The increases in OP use could also be due to alternative OP use as a replacement for chlorpyrifos. Practically no differences were reported in chlorpyrifos applications for the two study periods with 1.6 kg of chlorpyrifos reported for campaign 1 and 0.0 kg reported for campaign 2 [45]. This PUR data largely explains the secondary analysis which found increased levels of other OPs, specifically DMP, during the second time period (post-ban).
4.4. Ongoing Exposure of Chlorpyrifos
Despite little to no agricultural applications of chlorpyrifos during the sampling periods, according to the PUR for December 2020 and February through April 2022 [45], the increase post-ban of TCPy supports the likely ongoing exposure of chlorpyrifos in indoor and other environmental sources, as well as the potential for ingestion of chlorpyrifos residue on food. Several studies have documented the ongoing presence of chlorpyrifos in household dust [35,38,39,46]. The detection of higher OP concentrations in household carpet dust, even when restricted or limited for residential use, has been documented among agricultural homes compared to non-agricultural homes, highlighting the susceptibility of households located near orchards for pesticide exposure [38].
Our previous work in this study region found the presence of OPs in the home in household dust and the evidence of urinary OP metabolites among families living in high-exposure communities, suggesting a lack of pesticide degradation in indoor environments and ongoing exposure even when recent agricultural applications of OPs did not occur [35,36]. The household dust from former U.S. Forces’ residences in Frankfurt, Germany, also showed detectable at-home levels of chlorpyrifos, reflecting its previous use indoors from over four years prior to the measurements [46]. The data on OP metabolites in other populations, such as the 1999–2008 U.S. National Health and Nutrition Examination Survey, and studies conducted in Germany and Italy, have shown that urinary DAPs are frequently detectable in general populations [5,29,46,47,48].
The presence of OPs in household dust among agricultural homes has been found even after residential restrictions, with likely para-occupational pathways (e.g., residue transfer from outdoors to indoors via skin, clothes, and shoes) and pesticide spray drift due to the continuation of agricultural applications of OPs [38]. Furthermore, the evidence of chlorpyrifos exposure, despite virtually zero agricultural applications during the study period, highlights the likelihood of other routes of exposure, such as ingestion of chlorpyrifos residue on food as mentioned above.
4.5. Limitations and Strengths
There are important limitations of this study to note. Our sample size of 49 participants with paired pre- and post-ban urinary metabolite data was small with generally wide 95% CIs, suggesting possible imprecision in results. A future study would benefit from a larger sample size. The evidence of ongoing chlorpyrifos exposure in this study sample highlights the difficulty in measuring direct pesticide exposure since the exact routes of exposure cannot be identified through these methods. The increase in the chlorpyrifos-specific biomarker, TCPy, in the post-ban campaign despite no agricultural applications according to the PUR suggests that other routes of exposure existed for this study population, possibly dietary ingestion, indoor presence, or other environmental sources, yet we did not measure other possible routes of exposure for this study. There was a chance of overestimating OP exposures through urinary DAP analysis since DAPs can also result from environmental degradation of OPs in foods [5].
An additional limitation of TCPy is that it does not distinguish between chlorpyrifos and chlorpyrifos methyl, as both compounds break down into TCPy as a major metabolite. This means that the detection of TCPy in this study sample could indicate exposure to chlorpyrifos methyl, if it was also present in this environment. Chlorpyrifos methyl also metabolizes into DMP and DMTP, so the observed post-ban increases in their 75th percentiles could potentially be from exposure to chlorpyrifos methyl that also could explain increases in TCPy if it was a source of exposure [5]. The urinary DAPs metabolites are seen as a proxy of cumulative exposure to OPs without providing specificity from which OP it originated, which are known limitations of these types of studies [5]. The short half-lives of these metabolites further complicate accurate estimations of longer-term exposures, since our analysis likely represented a snapshot of potential recent exposure. This makes it difficult to understand true exposures from single urinary biomarker estimates and may lead to misclassifying individuals who may have been exposed at a different time but have already eliminated the metabolite.
Several strengths are also important to note, particularly the repeated measures of biomarkers of exposure in our cohort and the focus on residents living near agricultural operations. While the PUR data are important for statewide application reporting and tracking, there can be years-long delays in current data; our study reported individual-level data in real-time. In addition, the families that participated in our study emphasized the importance of this research given their widespread exposure through work, school, and home life. They also expressed their deep concerns about health impacts across the entire lifespan, particularly among newborn and school-aged children. Our study coordinator, through the CCEJN, reported that families discussed with him a sense of empowerment over learning more about the connections between environmental exposures and health impacts. Our findings highlight the need for further research to better understand how chlorpyrifos may still be used indoors for other applications not already banned, and how it may exist in household dust, imported foods, and other mediums from previous applications years ago.
5. Conclusions
Overall, the presence of chlorpyrifos was detected in both pre- and post-ban campaigns. We did not observe reductions in the urinary metabolites of chlorpyrifos following the 2020 statewide ban of chlorpyrifos sale and agricultural application for the state of California. Contrary to our expectations, there were significant increases in TCPy, the chlorpyrifos-specific metabolite, and other OP metabolites of DMP and a suggestive increase in total DM among this California-based study population. The presence of TCPy may reflect chlorpyrifos exposures in household dust, exposure through other sources such as food produced outside of California, water or other environmental sources, and difficulty in using urinary metabolites for direct exposure assessments all may explain these findings. The increase in DMP found in the second time period (post-ban) is likely explained by the seasonal application fluctuations with higher OP use during that time, as well as potentially other sources of exposure, as well. Eliminating chlorpyrifos exposures will require ongoing efforts to mitigate its continuity in both natural and built environments.
Supplementary Materials
The following supporting information can be downloaded at: https://www.mdpi.com/article/10.3390/environments12050140/s1, Table S1: Pre- and post-ban urinary biomarker concentrations (ng/mL) among participants with biomarker data available at both campaigns (n = 98 or n = 96, depending on the biomarker); Table S2: Spearman correlation coefficients between age and biomarkers (n = 96); Table S3: Sensitivity analyses; Figure S1: Box-and-whisker plots of pre- vs. post-ban urinary biomarkers available at both timepoints, stratified by sex (ng/mL) (n = 96 or n = 98, depending on the biomarker). These plots show the interquartile range with the lower boundary of the box the 25th percentile (Q1) and the upper boundary the 75th percentile (Q3), the line inside the box is the median, the whiskers extend to represent the range of data that falls within 1.5 times the IQR, and individual outliers are shown as dots; Figure S2: Line plots of urinary biomarkers’ median concentrations for pre- vs. post-ban campaigns (DEP, DMP, DMTP, Total De and Total DM n = 96, TCPy n = 98). TCPy and total DM had significant post-ban increases in their median concentrations.
Author Contributions
Formal analysis, B.N.Y.; investigation, B.N.Y., S.W., G.K., O.A., G.E., L.H.R., J.M., C.Q., L.S. and S.M.; methodology, B.N.Y., S.W., G.K., C.Q. and S.M.; supervision, B.N.Y., S.W., G.K. and S.M.; writing—original draft, B.N.Y.; resources, S.W. and G.D.; writing—review and editing, S.W., G.K., O.A., G.D., G.E., L.H.R., N.M., J.M., C.Q., L.S. and S.M.; project administration, N.M. and J.M.; conceptualization, C.Q. and S.M.; funding acquisition, S.M. All authors have read and agreed to the published version of the manuscript.
Funding
This research was funded by the National Institute of Environmental Health Sciences, grant number R21 ES032578. The funding source had no involvement in study design, data collection, analysis, interpretation, writing the paper, or deciding to submit the paper for publication. We thank our study communities and participants in the Central Valley of California for their ongoing support and engagement with this research.
Institutional Review Board Statement
All human subjects research was carried out in accordance with the Code of Ethics of the World Medical Association (Declaration of Helsinki). This study received human subjects’ approval by the Colorado State University’s Institutional Review Board (IRB #2643) and all study procedures were performed in compliance with Institutional Review Board guidelines.
Data Availability Statement
The raw data supporting the conclusions of this article will be made available by the authors on request. This article is a revised and expanded version of a paper with the same title, which was presented at the annual meeting for the International Society for Environmental Epidemiology (ISEE), Santiago, Chile, 26 August 2024 [49].
Acknowledgments
This research was secured by Colorado State University’s Office of Sponsored Programs (reference numbers 53-00814 and 53-63073). We gratefully acknowledge the R insights from Jessica Tryner at Access Sensor Technology and statistical consultation from Ann Hess at the Colorado State University’s Franklin A. Graybill Statistical Laboratory.
Conflicts of Interest
The authors have no competing interests to declare. The authors confirm this paper has not been previously published in part or in full and is not under consideration for publication elsewhere.
Abbreviations
| CCEJN | Central California Environmental Justice Network |
| CI | Confidence interval |
| CSU | Colorado State University |
| DAPs | Dialkyl phosphates |
| DEDTP | Diethyldithiophosphate |
| DEP | Diethylphosphate |
| DETP | Diethylthiophosphate |
| DMDTP | Dimethyldithiophosphate |
| DMP | Dimethylphosphate |
| DMTP | Dimethylthiophosphate |
| LMER | Linear mixed effects regression |
| Ln | Natural log-transformed |
| LOQ | Limit of quantification |
| OP | Organophosphate pesticide |
| PUR | California Pesticide Use Registry |
| REDCap | Research Electronic Data Capture |
| TCPy | 3,4,6-trichloro-2-pyridinol |
| Total DE | Total diethyl alkylphosphate |
| Total DM | Total dimethyl alkylphosphate |
References
- Franco Bernardes, M.F.; Pazin, M.; Pereira, L.C.; Dorta, D.J. Chapter 8: Impact of Pesticides on Environmental and Human Health. In Toxicology Studies: Cells, Drugs and Environment; Andreazza, A.C., Scola, G., Eds.; BoD—Books on Demand: Norderstedt, Germany, 2015. [Google Scholar]
- Tudi, M.; Daniel Ruan, H.; Wang, L.; Lyu, J.; Sadler, R.; Connell, D.; Chu, C.; Phung, D.T. Agriculture Development, Pesticide Application and Its Impact on the Environment. Int. J. Environ. Res. Public Health 2021, 18, 1112. [Google Scholar] [CrossRef] [PubMed]
- Statista Research Department. Pesticide Consumption Worldwide 2021. Statista. 20 September 2023. Available online: https://www.statista.com/statistics/1263069/global-pesticide-use-by-country/ (accessed on 1 May 2024).
- Nandi, N.K.; Vyas, A.; Akhtar, M.J.; Kumar, B. The growing concern of chlorpyrifos exposures on human and environmental health. Pestic. Biochem. Physiol. 2022, 185, 105138. [Google Scholar] [CrossRef]
- Sudakin, D.L.; Stone, D.L. Dialkyl phosphates as biomarkers of organophosphates: The current divide between epidemiology and clinical toxicology. Clin. Toxicol. 2011, 49, 771–781. [Google Scholar] [CrossRef]
- Kalyabina, V.P.; Esimbekova, E.N.; Kopylova, K.V.; Kratasyuk, V.A. Pesticides: Formulants, distribution pathways and effects on human health—A review. Toxicol. Rep. 2021, 8, 1179–1192. [Google Scholar] [CrossRef] [PubMed]
- Koutros, S.; Harris, S.A.; Spinelli, J.J.; Blair, A.; McLaughlin, J.R.; Zahm, S.H.; Kim, S.; Albert, P.S.; Kachuri, L.; Pahwa, M.; et al. Non-Hodgkin lymphoma risk and organophosphate and carbamate insecticide use in the north American pooled project. Environ. Int. 2019, 127, 199–205. [Google Scholar] [CrossRef] [PubMed]
- Lerro, C.C.; Koutros, S.; Andreotti, G.; Friesen, M.C.; Alavanja, M.C.; Blair, A.; Hoppin, J.A.; Sandler, D.P.; Lubin, J.H.; Ma, X.; et al. Organophosphate insecticide use and cancer incidence among spouses of pesticide applicators in the Agricultural Health Study. Occup. Environ. Med. 2015, 72, 736–744. [Google Scholar] [CrossRef] [PubMed]
- Hayden, K.M.; Norton, M.C.; Darcey, D.; Østbye, T.; Zandi, P.P.; Breitner, J.C.S.; Welsh-Bohmer, K.A. Occupational exposure to pesticides increases the risk of incident AD. Neurology 2010, 74, 1524–1530. [Google Scholar] [CrossRef]
- Tanner Caroline, M.; Freya, K.; Webster, R.G.; Hoppin Jane, A.; Goldman Samuel, M.; Monica, K.; Connie, M.; Bhudhikanok Grace, S.; Meike, K.; Chade Anabel, R.; et al. Rotenone, Paraquat, and Parkinson’s Disease. Environ. Health Perspect. 2011, 119, 866–872. [Google Scholar] [CrossRef]
- Wang, A.; Cockburn, M.; Ly, T.T.; Bronstein, J.; Ritz, B. The Association Between Ambient Exposure to Organophosphates and Parkinson’s Disease Risk. Occup. Environ. Med. 2014, 71, 275–281. [Google Scholar] [CrossRef]
- Bouchard, M.F.; Chevrier, J.; Harley, K.G.; Kogut, K.; Vedar, M.; Calderon, N.; Trujillo, C.; Johnson, C.; Bradman, A.; Barr, D.B.; et al. Prenatal Exposure to Organophosphate Pesticides and IQ in 7-Year-Old Children. Environ. Health Perspect 2011, 119, 1189–1195. [Google Scholar] [CrossRef]
- Marks, A.R.; Harley, K.; Bradman, A.; Kogut, K.; Barr, D.B.; Johnson, C.; Calderon, N.; Eskenazi, B. Organophosphate Pesticide Exposure and Attention in Young Mexican-American Children: The CHAMACOS Study. Environ. Health Perspect. 2010, 118, 1768. [Google Scholar] [CrossRef] [PubMed]
- Benka-Coker, W.; Loftus, C.; Karr, C.; Magzamen, S. Association of Organophosphate Pesticide Exposure and a Marker of Asthma Morbidity in an Agricultural Community. J. Agromed. 2020, 25, 106–114. [Google Scholar] [CrossRef]
- Benka-Coker, W.O.; Loftus, C.; Karr, C.; Magzamen, S. Characterizing the joint effects of pesticide exposure and criteria ambient air pollutants on pediatric asthma morbidity in an agricultural community. Environ. Epidemiol 2019, 3, e046. [Google Scholar] [CrossRef] [PubMed]
- Raanan, R.; Harley, K.G.; Balmes, J.R.; Bradman, A.; Lipsett, M.; Eskenazi, B. Early-life Exposure to Organophosphate Pesticides and Pediatric Respiratory Symptoms in the CHAMACOS Cohort. Environ. Health Perspect. 2015, 123, 179–185. [Google Scholar] [CrossRef]
- Slager, R.E.; Simpson, S.L.; LeVan, T.D.; Poole, J.A.; Sandler, D.P.; Hoppin, J.A. Rhinitis Associated with Pesticide Use Among Private Pesticide Applicators in the Agricultural Health Study. J. Toxicol. Environ. Health Part A 2010, 73, 1382–1393. [Google Scholar] [CrossRef] [PubMed]
- Echeverri-Jaramillo, G.; Jaramillo-Colorado, B.; Sabater-Marco, C.; Castillo-López, M.Á. Cytotoxic and estrogenic activity of chlorpyrifos and its metabolite 3,5,6-trichloro-2-pyridinol. Study of marine yeasts as potential toxicity indicators. Ecotoxicology 2021, 30, 104–117. [Google Scholar] [CrossRef]
- Hites, R.A. The Rise and Fall of Chlorpyrifos in the United States. Environ. Sci Technol 2021, 55, 1354–1358. [Google Scholar] [CrossRef]
- Burke, R.D.; Todd, S.W.; Lumsden, E.; Mullins, R.J.; Mamczarz, J.; Fawcett, W.P.; Gullapalli, R.P.; Randall, W.R.; Pereira, E.F.R.; Albuquerque, E.X. Developmental neurotoxicity of the organophosphorus insecticide chlorpyrifos: From clinical findings to preclinical models and potential mechanisms. J. Neurochem. 2017, 142 (Suppl. 2), 162–177. [Google Scholar] [CrossRef]
- Whyatt, R.M.; Rauh, V.; Barr, D.B.; Camann, D.E.; Andrews, H.F.; Garfinkel, R.; Hoepner, L.A.; Diaz, D.; Dietrich, J.; Reyes, A.; et al. Prenatal insecticide exposures and birth weight and length among an urban minority cohort. Environ. Health Perspect. 2004, 112, 1125–1132. [Google Scholar] [CrossRef]
- Rauh, V.A.; Garfinkel, R.; Perera, F.P.; Andrews, H.F.; Hoepner, L.; Barr, D.B.; Whitehead, R.; Tang, D.; Whyatt, R.W. Impact of prenatal chlorpyrifos exposure on neurodevelopment in the first 3 years of life among inner-city children. Pediatrics 2006, 118, e1845–e1859. [Google Scholar] [CrossRef]
- Rauh, V.A.; Perera, F.P.; Horton, M.K.; Whyatt, R.M.; Bansal, R.; Hao, X.; Liu, J.; Barr, D.B.; Slotkin, T.A.; Peterson, B.S. Brain anomalies in children exposed prenatally to a common organophosphate pesticide. Proc. Natl. Acad. Sci. USA 2012, 109, 7871–7876. [Google Scholar] [CrossRef]
- Steenland, K.; Dick, R.B.; Howell, R.J.; Chrislip, D.W.; Hines, C.J.; Reid, T.M.; Lehman, E.; Laber, P.; Krieg, E.F.; Knott, C. Neurologic function among termiticide applicators exposed to chlorpyrifos. Environ. Health Perspect. 2000, 108, 293–300. [Google Scholar] [CrossRef]
- Engel, L.S.; Werder, E.; Satagopan, J.; Blair, A.; Hoppin, J.A.; Koutros, S.; Lerro, C.C.; Sandler, D.P.; Alavanja, M.C.; Beane, F.L.E. Insecticide Use and Breast Cancer Risk among Farmers’ Wives in the Agricultural Health Study. Environ. Health Perspect. 2017, 125, 097002. [Google Scholar] [CrossRef] [PubMed]
- USEPAO EPA Update on the Use of the Pesticide Chlorpyrifos on Food. 2025. Available online: https://www.epa.gov/pesticide-worker-safety/epa-update-use-pesticide-chlorpyrifos-food (accessed on 13 March 2025).
- Federal Register, The Daily Journal of the United States Government. Chlorpyrifos; Reinstatement of Tolerances. Federal Register. 5 February 2024. Available online: https://www.federalregister.gov/documents/2024/02/05/2024-02153/chlorpyrifos-reinstatement-of-tolerances (accessed on 13 March 2025).
- Price, A. California Bans Poisonous Agricultural Pesticide. In UC Berkeley Public Health; Published Online 18 October 2019; Available online: https://publichealth.berkeley.edu/news-media/school-news/california-bans-poisonous-agricultural-pesticide#:~:text=Last%20week%2C%20the%20California%20Environmental,the%20end%20of%20the%20year (accessed on 10 June 2024).
- Gillezeau, C.; Alpert, N.; Joshi, P.; Taioli, E. Urinary Dialkylphosphate Metabolite Levels in US Adults—National Health and Nutrition Examination Survey 1999–2008. Int. J. Environ. Res. Public Health 2019, 16, 4605. [Google Scholar] [CrossRef] [PubMed]
- National Agricultural Statistics Service. 2017 Census of Agriculture County Profile; Department of Agriculture: Fresno County, CA, USA, 2019.
- National Agricultural Statistics Service. 2017 Census of Agriculture County Profile; Department of Agriculture: Tulare County, CA, USA, 2019.
- Cha, P. Health Care Access among California’s Farmworkers; Public Policy Institute of California: San Francisco, CA, USA, 2022; Available online: https://www.ppic.org/publication/health-care-access-among-californias-farmworkers/ (accessed on 17 August 2022).
- National Agricultural Statistics Service. 2017 Census of Agriculture—County Data, California; Table 7 Hired Farm Labor-Workers and Payroll: 2017; United States Department of Agriculture: Washington, DC, USA, 2019.
- Hughes, M.L.; Kuiper, G.; Hoskovec, L.; WeMott, S.; Young, B.N.; Benka-Coker, W.; Quinn, C.; Erlandson, G.; Martinez, N.; Mendoza, J.; et al. Association of ambient air pollution and pesticide mixtures on respiratory inflammatory markers in agricultural communities. Environ. Res Health 2024, 2, 035007. [Google Scholar] [CrossRef] [PubMed]
- Kuiper, G.; Young, B.N.; WeMott, S.; Erlandson, G.; Martinez, N.; Mendoza, J.; Dooley, G.; Quinn, C.; Benka-Coker, W.O.; Magzamen, S. Factors Associated with Levels of Organophosphate Pesticides in Household Dust in Agricultural Communities. Int. J. Environ. Res. Public Health 2022, 19, 862. [Google Scholar] [CrossRef]
- Kuiper, G.; Young, B.N.; WeMott, S.; Erlandson, G.; Martinez, N.; Mendoza, J.; Dooley, G.; Quinn, C.; Benka-Coker, W.; Magzamen, S. Factors affecting urinary organophosphate pesticide metabolite levels among Californian agricultural community members. Sci. Total Environ. 2023, 881, 163362. [Google Scholar] [CrossRef]
- Harris, P.A.; Taylor, R.; Thielke, R.; Payne, J.; Gonzalez, N.; Conde, J.G. Research electronic data capture (REDCap)--a metadata-driven methodology and workflow process for providing translational research informatics support. J. Biomed. Inform. 2009, 42, 377–381. [Google Scholar] [CrossRef]
- Butler-Dawson, J.; Galvin, K.; Thorne, P.S.; Rohlman, D.S. Organophosphorus pesticide residue levels in homes located near orchards. J. Occup. Environ. Hyg. 2018, 15, 847–856. [Google Scholar] [CrossRef]
- Quirós-Alcalá, L.; Alkon, A.D.; Boyce, W.T.; Lippert, S.; Davis, N.V.; Bradman, A.; Barr, D.B.; Eskenazi, B. Maternal prenatal and child organophosphate pesticide exposures and children’s autonomic function. Neurotoxicology 2011, 32, 646–655. [Google Scholar] [CrossRef]
- Barr, D.B.; Angerer, J. Potential uses of biomonitoring data: A case study using the organophosphorus pesticides chlorpyrifos and malathion. Environ. Health Perspect. 2006, 114, 1763–1769. [Google Scholar] [CrossRef]
- Tobón Marulanda, F.; López Giraldo, L.; Paniagua, E. Water pollution caused by pesticides in an area of Antioquia. Rev. Salud Pública 2010, 12, 300–307. [Google Scholar]
- Foong, S.Y.; Ma, N.L.; Lam, S.S.; Peng, W.; Low, F.; Lee, B.H.K.; Alstrup, A.K.O.; Sonne, C. A recent global review of hazardous chlorpyrifos pesticide in fruit and vegetables: Prevalence, remediation and actions needed. J. Hazard. Mater. 2020, 400, 123006. [Google Scholar] [CrossRef]
- Wołejko, E.; Łozowicka, B.; Jabłońska-Trypuć, A.; Pietruszyńska, M.; Wydro, U. Chlorpyrifos Occurrence and Toxicological Risk Assessment: A Review. Int. J. Environ. Res. Public Health 2022, 19, 12209. [Google Scholar] [CrossRef] [PubMed]
- Krieger, R.I.; Dinoff, T.M.; Williams, R.L.; Zhang, X.; Ross, J.H.; Aston, L.S.; Myers, G. Correspondence: Preformed biomarkers in produce inflate human organophosphate exposure assessments. Environ. Health Perspect 2003, 111, A688–A689, author reply A89-91. [Google Scholar] [CrossRef] [PubMed]
- California Department of Pesticide Regulation. Pesticide Use Reporting Data Homepage. 2022. Available online: https://www.cdpr.ca.gov/docs/pur/purmain.htm (accessed on 10 October 2024).
- Heudorf, U.; Angerer, J. Metabolites of organophosphorous insecticides in urine specimens from inhabitants of a residential area. Environ. Res. 2001, 86, 80–87. [Google Scholar] [CrossRef] [PubMed]
- Aprea, C.; Sciarra, G.; Orsi, D.; Boccalon, P.; Sartorelli, P.; Sartorelli, E. Urinary excretion of alkylphosphates in the general population (Italy). Sci. Total Environ. 1996, 177, 37–41. [Google Scholar] [CrossRef]
- Heudorf, U.; Angerer, J.; Drexler, H. Current internal exposure to pesticides in children and adolescents in Germany: Urinary levels of metabolites of pyrethroid and organophosphorus insecticides. Int. Arch. Occup. Environ. Health 2004, 77, 67–72. [Google Scholar] [CrossRef]
- Young, B.N.; Wemott, S.; Alvarez, O.; Dooley, G.; Erlandson, G.; Hernandez, L.; Kuiper, G.; Martinez, N.; Mendoza, J.; Quinn, C.; et al. Effect of California’s 2020 chlorpyrifos ban on urinary biomarkers of pesticide exposure in agricultural communities. ISEE Conf. Abstr. 2024, 2024. [Google Scholar] [CrossRef]
Disclaimer/Publisher’s Note: The statements, opinions and data contained in all publications are solely those of the individual author(s) and contributor(s) and not of MDPI and/or the editor(s). MDPI and/or the editor(s) disclaim responsibility for any injury to people or property resulting from any ideas, methods, instructions or products referred to in the content. |
© 2025 by the authors. Licensee MDPI, Basel, Switzerland. This article is an open access article distributed under the terms and conditions of the Creative Commons Attribution (CC BY) license (https://creativecommons.org/licenses/by/4.0/).