Article

Evaluation of Cadmium Removal in an Aqueous Solution by Biosorption in a Batch System with Banana, Peanut, and Orange Husks

by
Dayana Odette Arizpe-Díaz
1,
Sergio Arturo Gama-Lara
1,*,
Gabriela Roa-Morales
2,*,
Alfredo Rafael Vilchis-Néstor
2,
Alejandro Parada-Flores
1 and
Patricia Balderas-Hernández
2
1
Engineering Department, CIIDETEC-Toluca, Universidad del Valle de México, Toluca 52164, Mexico
2
Centro Conjunto de Investigación en Química Sustentable UAEM-UNAM, Carretera Toluca-Atlacomulco Km 14.5, San Cayetano, Toluca 50200, Mexico
*
Authors to whom correspondence should be addressed.
Environments 2025, 12(4), 97; https://doi.org/10.3390/environments12040097
Submission received: 13 February 2025 / Revised: 15 March 2025 / Accepted: 18 March 2025 / Published: 21 March 2025

Abstract

:
At present, the amount of heavy metals in some aquifers exceeds the limits established by standards, especially in developing countries. Cadmium is present in high concentrations in aquifers; contact with cadmium can lead to some adverse health effects. Adsorption is one of the most efficient and low-cost methods currently used to separate heavy metals from water systems. In order to obtain a sustainable heavy metal adsorption system, abundant, low-cost, biodegradable, and easy-to-treat organic waste compounds were sought. Three biosorbents were chosen: orange, peanut, and banana peel, which, due to their functional groups, can attract the positive ions of metals and form a bond that allows them to be absorbed and separated from the aqueous solution. The presence of functional groups such as -OH, -CO, -COO, and -N-H were found to be the main responsible for biosorption (FTIR). Square wave voltammetry was used to analyze the amount of cadmium in an aqueous solution. It was found that the systems with the best adsorption capacities were untreated peanut peel (284.2 mg/g), untreated orange peel (275.5 mg/g), and treated banana peel (229.21 mg/g). Treatment of the peels for cadmium uptake is not recommended.

1. Introduction

Water is one of the essential substances for the development of life. Rodriguez et al. have reported that in developed countries, the sector with the highest freshwater consumption is the industrial sector, with 59%; additionally, 70% of industrial waste is discharged into the water without prior treatment, causing water pollution [1]. Heavy metals are a group of metals and metalloids whose atomic density is greater than 4000 kg/m3; almost all heavy metals are toxic to the environment and living beings [2,3].
Several methods have been used to remove heavy metals in water, the most widely used being chemical precipitation, coagulation, ion exchange, use of membranes, and electrochemical technologies; these methods have certain disadvantages, such as the production of large amounts of sediments with toxic content, the need for subsequent treatments, not completely removing heavy metals, high operating and investment costs, sensitivity to changes in pH, not being very selective, only good for small amounts of heavy metals, and the need for electricity [3]. In adsorption separation, activated carbon, chitosan, zeolite, silica, and clay-based adsorbents stand out. Some magnetic materials have been developed to remove iron particles; however, they are not effective with other types of heavy metals. The chemical modification method is practical, although it requires previous processes, such as sediment separation, and large amounts of sludge are produced [4].
Cadmium is classified as a heavy metal and is one of the most toxic elements. The main activities that emit cadmium into the environment are industrial, mining, metallurgical, manufacture and application of phosphate fertilizers, and incineration of urban waste [5]. Contact with cadmium can lead to some adverse health effects, such as liver toxicity, lung cancer, and diseases related to the respiratory system, liver, kidneys, and reproductive organs [6,7,8]; moreover, it has been shown that high concentrations of Cd in crops can have repercussions on their development and photosynthetic activity, limiting their growth and size [9]. According to the Mexican Official Standard NOM 021 SEMARNAT 2021, the maximum allowed concentration of cadmium in rivers, streams, canals, and drains is 0.2 mg/L, and the United States Environmental Protection Agency (USEPA, 2011) is 0.04 mg/L [10].
Biosorption is defined as the physicochemical process involving the phenomena of weak adsorption, such as hydrogen bond, and union of molecules or ions (sorbate in a solvent) with the functional groups of biomasses (solid phase) [11]. The adsorption is a low-cost, easy operation with excellent adsorption capacity and is one of the most widely used methods for removing heavy metals from freshwater [4]. The efficiency of bioadsorption depends on factors such as pH, amount of metal ions, amount of biosorbent, pore size, temperature, and contact time, among others [12,13]. The advantage of using biosorbents for metal removal is due to their wide variety of functional groups according to the origin of the biomaterial, and depending on the pH, the adsorption capacity can be improved [6,11].
Biosorbent materials composition presents chemical species such as polysaccharides, proteins, and lipids that are, in turn, composed of numerous functional groups (carboxylic, hydroxyl, amines, and phosphates, among others) capable of forming bonds with metal ions. The different functional groups have different degrees of affinity to various heavy metals [11,14]. The effectiveness of various biosorbents has been tested. For example, jengkol shell has been used to absorb Cr(VI) and Cr(III) with an adsorption capacity of 24.94 and 39.06 mg/g, respectively [15], and yellow passion-fruit shell with an adsorption capacity of 151.6 mg/g for Pb(II) and 85.1 mg/g for Cr(III) [16]. Protonated dry alginate bead was used to absorb Cr(III) at a pH of 4.5 with an adsorption capacity of 112 mg/g [17]. The adsorption capacity of the sargassum with Cr(VI) at pH 2.0 was 1.123 mmol/g [18]. Activated carbon from sugar industrial waste had an adsorption capacity to Cr(III) of 30 mg/g [19]. As(V) was absorbed by peanut shell biochar with an adsorption capacity of 5.01 mg/g [20]. Cd(II) removal with various biosorbents showed different adsorption capacities, such as de-oiled palm kernel cake was 1.0857 mg/g [21], bean pod red cargamanto was 3.907 mg/g [22], and, using areca waste, 1.12 mg/g were obtained [23]. This last biosorbent showed better adsorption capacity with Cu2+ ions for copper 2.84 mg/g [23].
Table 1 presents a series of studies comparing the adsorption capacity of natural and treated biosorbents. In this table, we can see that depending on the biosorbent and the heavy metal, the adsorption capacity is higher in the natural biosorbent and, at other times, in the biosorbent with a previous treatment.
Removal efficiencies of biomaterials, such as orange peel, are due to its chemical composition since it has pectin (42.5%), soluble sugar (16.9%), hemicellulose (10.5%), cellulose (9.21%), and proteins (6.5%) [18]. It has been reported that biosorption in citrus is mainly carried out by the carboxylic acid functional groups present in pectin, and the treatment of the peel with citric acid and alkali increased the carboxylic groups, improving the sites for biosorption with metals [14]. On the other hand, biosorption by orange peel has been reported with an adsorption capacity of 37.7 mg/g of Cd [14,24] and, for As(V), of 60.9 mg/g [25].
Table 1. Comparison table of biosorbents, natural and modifieds, in the removal of heavy metals and their adsorption capacity.
BiosorbentHeavy MetalAdsorption Capacity (mg/g)
UntreatedTreated
Plantain skewer [26]Cadmium476.1980
Chrome625277.7
Lead370.7196.1
Zinc116.3147.05
Corn rachis [27]Lead4.9712.44
Orange peel [28]Cadmium 0.4760.071
Rice husk [28]0.5967.007
Orange peel [29]Lead496.3349.98
Banana peel [29]Lead193359
In the case of banana peel, it is composed of lignin (6–12%), pectin (10–21%), cellulose (7.6–9.6%), and hemicellulose (6.4–9.4%). It has been reported that biosorption is due to functional groups present in lignin and pectin, especially the carboxyl groups of galacturonic acid [30,31]. Metal adsorption studies have been carried out using banana peel for removal of Cu(II) and Pb(II), obtaining an adsorption capacity of 29.26 mg/g and 39.32 mg/g [32]. Other biomaterials, such as peanut shells, are composed of cellulose (40–50%), hemicellulose (3–30%), and lignin (5–32%) [6,33,34]. The biosorption of Pb(II) by peanut shells was reported, obtaining an adsorption capacity of 38.9 mg/g [34]. Like in banana peel, lignin in peanut shells is of great importance in biosorption, as it contains carboxyl, phenolic, and carbonyl groups, which can attract and bond with metal groups by donating electrons and forming stable complexes [6,35].
It has been reported that the pH at which biosorption takes place has a significant impact on the amount of heavy metal biosorbed. Wattanakornsiri et al. reported better biosorption of Pb and Cd by dragon fruit peel, rambutan peel, and passion fruit peel at pH 4.0 [36]. Using banana and orange peels, it was reported that the ideal pH for the sorption of Co, Cu, Ni, and Zn is between 5.0 and 8.0. At very low pH, hydrogen competes with heavy metals for the active site, thus decreasing the sorption capacity of the biosorbent [37]. Shenwari et al. biosorbed Cd by means of banana peels, reporting that the pH with the highest removal percentages was between 5.0 and 8.0 [38]. On the other hand, Pb and Cd biosorption by banana peel was reported, obtaining the highest removal efficiency with pH values between 6.0 and 8.0 [39]. Therefore, it was decided to use a pH of 5.5 for the biosorption of Cd by the different biomasses.
The purpose of this work is to characterize the different biosorbents to know their topography, structure, and chemical composition. A controlled biosorption study of cadmium is performed to evaluate the adsorption capacity and the adsorption efficiency of each of the systems.

2. Materials and Methods

2.1. Biomass Extraction

Orange, banana, and peanut peels were cut into pieces of approximately 5 cm and subsequently washed with abundant water to eliminate the presence of undesirable compounds such as soil residues. They were then dried for 24 h in a laboratory oven at 60 °C in order to eliminate moisture. The untreated shells were pulverized in a blender and sieved with a #35 mesh sieve.

2.2. Chemically Modified Biomasses

Modified orange peel: For the demethoxylated process, 30 g of the biomass (orange peel) was mixed in 500 mL of a 0.2 M NaOH solution. The mixture was subjected to constant agitation for 2 h. The mixture was then washed with deionized water to eliminate the excess of NaOH. Subsequently, the biomass was dried in an oven at a temperature of 40 °C for 2 h. To perform the cross-linking of the biomass, 500 mL of a 0.2 M CaCl2 solution was added to 20 g of demethoxylated biomass, adjusting to a pH value of 5.5 (0.1 M HCl). The mixture was kept under constant agitation at 200 rpm for 24 h using a magnetic stirrer. After stirring, the mixture was washed to remove excess calcium. It was then filtered and dried in an oven at 60 °C for 6 h. Finally, the resulting material was pulverized in a blender and sieved with a sieve formed by a #35 mesh.
Modified banana peel: The banana peels were placed in a 0.1 M sodium hydroxide NaOH solution with magnetic stirring for 2 h at room temperature. Afterward, they were washed with deionized water to eliminate the excess of NaOH. Subsequently, the biomass was dried in a temperature range of 60 °C for 6 h. Finally, the resulting material was pulverized in a blender and sieved with a #35 mesh sieve.
Modified peanut shells: The shells were treated with 1 M HCl for 10 min at boiling temperature. Subsequently, they were washed with 0.5% v/v NaClO. At the end of this process, drying was carried out at 60 °C for 6 h. Finally, the resulting material was pulverized in a blender and sieved with a #35 mesh sieve.

2.3. Characterization

  • Characterization of biosorbents before and after biosorption.
In order to identify the functional groups, the infrared spectroscopy technique was carried out. An Agilent Cary 630 FTIR equipment (Santa Clara, CA, USA) with ATR sampling module with serial number MY2149CUo5 was used. Scanning electron microscopy (SEM) technique was performed for morphology analysis in a JEOL JSM-6510LV equipment (Tokyo, Japan), coupled with energy dispersive X-ray spectroscopy (EDS) detector from Oxford for elemental analysis. For the zeta potential analysis of the original biomass, the systems were prepared at the same conditions as the contact 10 mg of adsorbent in 10 mL of water at pH = 5.5 using a Zetasizer Nano ZS instrument (Malvern Panalytical Inc., Westborough, MA, USA).
  • Batch study for biosorption of cadmium.
100 mL of a 0.1 M aqueous solution of cadmium nitrate (Cd(NO3)2) was prepared for the batch experiment; 0.5 g of each of the six samples were weight, untreated orange peel (UOP), treated orange peel (TOP), untreated banana peel (UBP), treated banana peel (TBP), untreated peanut shell (UPS), and treated peanut shell (TPS). To each weighed sample, 10 mL of solution 1 was added. The samples were kept under constant agitation at 10 rpm for 24 h at a temperature of 19 ± 1 °C for the system to reach equilibrium. After this time, the samples were centrifuged for 5 min at 3000 rpm, and the supernatant was extracted.
  • Characterization, identification, and quantification of cadmium by cyclic voltammetry.
To quantify cadmium during the adsorption processes, the anodic stripping voltammetry technique with square wave was used using a BAS Epsilon potentiostat with a three-electrode system: Ag/AgCl (3 M KCl) was a reference, a graphite rod was used as an auxiliary, and a carbon paste electrode (CPE) was used as a working electrode. The conditions used to perform the calibration curve were selected from a cyclic voltammogram of a 1 × 10⁻⁵ M Cd (II) using 0.1 M HClO4 as support electrolyte, where the reduction wave was observed with a cathodic peak potential (Epc) of −1.5 V and the oxidation peak potential (Epa) at −0.55 V, as shown in Figure 1.
To perform the calibration curve, a reading was taken at 20 mL of 1 M HClO4, with the following parameters: deposited potential (Ed) of −1.5 mV and final potential (Ef) of −500 mV, a deposition time (td) of 10 s, potential pulse height (Ep) 25 mV, and a frequency of 15 Hz. Afterward, readings were performed by adding different volumes (microliters) of a 0.1 M cadmium nitrate solution in 1 M perchloric acid to reach concentrations of 100, 400, 800, 2000, 3000, 5000, and 7000 ppm of Cd; variations in the peak depending on the cadmium concentration were observed and recorded. To create the carbon paste, working electrode, graphite, and mineral oil were mixed in proportions of 1:1 until a homogeneous paste was formed [6,40,41,42,43,44,45,46,47,48,49,50,51,52,53,54,55].
For the quantification of the cadmium present in the samples after contact with each of the biomass, a 3 mL aliquot was taken, and a 1:5 dilution in 1 M perchloric acid was performed. The dilution was read on the potentiostat using the same parameters used in the calibration curve. The adsorption capacity (qc) mg/g was calculated with the following formula:
q c = C o C e V m
where qc is the adsorption capacity (mg/g), Co is the initial concentration of solute (adsorbate) in solution (mg/L), Ce is the concentration of solute at equilibrium (mg/L), V is volume of solution (L), and m is the mass of adsorbent (g).
The adsorption efficiency (%RE) was calculated with the following formula:
% R E = C o C e 100 C o
where %RE is the adsorption efficiency, Co is the initial concentration of solute (adsorbate) in solution (mg/L), and Ce is the concentration of solute at equilibrium (mg/L) [56].

3. Results

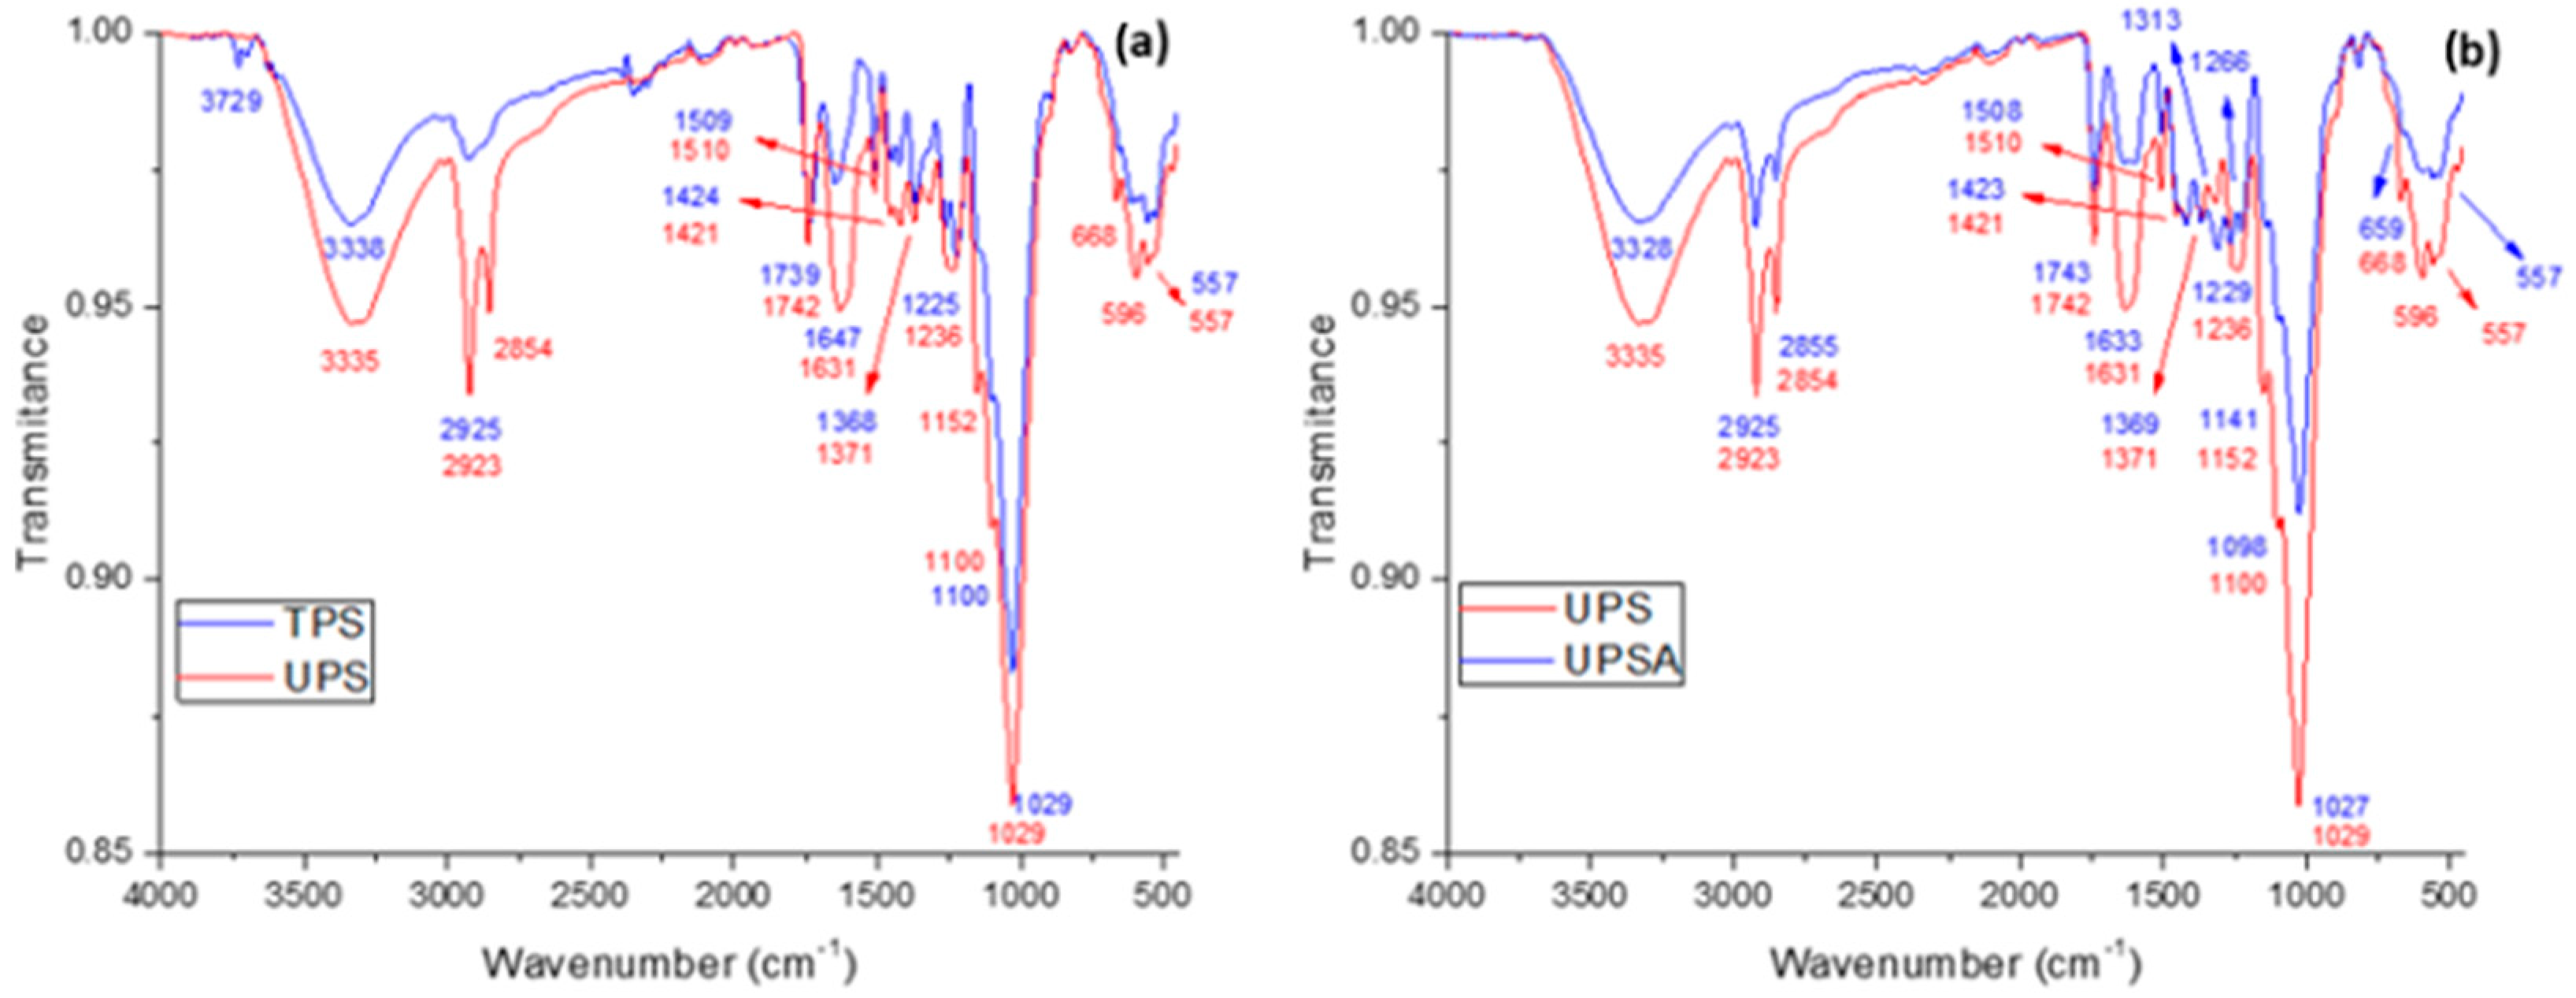
3.1. Fourier Transformation Infrared Spectroscopy (FTIR)

Figure 2 shows FTIR spectrum of the following peanut shell samples; the spectrum shows peaks with different intensities representing different chemical bonds of the molecules that compose the samples. The red spectra in Figure 2a,b correspond to the UPS sample where peaks can be seen in the following wavenumbers: 3335 cm−1 (O-H stretching vibration peak indicated the presence of phenols and alcohols of cellulose and lignin), 2923 cm−1 and 2854 cm−1 (C-H stretching vibrations alkanes and alkenes of cellulose), 1742 cm−1 (C=O stretching of carboxylic acid or pectin ester), and 1631 cm−1 (COO of acetyl group in hemicelluloses or the ester and carboxyl acid in hemicellulose, lignin, or pectin), 1510 cm−1 (C=C stretching vibration from the phenyl rings of lignin), 1421 cm−1 (COO of polysaccharides), 1371 cm−1 (symmetric CH3 flection in methyl and phenol alcohols), 1236 cm−1 (C-O carboxyl band in lignin), 1152 cm−1 (asymmetric C-O extension), 1100 cm−1 (symmetric C-O extension), 1029 cm−1 (-C-OH stretching vibration of alcoholic groups in cellulose and hemicelluloses), and 668 cm−1 and 596 cm−1 (C-H out-of-plane bending in benzene derivatives) [33,34].
The blue spectrum in Figure 2a corresponds to the TPS sample and the red to UPS; it can be observed that most of the peaks changed their intensity and wavenumber with the chemical treatment. This is due to a change in the chemical composition of the sample. The most significant changes occurred in the peak at 3335 cm−1, shifting position to 3338 cm−1 (OH) and decreasing the intensity of the peak; the same happens at 1631 cm−1 to 1647 cm−1 (COO), 1421 cm−1 to 1424 cm−1 (COO), and 1029 cm−1 (-C-OH). The chemical treatment of the sample significantly decreased the peaks and shifts from 2923 and 2854 cm−1 (CH).
Moreover, the blue spectrum in Figure 2b corresponds to the UPSA sample and the red to UPS; a decrease in the peaks can be observed at 3335 cm−1 (OH), 2923 cm−1 (CH), 2854 cm−1 (CH), 1742 cm−1 (C=O), 1631 cm−1 (COO), 1236 cm−1 (C-O), and 1029 cm−1 (-C-OH) cm−1 and a shift in spectral band positions to 3328, 2925, 2855, 1743, 1633, 1229, and 1027 cm−1, respectively. These modifications could be associated with the biosorption of Cd by the untreated peanut shell. The functional groups mainly affected by the Cd+ ions exchange were -OH, -CO, and -COO (carboxyl groups) [16,21,25,32].
Figure 3a shows the FTIR spectra of the samples TBP (red) and UBP (blue) and Figure 3b TBP (red) and TBPA (blue). The red spectrum in Figure 3a,b corresponds to the TBP sample where peaks are observed at 3294 cm−1 (OH groups present in carbohydrates and phenolic groups in fruit peels), 2919 cm−1 and 2852 cm−1 (C-H stretching vibrations in alkanes and alkenes), 1734 cm−1 (C=O stretching of carboxylic acid or pectin ester in hemicellulose), 1605 cm−1 (-CO stretching of carboxylic acid with intermolecular hydrogen bond), 1318 cm−1 (C-O stretching group in acids, alcohols, phenols, ethers, and esters), 1231 cm−1 (C-O stretching in lignin), 1148 cm−1 (C-O stretching vibration), 1029 cm−1 (-C-O stretching of alcoholic groups), and 780 cm−1 (C-H out-of-plane bending in benzene derivatives) [57].
The blue spectrum in Figure 3a corresponds to the UBP sample and the red to TBP; it can be observed that most of the peaks changed their intensity and wavenumber with the chemical treatment. This is due to a change in the chemical composition of the sample. The most relevant changes occurred in the peak at 3294 cm−1, shifting position to 3277 cm−1 (OH) and a growth in the intensity of the peak. These changes can also be observed at 2919 cm−1 to 2920 cm−1 (CH), 2852 cm−1 to 2853 cm−1 (CH), 1605 cm−1 to 1588 cm−1 (-CO), 1373 cm−1 to 1376 cm−1 (CH3), 1234 cm−1 to 1231 cm−1 (C-O), 1029 cm−1 to 1028 cm−1 (-C-O), and 780 cm−1 to 777 cm−1 (-N-H).
Moreover, the blue spectrum in Figure 3b corresponds to the TBPA sample and the red to TBP; a decrease in the peaks can be observed at 3277 cm−1 (OH), 2920 cm−1 (CH), 2853 cm−1 (CH), 1735 cm−1 (C=O), 1588 cm−1 (-COO), 1376 cm−1 (CH3), 1028 cm−1 (-C-O,) and 777 cm−1 (-N-H) and a shift in spectral band positions to 3326, 2919, 2852, 1734, 1585, 1374, 1027, and 778 cm−1, respectively. These modifications could be associated with the biosorption of Cd by the untreated peanut shell. The functional groups mainly affected by the Cd2+ ions exchange were OH, CO, and COO (carboxyl groups) and -N-H groups [16,21,25,32].
Figure 4a shows the FTIR spectra of the TOP (red) and UOP (blue) samples and Figure 4b UOP (blue) and UOPA (red). The red spectrum in Figure 4a,b corresponds to the UOP sample where peaks are observed at 3292 cm−1 (OH groups present in carbohydrates, alcoholic, and phenolic groups in fruit peels), 2922 cm−1 (C-H stretching vibrations of alkanes), 1739 cm−1 (C=O stretching of carboxylic acid or pectin ester), 1606 cm−1 and 1434 cm−1 (COO symmetric and/or asymmetrical–vibration bands could be associated with ionic carboxylate groups), 1368 cm−1 (CH3 symmetric flection in methyl and phenol alcohols), 1230 cm−1 (C-O carboxyl band corresponding to pectin), 1048 cm−1 (-C-O stretching of alcoholic groups), 1015 cm−1 (C-OH and C-OR groups present in carbohydrates), and 816 cm−1 (-N-H group from the protein molecules) [25,57].
The blue spectrum in Figure 4a corresponds to the UOP sample and the red to TOP. In the same way as the previous biosorbents, most of the peaks changed their intensity and wavenumber with the chemical treatment. The most significant changes occurred in the peak at 3292 cm−1, shifting position to 3304 cm−1 (OH) and decreasing the intensity of the peak. The same happens at 1739 to 1731 cm−1 (C=O), 1368 to 1367 cm−1 (CH3), and 1015 to 1011 cm−1 (C-OH) and decreases at 1230 cm−1 (C-O); a shift of position and growth in the intensity was observed at 2922 to 2919 cm−1 (C-H), 1606 to 1604 cm−1 (-COO), and 1434 to 1421 cm−1 (-COO).
Finally, the red spectrum in Figure 4b corresponds to the UOPA sample and the blue to UOP; a decrease in the peaks can be observed at 3292 cm−1 (OH), 1606 cm−1 (COO), 1230 cm−1 (C-O), 1015 cm−1 (-C-OH), and 764 cm−1 (-N-H) and a shift in spectral band positions to 3332, 1601, 1233, 1011, and 816 cm−1, respectively, and decrease in the peaks 2922 cm−1 (C-H) and 1739 cm−1 (C=O). These modifications could be associated with the biosorption of Cd by the untreated orange peel. The functional groups mainly affected by the Cd2+ ions exchange were OH, CO, COO (carboxyl groups), and -N-H groups [16,21,25,32].

3.2. Scanning Electron Microscopy (SEM)

Figure 5 shows SEM images of (a) TBPA, (b) UBPA, (e) TOPA, (f) UOPA, (i) TPSA, and (j) UPSA. A more irregular morphology can be observed on the surface of untreated samples compared to the samples with chemical treatment; a decrease in the pore size is observed. Figure 5c TBPA, (d) UBPA, (g) TOPA, (h) UOPA, (k) TPSA, and (l) UPSA shows the results of the EDS elemental mapping of SEM for Cd.
Figure 5c,d shows the cadmium distribution over TBPA and UBPA, which shows a slightly more homogeneous distribution and a slightly higher density in the TBPA sample. Figure 5g,h,k,l shows the cadmium distribution over TOPA, UOPA, TPSA, and UPSA, respectively. UOPA and UPSA have a more homogeneous cadmium distribution on their surface and a higher density compared to TOPA and TPSA, which translates into a higher amount of cadmium absorbed by the sample.
To determine the elemental composition of biosorbents after adsorption EDS elemental analysis was performed, this is a semi-quantitative analysis. Table 2 shows the presence of elements like carbon, oxygen, silicon, and sodium present in the different biosorbents; likewise, cadmium is observed in all biosorbents, highlighting UPSA with 12.04%, TBPA with 13.60%, and UOPA with 15.57%.

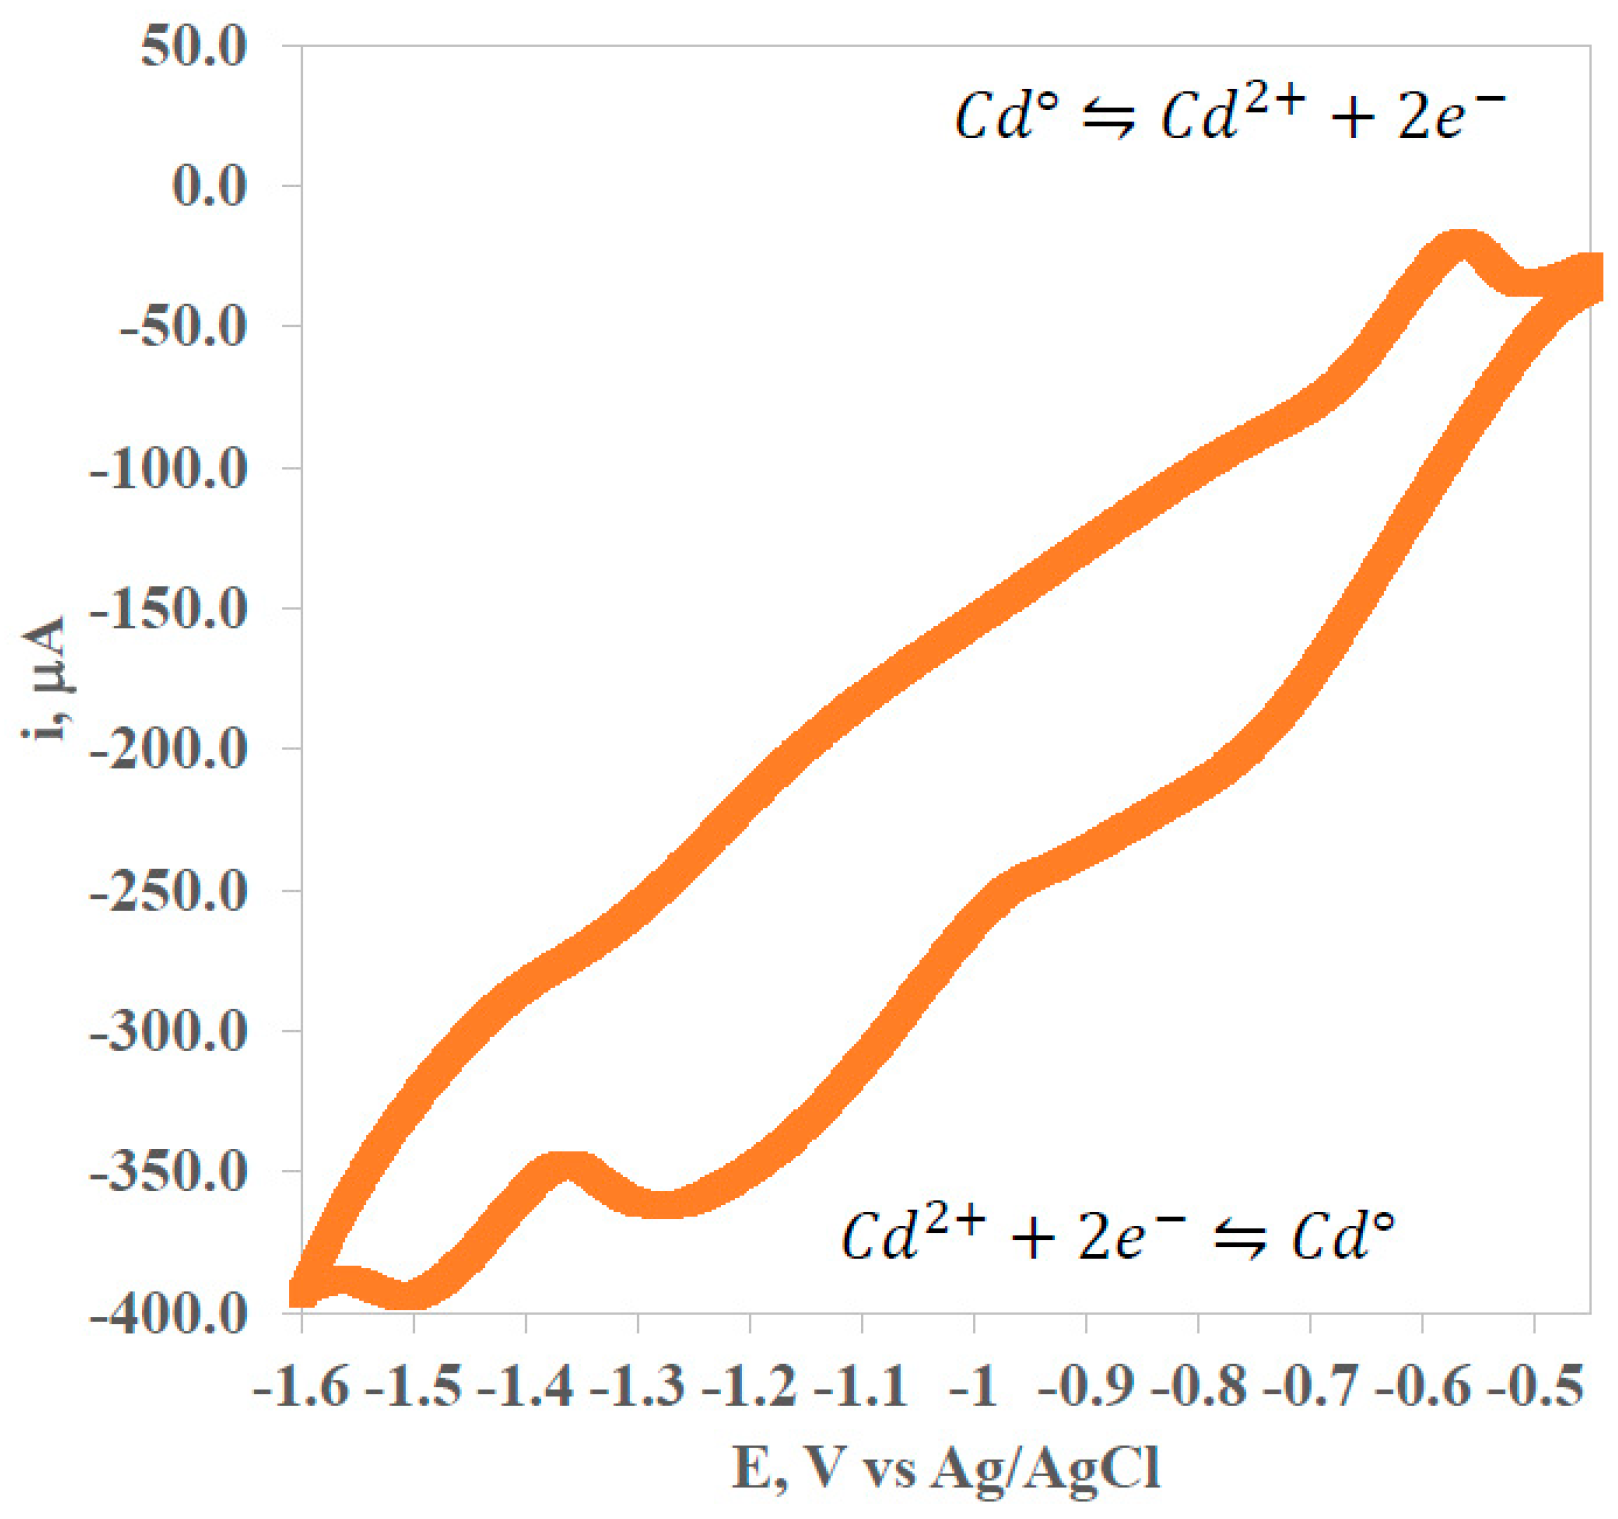
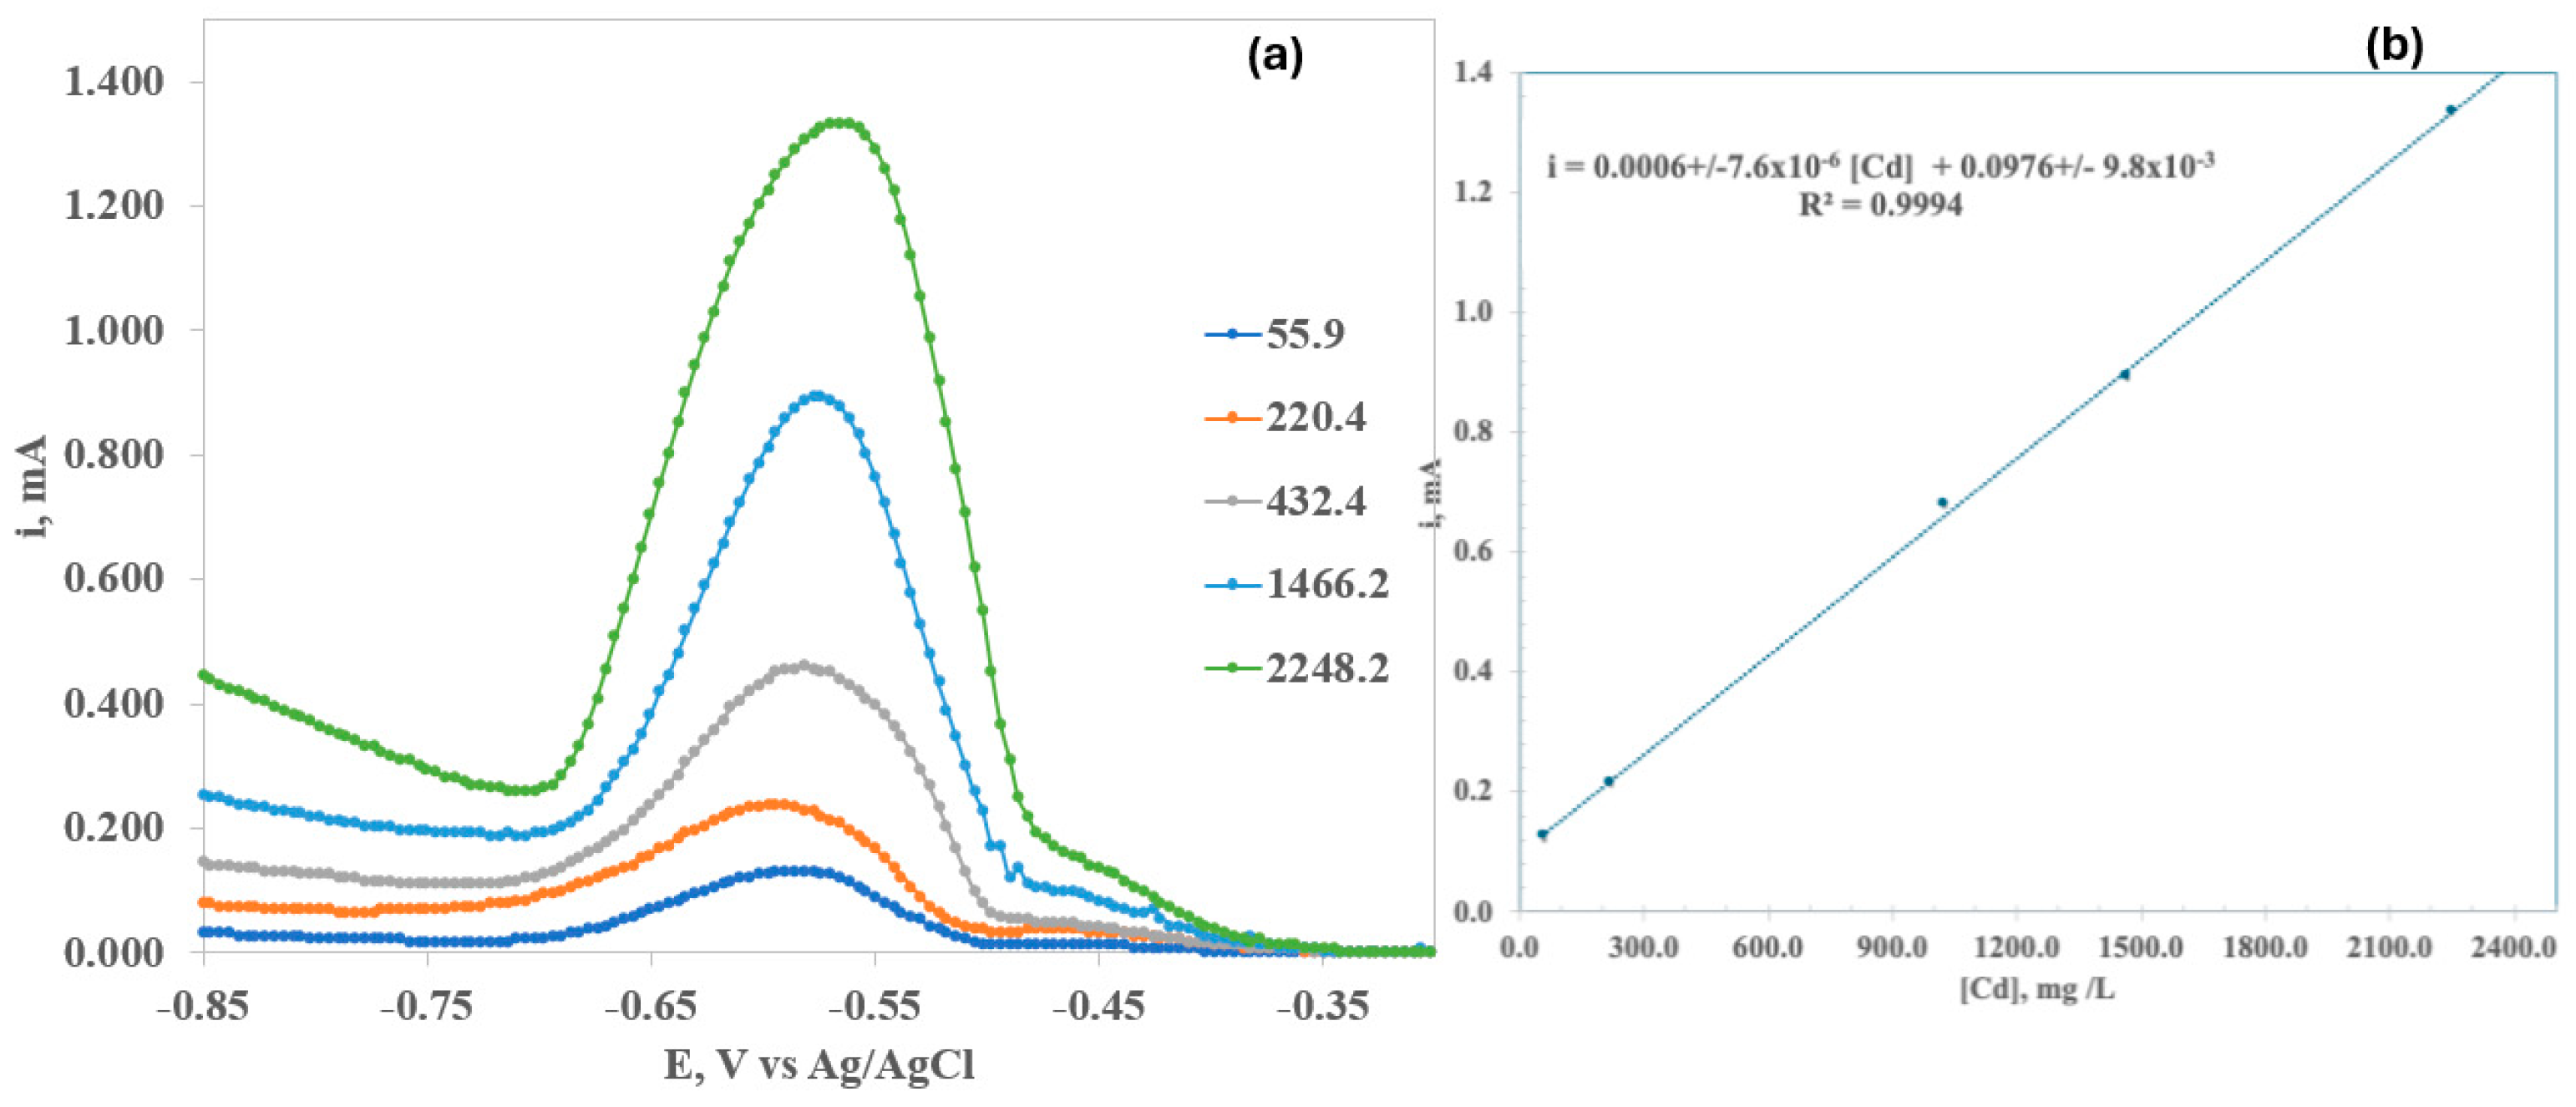
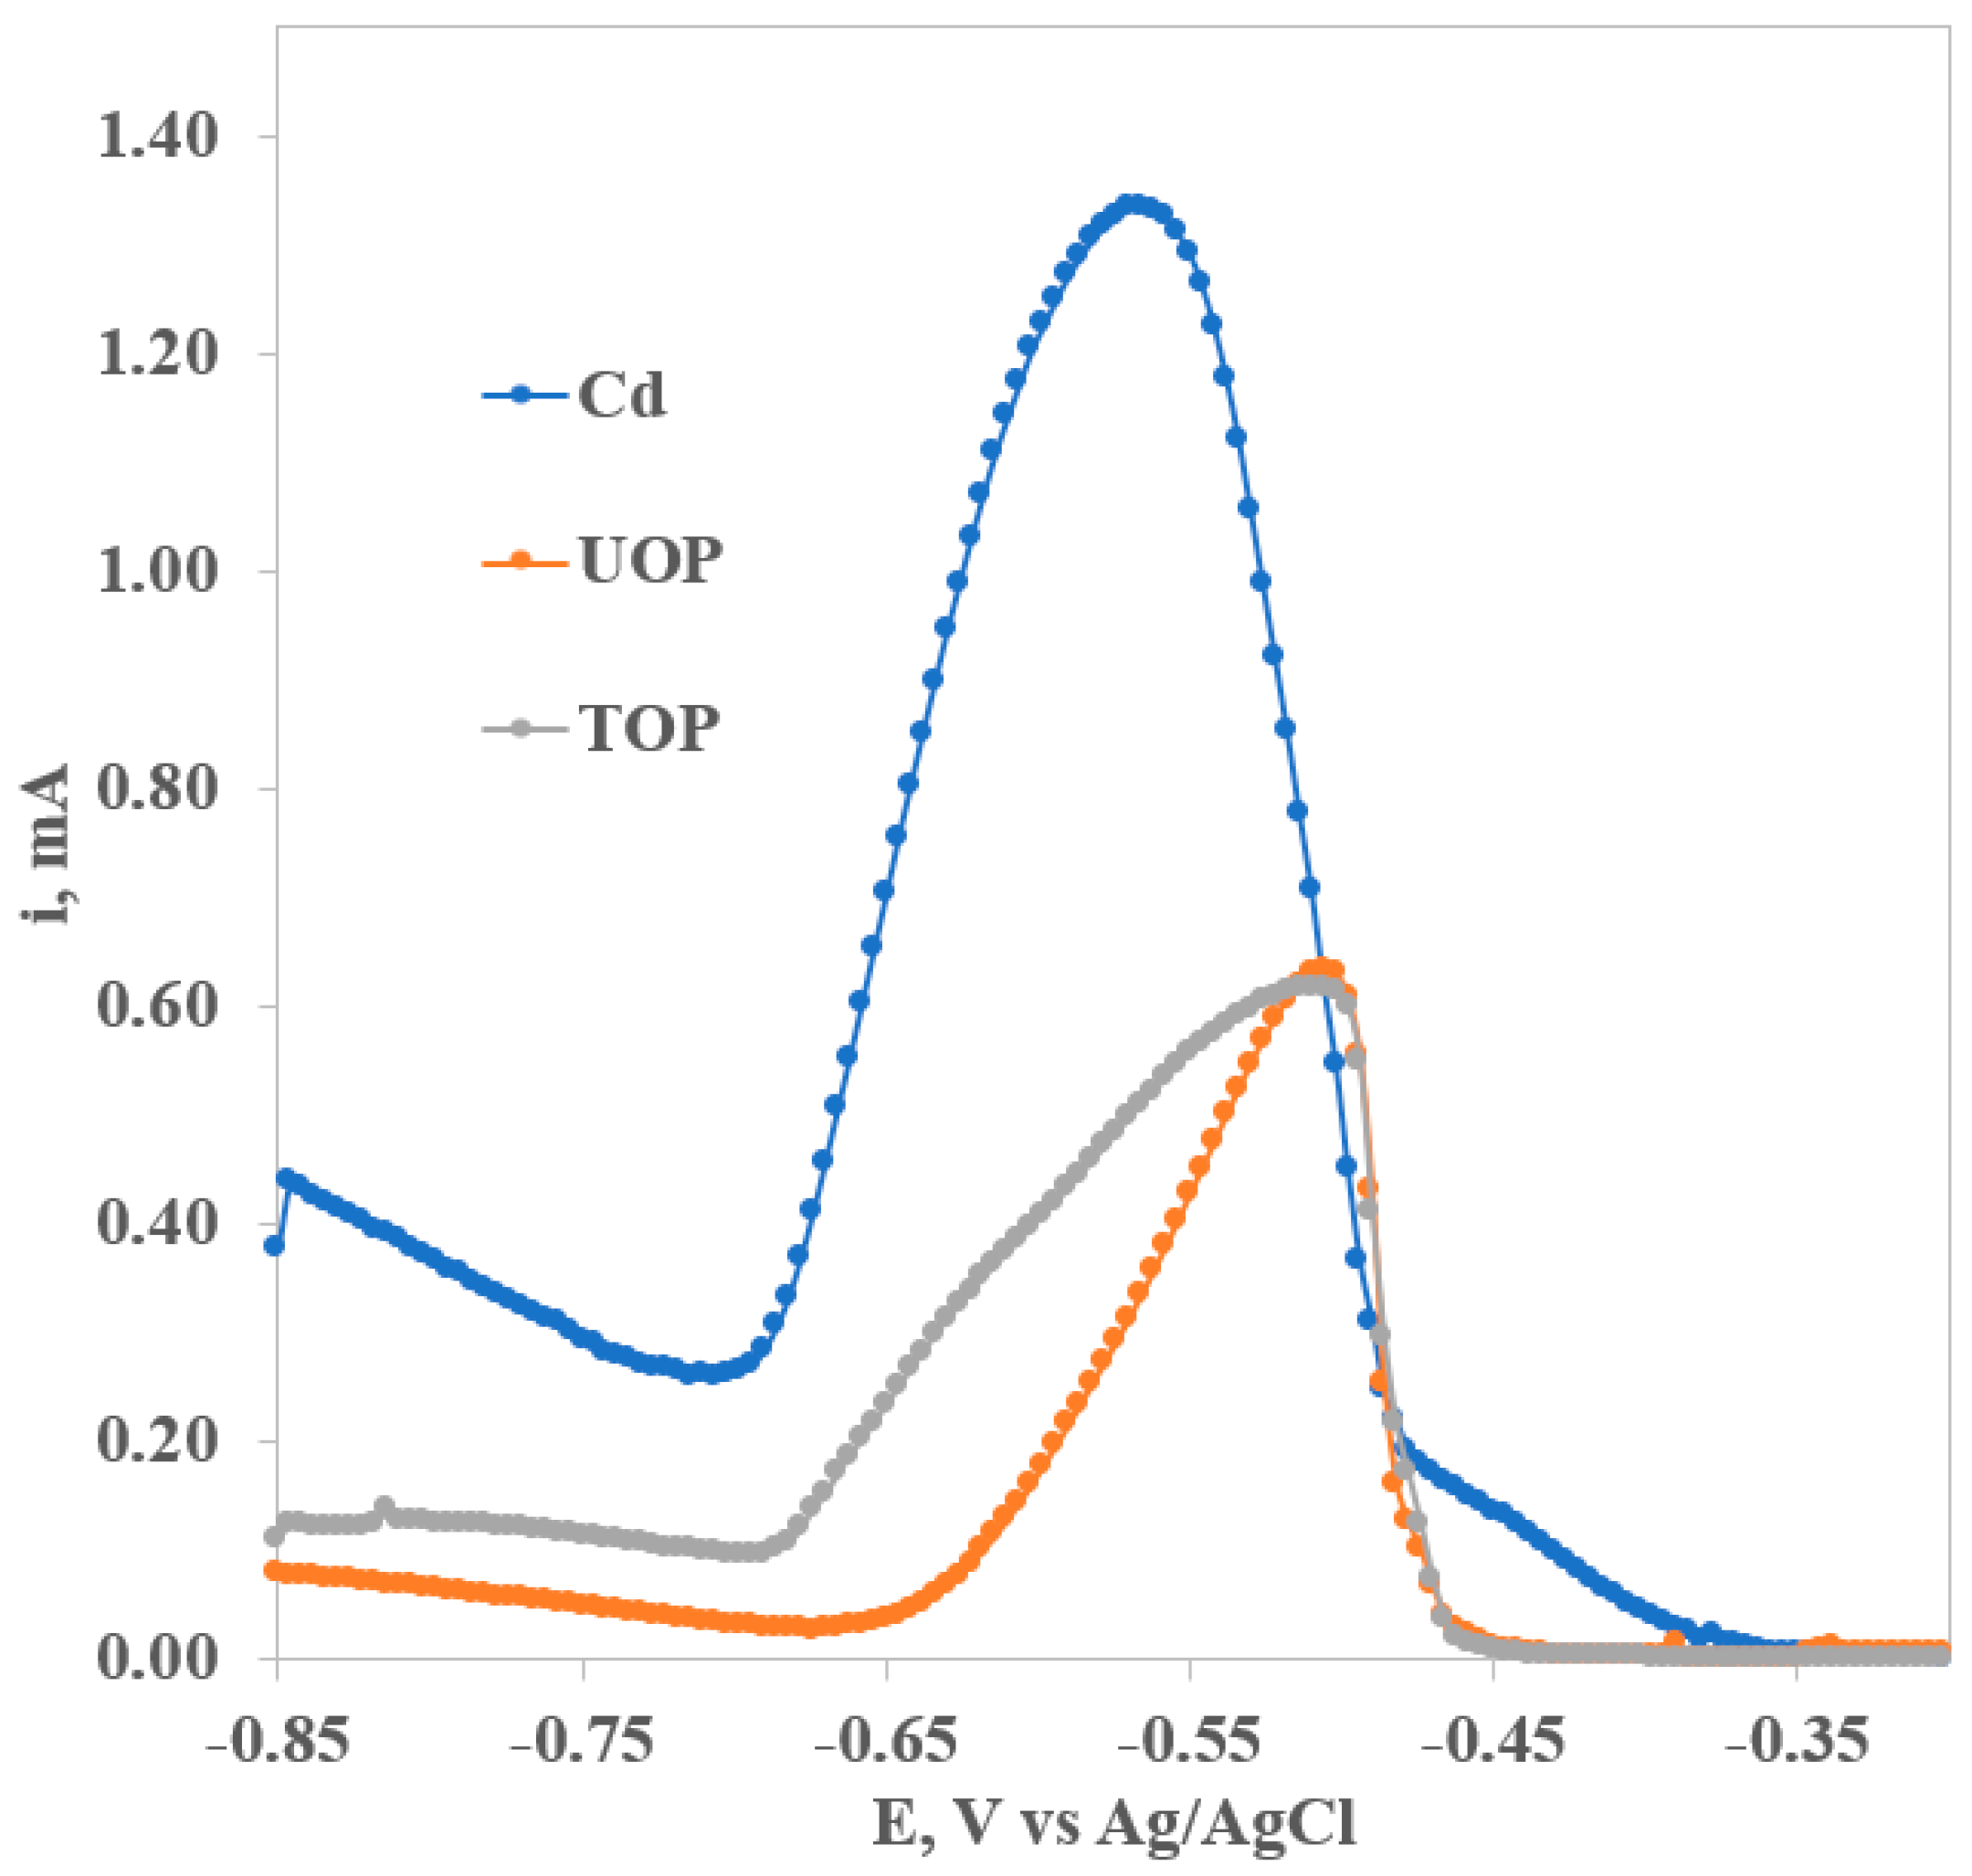
3.3. Square-Wave Anodic Stripping Voltammetry (SWV)

Figure 6 shows the standard addition graph using the electrochemical technique of square wave voltammetry (SWV), adding different volumes to 0.1 M cadmium nitrate solutions in HClO4 at concentrations ranging from 100 to 700 ppm. To linearize the results, the reduction potential of cadmium was identified at −0.57 V; current intensity (A) is plotted on the abscissa axis vs. concentration (mg/L) on the ordinate axis, obtaining the following value of r2 = 0.9994, indicating that has tendency lineal with equation of the straight line:
i = 0.0976 ± 9.8 × 1 0 3 + 0.0006 ± 7.6 × 1 0 6   [ C d ]
Subsequently, a test is performed to determine the amount of cadmium biosorbed by orange, peanut, and banana peels with and without chemical treatment, using a 0.1 M cadmium nitrate solution and maintaining the same calibration parameters; the data obtained are extrapolated to the calibration curve for the quantification of cadmium in each peel sample.
Figure 7 shows the voltammetric curves of cadmium after biosorption by UOP (black) and TOP (red). Transposing the results, we obtain a concentration of 0.042 and 0.068 mol/L, respectively; in addition, the cadmium adsorption capacity is 275.5 mg/g for UOP and 153.07 mg/g for TOP, concluding that there is higher cadmium adsorption by the orange peel sample without chemical treatment, with a difference of approximately 25.7% (57.8% UOP and 32.1% TOP) more adsorption efficiency (Table 3). The use of orange peel as a biosorbent for heavy metals has been reported; such is the case of lead, with a maximum adsorption capacity of 9.3 mg/g [10]; with respect to the results obtained, orange peel has a better biosorption capacity for cadmium than for lead, being approximately 30 times higher.
Figure 8 shows the voltammetric curves of cadmium after being in contact with UPS (black) and TPS (red); the concentrations determined were 0.040 and 0.069 mol/L, respectively. An adsorption capacity of 284.2 mg/g was obtained for UPS and 147.3 mg/g for TPS and a cadmium adsorption efficiency 28.7% higher in the UPS sample (59.6% UPS and 30.9% TPS) (Table 3). Peanut shell has been used in the biosorption of Cu(III), where an adsorption capacity of 3 mg/g was obtained, so that in comparison with the results obtained in this study, peanut shell is 95 times more efficient in adsorbing cadmium than copper [58].
Figure 9 presents the cadmium voltammetric curves for the UBP (black) and TBP (red) samples, determining a cadmium concentration of 0.056 mol/L for UBP and 0.051 mol/L for TBP. An adsorption capacity of 208.26 mg/g for UBP and 229.21 mg/g for TBP was calculated, obtaining a better cadmium biosorption of 4.4% more using TBP (43.7% UBP and 48.1% TBP) (Table 3). It was reported the use of banana peel to absorb Cr(IV) obtained an adsorption capacity of 27.9 mg/L [58]. In comparison with the results obtained in the present study, this peel is 7.5 times more efficient for the biosorption of cadmium vs. Cr(VI).
The shifts in the maximum anodic Cd peak potential of the solution after contact with the bioadsorbents may be associated, with the biomass having some soluble compounds or the acidic condition solubilizing it such that it is likely to form complexes that cause it to oxidize at more negative potentials compared to the Cd standards.
When comparing the six biosorbents analyzed, the biosorbent with the highest efficiency was untreated peanut shells (UPS), with a 59.5% cadmium adsorption efficiency.

3.4. Zeta Potential

Table 4 presents the results obtained in the zeta potential analysis; all biosorbents show a zeta potential with negative values, which indicates that the biomaterials are negatively charged and can be associated with deprotonation of functional groups such as carboxylic acids and even primary OH groups [11,14]; additionally, the amino groups always have a pair of electrons available. All the functional groups act as ligands, so it can be suggested that the most probable adsorption mechanism is via chemisorption by complex formation. UPS, UOP, and TBP biosorbents exhibited a higher negative zeta potential, which likely indicates that these samples had a higher number of functional groups that attracted Cd2+ ions; UPS, UOP, and TBP showed the highest Cd biosorption capacity. The functional groups -OH, -CO, -COO- (carboxyl groups), and -N-H contained in lignin, pectin, cellulose, and hemicellulose serve as active sites for the biosorbents.

4. Discussion

Adsorption is one of the most efficient and low-cost methods used in recent years to separate heavy metals from water systems, depending on the characteristics of the active sites of the absorbent. It will have a better or lesser adsorption capacity for different heavy metals. Using the FTIR technique, it was observed that the samples that had a higher amount of functional groups -OH, -CO, -COO, and -N-H had a higher adsorption capacity. This is due to the fact that these groups are responsible for the electrostatic attraction with the Cd2+ ions. The interaction between the functional groups and cadmium was verified by comparing the FTIR spectra of the biosorbent samples before and after biosorption; the peaks indicating the presence of the aforementioned functional groups decreased in intensity and underwent a change in wavelength after biosorption. On the other hand, this can be supported with the voltammograms since, after contact, the signal decreases significantly besides presenting a shift in the oxidation peak typical of Cd2+ when it is free. It is known that when forming complexes, the oxidation peak usually has shifts in the Epa, which in this study, it was observed that the Cd2+ oxidation process shifted to more positive potentials. The most relevant changes were with the peanut and orange biomaterials. In the case of banana peel, the displacement was negligible. Based on the evidence found, we propose that the mechanism of biosorption of banana, peanut, and orange peels is by complexes forming where cadmium binds to the functional groups -OH, -CO, -COO- (carboxyl groups), and -N-H contained in lignin, pectin, cellulose, and hemicellulose. The present work proposes the following mechanism of Cd biosorption by different biosorbents (Figure 10) [36,59].
SEM and EDS techniques were used to confirm the dispersion and concentration of cadmium absorbed by the biosorbents, obtaining a homogeneous dispersion in all chemical mappings since the chemical composition of the biosorbents does not change along their surface. It was also observed that the chemical treatment reduces the pore size of the biosorbents, which could reduce the size of the surface area and limit the amount of cadmium absorbed. Better adsorption capacities were obtained with the TBP 229.22 mg/g, UOP with 275.76 mg/g, and UPS with 284.20 mg/g, except for the banana peel system where a better result was obtained after chemical treatment (4.4% better). The samples that were not chemically treated showed a better cadmium adsorption capacity (peanut shell 28.7% better and orange peel 25.7%). The adsorption efficiency of cadmium by the biomasses could increase if the amount of biomass was increased, but since the aim was to know the adsorption capacity, experiments were not carried out at other conditions. All these variables will be analyzed in subsequent projects.

5. Conclusions

This research focused on absorbing cadmium, which is a heavy metal and can cause damage to health, through sustainable, low-cost, and easy-to-treat materials, using waste products such as orange, banana, and peanut peels. The main functional groups that perform biosorption are -OH, -CO, -COO- (carboxyl groups), and -N-H groups that are present in orange peel, banana peel, and peanut shell in compounds such as pectin, lignin, hemicellulose, and cellulose. All biosorbents show a zeta potential with negative values. Banana, peanut, and orange peels contain in their cell walls functional groups of negative nature that in aqueous solution are able to bind to (positive) metal ions and form complexes. SEM images show that the non-chemically treated biosorbents have a larger pore size, increasing their surface area and favoring cadmium biosorption. Adsorption capacities of 275.5 mg/g for UOPA, 284.2 mg/g for UPSA, and 229.21 mg/g for TBPA were observed. These adsorption capacity values are substantially higher than those that have been reported. The active sites of the different biomasses analyzed show different affinities to biosorb cadmium; chemical treatment alters these active sites and, therefore, the capacity to biosorb cadmium. The adsorption capacity was decreased when chemical treatment was performed on the different biosorbents. On the other hand, it was demonstrated that for cadmium adsorption, it is not necessary to carry out a previous treatment in the biosorbents since greater adsorption capacities were obtained with untreated biosorbents; in the case of banana, better adsorption was obtained with the treated peel but in a very small percentage (4.4%); since there is no previous treatment, costs and time can be reduced, and no toxic residues are generated for the environment. Taking advantage of these characteristics of the shells to extract cadmium in water effluents from industries or rivers could be a low-cost alternative with a great impact on the environment. Future research will evaluate the performance of biosorbents on different heavy metals and will seek to design a filter for the treatment of wastewater or water bodies.

Author Contributions

Conceptualization: S.A.G.-L., D.O.A.-D. and A.P.-F.; data curation: S.A.G.-L., D.O.A.-D. and G.R.-M.; formal analysis: S.A.G.-L., D.O.A.-D., G.R.-M., A.R.V.-N. and P.B.-H.; investigation: S.A.G.-L., D.O.A.-D., G.R.-M., A.R.V.-N. and P.B.-H.; methodology: S.A.G.-L., D.O.A.-D., G.R.-M. and A.P.-F.; validation: S.A.G.-L., D.O.A.-D. and G.R.-M.; writing original draft: S.A.G.-L., D.O.A.-D., G.R.-M. and A.R.V.-N.; writing review and editing: S.A.G.-L., D.O.A.-D., G.R.-M., A.P.-F. and P.B.-H. All authors have read and agreed to the published version of the manuscript.

Funding

LAF thanks to “Investigadoras e Investigadores por México” CONACyT Program.

Data Availability Statement

The data presented in this study are available on request from the corresponding author. The raw data required to reproduce these findings cannot be shared at this time as the data also forms part of an ongoing study.

Acknowledgments

The authors would like to thank Isaura Itzel Acosta Sánchez for their technical contributions.

Conflicts of Interest

The authors declare no conflict of interest.

References

  1. Rodríguez, M.; Vargas, D.; Cabañas, M.; Gamboa, X. Evaluación del proceso de biosorción con cáscaras de naranja para la eliminación del colorante comercial Lanasol Navy CE en aguas residuales de la industria textil. Ingeniería 2009, 13, 39–43. [Google Scholar]
  2. Vardhan, K.; Harsha, K.; Ponnusamy, S.; Panda, C. A review on heavy metal pollution, toxicity and remedial measures: Current trends and future perspectives. J. Mol. Liq. 2019, 290, 111197. [Google Scholar]
  3. Edelstein, M.; Ben-Hur, M. Heavy metals and metalloids: Sources, risks and strategies to reduce their accumulation in horticultural crops. Sci. Hortic. 2018, 234, 431–444. [Google Scholar]
  4. Qasem, N.A.A.; Mohammed, R.H.; Lawal, D.U. Removal of heavy metal ions from wastewater: A comprehensive and critical review. NPJ Clean Water. 2021, 4, 52. [Google Scholar]
  5. Fernández-Alba, A.R.; García, P.L.; García, R.R.; Valiño, M.D.; Fernández, S.V.; García, J.M.S. Tratamientos Avanzados de Aguas Residuales Industriales. 2006. Available online: www.madrimasd.org (accessed on 5 March 2024).
  6. Miretzky, P.; Cirelli, A.F. Cr(VI) and Cr(III) removal from aqueous solution by raw and modified lignocellulosic materials: A review. J. Hazard. Mater. 2010, 180, 1–19. [Google Scholar]
  7. Zamora-Ledezma, C.; Negrete-Bolagay, D.; Figueroa, F.; Zamora-Ledezma, E.; Ni, M.; Alexis, F.; Guerrero, V.H. Heavy metal water pollution: A fresh look about hazards, novel and conventional remediation methods. Environ. Technol. Innov. 2021, 22, 101504. [Google Scholar]
  8. Genchi, G.; Sinicropi, M.S.; Lauria, G.; Carocci, A.; Catalano, A. The Effects of Cadmium Toxicity. Int. J. Environ. Res. Public Health 2020, 17, 3782. [Google Scholar] [CrossRef]
  9. Haider, F.; Cai, L.; Coulter, A.; Cheema, A.; Wu, J.; Zhang, R.; Ma, W.; Farooq, M. Cadmium toxicity in plants: Impacts and remediation strategies. Ecotoxicol. Environ. Saf. 2021, 211, 111887. [Google Scholar]
  10. Fernández, M.; Gómez, S.; Tlamani, J.; Juárez, J. Concentraciones de metales pesados totales en aguas residuales vertidas a ecosistemas acuáticos por dos parques industriales en Puebla, México. Rev. Iberoam. Prod. Académica Y Gestión Educ. 2014, 1, 20–45. [Google Scholar]
  11. Cardona, A.; Cabañas, D.; Zepeda, A. Evaluación del poder biosorbente de cáscara de naranja para la eliminación de metales pesados, Pb (II) y Zn (II). Ing. Rev. Académica 2013, 17, 1–9. [Google Scholar]
  12. Suazo, E.; Morales, L.; Cristiani, M.; Cristiani, E. Efecto del pH sobre la biosorción de níquel (II) por Saccharomyces cerevisiae var. ellipsoideus. Rev. CENIC Cienc. Químicas 2010, 41, 1–12. [Google Scholar]
  13. Esposito, A.; Pagnanelli, F.; Lodi, A.; Solisio, C.; Vegliò, F. Biosorption of heavy metals by Sphaerotilus natans: An equilibrium study at different pH and biomass concentrations. Hydrometallurgy 2001, 60, 129–141. [Google Scholar]
  14. Payán, S. Estudio y Diseño de Biofiltro a Partir de Materia orgánica para el Tratamiento de Agua [Internet]. Centro de Investigación en Materiales Avanzados. 2016. Available online: https://cimav.repositorioinstitucional.mx/jspui/bitstream/1004/583/1/Tesis%20Sergio%20Arturo%20Pay%C3%A1n%20G%C3%B3mez.pdf (accessed on 5 March 2024).
  15. Chaidir, Z.; Zein, R.; Hasanah, Q.; Nurdin, H.; Aziz, H. Adsorption of Cr(III) and Cr(VI) metals in aqueous solution using Mangosteen Rind (Pithecellobium jiringa(jack) prain.). J. Chem. Pharm. Res. 2015, 7, 948–956. [Google Scholar]
  16. Jacques, A.; Lima, C.; Dias, P.; Mazzocato, C.; Pavan, A. Yellow passion-fruit shell as biosorbent to remove Cr(III) and Pb(II) from aqueous solution. Sep. Purif. Technol. 2007, 57, 193–198. [Google Scholar]
  17. Ibáñez, J.; Umetsu, Y. Uptake of trivalent chromium from aqueous solutions using protonated dry alginate beads. Hydrometallurgy 2004, 72, 327–334. [Google Scholar]
  18. Yang, L.; Chen, J.P. Biosorption of hexavalent chromium onto raw and chemically modified Sargassum sp. Bioresour. Technol. 2008, 99, 297–307. [Google Scholar]
  19. Fahim, N.F.; Barsoum, B.N.; Eid, A.E.; Khalil, M.S. Removal of chromium(III) from tannery wastewater using activated carbon from sugar industrial waste. J. Hazard. Mater. 2006, 136, 303–309. [Google Scholar]
  20. Sattar, M.S.; Shakoor, M.B.; Ali, S.; Rizwan, M.; Niazi, N.K.; Jilani, A. Comparative efficiency of peanut shell and peanut shell biochar for removal of arsenic from water. Environ. Sci. Pollut. Res. 2019, 26, 18624–18635. [Google Scholar]
  21. Hebbani, A.V.; Anantha, R.; Kasaba Manjunath, G.; Kulkarni, A.; Sam, R.; Mishra, A. Evaluation of cadmium biosorption property of de-oiled palm kernel cake. Int. J. Phytoremediat. 2021, 23, 522–529. [Google Scholar]
  22. Macías, J.M.F.; Agudelo, V.R.N.; Isiordia, G.E.D.; Ortiz Medina, O.L. Evaluation of bean pod red cargamanto (BPRC) as biosorbent material in the removal of cadmium (C2+) in aqueous solutions. Int. J. Hydrol. 2018, 2, 587–592. [Google Scholar]
  23. Zheng, W.; Li, X.M.; Wang, F.; Yang, Q.; Deng, P.; Zeng, G.M. Adsorption removal of cadmium and copper from aqueous solution by areca—A food waste. J. Hazard. Mater. 2008, 157, 490–495. [Google Scholar]
  24. Payán, S.; Flores, N.; Pérez, A.; Piñón, M.; Glossman, D. Computational molecular characterization of the flavonoid Morin and its Pt(II), Pd(II) and Zn(II) complexes. J. Mol. Model. 2011, 17, 979–985. [Google Scholar] [CrossRef]
  25. Abid, M.; Niazi, N.K.; Bibi, I.; Farooqi, A.; Ok, Y.S.; Kunhikrishnan, A.; Ali, F.; Ali, S.; Igalavithana, A.D.; Arshad, M. Arsenic(V) biosorption by charred orange peel in aqueous environments. Int. J. Phytoremediat. 2016, 18, 442–449. [Google Scholar] [CrossRef]
  26. Andres, P.; Manchola, I. Estudio Isotérmico de Biosorción de Cadmio, Cromo, Plomo y zinc en Solución Acuosa Empleando el Pinzote (Ranqui) de Plátano (Musa paradisiaca L.). 2012. Available online: https://dspace.ups.edu.ec/bitstream/123456789/4065/1/UPS-QT02922.pdf (accessed on 6 March 2024).
  27. Lavado, C.; Oré, F. Estudio de la biosorción de plomo divalente de soluciones acuosas usando biomasa modificada de marlo de maíz (Zea mays). Rev. Soc. Química Perú 2016, 82, 403–414. [Google Scholar] [CrossRef]
  28. Romano, S.; Corne, V.; Azario, R.; García, C. Aprovechamiento de residuos lignocelulósicos regionales para la remoción de cadmio en solución. Av. En Cienc. E Ing. 2020, 11, 11–22. [Google Scholar]
  29. Paccha, C.; Paccha, P. Capacidad de adsorción de desechos agroindustriales para remover contaminantes de aguas residuales. Rev. Inst. Investig. Fac. Minas Metal. Y Cienc. Geográficas 2023, 26, e25258. [Google Scholar]
  30. Mollinedo, L. Propuesta de un Sistema Natural Utilizando la Cáscara de Banano para la Remoción de Plomo II [Internet] [Tesis]. [Guatemala]: Universidad del Valle de Guatemala. 2021. Available online: https://repositorio.uvg.edu.gt/handle/123456789/3981 (accessed on 5 March 2024).
  31. Meza, M.; César, J.; Behling, E.; Colina, G.; Rincón, N.; Arturo, C. Bioabsorción de Pb (II) y Cr (III) usando la planta acuática Pistia Stratioides. Rev. Fac. Ing. Univ. Cent. Venez. 2013, 28, 19–28. [Google Scholar]
  32. Afolabi, O.; Musonge, P.; Bakare, F. Bio-sorption of a bi-solute system of copper and lead ions onto banana peels: Characterization and optimization. J. Environ. Health Sci. Eng. 2021, 19, 613–624. [Google Scholar] [CrossRef]
  33. Bobet, O.; Nassio, S.; Seynou, M.; Remy, B.; Zerbo, L.; Sanou, I.; Sawadogo, M.; Millogo, Y.; Gilles, E. Characterization of Peanut Shells for Their Valorization in Earth Brick. J. Miner. Mater. Charact. Eng. 2020, 8, 301–315. [Google Scholar] [CrossRef]
  34. Taşar, Ş.; Kaya, F.; Özer, A. Biosorption of lead(II) ions from aqueous solution by peanut shells: Equilibrium, thermodynamic and kinetic studies. J. Environ. Chem. Eng. 2014, 2, 1018–1026. [Google Scholar] [CrossRef]
  35. Fiol, N.; Villaescusa, I.; Martínez, M.; Miralles, N.; Poch, J.; Serarols, J. Sorption of Pb(II), Ni(II), Cu(II) and Cd(II) from aqueous solution by olive stone waste. Sep. Purif. Technol. 2006, 50, 132–140. [Google Scholar] [CrossRef]
  36. Wattanakornsiri, A.; Rattanawan, P.; Sanmueng, T.; Satchawan, S.; Jamnongkan, T.; Phuengphai, P. Local fruit peel biosorbents for lead (II) and cadmium (II) ion removal from waste aqueous solution: A kinetic and equilibrium study. S. Afr. J. Chem. Eng. 2022, 42, 306–317. [Google Scholar] [CrossRef]
  37. Annadurai, G.; Juang, R.S.; Lee, D.J. Adsorption of heavy metals from water using banana and orange peels. Water Sci. Technol. 2003, 47, 185–190. [Google Scholar] [CrossRef]
  38. Shenwari, K.A.; Dhevagi, P.; Chitdeshwari, T.; Avudainayagam, S.J. Biosorption of Cadmium from Aqueous Solutions by Banana Peel Powder. Madras Agric. J. 2018, 105, 24–29. [Google Scholar] [CrossRef]
  39. Shenwari, K.A.; Priyatharshini, S.; Dhevagi, P.; Chitdeshwari, T.; Avudainayagam, S. Removal of Lead and Cadmium from Aqueous Solutions by Banana Peel Biochar. Madras Agric. J. 2019, 106, 45–53. [Google Scholar] [CrossRef]
  40. Ángel, J.; Li, Q.; Thompson, P. Biorefinery of waste orange peel. Crit. Rev. Biotechnol. 2010, 30, 63–69. [Google Scholar]
  41. Zarazúa, G.; Ávila, P.; Tejeda, S.; Valdivia, M.; Zepeda, C.; Macedo, G. Evaluación de los metales pesados Cr, Mn, Fe, Cu, Zn y pb en sombrerillo de agua (Hydrocotyle Ranunculoides) del curso alto del río Lerma, México. Rev. Int. Contam. Ambient. 2013, 29, 17–24. [Google Scholar]
  42. Valencia, J. Implementación de un Método Para la Obtención de Carbón Activado a Partir de Cascara de Cacahuate (Arachis Hypogaea l) [Internet]. [Tuxtla Gutierrez Chiapas]: Instituto Tecnológico de Tuxtla Gutiérrez. 2019. Available online: http://repositoriodigital.tuxtla.tecnm.mx/xmlui/bitstream/handle/123456789/1578/1953.pdf?sequence=1&isAllowed=y (accessed on 6 March 2024).
  43. Soto, E.; Dávila, N.; Cervantes, C. Producción de carbón activado a partir de la cáscara de frijol de soya para su aplicación como adsorbente en el tratamiento de aguas residuales contaminadas con metales pesados. Quimica Hoy 2022, 10, 23–29. [Google Scholar] [CrossRef]
  44. Tejada, C.N. Biosorción de Cromo (VI) en aguas usando material lignocelulósico modificado. Rev. Educ. En Ing. 2014, 9, 86–97. [Google Scholar]
  45. Sanga, W. Remoción de Metales Pesados Utilizando la Pectina Como Material Biodegradable [Internet]. Universidad Nacional del Altiplano. 2016. Available online: https://repositorioslatinoamericanos.uchile.cl/handle/2250/3273957 (accessed on 5 March 2024).
  46. Sánchez, G. Ecotoxicología del Cadmio. Riesgo para la Salud de la utlización de los Suelos Ricos en Cadmio. [Internet]. Universidad Complutense de Madrid. 2016. Available online: http://147.96.70.122/web/tfg/tfg/memoria/gara%20sanchez%20barron.pdf (accessed on 5 March 2024).
  47. Sociedad Argentina de Ciencia y Tecnología Ambiental. Enfoques Interdisciplinarios para la Sustentabilidad del Ambiente [Internet]. 2015. Available online: https://www.researchgate.net/publication/287205151_Enfoques_Interdisciplinares_para_la_Sustentabilidad_Ambiental (accessed on 5 March 2024).
  48. Quiñones, É.; Tejada, C.; Ruiz, V. Remediación de aguas contaminadas con cromo utilizando diferentes biomateriales residuales. Rev. Cienc. E Ing. Al Día 2014, 9, 2357–5409. [Google Scholar]
  49. Muñoz, J. Biosorción de Plomo (II) por Cáscara de Naranja ‘citrus Cinensis’ Pretratada. [Internet] [Tesis]. [Lima Perú]: Universidad Nacional Mayor de San Marcos. 2007. Available online: https://core.ac.uk/download/pdf/323353409.pdf (accessed on 5 March 2024).
  50. de Castro, F.H.B.; García, G.B.; de Hoces, M.C.; Martín-Lara, M.Á. Influencia de algunas variables en la biosorción de plomo con residuos agrícolas. Afinidad J. Chem. Eng. Theor. Appl. Chem. 2008, 65. Available online: https://raco.cat/index.php/afinidad/article/view/282175 (accessed on 5 March 2024).
  51. Guerrero, J.; Trejo, M.; Moreno, J.; Pascual, S.; Lira, A. Extracción de fibra de los desechos agroindustriales de cacahuate, para su aplicación en el desarrollo de alimentos. Fac. Cienc. Biol. UANL 2016, 1, 806–812. [Google Scholar]
  52. Fernandez, M.; Florez, D.; Yactayo, M.; Lovera, D.; Quispe, J.; Landauro, C.; Pardave, W. Remoción de metales pesados desde efluentes mineros, mediante cáscaras de frutas. Aibi Rev. Investig. Adm. E Ing. 2020, 8, 21–28. [Google Scholar] [CrossRef]
  53. Castro, B. Uso de la Cáscara de Banano (Musa Paradisiaca) Maduro Deshidratada (seca) Como Proceso de Bioadsorción Para la Retención de Metales Pesados, Plomo y Cromo en Aguas Contaminada. [Internet] [Maestria]. [Guayas Ecuador]: Universidad de Guayaquil. 2015. Available online: https://www.semanticscholar.org/paper/Uso-de-la-c%C3%A1scara-de-banano-(musa-paradisiaca)-como-Pastor/78277d4239b94d90f8d448a1c7359f2d78f1b0ad (accessed on 5 March 2024).
  54. Bibi, A.; Naz, S.; Uroos, M. Evaluating the Effect of Ionic Liquid on Biosorption Potential of Peanut Waste: Experimental and Theoretical Studies. ACS Omega 2021, 6, 22259–22271. [Google Scholar] [PubMed]
  55. Pabón, S.E.; Benítez, R.; Sarria, R.A.; Gallo, J.A.; Pabón, S.E.; Benítez, R. Contaminación del agua por metales pesados, métodos de análisis y tecnologías de remoción. Una revisión. Entre Cienc. E Ing. 2020, 14, 9–18. [Google Scholar]
  56. Abid, H.; Amanat, A.; Ahmed, D.; Qamar, T. Adsorption efficacy of Carissa opaca roots residual biomass for the removal of copper from contaminated water. Chem. Int. 2023, 9, 1–7. [Google Scholar]
  57. Alaa El-Din, G.; Amer, A.A.; Malsh, G.; Hussein, M. Study on the use of banana peels for oil spill removal. Alex. Eng. J. 2018, 57, 2061–2068. [Google Scholar]
  58. Tapia, P.; Pavez, O.; Garrido, N.; Sepúlveda, B. Remoción de iones de cobre y niquel con cascara de maní. HOLOS 2018, 3, 57–69. [Google Scholar]
  59. Karnwal, A. Unveiling the promise of biosorption for heavy metal removal from water sources. Desalination Water Treat. 2024, 319, 100523. [Google Scholar]
Figure 1. Cyclic voltammogram of a [Cd2+] = 1 × 10⁻⁵ M solution with a carbon paste electrode using 1 M HClO4 as support electrolyte.
Environments 12 00097 g001
Figure 2. FTIR spectrum of (a) treated peanut shell (blue) and untreated peanut shell (red) and (b) untreated peanut shell (red) and untreated peanut shell with adsorption (blue).
Environments 12 00097 g002
Figure 3. FTIR spectrum of (a) treated banana peel (red) and untreated banana peel (blue) and (b) treated banana peel (red) and treated banana peel with adsorption (blue).
Environments 12 00097 g003
Figure 4. FTIR spectrum of (a) treated orange peel (red) and untreated orange peel (blue) and (b) untreated orange peel (blue) and untreated orange peel with adsorption (red).
Environments 12 00097 g004
Figure 5. SEM images: (a) TBPA, (b) UBPA, (e) TOPA, (f) UOPA, (i) TPSA, and (j) UPSA, 20 kV. EDS elemental mapping of SEM of (c) TBPA, (d) UBPA, (g) TOPA, (h) UOPA, (k) TPSA, and (l) UPSA.
Environments 12 00097 g005
Figure 6. (a) SWASV response of Cd2+ at different concentrations in a perchloric acid 1 M solution. (b) Calibration curve.
Environments 12 00097 g006
Figure 7. SWASV response of Cd2+ after biosorption of UOP (orange), TOP (gray), and reagent blank (blue).
Environments 12 00097 g007
Figure 8. SWASV response of Cd2+ after biosorption by UPS (orange), TPS (gray), and reagent blank (blue).
Environments 12 00097 g008
Figure 9. SWASV response of Cd2+ after biosorption by UBP (orange), TBP (gray), and reagent blank (blue).
Environments 12 00097 g009
Figure 10. Schematic mechanism of Cd sorption by biosorbents.
Environments 12 00097 g010
Table 2. Elemental weight% for EDS elemental analysis of biosorbents after adsorption.
CarbonOxygenCadmiumOthers
TBPA48.9235.6313.601.85
UBPA56.5337.515.420.54
TOPA54.3236.878.290.52
UOPA42.8340.0715.571.53
TPSA62.2134.132.710.94
UPSA52.4134.7112.040.83
Table 3. Cadmium adsorption capacities and cadmium adsorption efficiencies of UPSA, TPSA, UOPA, TOPA, UBPA, and TBPA.
BiosorbentAdsorption Capacity (qc) mg/gAdsorption Efficiency (%RE)
UPSA284.2059.60
TPSA147.3330.89
UOPA275.7657.83
TOPA153.0832.10
UBPA208.2643.67
TBPA229.2248.07
Table 4. Zeta potential of UPSA, TPSA, UOPA, TOPA, UBPA, and TBPA.
BiosorbentZeta Potential (mV)
UPS−28.13 ± 0.2
TPS−6.09 ± 0.5
UOP−22.40 ± 0.8
TOP−11.73 ± 0.1
UBP−28.83 ± 0.9
TBP−35.53 ± 1.0
Disclaimer/Publisher’s Note: The statements, opinions and data contained in all publications are solely those of the individual author(s) and contributor(s) and not of MDPI and/or the editor(s). MDPI and/or the editor(s) disclaim responsibility for any injury to people or property resulting from any ideas, methods, instructions or products referred to in the content.

