Article

Monitoring the Status of Mesophotic Biogenic Reefs in the Northern Adriatic Sea: Comparing a Biotic Index and Multivariate Community Patterns

1
Department of Life Sciences, University of Trieste, 34127 Trieste, Italy
2
Consorzio Nazionale Interuniversitario per le Scienze del Mare (CoNISMa), Piazzale Flaminio, 9, 00196 Roma, Italy
3
WWF AMP Miramare, Via Beirut 2/4, 34151 Trieste, Italy
4
Stazione Zoologica Anton Dohrn, Villa Comunale, 80121 Napoli, Italy
*
Author to whom correspondence should be addressed.
These authors contributed equally to this work.
Environments 2025, 12(4), 124; https://doi.org/10.3390/environments12040124
Submission received: 28 February 2025 / Revised: 31 March 2025 / Accepted: 15 April 2025 / Published: 17 April 2025

Abstract

:
Coralligenous bioconstructions are priority habitats crucial for the protection of Mediterranean marine biodiversity. Among these bioconstructions, the mesophotic biogenic reefs of the northern Adriatic are of particular concern due to their ecological relevance and the high levels of human pressure in the region. Thus, effective monitoring strategies are vital for the conservation and management of these fragile environments. In this study, we investigated the multivariate spatial and temporal patterns of sessile macrobenthos on biogenic reefs within two areas of a Natura 2000 site in the northern Adriatic over a four-year period. We also classified the ecological status of reefs based on the NAMBER index, specifically tailored for these peculiar bioconstructions. Our findings revealed that temporal trajectories of assemblages significantly differed between the two investigated areas, mostly due to larger fluctuations in algal turf abundance in the area closest to the coast, which is putatively more exposed to human impacts. In this area, the index identified a “Moderate” status during the period of peaking turf abundance, while the reef status consistently remained “Good” in other periods and in the area located further from the coast. This highlights the index sensitivity in reflecting actual changes in assemblages potentially associated with reef degradation.

Graphical Abstract

1. Introduction

Coralligenous reefs are one of the hotspots of biodiversity in the Mediterranean Sea, thus deserving particular attention in conservation policies and marine resource management [1,2,3]. These biogenic structures, primarily composed of calcareous macroalgae, soft corals, sponges, and other benthic species, form complex three-dimensional ecosystems [1,3,4,5] that provide shelter, feeding grounds, and breeding areas for numerous marine species, including fish, crustaceans, mollusks, and many other organisms [3,6,7,8]. In parallel, coralligenous reefs actively assist in mitigating climate change by contributing to carbon sequestration [9,10,11], and they constitute an important resource for coastal communities, supporting economic and social activities such as fisheries, scuba diving, tourism, and scientific research [6,8,11,12,13]. To date, anthropogenic pressures have negatively impacted the distribution of bioconstructions, resulting in habitat degradation and fragmentation in both shallow and deep waters [14,15,16,17]. For these reasons, the Barcelona Convention Action Plan of 2008 [2] highlighted the need for conservation and legal protection of coralligenous and other calcareous bioconstructions, as already established for Posidonia oceanica meadows.
Martin et al. [7] investigated coralligenous reefs throughout the Mediterranean, estimating their total extent at approximately 12,000 km2, resulting in the most important submarine biogenic ecosystem in terms of surface and species richness [5,9,18]. Italy, with a coastline spanning over 8000 km (1:25,000 scale) [19], is one of the Mediterranean countries where these bioconstructions reach the largest extension on the continental shelf [9,20,21]. At a regional scale, coralligenous outcrops may exhibit specific features, such as the mesophotic biogenic reefs of the Northern Adriatic Sea, which represent a unique habitat among ordinary coralligenous habitats. These bioconstructions, occurring between 2 and 20 km from the coast, at depths ranging from 15 to 40 m, are primarily formed by encrusting red algae, in particular those belonging to the orders Corallinales (Lithophyllum spp., Lithothamnion spp.), Hapalidiales (Mesophyllum spp.), and Peyssonneliales (Peyssonnelia spp.) [22,23,24]. In contrast to classic coralligenous outcrops of the western Mediterranean, biogenic reefs of the northern Adriatic lack many erect and fragile species, such as gorgonians and large bryozoans, and differ in the main algal bioconstructors and geological features [22,23,24,25,26].
Mesophotic biogenic reefs of the northern Adriatic are key elements for regional marine biodiversity, providing a secondary substrate for a wide range of sessile and vagile marine species [22] and hosting more than 170 taxa of macroalgae and 730 taxa of macroinvertebrates [22,25,27]. Also, these bioconstructions increase the heterogeneity of the seabed, which is dominated by sand and mud flats, representing exclusive areas for nursery, shelter, and feeding grounds for fish and large invertebrates, including species of commercial interest. Due to their ecological relevance, specific areas of the basin where mesophotic biogenic reefs concentrate were classified as Sites of Community Importance and included in the EU Natura 2000 network. However, designation as a Natura 2000 site alone does not guarantee a sufficient level of environmental protection. The lack of specific regulations and enforcement, compared to Marine Protected Areas, often limit their effectiveness in providing ecosystem-wide benefits [28,29]. Conservation strategies and monitoring programs are crucial to ensure the persistence of these fragile habitats in the region, one of the most impacted marine areas of the Mediterranean Sea [30,31,32,33], particularly exposed to human threats arising from intense maritime traffic, high fishing pressure, and coastal industry [34,35,36,37,38,39,40]. Several biodiversity assessments have been carried out in these biogenic reefs [41,42], and a specific biotic index, the NAMBER (North Adriatic Mesophotic Biogenic Reefs) index [26], has been developed to evaluate their ecological status in this region. This index integrates data about bioconstruction complexity, species diversity, and the vulnerability of species to external pressures. However, temporal variations of biogenic reef assemblages have rarely been quantified (e.g., [42]), and an evaluation of the effectiveness of the NAMBER index in monitoring reef communities is still lacking.
Here, we analyzed the structure of sessile macrobenthic assemblages and the ecological status of bioconstructions using the NAMBER index in two areas within a Site of Community Importance in the Northern Adriatic (Gulf of Trieste) over 4 years of study to (i) quantify spatial and temporal patterns of variation in assemblage structure and (ii) assess the response of NAMBER in reflecting potential changes in the ecological status of biogenic reefs, in order to inform future monitoring programs for effective management and conservation of these critical habitats.

2. Materials and Methods

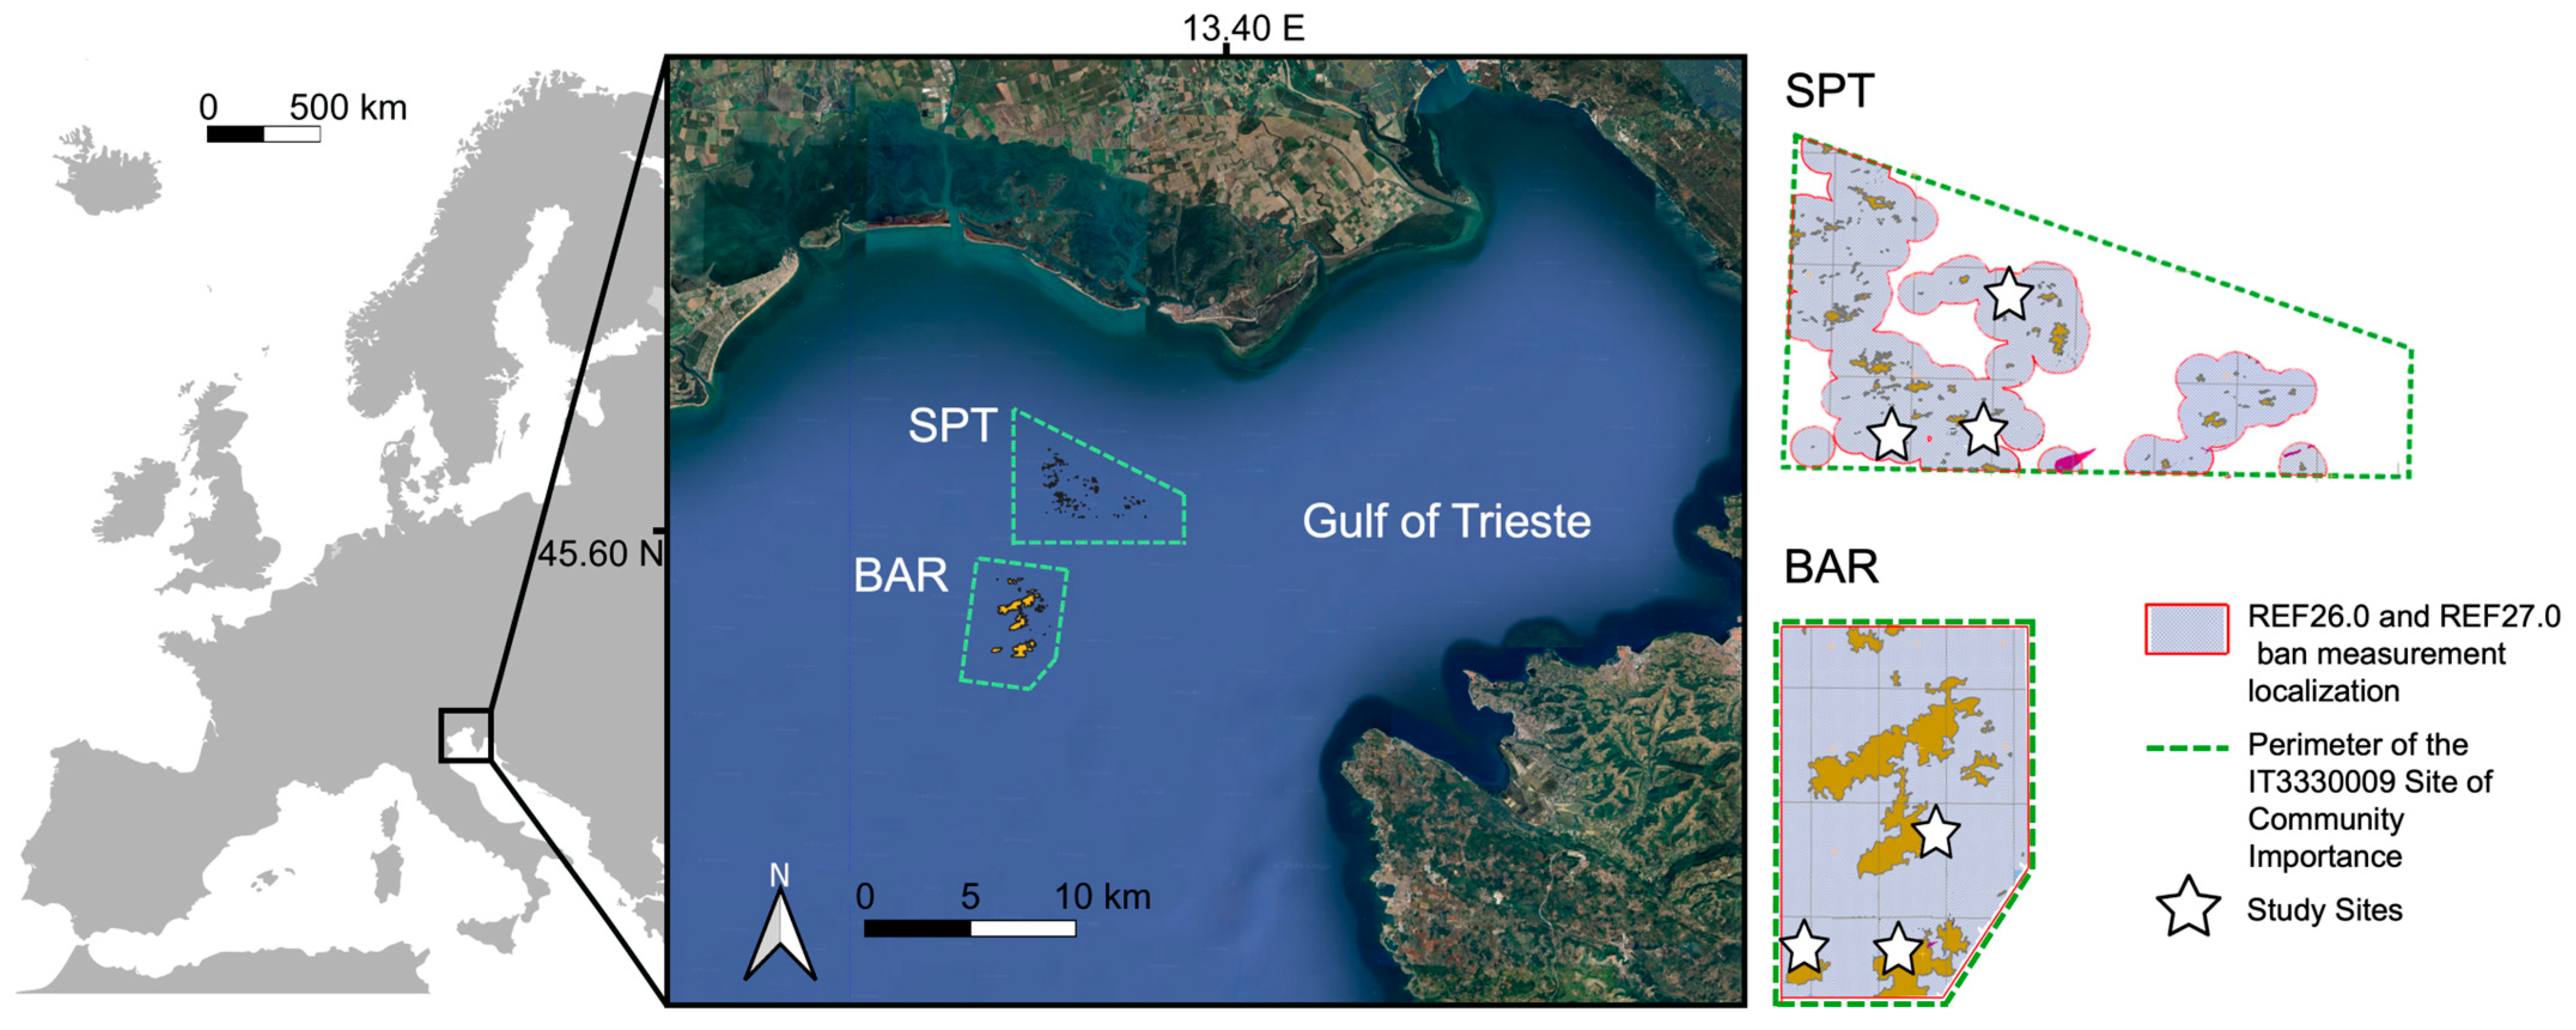
2.1. Study Area and Sampling Design

The study area is located in the Gulf of Trieste, northern Adriatic Sea (NE Italy, 45°42′05.4″ N, 13°42′50.4″ E; Figure 1). The gulf is a shallow semi-enclosed basin, with an average depth of about 16 m and not exceeding 40 m [43]. This region is characterized by strong river inflows, significant temperature and salinity seasonal variations, and high anthropic activity, including maritime transport, coastal industries, fishing, and tourism [30]. The investigated biogenic reefs were protected with the establishment in 2014 of the “Trezze San Pietro e Bardelli” Site of Community Importance (SCI; IT3330009). Fishing activities are prohibited in the two SCIs (ban measurement localization REF26.0 “Ban on professional fishing with trawl nets” and REF27.0 “Ban on professional fishing for mollusks” [44]). Sessile macrobenthic assemblages were studied in two areas within the SCI (Figure 1), referred to as SPT and BAR, over 4 years. SPT is located 9 km from the coast, at an average depth of 15 m, with an area of 24,000 m2, whereas BAR is located 19 km from the coast, at an average depth of 20 m, with an area of 12,000 m2 [45]. The outcrops in both areas belong to the “Tabular” type, consisting of biogenic reefs of the same kind (1–2 m in height), with some main outcrops of larger size (up to 4 m in height).
In order to quantify patterns of spatial variability at different scales within areas, three sampling sites (1000 s m apart) were selected in each area as representative of the local outcrops (Figure 1). Within each site, three stations were randomly identified, located 10–30 m apart. At each station, 10 replicate photographic samples were collected using a 20 cm × 20 cm plastic frame, which was randomly placed on the bioconstructions (10 s cm apart). Digital pictures of samples were taken using a digital underwater camera Canon EOS 300DTM (Canon Inc., Tokyo, Japan) equipped with two strobes. This widely adopted, non-destructive method is ideal for monitoring protected or sensitive environments, species, or habitats, where destructive sampling techniques (substrate scraping, dredging, use of box-corers) are unsuitable [46,47].
Sampling was conducted at average depths of approximately 15 m and 19 m (for site SPT and site BAR, respectively) and was repeated on six random occasions from 2021 to 2024 to also take into account the temporal variability in assemblage structure: T1 (April 2021), T2 (August 2023), T3 (December 2023), T4 (February 2024), T5 (August 2024), and T6 (December 2024).
A total of 1080 photographic samples were analyzed superimposing a grid of 25 equally sized squares (5 × 5) to estimate the percent cover and abundance of sessile organisms (each square corresponds to 4% of the total surface area) [48]. According to Dethier et al. [48], values of 4%, 3%, 2%, and 1% were assigned to each taxon covering 4/4, 3/4, 1/2, and 1/4 of each grid square, respectively. When a taxon covered less than 1/4 of the grid, an arbitrary cover value of 0.5% was assigned. Finally, the partial values for each taxon were summed and expressed as a percentage cover. Vagile organisms were not considered in the analysis.

2.2. Statistical Analysis

We performed a permutation-based multivariate analysis of variance (PERMANOVA; [49]) on sessile macrobenthic assemblages to test for spatial and temporal variations in assemblage structure between the two areas. The design of the analysis included four factors: time ((Ti), six levels, random); area ((Ar), two levels, fixed); site (Si(Ar), three levels, random and nested in (Ar)); and station (St(Si(Ar)), three levels, random, nested in Si(Ar)), with n = 10 replicates. The analysis was based on Bray–Curtis similarity and untransformed data, with 9999 permutations. Since the analysis detected a significant Ti × Ar interaction (see Results), post hoc pair-wise comparisons between areas in each time of sampling were conducted using the PERMANOVA t-test and 5000 permutations. A non-metric multidimensional scaling (nMDS) ordination of Ti × Ar centroids with an overlay of temporal trajectories was performed to depict patterns of temporal variations in assemblages between the two areas. A permutational test of multivariate dispersion (PERMDISP, [50]) of Ti × Ar centroids was performed to test for potential differences in temporal heterogeneity of assemblages between the two areas.
To identify taxa that mostly contributed to temporal variations of multivariate assemblage structure in the two areas, we partitioned the total temporal variance for SPT and BAR following the approach proposed by Legendre and De Cáceres (2013) [51]. The total temporal variance in the data was a measure of the temporal beta-diversity of assemblages, which was then partitioned into the contributions of each species (or taxon) to the overall temporal variability at each area. Only species or taxa contributing more than 5% to the total temporal variance at least in one area were considered.
To assess spatial and temporal variations of the number of taxa and the total cover of plots (the sum of the individual % cover of all taxa within that plot), we performed an analysis of variance (ANOVA) based on the same experimental design used for the PERMANOVA. ANOVA was also performed to test for spatial and temporal variations in taxa identified as those mostly contributing to temporal variance. Before analysis, Cochran’s C-test was used to check for variance homogeneity, and data were transformed to stabilize variance if required. For variables with heterogeneous variance after transformation, analysis was performed on untransformed data and interpreted at a more conservative level of α = 0.01.
Analyses were performed using the Primer v7 software [52] with the PERMANOVA+ add-on package [53] and R software version 4.3.3 [54] using the packages “GAD” [55], “stats” [55], and “adespatial” [56].

2.3. Ecological Status

The ecological status of the bioconstructions was defined based on the NAMBER index, which is based on the analysis of photographic samples [26]. Sites were considered as this scale overlapped the spatial units (10 s m) used in the procedure for the calculation of the index [26]. This index integrates aspects related to the type of bioconstruction, the diversity of species, and the sensitivity of organisms to environmental degradation. These three components, quantified as the percentage cover of encrusting calcareous algae (CCA), alpha (α) diversity (i.e., the average number of taxa per sample), and sensitivity level of the assemblages (SL), are in accordance with the monitoring requirements described in the European Union Marine Strategy Framework Directive (MSFD, 2008/56/EC [57]). For each component, the Ecological Quality Ratio (EQR), i.e., the ratio between the observed value and a reference value, was calculated. The final value of the index was then obtained by calculating the arithmetic mean of the EQR of the three components. In this study, the reference values for the calculation of the EQR of each of the three components of the index were based on the evaluation of numerous outcrops throughout the northern Adriatic Sea and were not limited to the best conditions found in the survey areas. Specifically, based on the results reported by Piazzi et al. [26], the reference values were SL = 7.85; α = 15.1; and CCA = 9. The NAMBER index varies between 0 and 1, and defines the ecological state of the ecosystem, distinguishing among five ecological status classes corresponding to different ranges of the index values, namely “Bad” (EQR < 0.2), “Poor” (0.2 ≤ EQR < 0.4), “Moderate” (0.4 ≤ EQR < 0.6), “Good” (0.6 ≤ EQR < 0.8), and “High” (0.8 ≤ EQR ≤ 1) [26].
The graphical representation of NAMBER results was performed using GraphPad Prism 8.0 software “https://www.graphpad.com (accessed on 25 February 2025)”.

3. Results

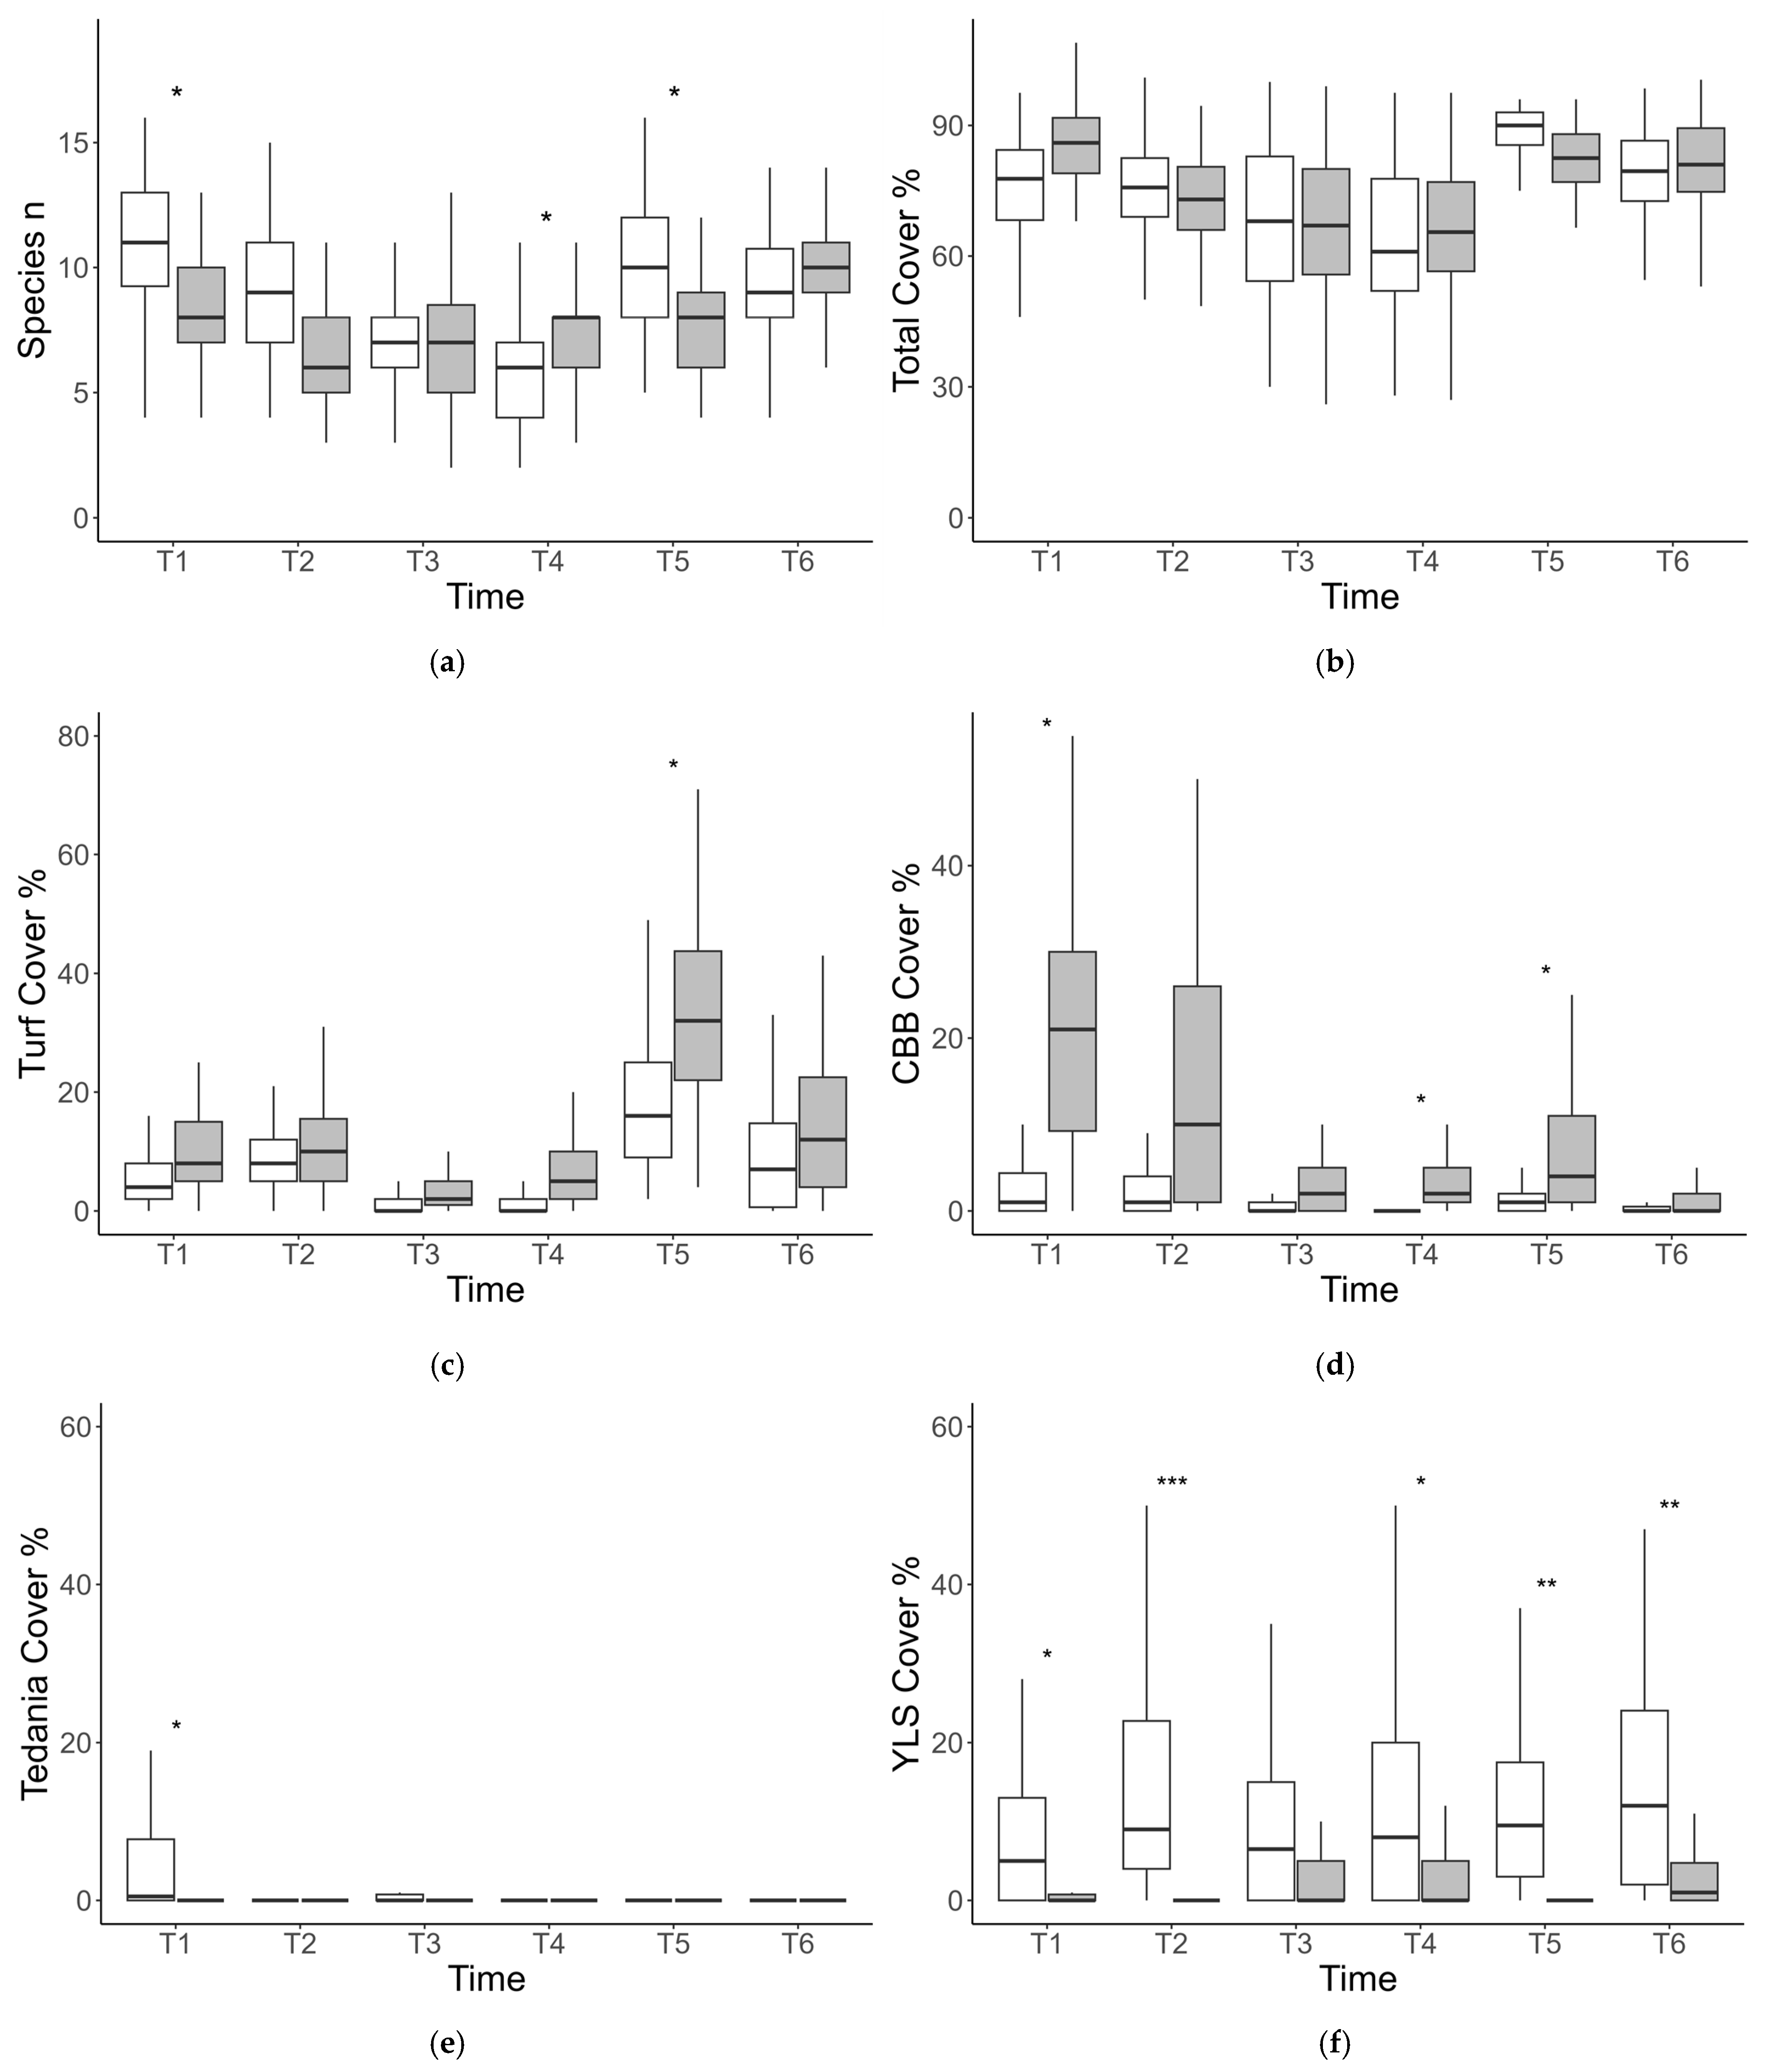
3.1. Structure of Sessile Assemblages

The analysis of the photographic record led to the identification of 88 taxa. However, given the complexities in identifying certain species from photographic samples, some taxa were grouped into morpho-functional groups, resulting in a total of 77 operational identification units. Of these, 62 (80.5%) were identified at the species or genus level, while 15 (19.5%) were classified at higher taxonomic levels or as morpho-functional groups (see Table S1 for a detailed list of taxa and grouping and Table S2 for average abundance of taxa in the two areas and times of sampling).
PERMANOVA detected a significant spatiotemporal variability of assemblages on biogenic reefs at the scale of stations and sites (Table 1). Besides this variability within areas, the analysis detected a significant Ti × Ar interaction (Table 1). Post hoc comparisons detected significant differences (p < 0.001 in all cases) between SPT and BAR, indicating that the significant Ti × Ar interaction was not due to changing patterns of difference between the two areas, but rather to different patterns of temporal variation in the structure of sessile assemblages between SPT and BAR. This difference was clearly visible in the nMDS ordination of Ti × Ar centroids, showing quite different temporal trajectories of assemblages for the two areas (Figure 2). Specifically, the magnitude of temporal variations of assemblages was significantly larger at SPT than at BAR (Figure 2), as detected by the PERMIDISP analysis on the difference in multivariate dispersion of time centroids between the two areas (F1,10 = 13.687, p = 0.005).
Total temporal variance partitioning identified four taxa or morphological groups that were responsible for most of the observed temporal variations (>5% contribution to total temporal variance in at least one of the two areas) and, namely, turf algae such as small filamentous species of Ceramiales (14.5% average contribution across areas), coarsely branched brown algae (CBB) such as Dictyota spp. (9.5% average contribution across areas), and the sponge Tedania spp. and yellow lobate sponges (YLS) such as Mycale spp. (both with 5.5% average contribution across areas).
ANOVA on the average number of taxa revealed significant spatiotemporal variability at the scale of sites and no significant variations at the scale of stations. ANOVA also detected a significant Ti × Ar interaction, indicating that the differences in the number of taxa between the two areas varied over time (Table 2, Figure 3a). Specifically, the number of taxa was significantly higher at BAR than at SPT in T1 and T5; comparable at T2, T3, and T6; and significantly lower at T4 (Figure 3a). ANOVA on total cover detected significant spatiotemporal variability at the scale of sites but not at the scale of stations (Table 2). The total cover of assemblages significantly varied in time and consistently between areas (Table 2, Figure 3b).
ANOVA on the cover of taxa that mostly contributed to temporal variations of assemblages detected in all cases significant spatiotemporal variability at the scale of stations, whereas no significant differences were detected among sites (Table 3). For all variables, ANOVA detected a significant Ti × Ar interaction (Table 3). The abundance of turf and CBB was generally higher at SPT than at BAR, especially in T1, T4, and T5 (Figure 3c,d), whereas the two groups of sponges (Tedania spp. and YLS) were generally more abundant at BAR (Figure 3e,f).

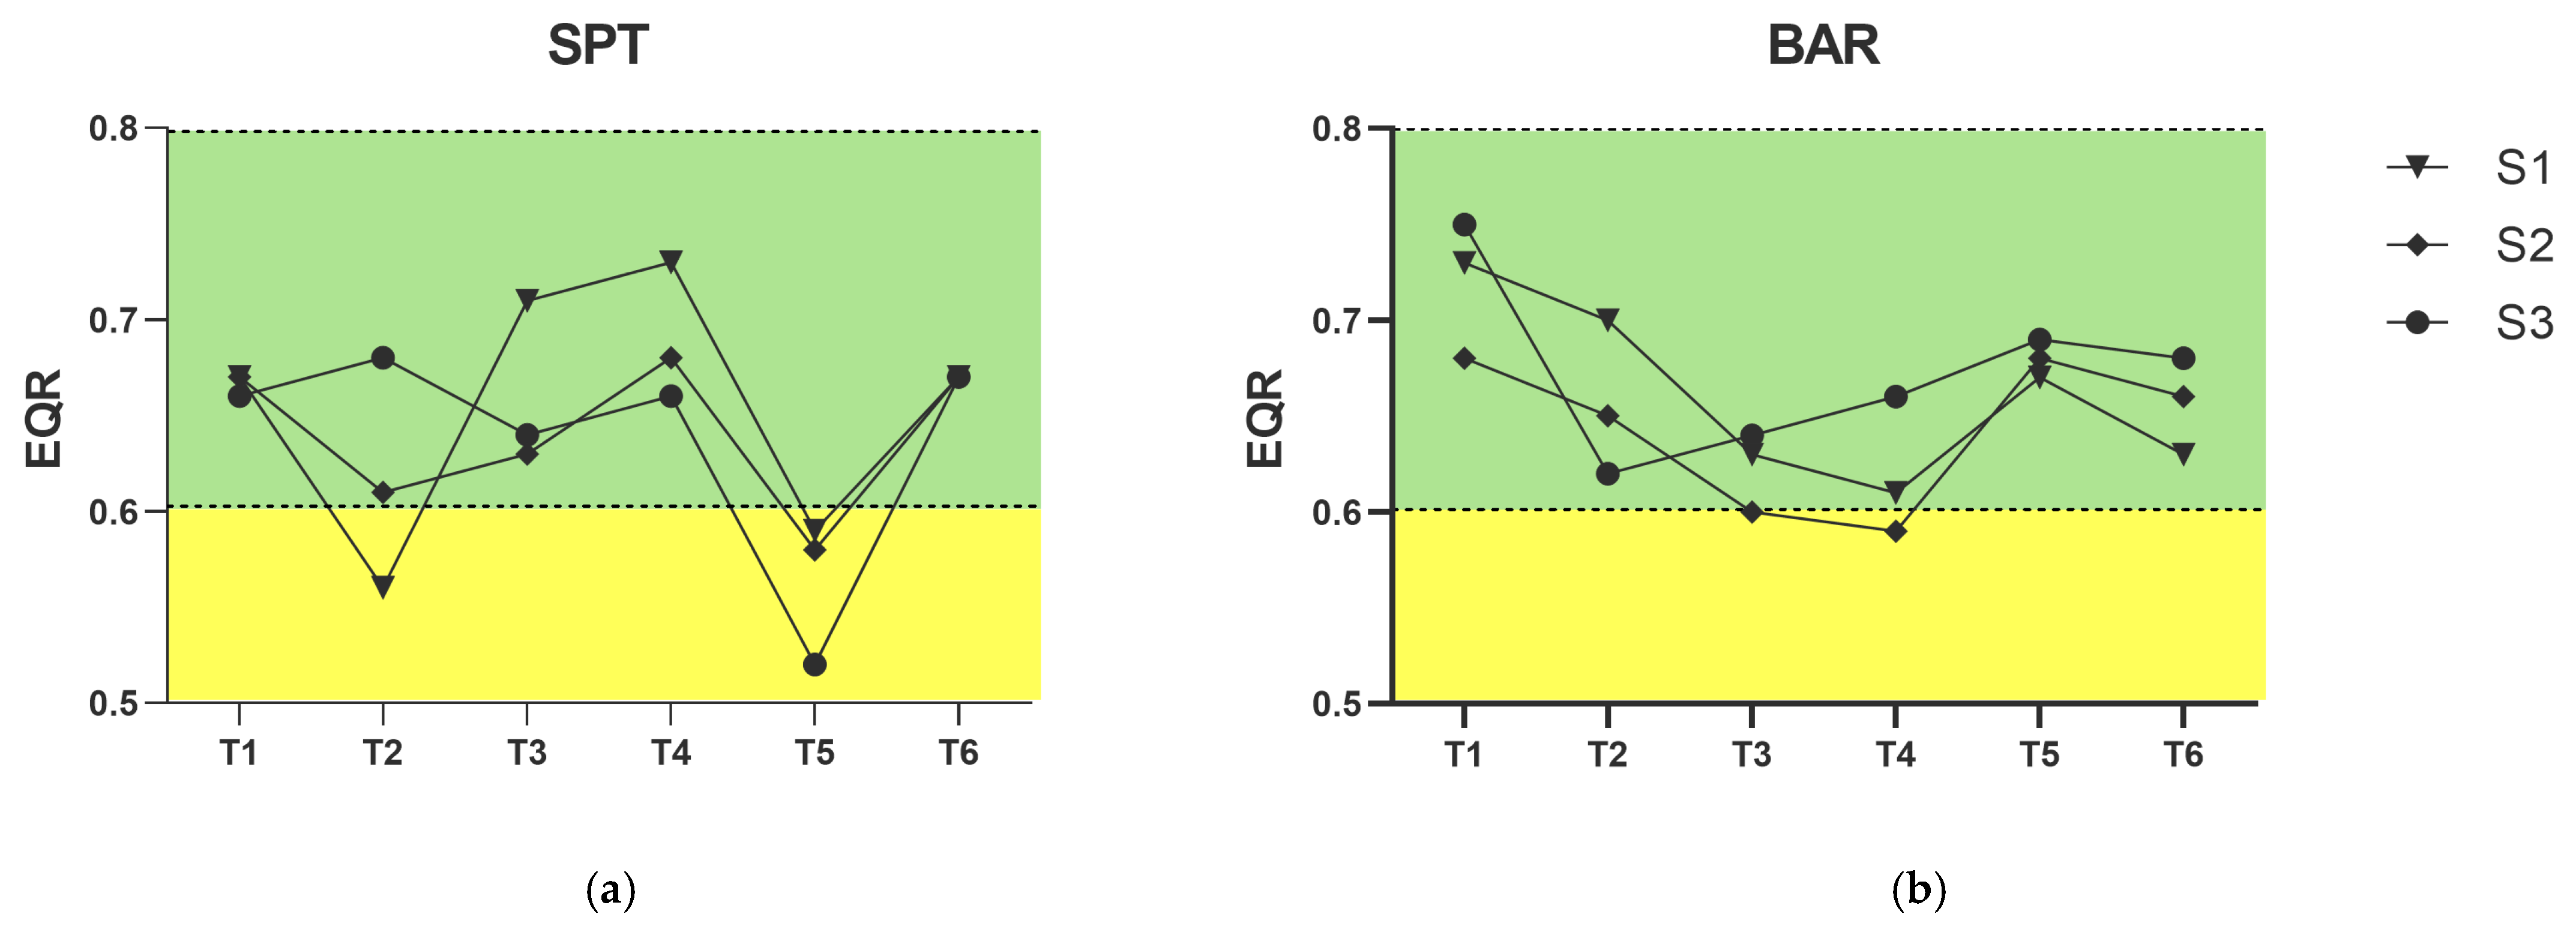
3.2. Ecological Status

Values of the NAMBER index for the investigated assemblages ranged between 0.52 and 0.75 (Supplementary Materials, Tables S3 and S4). For SPT, the index classified the status of biogenic reefs as “Moderate” in four cases and “Good” in all others (Figure 4). More specifically, a “Moderate” status was found for all sites in T5, and for S1 in T2. However, the overall ecological status remained classified as “Good” for this area (mean NAMBER = 0.64).
For BAR, the index always indicated a “Good” status at all sites and across all sampling times (Figure 4), except for S2 in T4, where the status was classified as “Moderate”. A slight decrease in EQR values was recorded between T1 and T4, followed by a return to values > 0.63 in T5–T6. However, the overall ecological status remained classified as “Good” for this area (mean NAMBER = 0.66).

4. Discussion

Sessile assemblages on biogenic reefs in both the studied areas were characterized by a significant spatiotemporal variability among stations and sites. This variability is typical of these marine bioconstructions [42] and, more generally, of coralligenous outcrops, which often exhibit high three-dimensional complexity. This creates microhabitats and modifies local environmental features (e.g., the exposure to sedimentation, light), increasing small-scale and medium-scale patchiness in species distribution [22,25]. The overall temporal patterns of variation in the structure of sessile assemblages, however, were not consistent between the two study areas. While both areas followed similar temporal trajectories, suggesting comparable responses to environmental drivers, they differed in the magnitude of temporal variations, as the multivariate temporal heterogeneity of assemblages was significantly larger at SPT with respect to BAR. Assemblages at BAR showed a more uniform and stable structure, with slighter temporal fluctuations compared to SPT, where assemblages were markedly variable over time. The analysis of taxa that mostly contributed to temporal variations of sessile assemblages in the study areas highlighted that some groups of macroalgae and sponges accounted for a large portion of the total temporal variance. Specifically, SPT was primarily characterized by large fluctuations in the abundance of turf-forming, ephemeral species and small erect brown algae (e.g., Dictyota spp.). These macroalgae generally had a lower and more stable abundance at BAR if compared to SPT where, in contrast, low abundances alternated with peaks in warm periods (i.e., T1, T2, T5). The opposite occurred for the abundance of sponges Tedania spp. and YLS (e.g., Mycale spp.). These large lobate sponges were more abundant, though variable in time, at BAR and had consistently very low abundance at SPT.
Disentangling the reasons underlying the observed patterns of difference in temporal trajectories between the two areas is challenging due to potential interactions among different drivers of change. The different temporal trajectories and magnitudes of variation characterizing the two investigated areas may depend on differences in site-specific environmental conditions. BAR is characterized by a more homogeneous distribution of biogenic reefs, greater depth (20 m), and greater distance from the coast (19 km), making this area less exposed to environmental variations. In contrast, biogenic reef distribution at SPT is patchy and closer to the coast (9 km) at a shallower depth (15 m), making this area possibly more influenced by variations in environmental factors (e.g., water temperature, solar radiation). This is consistent with the results of other independent studies [52,53], which identified outcrop morphology, distance from shore, sediment dynamics, and depth as the main factors explaining the diversity of the benthic community of the bioconstructions in the northern Adriatic Sea. Similarly to our results, Gianni et al. [58] found that sites relatively far from the coast appeared to be characterized by more stable conditions. The patchy distribution of reefs at SPT could have also played a role in determining the large temporal variation in this area, as fragmented habitats are generally more sensitive to external drivers [59,60,61]. Moreover, the reduced depth in SPT implies greater sunlight penetration and, consequently, greater algal proliferation, especially in the warm season.
On the other hand, the proximity of SPT to the coast, and therefore to human activities, if compared to BAR, could have made the former area more exposed to anthropogenic disturbance, thus causing a lower stability of assemblages. Results from recent surveys in the study region found very low and comparable levels of pollution at both BAR and SPT, thus not sustaining the hypothesis of differences in the influence of coastal activities between the two areas [62]. However, other indirect sources of environmental stress could act differently in the two areas. For example, the central part of the Gulf of Trieste, where SPT is located, is subjected to medium-high trawling pressure [63]. Although fishing activities are banned in both areas, the limit of the ban is much more closely positioned to biogenic reefs at SPT than at BAR, so that increased sedimentation and abrasion due to sediment resuspension caused by trawling could have propagated to neighboring protected reefs. Increasing sedimentation, along with other human pressures acting near the coast could have driven a shift of assemblages on bioconstructions from invertebrate dominance toward the dominance of turf-forming, opportunistic macroalgae, as observed in other regions of the Adriatic Sea [14].
As far as the ecological status of reefs defined by the NAMBER index, both areas can be assigned to a “Good” status. Some sporadic cases of deterioration, with shifts into the “Moderate” level, were recorded, particularly at SPT. In this area, in three out of four cases, the worst conditions coincided with the warm periods, especially T5. On this time of sampling and also on T2 (August 2023), data on sea water temperature on the sea bottom at SPT showed repeated increases over the 90th percentile in 1993–2025 climatology and/or increased turbidity (Supplementary Figures S1–S3). Comparing the mean EQR values of the three components of the index in T5 at SPT clearly indicated that the sensitivity level of the assemblages is the most affected component (mean EQR of CCA = 0.59, α-diversity = 0.63, SL = 0.47). A slight decrease was observed in both the species richness of the area and the coverage of encrusting coralline algae (which indicates the level of bioconstruction), along with a simultaneous increase in species with a lower sensitivity level. Among these are turf algae, which reached coverage values up to 34%, as well as groups of brown algae like Zanardinia typus and CBB (e.g., Dictyota spp.). Conversely, there was a simultaneous decline in more sensitive species, including those grouped in YLS. Although the increase in the coverage of more sensitive groups may be counterbalanced by the increase in less sensitive ones—potentially masking stress signals—the index has demonstrated a certain sensitivity in detecting both spatial and temporal variations. From the perspective of temporal fluctuations recorded by the index, BAR experienced a worsening trend in ecological status between time 1 and time 4, followed by a partial recovery in the last two time points. In contrast, the temporal evolution in SPT follows a more erratic pattern, with lower scores coinciding with the warm period, particularly T5 (August 2024). Indeed, at this time the region experienced unprecedented temperatures, consistently ranging between 29–30 °C—4 to 5 degrees higher than the 1934–2023 average (see also Supplementary Figure S1). It could be argued that such variations in the values of NAMBER, and the associated ecological status, could be concerned with the range of imprecision of the index. However, with respect to other ecosystem-based quality indices [64,65,66], which are complemented by an indicator of confidence encompassing the uncertainty related to the origin of data used for calculations (e.g., field data, expert judgement), NAMBER is thought to rely exclusively on direct field sampling, thus not requiring this kind of indication on data reliability. Inconsistencies could be rather dependent on natural fluctuations in community structure, requiring a standardization of the period of data collection, or the definition of a confidence interval in the threshold values to account for seasonal changes or depth ranges. Also, studies are needed to establish possible causal links between variations in the ecological status of these bioconstructions and other factors, whether natural or anthropogenic, such as sedimentation rates, the presence of mucilage, algal blooms, changes in hydrodynamic regimes, and nutrient levels. Above all, the application of the NAMBER index in monitoring interannual changes of mesophotic biogenic reefs of the northern Adriatic has proven to be a valuable tool, able to reflect the major changes detectable through a multivariate analysis of benthic assemblages, and representing a simple, non-invasive, and cost-effective monitoring tool that can also allow a synthesis of complex data for a better communication between environmental practitioners and decision-makers.

5. Conclusions

Sessile assemblages of biogenic reefs in the northern Adriatic Sea revealed a high degree of spatial heterogeneity across all investigated scales, a typical feature of these habitats [42,67,68]. Environmental differences between areas may contribute to varying susceptibilities of reef assemblages to environmental stressors [59,60,61,69]. Given the slow growth rates and limited resilience to rapid shifts of coralligenous assemblages [9,47,70], these findings highlight the need for targeted conservation efforts to maintain the structural integrity and biodiversity of these bioconstructions. Providing a proper monitoring pipeline tailored for bioconstructions will be crucial to investigate, analyze, inform, and set adaptive management strategies in the face of ongoing global change. In this view, due to the strong consistency between the multivariate community analysis and the evidence from the NAMBER index, an approach based on monitoring biogenic reefs using macro-groups of taxa and the application of the index, which requires a minor workload in terms of time and expertise, alternated with periodic fine-resolution community assessments, may be a cost-effective solution to optimize the long-term monitoring of these important and fragile environments.

Supplementary Materials

The following supporting information can be downloaded at: https://www.mdpi.com/article/10.3390/environments12040124/s1, Table S1: List of taxa and morphological groups found in the study; Table S2: Average abundance of taxa in the two areas and for each time of sampling; Table S3: Ecological status of sessile assemblages on biogenic reefs for each site and each sampling time at SPT according to the NAMBER index; Table S4: Ecological status of sessile assemblages on biogenic reefs for each site and each sampling time at BAR according to the NAMBER index; Figure S1: Temperature data [°C]. The red line is the observed value of temperature, green indicates the climatology, blue and purple lines indicate the 90th and 10th percentiles. T1 (April 2021), T2 (August 2023), T3 (December 2023), T4 (February 2024), T5 (August 2024), and T6 (December 2024); Figure S2: Transparency data “Secchi depth of seawater [m]”. T1 (April 2021), T2 (August 2023), T3 (December 2023), T4 (February 2024), T5 (August 2024), and T6 (December 2024); Figure S3: Transparency data “Volume attenuation coefficient of downwelling radiative flux in seawater [m−1]”. T1 (April 2021), T2 (August 2023), T3 (December 2023), T4 (February 2024), T5 (August 2024), and T6 (December 2024).

Author Contributions

Conceptualization, S.B.; methodology, S.B.; formal analysis, S.B., G.M., M.P., V.V., M.D.L., S.C., M.S. (Marco Segarich), and L.P.; investigation, S.C.; resources, S.B., M.S. (Maurizio Spoto), A.T., and M.R.; writing—original draft preparation, G.M., V.V., and M.P.; writing—review and editing, S.B., M.P., M.R., and A.T.; visualization, G.M., M.P., and V.V.; supervision, S.B. All authors have read and agreed to the published version of the manuscript.

Funding

This work was carried out as part of the project MITFISH-N2K, code FEAMP 071/RBC/20, funded by the European Fund for Maritime Affairs and Fisheries (EMFF 2014–2020, Measure 1.40), Servizio Caccia e Pesca—Regione Friuli Venezia Giulia, Italy. The subsequent monitoring programs carried out in the “Trezze San Pietro e Bardelli” Site of Community Importance (SCI IT3330009) were funded by Servizio Biodiversità—Regione Friuli Venezia Giulia, Italy.

Data Availability Statement

The original contributions presented in this study are included in the article/Supplementary Materials. Further inquiries can be directed to the corresponding author(s).

Acknowledgments

Marco Fantin and Stefano Caressa provided invaluable support during fieldwork. We greatly acknowledge Lisa Faresi for assistance in taxonomic identification and sample processing.

Conflicts of Interest

The authors declare no conflicts of interest.

References

  1. Ballesteros, E. Mediterranean Coralligenous Assemblages: A Synthesis of Present Knowledge. In Oceanography and Marine Biology: An Annual Review; Gibson, R.N., Atkinson, R.J.A., Gordon, J.D.M., Eds.; Taylor & Francis: Boca Raton, FL, USA, 2006; Volume 44, pp. 123–195. [Google Scholar]
  2. UNEP/MAP Regional Activity Centre for Specially Protected Areas. Action Plan for the Conservation of the Coralligenous and Other Calcareous Bio-Concretions in the Mediterranean Sea; UNEP MAP RAC-SPA Publication: Tunis, Tunisia, 2008. [Google Scholar]
  3. Boudouresque, C.F.; Blanfuné, A.; Harmelin-Vivien, M.; Personnic, S.; Ruitton, S.; Thibaut, T.; Verlaque, M. Where Seaweed Forests Meet Animal Forests: The Examples of Macroalgae in Coral Reefs and the Mediterranean Coralligenous Ecosystem. In Marine Animal Forests: The Ecology of Benthic Biodiversity Hotspots; Rossi, S., Bramanti, L., Gori, A., Orejas, C., Eds.; Springer International Publishing: Cham, Switzerland, 2017; pp. 369–396. [Google Scholar]
  4. Garrabou, J.; Ballesteros, E.; Zabala, M. Structure and Dynamics of North-Western Mediterranean Rocky Benthic Communities along a Depth Gradient. Estuar. Coast. Shelf Sci. 2002, 55, 493–508. [Google Scholar] [CrossRef]
  5. Laborel, J. Marine Biogenic Constructions in the Mediterranean, a Review. Sci. Rep. Port-Cros Natl. Park 1987, 13, 97–126. [Google Scholar]
  6. Casellato, S.; Stefanon, A. Coralligenous Habitat in the Northern Adriatic Sea: An Overview. Mar. Ecol. 2008, 29, 321–341. [Google Scholar] [CrossRef]
  7. Guidetti, P.; Terlizzi, A.; Fraschetti, S.; Boero, F. Spatio-Temporal Variability in Fish Assemblages Associated with Coralligenous Formations in South Eastern Apulia (SE Italy). Ital. J. Zool. 2002, 69, 325–331. [Google Scholar] [CrossRef]
  8. Tonin, S. Economic Value of Marine Biodiversity Improvement in Coralligenous Habitats. Ecol. Indic. 2018, 85, 1121–1132. [Google Scholar] [CrossRef]
  9. Martin, C.S.; Giannoulaki, M.; De Leo, F.; Scardi, M.; Salomidi, M.; Knittweis, L.; Pace, M.L.; Garofalo, G.; Gristina, M.; Ballesteros, E.; et al. Coralligenous and Maërl Habitats: Predictive Modelling to Identify Their Spatial Distributions across the Mediterranean Sea. Sci. Rep. 2014, 4, 5073. [Google Scholar] [CrossRef]
  10. Martin, S.; Charnoz, A.; Gattuso, J.-P. Photosynthesis, Respiration and Calcification in the Mediterranean Crustose Coralline Alga Lithophyllum cabiochae (Corallinales, Rhodophyta). Eur. J. Phycol. 2013, 48, 163–172. [Google Scholar] [CrossRef]
  11. Paoli, C.; Montefalcone, M.; Morri, C.; Vassallo, P.; Bianchi, C.N. Ecosystem Functions and Services of the Marine Animal Forests. In Marine Animal Forests; Springer: Cham, Switzerland, 2017; pp. 1271–1312. [Google Scholar]
  12. Chimienti, G.; Stithou, M.; Dalle Mura, I.; Mastrototaro, F.; D’Onghia, G.; Tursi, A.; Izzi, C.; Fraschetti, S. An Explorative Assessment of the Importance of Mediterranean Coralligenous Habitat to Local Economy: The Case of Recreational Diving. J. Environ. Account. Manag. 2017, 5, 315–325. [Google Scholar] [CrossRef]
  13. Mangos, A.; Basino, J.P.; Sauzade, D. Valeur Économique Des Bénéfices Soutenables Provenant Des Écosystèmes Marins Méditerranéens; Plan Bleu: Sophia Antipolis, France, 2010; p. 78. [Google Scholar]
  14. Kružić, P.; Rodić, P. Impact of Climate Changes on Coralligenous Community in the Adriatic Sea. In Proceedings of the 2nd Mediterranean Symposium on the Conservation of Coralligenous and Other Calcareous Bio-Concretions, Portorož, Slovenia, 29–30 October 2014; pp. 100–105. [Google Scholar]
  15. Piazzi, L.; Gennaro, P.; Balata, D. Threats to Macroalgal Coralligenous Assemblages in the Mediterranean Sea. Mar. Pollut. Bull. 2012, 64, 2623–2629. [Google Scholar] [CrossRef]
  16. Bevilacqua, S.; Guarnieri, G.; Farella, G.; Terlizzi, A.; Fraschetti, S. A Regional Assessment of Cumulative Impact Mapping on Mediterranean Coralligenous Outcrops. Sci. Rep. 2018, 8, 1757. [Google Scholar] [CrossRef]
  17. Terrón-Sigler, A.; León-Muez, D.; Peñalver-Duque, P.; Torre, F.E. The Effects of SCUBA Diving on the Endemic Mediterranean Coral Astroides Calycularis. Ocean Coast. Manag. 2016, 122, 1–8. [Google Scholar] [CrossRef]
  18. Rindi, F.; Braga, J.C.; Martin, S.; Peña, V.; Le Gall, L.; Caragnano, A.; Aguirre, J. Coralline Algae in a Changing Mediterranean Sea: How Can We Predict Their Future, If We Do Not Know Their Present? Front. Mar. Sci. 2019, 6, 723. [Google Scholar] [CrossRef]
  19. Lambeck, K.; Antonioli, F.; Purcell, A.; Silenzi, S. Sea-Level Change along the Italian Coast for the Past 10,000 Yr. Quat. Sci. Rev. 2004, 23, 1567–1598. [Google Scholar] [CrossRef]
  20. Canovas-Molina, A.; Montefalcone, M.; Vassallo, P.; Morri, C.; Bianchi, C.N.; Bavestrello, G. Combining Literature Review, Acoustic Mapping and in Situ Observations: An Overview of Coralligenous Assemblages in Liguria (NW Mediterranean Sea). Sci. Mar. 2016, 80, 7–16. [Google Scholar] [CrossRef]
  21. Pierdomenico, M.; Bonifazi, A.; Argenti, L.; Ingrassia, M.; Casalbore, D.; Aguzzi, L.; Viaggiu, E.; Le Foche, M.; Chiocci, F. Geomorphological Characterization, Spatial Distribution and Environmental Status Assessment of Coralligenous Reefs along the Latium Continental Shelf. Ecol. Indic. 2021, 131, 108219. [Google Scholar] [CrossRef]
  22. Falace, A.; Kaleb, S.; Curiel, D.; Miotti, C.; Galli, G.; Querin, S.; Ballesteros, E.; Solidoro, C.; Bandelj, V. Calcareous Bio-Concretions in the Northern Adriatic Sea: Habitat Types, Environmental Factors That Influence Habitat Distributions, and Predictive Modeling. PLoS ONE 2015, 10, e0140931. [Google Scholar] [CrossRef]
  23. Newton, R.S.; Stefanon, A. The “Tegnue de Ciosa” Area: Patch Reefs in the Northern Adriatic Sea. Mar. Geol. 1975, 19, M27–M33. [Google Scholar] [CrossRef]
  24. Spagnoli, F.; Dinelli, E.; Giordano, P.; Marcaccio, M.; Zaffagnini, F.; Frascari, F. Sedimentological, Biogeochemical and Mineralogical Facies of Northern and Central Western Adriatic Sea. J. Mar. Syst. 2014, 139, 183–203. [Google Scholar] [CrossRef]
  25. Curiel, D.; Falace, A.; Bandelj, V.; Kaleb, S.; Solidoro, C.; Ballesteros, E. Species Composition and Spatial Variability of Macroalgal Assemblages on Biogenic Reefs in the Northern Adriatic Sea. Bot. Mar. 2012, 55, 625–638. [Google Scholar] [CrossRef]
  26. Piazzi, L.; Turicchia, E.; Rindi, F.; Falace, A.; Gennaro, P.; Abbiati, M.; Bandelj, V.; Calcinai, B.; Ciriaco, S.; Costantini, F.; et al. NAMBER: A Biotic Index for Assessing the Ecological Quality of Mesophotic Biogenic Reefs in the Northern Adriatic Sea. Aquat. Conserv. Mar. Freshw. Ecosyst. 2023, 33, 298–311. [Google Scholar] [CrossRef]
  27. Bettoso, N.; Faresi, L.; Pitacco, V.; Orlando-Bonaca, M.; Aleffi, I.F.; Lipej, L. Species Richness of Benthic Macrofauna on Rocky Outcrops in the Adriatic Sea by Using Species-Area Relationship (SAR) Tools. Water 2023, 15, 318. [Google Scholar] [CrossRef]
  28. Guidetti, P.; Addis, P.; Atzori, F.; Bussotti, S.; Calò, A.; Cau, A.; Culioli, J.-M.; De Lucia, G.; Di Franco, A.; Di Lorenzo, M.; et al. Assessing the Potential of Marine Natura 2000 Sites to Produce Ecosystem-Wide Effects in Rocky Reefs: A Case Study from Sardinia Island (Italy). Aquat. Conserv. Mar. Freshw. Ecosyst. 2019, 29, 537–545. [Google Scholar] [CrossRef]
  29. Meinesz, A.; Blanfuné, A. 1983–2013: Development of Marine Protected Areas along the French Mediterranean Coasts and Perspectives for Achievement of the Aichi Target. Mar. Policy 2015, 54, 10–16. [Google Scholar] [CrossRef]
  30. Furlan, E.; Torresan, S.; Critto, A.; Lovato, T.; Solidoro, C.; Lazzari, P.; Marcomini, A. Cumulative Impact Index for the Adriatic Sea: Accounting for Interactions among Climate and Anthropogenic Pressures. Sci. Total Environ. 2019, 670, 379–397. [Google Scholar] [CrossRef]
  31. Giani, M.; Djakovac, T.; Degobbis, D.; Cozzi, S.; Solidoro, C.; Umani, S.F. Recent Changes in the Marine Ecosystems of the Northern Adriatic Sea. Estuar. Coast. Shelf Sci. 2012, 115, 1–13. [Google Scholar] [CrossRef]
  32. Micheli, F.; Halpern, B.S.; Walbridge, S.; Ciriaco, S.; Ferretti, F.; Fraschetti, S.; Lewison, R.; Nykjaer, L.; Rosenberg, A.A. Cumulative Human Impacts on Mediterranean and Black Sea Marine Ecosystems: Assessing Current Pressures and Opportunities. PLoS ONE 2013, 8, e79889. [Google Scholar] [CrossRef] [PubMed]
  33. Stirn, J.; Avcin, A.; Cencekj, J.; Dorer, M.; Gomiscek, S.; Kvender, S.; Malej, A.; Meischner, D.; Nozina, I.; Paul, J.; et al. Pollution Problems of the Adriatic Sea: An Interdisciplinary Approach. Rev. Intern. Océanogr. Méd. 1974, 35, 21–78. [Google Scholar]
  34. Acquavita, A.; Covelli, S.; Emili, A.; Berto, D.; Faganeli, J.; Giani, M.; Horvat, M.; Koron, N.; Rampazzo, F. Mercury in the Sediments of the Marano and Grado Lagoon (Northern Adriatic Sea): Sources, Distribution and Speciation. Estuar. Coast. Shelf Sci. 2012, 113, 20–31. [Google Scholar] [CrossRef]
  35. Carić, H.; Mackelworth, P. Cruise Tourism Environmental Impacts–The Perspective from the Adriatic Sea. Ocean Coast. Manag. 2014, 102, 350–363. [Google Scholar] [CrossRef]
  36. Coll, M.; Santojanni, A.; Palomera, I.; Tudela, S.; Arneri, E. An Ecological Model of the Northern and Central Adriatic Sea: Analysis of Ecosystem Structure and Fishing Impacts. J. Mar. Syst. 2007, 67, 119–154. [Google Scholar] [CrossRef]
  37. Covelli, S.; Faganeli, J.; Horvat, M.; Brambati, A. Mercury Contamination of Coastal Sediments as the Result of Long-Term Cinnabar Mining Activity (Gulf of Trieste, Northern Adriatic Sea). Appl. Geochem. 2001, 16, 541–558. [Google Scholar] [CrossRef]
  38. Gissi, E.; Menegon, S.; Sarretta, A.; Appiotti, F.; Maragno, D.; Vianello, A.; Depellegrin, D.; Venier, C.; Barbanti, A. Addressing Uncertainty in Modelling Cumulative Impacts within Maritime Spatial Planning in the Adriatic and Ionian Region. PLoS ONE 2017, 12, e0180501. [Google Scholar] [CrossRef] [PubMed]
  39. Micheli, F.; Levin, N.; Giakoumi, S.; Katsanevakis, S.; Abdulla, A.; Coll, M.; Fraschetti, S.; Kark, S.; Koutsoubas, D.; Mackelworth, P.; et al. Setting Priorities for Regional Conservation Planning in the Mediterranean Sea. PLoS ONE 2013, 8, e59038. [Google Scholar] [CrossRef]
  40. Torresan, S.; Critto, A.; Rizzi, J.; Marcomini, A. Assessment of Coastal Vulnerability to Climate Change Hazards at the Regional Scale: The Case Study of the North Adriatic Sea. Nat. Hazards Earth Syst. Sci. 2012, 12, 2347–2368. [Google Scholar] [CrossRef]
  41. Bandelj, V.; Solidoro, C.; Laurent, C.; Querin, S.; Kaleb, S.; Gianni, F.; Falace, A. Cross-Scale Connectivity of Macrobenthic Communities in a Patchy Network of Habitats: The Mesophotic Biogenic Habitats of the Northern Adriatic Sea. Estuar. Coast. Shelf Sci. 2020, 245, 106978. [Google Scholar] [CrossRef]
  42. Ponti, M.; Fava, F.; Abbiati, M. Spatial–Temporal Variability of Epibenthic Assemblages on Subtidal Biogenic Reefs in the Northern Adriatic Sea. Mar. Biol. 2011, 158, 1447–1459. [Google Scholar] [CrossRef]
  43. Trobec, A.; Busetti, M.; Zgur, F.; Baradello, L.; Babich, A.; Cova, A.; Gordini, E.; Romeo, R.; Tomini, I.; Poglajen, S.; et al. Thickness of Marine Holocene Sediment in the Gulf of Trieste (Northern Adriatic Sea). Earth Syst. Sci. Data 2018, 10, 1077–1092. [Google Scholar] [CrossRef]
  44. Regione Autonoma Friuli Venezia Giulia DGR 1701/2019 Del 04 Ottobre 2019—LR 8/2007, Art. 10. Misure Di Conservazione Dei Siti Marini Del Friuli Venezia Giulia. 2019. Available online: https://mtom.regione.fvg.it (accessed on 25 February 2025).
  45. Casellato, S.; Sichirollo, E.; Cristofoli, A.; Masiero, L.; Soresi, S. Biodiversity of some rocky outcrops in the gulf of Venice (“Tegnue”). Biol. Mar. Medit. 2005, 12, 69–77. [Google Scholar]
  46. Bianchi, C.N.; Azzola, A.; Cocito, S.; Morri, C.; Oprandi, A.; Peirano, A.; Sgorbini, S.; Montefalcone, M. Biodiversity Monitoring in Mediterranean Marine Protected Areas: Scientific and Methodological Challenges. Diversity 2022, 14, 43. [Google Scholar] [CrossRef]
  47. García-Gómez, J.C.; González, A.R.; Maestre, M.J.; Espinosa, F. Detect Coastal Disturbances and Climate Change Effects in Coralligenous Community through Sentinel Stations. PLoS ONE 2020, 15, e0231641. [Google Scholar] [CrossRef]
  48. Dethier, M.N.; Graham, E.S.; Cohen, S.; Tear, L.M. Visual versus Random-Point Percent Cover Estimations: “objective” Is Not Always Better. Mar. Ecol. Prog. Ser. 1993, 96, 93–100. [Google Scholar] [CrossRef]
  49. Anderson, M.J. A New Method for Non-Parametric Multivariate Analysis of Variance. Austral Ecol. 2001, 26, 32–46. [Google Scholar] [CrossRef]
  50. Anderson, M.J. Distance-Based Tests for Homogeneity of Multivariate Dispersions. Biometrics 2006, 62, 245–253. [Google Scholar] [CrossRef] [PubMed]
  51. Legendre, P.; De Caceres, M. Beta Diversity as the Variance of Community Data: Dissimilarity Coefficients and Partitioning. Ecol. Lett. 2013, 16, 951–963. [Google Scholar] [CrossRef]
  52. Clarke, K.R.; Gorley, R.N. PRIMER v7: User Manual/Tutorial; PRIMER-E: Plymouth, UK, 2015. [Google Scholar]
  53. Anderson, M.; Gorley, R.N.; Clarke, K. PERMANOVA+ for Primer: Guide to Software and Statistical Methods; PRIMER-E: Plymouth, UK, 2008; Available online: https://learninghub.primer-e.com/books (accessed on 25 February 2025).
  54. R Core Team. R: A Language and Environment for Statistical Computing; R Foundation for Statistical Computing: Vienna, Austria, 2024. [Google Scholar]
  55. Sandrini-Neto, L.; Gilbert, E.; Camargo, M. GAD: Analysis of Variance from General Principles. 2024. Available online: https://CRAN.R-project.org/package=GAD (accessed on 25 February 2025).
  56. Dry, S.; Bauman, D.; Blanchet, G.; Borcard, D.; Classe, S.; Guernard, G.; Jombardt, T.; Larocque, G.; Legendre, P.; Madi, N.; et al. Adespatial: Multivariate Multiscale Spatial Analysis. 2025. Available online: https://CRAN.R-project.org/package=adespatial (accessed on 25 February 2025).
  57. Directive 2008/56/EC of the European Parliament and of the Council of 17 June 2008 Establishing a Framework for Community Action in the Field of Marine Environmental Policy (Marine Strategy Framework Directive) (Text with EEA Relevance). Available online: https://www.bsbd.bg/UserFiles/Dir2008-56-EO-EN.pdf (accessed on 25 February 2025).
  58. Gianni, F.; Turicchia, E.; Abbiati, M.; Calcinai, B.; Caragnano, A.; Ciriaco, S.; Costantini, F.; Kaleb, S.; Piazzi, L.; Puce, S.; et al. Spatial Patterns and Drivers of Benthic Community Structure on the Northern Adriatic Biogenic Reefs. Biodivers. Conserv. 2023, 32, 3283–3306. [Google Scholar] [CrossRef]
  59. Krauss, J.; Bommarco, R.; Guardiola, M.; Heikkinen, R.K.; Helm, A.; Kuussaari, M.; Lindborg, R.; Ockinger, E.; Partel, M.; Pino, J.; et al. Habitat Fragmentation Causes Immediate and Timedelayed Biodiversity Loss at Different Trophic Levels. Ecol. Lett. 2010, 13, 597–605. [Google Scholar] [CrossRef]
  60. Gera, A.; Pages, J.F.; Romero, J.; Alcoverro, T. Combined Effects of Fragmentation and Herbivory on Posidonia oceanica Seagrass Ecosystems. J. Ecol. 2013, 101, 1053–1061. [Google Scholar] [CrossRef]
  61. Fahrig, L. Effects of Habitat Fragmentation on Biodiversity. Annu. Rev. Ecol. Evol. Syst. 2003, 34, 487–515. [Google Scholar] [CrossRef]
  62. Piccardo, M.; Vellani, V.; Anselmi, S.; Grazioli, E.; Renzi, M.; Terlizzi, A.; Pittura, L.; D’Errico, G.; Regoli, F.; Bevilacqua, S. The Application of the Weight-Of-Evidence Approach for an Integrated Ecological Risk Assessment of Marine Protected Sites. Ecol. Indic. 2024, 159, 111676. [Google Scholar] [CrossRef]
  63. Russo, E.; Monti, M.A.; Mangano, M.C.; Raffaetà, A.; Sarà, G.; Silvestri, C.; Pranovi, F. Temporal and Spatial Patterns of Trawl Fishing Activities in the Adriatic Sea (Central Mediterranean Sea, GSA17). Ocean Coast. Manag. 2020, 192, 105231. [Google Scholar] [CrossRef]
  64. Personnic, S.; Boudouresque, C.-F.; Astruch, P.; Ballesteros, E.; Blouet, S.; Bellan-Santini, D.; Bonhomme, P.; Thibault-Botha, D.; Feunteun, E.; Harmelin-Vivien, M.; et al. An Ecosystem-Based Approach to Assess the Status of a Mediterranean Ecosystem, the Posidonia oceanica Seagrass Meadow. PLoS ONE 2014, 9, e98994. [Google Scholar] [CrossRef] [PubMed]
  65. Astruch, P.; Orts, A.; Schohn, T.; Belloni, B.; Ballesteros, E.; Bănaru, D.; Bianchi, C.N.; Boudouresque, C.-F.; Changeux, T.; Chevaldonné, P.; et al. Ecosystem-based assessment of a widespread Mediterranean marine habitat: The Coastal Detrital Bottoms, with a special focus on epibenthic assemblages. Front. Mar. Sci. 2023, 10, 1130540. [Google Scholar] [CrossRef]
  66. Thibaut, T.; Blanfuné, A.; Boudouresque, C.-F.; Personnic, S.; Ruitton, S.; Ballesteros, E.; Bellan-Santini, D.; Bianchi, C.N.; Bussotti, S.; Cebrian, E.; et al. An ecosystem-based approach to assess the status of Mediterranean algae-dominated shallow rocky reefs. Mar. Pollut. Bull. 2017, 117, 311–329. [Google Scholar] [CrossRef]
  67. Ingrosso, G.; Abbiati, M.; Badalamenti, F.; Bavestrello, G.; Belmonte, G.; Cannas, R.; Benedetti-Cecchi, L.; Bertolino, M.; Bevilacqua, S.; Nike Bianchi, C.; et al. Chapter Three—Mediterranean Bioconstructions Along the Italian Coast. Adv. Mar. Biol. 2018, 79, 61–136. [Google Scholar] [CrossRef] [PubMed]
  68. Turicchia, E.; Abbiati, M.; Bettuzzi, M.; Calcinai, B.; Morigi, M.P.; Summers, A.P.; Ponti, M. Bioconstruction and Bioerosion in the Northern Adriatic Coralligenous Reefs Quantified by X-Ray Computed Tomography. Front. Mar. Sci. 2022, 8, 790869. [Google Scholar] [CrossRef]
  69. Vitelletti, M.L.; Manea, E.; Bongiorni, L.; Ricchi, A.; Sangelantoni, L.; Bonaldo, D. Modelling Distribution and Fate of Coralligenous Habitat in the Northern Adriatic Sea under a Severe Climate Change Scenario. Front. Mar. Sci. 2023, 10, 1050293. [Google Scholar] [CrossRef]
  70. Bertolino, M.; Costa, G.; Carella, M.; Cattaneo-Vietti, R.; Cerrano, C.; Pansini, M.; Quarta, G.; Calcagnile, L.; Bavestrello, G. The Dynamics of a Mediterranean Coralligenous Sponge Assemblage at Decennial and Millennial Temporal Scales. PLoS ONE 2017, 12, e0177945. [Google Scholar] [CrossRef]
Figure 1. Study area and sampling sites. The SCI IT3330009 “Trezze San Pietro e Bardelli” is represented divided into two areas (SPT and BAR). For each area, the perimeter of the SCI is shown (dashed green line), as well as the surface area subject to the prohibition of professional fishing with trawl nets and professional fishing for mollusks (grey area surrounded by the solid red line). Yellow polygons indicate the extension of biogenic reefs, and stars represent the sampling sites in each of the two areas.
Environments 12 00124 g001
Figure 2. nMDS (non-metric multidimensional scaling) of Ti × Ar centroids based on Bray–Curtis similarity. The six sampling times are indicated as T1–T6. T1 (April 2021), T2 (August 2023), T3 (December 2023), T4 (February 2024), T5 (August 2024), and T6 (December 2024). BAR = white circles, SPT = dark grey squares.
Environments 12 00124 g002
Figure 3. Boxplot for the total number of taxa (a), total percentage cover (b), and the cover for each of the four taxa mostly contributing to temporal variations in multivariate assemblage structure at the two study areas across the six sampling times (T1–T6). Turf (c), CBB (d), Tedania spp. (e), YLS (f). BAR (white bars) and SPT (dark gray bars). Asterisks indicate significant differences between the two areas at that specific sampling time. * = p < 0.05; ** = p < 0.01; *** = p < 0.001.
Environments 12 00124 g003
Figure 4. Values of NAMBER index for all sites (S1, S2, S3) in the two study areas (a) SPT and (b) BAR, across the six sampling times (T1–T6). A trend line for each site is reported. Green and yellow backgrounds show “Good” and “Moderate” ranges, respectively.
Environments 12 00124 g004
Table 1. Results of PERMANOVA on the structure of sessile assemblages. Analysis was based on Bray–Curtis similarity (untransformed data), with n = 9999 permutations. Terms already involved in significant higher-order interactions were not analyzed.
Source of Variationd.f.SSMSPseudo-Fp (Perm)
Ti52.57 × 1055.15 × 104
Ar11.99 × 1051.99 × 105
Ti × Ar58.88 × 1041.78 × 1042.9120.0001
Si(Ar)43.01 × 1047.70 × 103
St(Si(Ar))123.85 × 1043.21 × 103
Ti × Si(Ar)201.22 × 1056.10 × 1031.81270.0001
Ti × St(Si(Ar))602.02 × 1053.37 × 1031.51760.0001
Res10672.37 × 1062.22 × 103
Table 2. Results of the ANOVA on the total number of taxa and total cover of sessile assemblages. *** = p < 0.001; NS = not significant. Tests for terms already involved in significant interactions were not reported.
N. of TaxaTotal Coverage
Source of Variationd.f.MSFMSF
Ti5348.20 1.15 × 10419.143 ***
Ar1180.10 31.000.167 NS
Ti × Ar12138.607.657 ***1.4 × 1032.330 NS
Si(Ar)420.70 185.00
St(Si(Ar))57.101.392 NS274.001.593 NS
Ti × Si(Ar)2018.10 ***3.549 ***603.003.506 ***
Ti × St(Si(Ar))605.10 NS1.085 NS172.001.023 NS
Res9724.70 168.00
Cochran’s C-test C = 0.025 NSC = 0.049 ***
Transformation NoneNone
Table 3. Results ANOVA on the total cover of the four main taxa contributing to multivariate temporal variance. * = p < 0.05; ** = p < 0.01; *** = p < 0.001; NS = not significant. Tests for terms already involved in significant interactions are not reported.
TurfFCBBFTedania spp.FYLSF
Source of Variationd.f.MS MS MS MS
Ti51.23 × 104 10.01 20.78 18.20
Ar16.12 × 103 45.76 2.06 1.13 × 10³
Ti × Ar121.34 × 1035.711 ***2.772.856 *12.995.959 ***26.605.541 ***
Si(Ar)4245.001.042 NS2.82 2.311.059 NS1.700.354 NS
St(Si(Ar))595.00 0.28 1.44 5.10
Ti × Si(Ar)20235.001.078 NS0.975.389 ***2.181.246 NS4.801.000 NS
Ti × St(Si(Ar))60218.002.564 ***0.181.500 **1.751.635 ***4.801.714 ***
Res97285.00 0.12 1.072.8
Cochran’s C-test C = 0.048 ***C = 0.029 NSC = 0.058 ***C = 0.029 NS
Transformation NoneSquare rootNoneSquare root
Disclaimer/Publisher’s Note: The statements, opinions and data contained in all publications are solely those of the individual author(s) and contributor(s) and not of MDPI and/or the editor(s). MDPI and/or the editor(s) disclaim responsibility for any injury to people or property resulting from any ideas, methods, instructions or products referred to in the content.

