Abstract
Butterflies are charismatic insects that are critical pollinators for plants that humans and wildlife depend on; however, butterflies have some of the largest measured declines. Two iconic butterflies in the USA, the Regal Fritillary (Argynnis idalia) and the Monarch (Danaus plexippus), are proposed for protection due to decreasing numbers from overexploitation, agricultural activities, disease and development. We surveyed 145 sites and walked 557 km from mid-June to August in 2019 and 2021 to create baseline information for butterflies and fill in knowledge gaps for these species. We observed 16,986 individuals and identified 52 species of butterflies. Generally, butterflies were more abundant at lower wind speeds and in areas with higher forb cover and less bare ground. We identified more species in locations with taller grass, higher bloom densities, higher cover of forbs, and less bare ground. We observed 11 Regal Fritillaries and 31 Monarchs extending from northeastern to southeastern Wyoming in a variety of habitats. The predicted suitable habitat of Regal Fritillaries and Monarchs was highly influenced by sagebrush cover and mean temperature of the wettest quarter according to species distribution models. Our results provide information to managers about the status, distribution, and habitat use of butterflies in a previously un-surveyed area. Historical butterfly surveys were limited to mountain ecosystems, and we provide baseline information on the habitat characteristics that support the highest abundances and most species in prairie ecosystems that can be compared to future efforts.
1. Introduction
Insects in Europe and North America have declined over the past few decades [1,2,3]. These animals continue to decline faster than birds and plants [4], conveying the need for monitoring and conservation efforts. Pollinating insects (e.g., butterflies, bees, flies, and beetles) are of particular concern because of the ecological services they provide in natural environments and to food crops [5]. Butterflies are one of the insect orders reported with the highest rates of decline [3], potentially due to overexploitation, agricultural activities, urban development, disease, and altered temperature and precipitation patterns [3,6,7]. The drastic decline in butterfly diversity was first reported in Belgium in 2001 [8] and has since been observed in other European countries, the USA, Asia, the Arctic, and the Neotropics [3,7]. Currently, eight butterflies are protected under the US Endangered Species Act (ESA) in the United States and five are under review (explorer.natureserve.org). In Wyoming, the Regal Fritillary (Argynnis idalia) and Monarch (Danaus plexippus) are proposed threatened under the US Endangered Species Act (ESA).
Species distribution models (SDM) are useful tools for establishing baseline information, estimating where rare species may occur [9,10,11], calculating changes over time [12,13], and guiding sampling efforts [14,15]. SDM relate observations to landscape and climate to predict suitable habitat of a species where surveys have not occurred. Combining historical and current observations can result in better predictions of suitable habitat and insight into future changes [12]. Maximum entropy (MaxEnt) is one model that typically uses detections that results in high performing models [10] even for rare or infrequently sampled species to predict suitable habitat [11]. Species distribution models only predict areas of suitable habitat but not the range of the species due to over-predicting suitable habitat [16,17]. Species distribution models use coarse-scale habitat information to predict suitability and combining these data with finer scales measurement (e.g., floral surveys, vegetation characteristics) can result in a better understanding of habitat selection.
Some butterfly species are declining, including the Regal Fritillary and Monarch. The Regal Fritillaries live in the eastern USA [18] and their numbers declined by 75–95% since 1990 [19] due in part to the rapid loss and fragmentation of tallgrass prairie ecosystems by agriculture (farming and grazing) and grassland fires [20,21]. Regal Fritillaries largely disappeared from the eastern portion of their range [22] and the western distribution of these butterflies is unknown with most maps excluding Wyoming as part of their range. Monarch occur across the USA with individuals in the eastern USA decreasing by 80–97% [23,24] and individuals in the western USA decreasing by 98% since 1997 [24]. The decline of Monarchs may be largely driven by fewer Milkweed (Ascelpias spp.), their larval host plant (e.g., [25,26]), disease, agricultural intensification and pesticide use (e.g., [27,28,29]). Migrating Monarchs east of the Rocky Mountains are better understood than western populations [30]. Monarch and Milkweed conservation gained considerable momentum in recent years [26,31]; the current distribution of Monarchs in Wyoming is largely unknown despite the surge of interest.
Our goal was to establish baseline data on butterfly abundance, richness, and habitat use, while also estimating the status of the Regal Fritillary and Monarch in a previously un-surveyed area. Historically, four observations of the Regal Fritillary and 24 Monarch sightings were recorded in Wyoming before 2005 [32]. Due to more recent Monarch sampling efforts, 168 Monarchs have been observed in Wyoming since 2010 [33]. Our specific questions were as follows. (1) How does butterfly abundance and richness relate to habitat conditions? (2) How abundant and what was the distribution of the Regal Fritillary and the Monarch? (3) What habitats did we observe the Regal Fritillary and the Monarch in? (4) What variables predicted the most suitable habitat for Regal Fritillary and Monarch using SDM? We surveyed butterflies at 145 sites in eastern Wyoming, which is an ideal place to measure habitat use due to the abundance of rangeland and low human population. Our results provide information on butterflies of management concern to resource managers in areas where little is known about them.
2. Materials and Methods
2.1. Study Area
We surveyed adult butterflies in eastern Wyoming, USA, to assess the abundance and richness of these insects in areas that have not been previously surveyed. We visited 145 sites in 9 counties from mid-June to late August in 2019 and 2021 (Figure 1). The sites were selected throughout eastern Wyoming to sample a wide range of habitat types mainly on public lands. We considered areas with wet meadows, depressions, the presence of streams, gullies, and other locations with high densities of nectar-rich plants the best habitat for Regal Fritillaries and Monarchs. However, we searched wooded areas, mixed-grass prairies, sagebrush steppes, and other available habitats in eastern Wyoming to account for the nomadic nature of female Regal Fritillaries in late summer and encompass the full diversity of butterflies there. Regal Fritillaries are considered tall-grass prairie specialist; however, this habitat does not occur in Wyoming. Eastern Wyoming typically has 81–140 days that are frost-free annually [34]. Mean annual precipitation ranges between 15 and 64 cm, with most precipitation falling in May and June. Elevation of basin habitats in eastern Wyoming range between 952 and 2200 m.
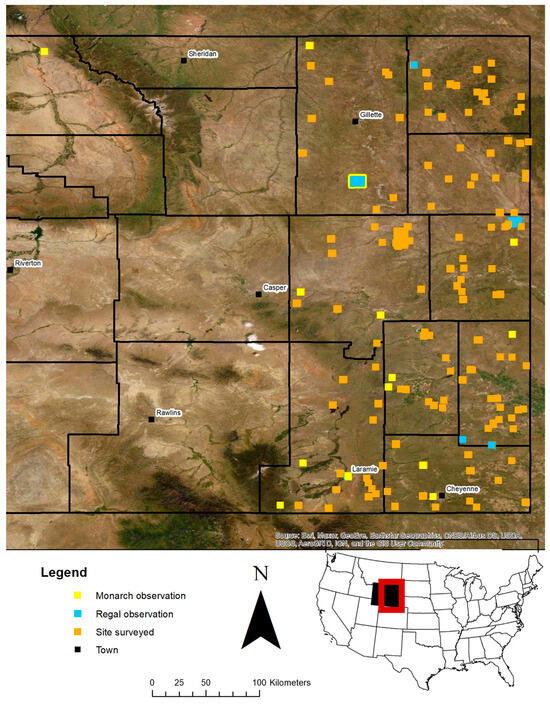
Figure 1.
We surveyed 145 sites, from mid-June to late August in 2019 and 2021, where two people walked independent transects. The locations of the 11 Regal Fritillaries at 9 sites and 31 Monarch butterflies at 22 sites are shown on the map. The inset map shows the location of Wyoming in the United States of America and the area we survey in the red frame.
2.2. Target Species
Male Regal Fritillaries emerge first in early summer and later mate with females who lay eggs in the autumn. Interestingly, adult females do not rely on the presence of their larval host plants, violets (Viola spp.), to lay eggs. Instead, Regal Fritillaries have high fecundity and lay > 2000 eggs per individual on the underside of leaves [35] increasing the chance that some emergent caterpillars will locate violets. Adult Regal Fritillaries prefer high densities of forbs and a diversity of flowering plants [36], gravitating towards areas with recent fires due to increased floral resources [37]. These butterflies generally avoid areas with bare ground; instead, they prefer land with more litter and lower grazing intensities [36]. Regal Fritillaries do not migrate (directional movement with distinct timing), but females are nomadic in late summer. Larvae hibernate in prairies with stable resources [19] from September to June [38].
Monarchs are well-known for migrating ≤ 3600 km from their summer breeding habitat to overwintering areas in southern Mexico, taking ~75 days to make the journey [39]. In fact, 3–5 generations of butterflies laying eggs along the route are needed to complete their annual migration [39]. In general, eastern inland Monarchs converge in Mexico each fall, and Monarchs on the East Coast migrate to Florida to overwinter [40]. On the other hand, most western populations move to southern California or congregate in Mexico to overwinter. The overwintering sites are much smaller than their summer habitat, but the overwintering sites must have sufficient nectar for initiating and completing migration when air temperatures begin to rise in the spring [41]. During the Monarch’s breeding and migration season, they require trees for roosting and Milkweed to lay eggs on.
2.3. Field Sampling
We walked transects to estimate the abundance and richness of butterflies among sites. Two observers walked independent transects to survey for all butterflies with an emphasis on Regal Fritillaries and Monarchs. The transect length was generally >1 km and >30 min. In 2019, we walked transects to record butterfly presence, and paused at the beginning, middle, and end of each transect to record floral data. In 2021, we divided transects into 2 parts; we counted butterflies during the first half and we measured floral data during the second half. Additionally, we watched for Monarchs and Regal Fritillaries during the second half of the surveys, but we did not count the butterfly assemblage during this time. We recorded the distance and time of each transect on a GPS unit. Butterflies visible within ~5 m of the observer were recorded at the family, subfamily, genus or species-level depending on the group. We target-netted a few individuals of each species for later identification, except for Monarchs and Regal Fritillaries, which were not collected. The collected specimens were spread and pinned for identification and used to estimate the richness of butterflies in eastern Wyoming [42].
We collected vegetation and environmental data to assess how site conditions influenced butterfly abundance and richness. In 2019, three vegetation quadrats (929 cm2) were recorded at three locations along one transect at each site (n = 9). The maximum height of grass and shrubs within each quadrat were measured, and we counted the number of blooms by species to estimate flower availability to pollinators. In 2021, one quadrat (1 m2) was recorded at the beginning, middle, and end of one transect at each site (n = 3). We visually estimated the percent cover of grass, shrubs, forbs, and bare ground in addition to grass and shrub height, and flower density. We also measured bloom diameter by species to estimate the surface area of flowers available to butterflies. We recorded land use as resource extraction (e.g., oil or timber), grazing (e.g., cow, sheep or horse), agriculture (i.e., farming), recreation, and roadsides. Air temperature and average wind speed were recorded using a shielded Kestrel 2000 at the beginning of each transect, and we visually estimated percent cloud cover during the transects.
2.4. Statistical Analysis
We estimated how habitat characteristics and atmospheric conditions altered the abundance and richness of butterflies using generalized linear models (glm). We analyzed butterfly counts and richness along each transect as response variables with an offset of track distance to account for different effort. We included the mean values for the number of blooms in 1 m2 quadrats, grass height, shrub height, wind speed, air temperature, cloud cover, the categorical variables current grazing, and land use as predictor variables. We divided the number of butterflies or richness of species encountered during a transect by the distance walked to standardize butterfly abundance (butterflies/km) and richness (species/km) for plots. We used a glm with a negative binomial distribution (glm.nb; [43]), because our data most closely matched this distribution. We used estimated marginal means (emmeans) to calculate differences among ≥3 levels of a categorical variable [44]. Our predictor variables were not correlated, and other model assumptions were met. We estimated the effects of percent cover classes and bloom surface area on butterfly abundance and richness from data recorded in 2021 only because we did not record these variables in 2019. Our data contained outliers; therefore, we used median-based linear regression mblm; [45] that is not influenced by outliers. Median-based linear regression only allows one predictor to be analyzed at a time and does not allow for offsets; therefore, we used butterflies/km or species/km as our response variables. We plotted butterfly abundance and richness against cover classes using trend lines and error based on means because calculations with medians are not available; thus, the relationship shown in plots is not what was calculated in the non-parametric regression analysis. We did not analyze the habitat characteristics of locations where Regal Fritillaries and Monarchs were observed because too few observations limited our analysis. We used the plyr [46] and tidyverse packages [47] to prepare our data for analyses.
2.5. Species Distribution Models
We used statewide historical and current observations of Regal Fritillary and Monarch to create SDM using Maximum Entropy (Maxent). Maxent models use locations where a species has been observed and are useful to predict suitable habitat for rare species [10]. We used 16 unique points to model the habitat of the Regal Fritillary and 70 unique points to model Monarch habitat. Historically, four observations of Regal Fritillary and 24 Monarch sightings were recorded in Wyoming before 2005 [32]. Due to recent Monarch sampling, 168 Monarchs have been observed in Wyoming since 2010 [33,48] in addition to the observations in our study. Ten thousand randomly selected locations across Wyoming were used as background sites. We created two ten-fold cross-validation models with 32 potential climatic and landscape predictors that we chose a priori based on our knowledge of the species and their life cycles (Table A3). Predictors for final models were chosen on overall contribution, jackknife contribution, and low correlation (R2 < 0.8). We binned the probability levels (p) into three equally interval and selection section with low (0 < p ≤ 0.31), medium (0.31 < p ≤ 0.69), or high (0.69 < p ≤ 1.0).
3. Results
3.1. Butterfly Surveys
In 2019, we conducted 166 surveys at 90 sites (Figure 1) that averaged 2.5 km (0.42 to 6.72 km; total of 408 km walked) in length and took 95 min on average (25 to 223 min; total of 647 h walked). In 2021, we performed 92 butterfly surveys at 55 sites that averaged 1.2 km (0.91 to 2.90 km; total of 149 km walked) in length and 30 min (23 to 78 min; total of 76 h walked). We recorded 14,760 butterflies, and an average of 90 butterflies/km (0 to 282) and six species (1 to 19) per survey in 2019. We observed 2226 butterflies, and an average of 30 butterflies/km (0 to 229) and three species (ranged from 1 to 7) per survey in 2021. Mean air temperature was 25 °C (5.1 to 39.2 °C) and mean wind speed was 5.5 km/h (0 to 22.5 km/h) during surveys.
Pieridae composed 50% of the butterflies (36% Sulphurs and 13% Whites) we encountered along transects, followed by Nymphalidae (21%), Lycaenidae (12%), Hesperiidae (4%), and Papilionidae (2%; Table A1 and Table A2). We identified 52 butterfly species and Nymphalidae (13 genera; 26 species) were the most specious, followed by Lycaenidae (4 genera; 9 species), Pieridae (4 genera; 7 species), Hesperiidae (5 genera; 6 species), and Papilionidae (2 genera; 4 species). The most commonly collected species were the Clouded Sulphur (Colias philodice), the Checkered White (Pontia protodice), and the Melissa Blue (Plebejus melissa). Olympia marble (Euchloe melissa), Mormon Fritillary (Speyeria mormonia), Hoary Comma (Polygonia gracilis), Sagebrush Checkerspot (Chlosyne acastrus), Acmon Blue (Plebejus acmon), Greenish Blue (Plebejus saepiolus), Silvery Blue (Glaucopsyche lygdamus), and Purplish Copper (Lycaena helloides) were collected once during the two years of surveys.
Habitat characteristics and land use varied among sites. Grass was present at all sites (Table 1), but 30% of sites lacked shrubs and 21% of sites lacked blooming flowers. Most sites were used for grazing (83%), followed by recreation (10%), farming (4%), roadsides (2%), and resource extraction (1%). In 2021, sagebrush steppe was the most surveyed habitat (68%), followed by grassland (26%) and riparian (4%).

Table 1.
The range of habitat characteristics measured among all sampled sites where Regal Fritillaries were observed and where we encountered Monarch butterflies.
Butterfly abundance varied by some habitat characteristics and site conditions. We observed marginally more butterflies in areas with higher densities of blooming flowers (glm; df = 153, z = 1.9, p = 0.057; Figure 2a), but we did not observed differences in butterfly abundance with grazing status (glm; z = 1.5, p = 0.14). We counted fewer individuals on land used for recreation compared to agriculture and grazing (glm, z = −1.4 to −2.4, p = 0.01 to 0.15; emmeans, p = 0.01; Figure 2b). Butterfly abundance did not respond to grass height (glm; z = 0.87, p = 0.38) or shrub height (glm; z = 1.3, p = 0.18). We counted more butterflies at lower wind speeds (glm; z = −3.1, p = 0.002; Figure 2c), but air temperature (glm; z = −1.1, p = 0.27) and cloud cover (glm; z = −1.3, p = 0.20) did not alter their abundance. Bloom surface area explained little variance in butterfly abundance (mblm; df = 51, p = 0.17), but we observed more butterflies at sites with higher forb cover (mblm; V = 566,911, p < 0.001; Figure 2d), lower cover of shrubs (mblm; V = 310,372, p = 0.002; Figure 2e), lower cover of grass (mblm; V = 418,630, p = 0.02; Figure 2f), and less bare ground (mblm; V = 392,719, p = 0.0004; Figure 2g).
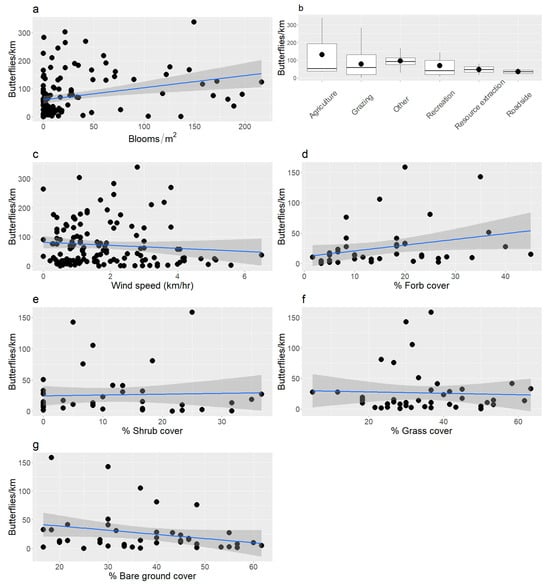
Figure 2.
(a) Butterfly abundance was positively related to bloom density, and (b) sites used for recreation had lower abundance than land used for agriculture and grazing. (c) We observed more butterflies at lower wind speeds. (d) The cover of forbs was positively related to butterfly abundance, and the cover of (e) shrubs, (f) grass, and (g) bare ground were negatively related to butterfly abundance. Blue lines were calculated from least squares regression and grey areas around lines are 95% confidence intervals. Note that the relationships between cover classes and butterfly abundance were plotted as means, but the statistics were based on medians.
Butterfly richness also varied by some habitat characteristics and site conditions. We did not observe a difference in species richness along a gradient of flower density (glm; df = 116, z = −1.0, p = 0.32); however, we observed more species in areas with taller grass (glm; z = 2.9, p = 0.005; Figure 3a) and fewer species in area with taller shrubs (glm; z = −4.1, p < 0.001; Figure 3b). We did not observe differences in butterfly abundance with grazing status (glm; z = 0.7, p = 0.50), but we counted more individuals on land used for agriculture compared to land used for grazing and recreation (glm, z = −1.0 to −2.9, p = 0.02 to 0.30; emmeans, p < 0.03; Figure 3c). We counted more butterflies at lower wind speeds (glm; z = −4.0, p < 0.001; Figure 3d), but air temperature (glm; z = 1.1, p = 0.27) and cloud cover (glm; z = −0.9, p = 0.37) did not alter their richness. We observed more butterfly species in areas with a larger surface area of blooms (mblm; df = 29, V = 356 p = 0.03; Figure 3e). Higher forb cover (mblm; V = 67,901, p < 0.001; Figure 3f) and lower cover of bare ground (mblm; V = 42,686, p = 0.007; Figure 3g) were related to more butterfly species, but shrub (mblm; V = 42,455, p = 0.82) and grass cover (mblm; V = 48,506, p = 0.47) were not related to butterfly richness.
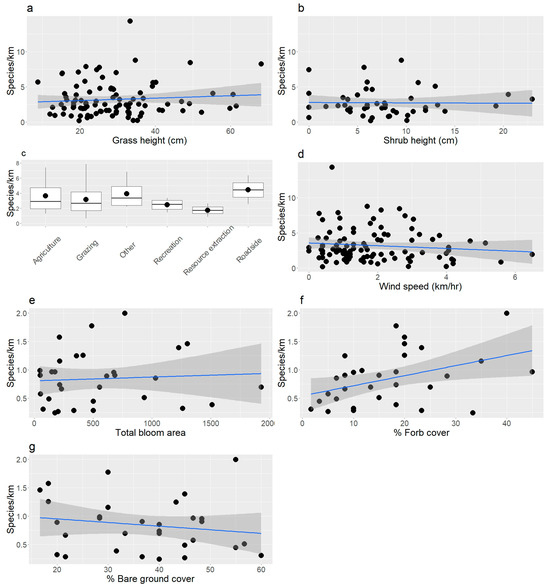
Figure 3.
The richness of butterflies was positively associated with (a) grass and (b) shrub height. (c) We observed more butterflies in agricultural lands compared to land used for grazing and recreation. (d) Higher wind speeds reduced the number of species we observed. (e) Higher surface area of blooms was related to higher richness of butterflies. (f) We observed more butterfly species in areas with higher forb cover and (g) a lower proportion of bare ground. Blue lines were calculated from least squares regression and grey areas around lines are 95% confidence intervals. Note that the relationships between cover classes and butterfly richness were plotted as means, but the statistics were based on medians.
We observed seven Regal Fritillaries at six sites in 2019, and four individuals at three sites in 2021 (Table 1). The butterfly was present in five counties, spanning from the northern to southern boundaries of eastern Wyoming and ~180 km west of the South Dakota and Nebraska borders (Figure 1). Twenty-five percent of the sites we observed with Regal Fritillaries lacked blooming flowers. In general, we observed Regal Fritillaries at sites with low to moderate grass and shrub height and bloom density. We observed 26 Monarchs at 17 sites in 2019, and 5 Monarchs at 5 sites in 2021 in 9 counties (Figure 1). We observed Monarchs at sites with moderate grass height and low to moderate shrub height and flower density (Table 1). Regal Fritillaries and Monarchs were primarily observed on land used for grazing which is a dominate land use in eastern Wyoming.
3.2. Predicting Suitable Habitat for Regal Fritillary and Monarchs
The Regal Fritillary SDM fit well (area under the curve = 0.91; Figure 4a) and predicted that suitable habitat was most affected by mean temperature of the wettest quarter (64.6% contribution), precipitation of the warmest quarter (15.4%), sagebrush cover (7.3%), herbaceous cover (4.8%), forest cover (3.6%), mean temperature of the coldest quarter (1.8%), precipitation of the coldest quarter (1.2%), precipitation seasonality (0.9%), and minimum temperature of the coldest month (0.4%; Figure 4a). Specifically, the Regal Fritillary habitat coincided with warmer and wetter weather throughout the year. Regal Fritillary is predicted to occur in areas with high herbaceous cover, and low forest and sagebrush cover. Areas in which the model predicted the most suitable habitat occurred in sagebrush steppe and grasslands.
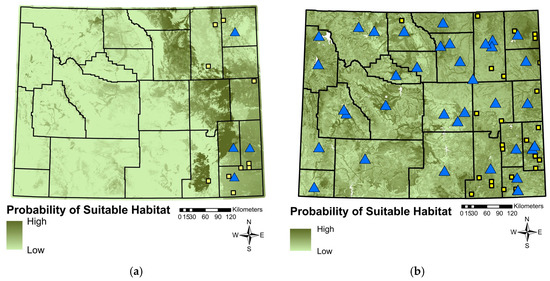
Figure 4.
The habitat suitability for (a) Regal Fritillaries and (b) Monarchs, generated by a species distribution modeling created using Maximum Entropy. The blue triangles represent historical observations (before 2005) and the yellow squares visualize current sightings (2005–2021).
The Monarch SDM fit satisfactory (area under the curve = 0.71; Figure 4b) and predicted that suitable habitat was most affected by sagebrush cover (29.3% contribution), precipitation seasonality (13.2%), mean temperature of the wettest quarter (11.9%), forest cover (9.8%), mean temperature (7.4%), precipitation of the wettest month (5%), number of frost days (5%), herbaceous cover (4.9%), habitat heterogeneity (2.7%), topographic position index (31-cell focal window; 2.5%), organic soil matter (2.3%), mean temperature of the driest quarter (2%), annual precipitation (1.7%), distance to water (1.6%), isothermy (0.4%), and mean temperature of the coldest quarter (0.4%; Figure 4b). Generally, our models predicted that habitat with low sagebrush cover, shorter distance to water, and high forest and herbaceous cover increased the suitability of habitat for Monarchs. Warmer and wetter areas coincided with higher predicted habitat suitability for Monarchs. Much of Wyoming is predicted to be suitable habitat, and the habitats include sagebrush steppe, prairie, forest, and riparian areas.
4. Discussion
We discovered Regal Fritillaries using eastern Wyoming during both years of sampling; however, this area is typically not considered part of their range. Sampling species at the edge of their range is critical because that is where species persist after range contractions [49]. A study tested the paradigm that 245 species contracted to the core of their range where habitat is assumed to be most suitable. However, the results showed that these species persisted at the edge of their range where their abundance is lower, habitat is poorer and more fragmented, and immigration is low. We investigated Regal Fritillaries at the western edge of their range (e.g., [42]) and discovered a low abundance of individuals. Regal Fritillaries use eastern Wyoming despite the lack of tallgrass prairie ecosystems and likely poorer habitat for them; however, current abundances are higher east of the Wyoming boarder in the Midwest. On the other hand, Monarchs occur across most of the US, but eastern and western populations are likely split by the Rocky Mountains. We do not know the degree to which individuals intermix between populations in this region. The Rocky Mountain states may act as periphery habitat, as Monarchs have much lower abundances and parasite loads in this area compared to their core range [29]. Overall, Regal Fritillary and Monarch populations overlapped in eastern Wyoming, and Monarchs were nearly 3 times more abundant than Regal Fritillaries. Monitoring declining species at the periphery of their range is critical to their persistence.
Species distribution models predict suitable habitat from a limited number of observations which can be informative for infrequently observed species [50]. Such models should not be interpreted as the species range; SDM predict areas with similar habitat to where the species was observed. The SDM for Regal Fritillary coincided with the lack of forest and sagebrush cover, and the presence of herbaceous cover. Other studies in the midwestern US reported that Regal Fritillary abundance was positively associated with forbs [21,36] and negatively related to shrub cover [36,51], similar to the predictions of our SDM. Our SDM predicted that Monarch occurrences coincided with decreased habitat heterogeneity and distance to water, and increased organic soil matter, and forest, herbaceous, and sagebrush cover. The model fit was poorer for the Monarch SDM, and we suspect that this was due to observations in a variety of habitats because they migrate. Habitat suitability did not vary greatly across the state, and streams were highlighted perhaps due to more floral resources in the semi-arid landscape of Wyoming.
Species distribution models are frequently created across a species range using climatic variables only; however, SDM produced at smaller spatial scales are also useful. The habitat occupied by a species can vary across their range [49] allowing SDM constructed at local or regional scales to identify unique habitat selection [52,53]. Such models can be the first to detect species declines in a portion of their range [54,55,56,57]. Political boarders are not usually critical to the species, but they can be vital to conservation efforts. Climatic variables are commonly used to model suitable habitat across the range of species, probably because these variables are available across larger areas [55,58]. However, landscape variables can contribute substantially to models. Climatic variables contributed more to the Regal Fritillary model than landscape variables in our study primarily due to the high contribution of mean temperature of the wettest quarter. Conversely, climatic and landscape variables contributed nearly equally to the Monarch SDM. Landscape variables are much easier to incorporate into local and regional models due to the scale of the project and the availability of such data within smaller areas (e.g., states).
Reports of Regal Fritillary associations with their host plant vary from not dependent [19,35,38] to completely reliant [36]. Regal Fritillaries were reported to be more reliant on large tracts of grasslands and topographic diversity, e.g., dry mesic grassland and wet mesic grassland [19] than their host plant, but the top predictors of Regal Fritillary habitat in a random forest model were the presence of violets, percent forb cover, climatic variables, and habitat isolation (distance/permeability; [36,59]). The presence of Regal Fritillaries has also been related to flower density and the cover of grass [60]. Characteristics of locations where Regal Fritillaries were observed did not differ between low and high quality habitat [61]. Our model also predicted that higher cover of herbaceous plants increased habitat suitability. In Wyoming, we observed this butterfly near late- and long-blooming plants, such as sweet clover (Melilotus officinalis), thistle (Cirsium, Onopordum, and Carduus sp.), and alfalfa (Medicago sativa). Regal Fritillaries can feed on nectar from a variety of plants, and thistles and milkweed were the mostly commonly used nectar sources [18]. Larval host plants can often predict the presence of butterfly species with diet restrictions, low mobility or habitat specialization [62]; however, Regal Fritillaries do not lay eggs on violets and we never observed them together. This may in part be due to Wyoming’s extensive rangelands that are classified as short-grass prairie. All our sightings of Regal Fritillaries were in August, when fewer forbs were flowering and nectar was likely scarce. While most Regal Fritillary populations peak in July [63], we observed more Regal Fritillaries in August, when females are highly nomadic and travel through habitats with limited resources [38]. Additionally, Wyoming has the second-highest mean elevation of any state in the United States (2040 m), which may alter the Regal Fritillary’s life cycle [64].
Monarch habitat is primarily explained by the presence of milkweeds (e.g., [25,26,65]); however, we only observed Monarchs with milkweeds at 10% of the sites. Milkweeds grow in many habitats, including rangeland, agricultural areas, wetlands, prairies, meadows, open-forests, woodlands, and along roadsides [31,66]. Thirteen species and >1000 occurrences of milkweed have been documented in eastern Wyoming (Rocky Mountain [67]), offering opportunities for Monarchs to lay eggs and travel across the state. Our infrequent sightings of Monarchs with milkweeds may be due to migrating. Our SDM predicted that increased herbaceous cover indicated suitable habitat, perhaps because these areas have more nectar resources which they require for migration [41]. We observed Monarchs near sweet clover, alfalfa, gumweed (Grindelia sp.), and sunflowers (Helianthus spp. and Helianthella spp.), which were likely nectar resources. Butterflies and nectar resources are positively related [62], as we also observed. Higher cover of forbs was associated with higher abundance and richness of butterflies probably because this variable indicates the presence of flowering plants. Consequently, increases in the cover of shrub, grass and bare ground limited the cover of forbs. Conversely, Monarchs are specialists because they only lay eggs on milkweeds and primarily feed on milkweed as caterpillars. Therefore, the presence of Monarchs is usually associated with these plants [68]; however, adults can use nectar from a variety of blooming plants. The abundance and richness of butterflies in Wyoming may be heavily dependent on the presence of adequate floral resources, and Wyoming’s abundant grasslands may provide many nectar resources.
In our study, ~70% of Regal Fritillary and Monarch observations were on lands used for livestock grazing. Previous studies reported positive [69], neutral [51], and negative [21,70] effects of grazing on Regal Fritillary and Monarch abundance. The various effects of grazing on grasslands are well-studied (e.g., [71,72,73]) and depend on many variables, such as productivity (e.g., [74]), livestock species (e.g., [75]), timing (e.g., [76]), and intensity (e.g., [71,77,78]). In general, butterflies are often more abundant and diverse in areas with more flowers (e.g., [79,80]), and grazing can increase forb abundance in some situations [81]. Most sites were on public lands with some degree of grazing, but very few were grazed intensely (M. Mazur, personal observation). Well-managed rangelands may offer suitable habitat for Regal Fritillary and Monarch butterflies.
Butterflies prefer mild weather conditions [82] and are known to be sensitive to weather and climate conditions [83]. We sampled during a variety of weather conditions and observed fewer butterfly species at higher wind speeds, as has been reported in other areas [83]. Wyoming is the fourth windiest state in the US (mean 9.3 m/s), so surveying at low wind speeds can be difficult. Larger butterflies, such as Fritillaries, are probably most affected by the wind due to their larger wingspan. Cloud coverage can reduce butterfly flight [84], but we did not observe a relationship between cloud cover and butterfly abundance and richness. Butterflies are typically more active and fly longer distances at warmer temperatures [84,85]; however, butterfly abundance and temperature were not related within the range of temperatures we measured.
Butterflies have infrequently been surveyed in eastern Wyoming, and historical data are lacking. A literature review revealed eight journal articles that reported information on butterflies in Wyoming (Web of Science, searched Wyoming and butterfl* or Lepidoptera; accessed on 28 February 2025). Of these articles, four focused on genetics, and all examined either one or two species in mountain habitats [86,87,88,89,90,91,92,93]. More baseline information on the butterfly communities of prairie habitats is needed to assess future change.
5. Conclusions
Some previously widespread and abundant pollinators are declining [94,95]. Species are assumed to have a higher extinction risk when they are specialists, occupy a small area, are infrequently encountered, or live in restricted habitats [96,97]; therefore, the loss of endemic or rare species is predicted based on their biology. Conversely, the loss of widespread species is concerning and suggests that large-scale factors are affecting them, such as the loss of habitat, floral resources, disease, and an altered climate [3,6,7,98,99]. The loss of pollinators will affect other trophic levels due to connections within food webs. For example, pollinators and the plants they depend on are declining synchronously in Europe [100]. We expect that the loss of pollinators will alter the vertebrate animals that depend on the forbs and shrubs they maintain through pollination. Managing declining species requires considering the entire ecosystem from soil, plants, insects and vertebrate animals. Resilient populations of pollinators need robust ecosystems to thrive in. Recent studies have stressed managing pollinators and plant communities in unison [96,101]. We suggest studying ecosystems as a whole to understand connections and better manage declining species that were once widespread and common.
Author Contributions
Conceptualization, M.M. and L.M.T.; methodology, M.M. and L.M.T.; formal analysis, M.M. and C.B.; investigation, M.M. and Z.S.; resources, L.M.T.; data curation, M.M.; writing—original draft preparation, M.M. and L.M.T.; writing—review and editing, M.M., Z.S., C.B. and L.M.T.; visualization, M.M. and C.B.; supervision, L.M.T.; project administration, L.M.T.; funding acquisition, L.M.T. All authors have read and agreed to the published version of the manuscript.
Funding
This research was funded by the Wyoming Governor’s Office.
Data Availability Statement
Some data are available in Appendix A. Due to data sensitivity, the data are available upon request through the Wyoming Natural Diversity Database, University of Wyoming. https://www.uwyo.edu/wyndd/index.html. accessed on 27 February 2025.
Acknowledgments
We would like to thank Kamaile DeLong, Ryan Burns, Bryan Tronstad, Tresize Tronstad, Joy Handley, Tighe Jones, and Katrina Cook for performing butterfly surveys and pinning specimens. Carlos Martinez Del Rio, Ken Gerow, Kamaile DeLong, and Katrina Cook provided comments that improved this work. Finally, we thank private landowners for allowing us to survey on their lands making this study possible.
Conflicts of Interest
The authors declare no conflicts of interest. The funders had no role in the design of the study, in the collection, analyses, or interpretation of data, in the writing of the manuscript, or in the decision to publish the results.
Abbreviations
The following abbreviations are used in this manuscript:
| SDM | Species Distribution Model |
| US | United States of America |
| MaxEnt | Maximum Entropy |
Appendix A
Table A1.
Number of butterflies collected in eastern Wyoming from mid-June through August 2019 and 2021. We surveyed 145 sites and walked 557 km of transects.
Table A1.
Number of butterflies collected in eastern Wyoming from mid-June through August 2019 and 2021. We surveyed 145 sites and walked 557 km of transects.
| Taxa | Total |
|---|---|
| Nymphalidae | 478 |
| Argynnis idalia | 11 (not collected) |
| Aglais milberti | 2 |
| Cercyonis oetus | 15 |
| Cercyonis pegala | 74 |
| Chlosyne acastus | 1 |
| Chlosyne gorgone | 25 |
| Coenonympha tullia | 18 |
| Erebia epipsodea | 5 |
| Euphydryas anicia | 13 |
| Euphydryas chalcedona | 4 |
| Euptoieta claudia | 60 |
| Danaus plexippus | 31 (not collected) |
| Neominois ridingsii | 4 |
| Oeneis uhleri | 2 |
| Phyciodes cocyta | 16 |
| Phyciodes pulchella | 3 |
| Phyciodes tharos | 94 |
| Polygonia gracilis | 1 |
| Speyeria aphrodite | 1 |
| Speyeria coronis | 1 |
| Speyeria cybele | 3 |
| Speyeria hesperis | 1 |
| Speyeria aphrodite | 24 |
| Speyeria callippe | 10 |
| Speyeria coronis | 6 |
| Speyeria cybele | 2 |
| Speyeria edwardsii | 18 |
| Speyeria hesperis | 24 |
| Speyeria mormonia | 1 |
| Vanessa atalanta | 2 |
| Vanessa cardui | 42 |
| Vanessa virginiensis | 6 |
| Pieridae | 547 |
| Colias alexandra | 11 |
| Colias eurytheme | 81 |
| Colias philodice | 286 |
| Euchloe olympia | 1 |
| Pieris rapae | 10 |
| Pontia protodice | 11 |
| Pontia occidentalis | 5 |
| Pontia protodice | 142 |
| Lycaenidae | 188 |
| Glaucopsyche lygdamus | 1 |
| Lycaena dione | 5 |
| Lycaena helloides | 2 |
| Lycaena hyllus | 7 |
| Plebejus acmon | 5 |
| Plebejus icarioides | 21 |
| Plebejus melissa | 140 |
| Plebejus saepiolus | 1 |
| Strymon melinus | 6 |
| Hesperidae | 100 |
| Atalopedes campestris | 5 |
| Epargyreus clarus | 2 |
| Hesperia juba | 3 |
| Hesperia uncas | 4 |
| Pholisora catullus | 12 |
| Pyrgus communis | 74 |
| Papilionidae | 26 |
| Papilio eurymedon | 3 |
| Papilio polyxenes | 2 |
| Papilio rutulus | 4 |
| Parnassius smintheus | 17 |
| TOTAL | 1339 |
Table A2.
Number of butterflies observed at each site in 2019 and 2021. Butterfly groupings include Nymphalidae, Regal Fritilaries (Argynnis idalia), Monarchs (Danaus plexippus), Pieridae, Lycaenidae, Hesperiidae, Papilionidae and total count.
Table A2.
Number of butterflies observed at each site in 2019 and 2021. Butterfly groupings include Nymphalidae, Regal Fritilaries (Argynnis idalia), Monarchs (Danaus plexippus), Pieridae, Lycaenidae, Hesperiidae, Papilionidae and total count.
| Site ID | Date | Nymph. | Regal. | Mon. | Pier. | Lyc. | Hesp. | Pap. | Total |
|---|---|---|---|---|---|---|---|---|---|
| 219 | 27-August-2019 | 1 | 0 | 0 | 46 | 3 | 4 | 0 | 54 |
| 219 | 27-August-2019 | 1 | 0 | 0 | 67 | 6 | 4 | 0 | 78 |
| 450EofBeaverCreek | 15-August-2019 | 1 | 0 | 0 | 132 | 0 | 11 | 0 | 144 |
| 450EofBeaverCreek | 15-August-2019 | 1 | 0 | 0 | 289 | 1 | 0 | 0 | 291 |
| BH1 | 24-July-2019 | 81 | 0 | 0 | 78 | 19 | 0 | 7 | 185 |
| BH1 | 24-July-2019 | 131 | 0 | 0 | 33 | 12 | 0 | 0 | 176 |
| BH2 | 24-July-2019 | 15 | 0 | 0 | 3 | 2 | 0 | 0 | 20 |
| BH2 | 24-July-2019 | 8 | 0 | 0 | 5 | 0 | 0 | 0 | 13 |
| BH3 | 25-July-2019 | 67 | 0 | 0 | 53 | 6 | 0 | 4 | 130 |
| BH3 | 25-July-2019 | 85 | 0 | 0 | 75 | 4 | 0 | 4 | 168 |
| BH4 | 25-July-2019 | 38 | 0 | 0 | 27 | 10 | 0 | 3 | 78 |
| BH4 | 25-July-2019 | 79 | 0 | 0 | 31 | 12 | 12 | 0 | 134 |
| BH5 | 26-July-2019 | 217 | 0 | 1 | 77 | 0 | 0 | 3 | 297 |
| BH5 | 26-July-2019 | 154 | 0 | 2 | 52 | 7 | 0 | 0 | 213 |
| BH6 | 28-July-2019 | 138 | 0 | 0 | 47 | 1 | 0 | 0 | 186 |
| BHBLM1 | 27-July-2019 | 52 | 0 | 1 | 4 | 3 | 0 | 0 | 59 |
| BHBLM1 | 27-July-2019 | 155 | 0 | 1 | 15 | 1 | 3 | 0 | 174 |
| BorderBLM | 16-August-2019 | 5 | 0 | 0 | 92 | 2 | 0 | 0 | 99 |
| BorderBLM | 16-August-2019 | 7 | 0 | 1 | 26 | 7 | 1 | 0 | 41 |
| CastleCreek | 15-August-2019 | 0 | 0 | 0 | 0 | 0 | 0 | 0 | 0 |
| CastleCreek | 15-August-2019 | 0 | 0 | 0 | 0 | 0 | 1 | 0 | 1 |
| CGSP001 | 9-July-2019 | 80 | 0 | 0 | 24 | 12 | 8 | 0 | 124 |
| CGSP001 | 9-July-2019 | 20 | 0 | 1 | 45 | 10 | 5 | 2 | 82 |
| CGW1 | 28-August-2019 | 9 | 0 | 0 | 109 | 8 | 13 | 0 | 139 |
| CGW1 | 28-August-2019 | 22 | 0 | 0 | 59 | 15 | 61 | 0 | 157 |
| CGW10 | 29-August-2019 | 0 | 0 | 0 | 43 | 0 | 0 | 0 | 43 |
| CGW10 | 29-August-2019 | 3 | 0 | 0 | 15 | 2 | 0 | 0 | 20 |
| CGW11 | 29-August-2019 | 0 | 0 | 0 | 175 | 0 | 6 | 0 | 181 |
| CGW11 | 29-August-2019 | 47 | 0 | 2 | 136 | 0 | 8 | 0 | 191 |
| CGW12 | 30-August-2019 | 1 | 0 | 0 | 70 | 0 | 33 | 0 | 104 |
| CGW12 | 30-August-2019 | 1 | 0 | 0 | 15 | 0 | 9 | 0 | 25 |
| CGW13 | 30-August-2019 | 0 | 0 | 0 | 25 | 0 | 0 | 0 | 25 |
| CGW13 | 30-August-2019 | 4 | 0 | 0 | 17 | 0 | 1 | 0 | 22 |
| CGW14 | 29-August-2019 | 9 | 0 | 0 | 69 | 0 | 2 | 0 | 80 |
| CGW14 | 29-August-2019 | 23 | 0 | 0 | 63 | 0 | 2 | 0 | 88 |
| CGW16 | 30-August-2019 | 1 | 1 | 0 | 36 | 0 | 2 | 0 | 39 |
| CGW16 | 30-August-2019 | 1 | 0 | 0 | 26 | 0 | 4 | 0 | 31 |
| CGW2 | 28-August-2019 | 16 | 0 | 0 | 13 | 0 | 8 | 0 | 37 |
| CGW2 | 28-August-2019 | 23 | 0 | 0 | 5 | 2 | 28 | 0 | 58 |
| CGW3 | 28-August-2019 | 17 | 0 | 0 | 58 | 0 | 3 | 0 | 78 |
| CGW3 | 28-August-2019 | 7 | 0 | 0 | 33 | 0 | 10 | 0 | 50 |
| Chey_01 | 24-June-2021 | 2 | 0 | 0 | 2 | 3 | 0 | 6 | 13 |
| Chey_03 | 27-August-2021 | 8 | 1 | 0 | 19 | 10 | 3 | 0 | 40 |
| Chey_03 | 27-August-2021 | 1 | 0 | 1 | 6 | 7 | 3 | 0 | 17 |
| Chey_04 | 23-August-2021 | 6 | 0 | 0 | 2 | 5 | 10 | 0 | 23 |
| Chey_04 | 23-August-2021 | 0 | 0 | 0 | 0 | 3 | 0 | 0 | 3 |
| Chey_06 | 6-July-2021 | 4 | 0 | 0 | 7 | 0 | 0 | 0 | 11 |
| Chey_06 | 6-July-2021 | 3 | 0 | 0 | 3 | 0 | 1 | 0 | 7 |
| Chey_06a | 23-August-2021 | 1 | 0 | 0 | 6 | 9 | 17 | 0 | 33 |
| Chey_06a | 23-August-2021 | 3 | 0 | 0 | 4 | 2 | 6 | 0 | 15 |
| Chey_07 | 6-July-2021 | 3 | 0 | 0 | 0 | 0 | 0 | 0 | 3 |
| Chey_07 | 6-July-2021 | 0 | 0 | 0 | 0 | 0 | 0 | 0 | 0 |
| Chey_08 | 1-July-2021 | 3 | 0 | 0 | 1 | 4 | 0 | 10 | 18 |
| Chey_08 | 1-July-2021 | 6 | 0 | 0 | 0 | 0 | 1 | 13 | 20 |
| Chug_02 | 17-August-2021 | 0 | 1 | 0 | 10 | 0 | 0 | 0 | 10 |
| Chug_02 | 17-August-2021 | 0 | 1 | 0 | 9 | 7 | 2 | 0 | 18 |
| Chug_03 | 27-August-2021 | 2 | 0 | 0 | 0 | 0 | 0 | 0 | 2 |
| Chug_03 | 27-August-2021 | 1 | 0 | 0 | 0 | 0 | 0 | 0 | 1 |
| CW1 | 1-July-2019 | 17 | 0 | 0 | 59 | 20 | 5 | 0 | 101 |
| CW10 | 2-July-2019 | 19 | 0 | 0 | 15 | 5 | 5 | 2 | 46 |
| CW14 | 5-July-2019 | 3 | 0 | 0 | 13 | 0 | 3 | 0 | 19 |
| CW4 | 2-July-2019 | 21 | 0 | 0 | 25 | 1 | 8 | 0 | 55 |
| DT1 | 28-July-2019 | 73 | 0 | 0 | 5 | 0 | 0 | 0 | 78 |
| DT1 | 28-July-2019 | 81 | 0 | 0 | 16 | 0 | 2 | 0 | 99 |
| DT2 | 29-July-2019 | 108 | 0 | 0 | 7 | 1 | 0 | 0 | 116 |
| DT2 | 29-July-2019 | 117 | 0 | 3 | 18 | 1 | 6 | 0 | 142 |
| DurhamRanch1 | 22-August-2019 | 9 | 1 | 1 | 174 | 35 | 3 | 0 | 221 |
| DurhamRanch1 | 22-August-2019 | 7 | 0 | 2 | 261 | 9 | 2 | 0 | 279 |
| DurhamRanch2 | 22-August-2019 | 4 | 0 | 0 | 95 | 74 | 2 | 0 | 175 |
| DurhamRanch2 | 22-August-2019 | 0 | 0 | 2 | 33 | 5 | 0 | 0 | 38 |
| Fairview | 14-August-2019 | 0 | 0 | 0 | 98 | 1 | 34 | 0 | 133 |
| Fairview | 14-August-2019 | 3 | 0 | 0 | 112 | 7 | 2 | 0 | 124 |
| FL001 | 26-June-2019 | 0 | 0 | 0 | 22 | 1 | 0 | 0 | 23 |
| FL001 | 26-June-2019 | 8 | 0 | 0 | 30 | 2 | 0 | 0 | 40 |
| FortLaramie | 22-August-2019 | 0 | 0 | 0 | 13 | 0 | 1 | 0 | 14 |
| FortLaramie | 22-August-2019 | 0 | 0 | 1 | 12 | 0 | 1 | 0 | 13 |
| FortLaramie2 | 23-August-2019 | 5 | 0 | 0 | 18 | 0 | 7 | 0 | 30 |
| FortLaramie2 | 23-August-2019 | 0 | 0 | 1 | 47 | 0 | 0 | 0 | 47 |
| FosterRoad | 27-August-2019 | 0 | 0 | 0 | 1 | 0 | 0 | 0 | 1 |
| FosterRoad | 27-August-2019 | 0 | 0 | 0 | 0 | 0 | 1 | 0 | 1 |
| Gill_02 | 27-July-2021 | 5 | 0 | 0 | 14 | 3 | 0 | 0 | 22 |
| Gill_05 | 9-August-2021 | 0 | 0 | 0 | 3 | 0 | 0 | 0 | 3 |
| Gill_05 | 9-August-2021 | 1 | 0 | 0 | 6 | 7 | 0 | 0 | 14 |
| Gill_06 | 9-August-2021 | 0 | 0 | 0 | 10 | 2 | 0 | 0 | 12 |
| Gill_06 | 9-August-2021 | 0 | 0 | 0 | 5 | 0 | 0 | 0 | 5 |
| Glen_01 | 22-July-2021 | 0 | 0 | 0 | 0 | 0 | 0 | 0 | 0 |
| Glen_01 | 22-July-2021 | 0 | 0 | 0 | 0 | 0 | 0 | 0 | 0 |
| Glenr-01 | 15-July-2021 | 25 | 0 | 0 | 64 | 7 | 0 | 0 | 96 |
| Glenr-01 | 15-July-2021 | 21 | 0 | 0 | 55 | 1 | 0 | 1 | 78 |
| Glenr-02 | 15-July-2021 | 2 | 0 | 0 | 3 | 0 | 0 | 0 | 5 |
| Glenr-02 | 15-July-2021 | 1 | 0 | 1 | 7 | 1 | 0 | 0 | 9 |
| Glenr-06 | 15-July-2021 | 34 | 0 | 0 | 130 | 0 | 0 | 1 | 165 |
| Glenr-06 | 15-July-2021 | 28 | 0 | 0 | 44 | 3 | 0 | 0 | 75 |
| GLSP001 | 11-July-2019 | 10 | 0 | 0 | 5 | 3 | 0 | 0 | 18 |
| GLSP001 | 11-July-2019 | 13 | 0 | 0 | 4 | 0 | 0 | 0 | 17 |
| GLSP002 | 11-July-2019 | 27 | 0 | 0 | 9 | 2 | 20 | 0 | 58 |
| GLSP002 | 11-July-2019 | 34 | 0 | 0 | 5 | 4 | 0 | 0 | 43 |
| Grieves | 14-August-2019 | 15 | 0 | 0 | 25 | 3 | 1 | 0 | 44 |
| Grieves | 14-August-2019 | 2 | 0 | 0 | 35 | 2 | 0 | 0 | 39 |
| GSP001 | 26-June-2019 | 0 | 0 | 0 | 2 | 13 | 9 | 1 | 25 |
| GSP001 | 26-June-2019 | 13 | 0 | 0 | 9 | 18 | 2 | 0 | 42 |
| HJ001 | 8-July-2019 | 25 | 0 | 0 | 25 | 18 | 13 | 2 | 83 |
| HJ001 | 8-July-2019 | 35 | 0 | 0 | 8 | 20 | 15 | 7 | 85 |
| HJ002 | 8-July-2019 | 7 | 0 | 0 | 42 | 15 | 4 | 2 | 70 |
| HJ002 | 8-July-2019 | 34 | 0 | 0 | 35 | 20 | 15 | 0 | 104 |
| HJ003 | 9-July-2019 | 3 | 0 | 0 | 42 | 20 | 3 | 2 | 70 |
| HJ003 | 9-July-2019 | 75 | 0 | 0 | 4 | 0 | 6 | 53 | 138 |
| HJ004 | 9-July-2019 | 10 | 0 | 0 | 105 | 10 | 0 | 0 | 125 |
| HJ004 | 9-July-2019 | 24 | 0 | 0 | 4 | 2 | 3 | 115 | 148 |
| Howard | 15-August-2019 | 1 | 0 | 0 | 152 | 7 | 0 | 0 | 160 |
| Howard | 15-August-2019 | 0 | 0 | 0 | 28 | 4 | 7 | 0 | 39 |
| Hul_03 | 28-July-2021 | 10 | 0 | 0 | 0 | 0 | 0 | 0 | 10 |
| Hul_04 | 28-July-2021 | 69 | 0 | 0 | 6 | 5 | 0 | 0 | 80 |
| Hul_05 | 28-July-2021 | 2 | 0 | 0 | 0 | 2 | 0 | 0 | 4 |
| Hul_06 | 11-August-2021 | 0 | 0 | 0 | 0 | 1 | 0 | 0 | 1 |
| Hul_06 | 11-August-2021 | 0 | 0 | 0 | 17 | 1 | 0 | 0 | 18 |
| Hul_07 | 11-August-2021 | 0 | 0 | 0 | 19 | 1 | 0 | 0 | 20 |
| Hul_07 | 11-August-2021 | 0 | 0 | 0 | 0 | 0 | 0 | 0 | 0 |
| Hul_08 | 11-August-2021 | 0 | 0 | 0 | 10 | 5 | 0 | 0 | 15 |
| Hul_08 | 11-August-2021 | 2 | 1 | 0 | 28 | 1 | 0 | 0 | 31 |
| HWY223 | 27-August-2019 | 1 | 0 | 0 | 26 | 17 | 2 | 0 | 46 |
| HWY223 | 27-August-2019 | 3 | 2 | 0 | 21 | 55 | 3 | 0 | 82 |
| Key_01 | 27-July-2021 | 0 | 0 | 0 | 2 | 0 | 0 | 0 | 2 |
| KeyholeWest | 12-August-2019 | 1 | 0 | 0 | 27 | 6 | 0 | 0 | 34 |
| KeyholeWest | 12-August-2019 | 1 | 0 | 0 | 34 | 5 | 0 | 0 | 40 |
| La_01 | 17-August-2021 | 0 | 0 | 0 | 3 | 0 | 0 | 0 | 3 |
| La_01 | 17-August-2021 | 0 | 0 | 0 | 8 | 1 | 0 | 0 | 9 |
| Lar_01 | 23-June-2021 | 0 | 0 | 0 | 0 | 0 | 1 | 0 | 1 |
| Lar_02 | 23-June-2021 | 0 | 0 | 0 | 1 | 0 | 0 | 0 | 1 |
| Lar_05 | 23-June-2021 | 18 | 0 | 0 | 3 | 5 | 0 | 17 | 43 |
| LCW1 | 7-August-2019 | 28 | 0 | 0 | 28 | 70 | 10 | 0 | 136 |
| LCW1 | 7-August-2019 | 49 | 0 | 0 | 60 | 78 | 3 | 0 | 190 |
| LCW3 | 7-August-2019 | 141 | 0 | 0 | 37 | 44 | 3 | 0 | 225 |
| LCW3 | 7-August-2019 | 15 | 0 | 0 | 3 | 92 | 2 | 0 | 112 |
| LCW7 | 5-August-2019 | 33 | 0 | 0 | 20 | 9 | 2 | 0 | 64 |
| LCW7 | 5-August-2019 | 81 | 1 | 0 | 26 | 56 | 7 | 0 | 170 |
| LCW8A | 6-August-2019 | 22 | 0 | 0 | 46 | 5 | 4 | 0 | 77 |
| LCW8A | 6-August-2019 | 34 | 0 | 0 | 84 | 9 | 15 | 0 | 142 |
| LCW8B | 6-August-2019 | 29 | 0 | 0 | 94 | 1 | 2 | 0 | 126 |
| LCW8B | 6-August-2019 | 5 | 0 | 0 | 46 | 1 | 8 | 0 | 60 |
| LCW9 | 6-August-2019 | 8 | 0 | 0 | 57 | 1 | 1 | 0 | 67 |
| LCW9 | 6-August-2019 | 23 | 0 | 0 | 49 | 3 | 0 | 0 | 75 |
| LCWBLM1 | 6-August-2019 | 47 | 0 | 0 | 17 | 18 | 0 | 0 | 82 |
| LCWBLM1 | 6-August-2019 | 49 | 0 | 0 | 6 | 14 | 0 | 0 | 69 |
| Lin_03 | 7-July-2021 | 162 | 0 | 0 | 0 | 0 | 2 | 0 | 164 |
| Lin_03 | 7-July-2021 | 79 | 0 | 0 | 2 | 0 | 0 | 0 | 81 |
| Lusk_02 | 16-July-2021 | 2 | 0 | 0 | 6 | 0 | 7 | 0 | 15 |
| Lusk_02 | 16-July-2021 | 7 | 0 | 0 | 12 | 0 | 0 | 0 | 19 |
| Lusk_03 | 14-July-2021 | 2 | 0 | 0 | 23 | 3 | 0 | 0 | 28 |
| Lusk_03 | 14-July-2021 | 9 | 0 | 0 | 25 | 1 | 0 | 0 | 35 |
| Lusk_04 | 16-July-2021 | 4 | 0 | 0 | 1 | 0 | 0 | 0 | 5 |
| Lusk_04 | 16-July-2021 | 4 | 0 | 0 | 1 | 0 | 0 | 0 | 5 |
| Lusk_05 | 12-August-2021 | 0 | 0 | 0 | 84 | 0 | 0 | 0 | 84 |
| Lusk_05 | 12-August-2021 | 1 | 0 | 0 | 88 | 1 | 1 | 0 | 91 |
| LW1 | 8-August-2019 | 95 | 0 | 0 | 44 | 17 | 1 | 0 | 157 |
| LW1 | 8-August-2019 | 54 | 0 | 0 | 22 | 11 | 0 | 0 | 87 |
| LW4 | 8-August-2019 | 81 | 0 | 0 | 133 | 3 | 1 | 0 | 218 |
| LW4 | 8-August-2019 | 106 | 0 | 0 | 29 | 31 | 1 | 0 | 167 |
| MBR001 | 10-July-2019 | 10 | 0 | 0 | 3 | 5 | 0 | 0 | 18 |
| MBR001 | 10-July-2019 | 26 | 0 | 0 | 0 | 3 | 1 | 0 | 30 |
| Mule_02 | 21-July-2021 | 0 | 0 | 0 | 3 | 0 | 0 | 0 | 3 |
| Mule_02 | 21-July-2021 | 0 | 0 | 0 | 0 | 0 | 0 | 0 | 0 |
| Mule_03 | 21-July-2021 | 13 | 0 | 0 | 5 | 10 | 0 | 0 | 28 |
| Mule_03 | 21-July-2021 | 11 | 0 | 0 | 0 | 5 | 0 | 0 | 16 |
| Mule_04 | 21-July-2021 | 4 | 0 | 1 | 69 | 3 | 1 | 0 | 77 |
| MushCreek | 14-August-2019 | 2 | 0 | 0 | 42 | 6 | 0 | 0 | 50 |
| MushCreek | 14-August-2019 | 2 | 0 | 0 | 60 | 11 | 10 | 0 | 83 |
| Newc_02 | 26-July-2021 | 4 | 0 | 0 | 2 | 1 | 0 | 0 | 7 |
| Newc_06 | 26-July-2021 | 47 | 0 | 0 | 16 | 6 | 2 | 0 | 71 |
| Newc_07 | 26-July-2021 | 11 | 0 | 0 | 29 | 1 | 0 | 0 | 41 |
| Ngil_01 | 10-August-2021 | 2 | 0 | 0 | 76 | 7 | 4 | 0 | 89 |
| Ngil_01 | 10-August-2021 | 0 | 0 | 0 | 30 | 4 | 0 | 0 | 34 |
| Ngil_02 | 10-August-2021 | 0 | 0 | 0 | 46 | 1 | 1 | 0 | 48 |
| Ngil_02 | 10-August-2021 | 0 | 0 | 1 | 32 | 0 | 0 | 0 | 32 |
| Ngil_03 | 10-August-2021 | 0 | 0 | 0 | 10 | 2 | 0 | 0 | 12 |
| Ngil_03 | 10-August-2021 | 0 | 0 | 0 | 5 | 6 | 0 | 0 | 11 |
| Orin_01 | 16-July-2021 | 9 | 0 | 0 | 4 | 0 | 0 | 0 | 13 |
| Orin_01 | 16-July-2021 | 16 | 0 | 0 | 4 | 0 | 1 | 0 | 21 |
| Pine_02 | 6-July-2021 | 5 | 0 | 0 | 5 | 0 | 0 | 0 | 10 |
| Pine_02 | 6-July-2021 | 3 | 0 | 0 | 6 | 0 | 0 | 1 | 10 |
| ReedLandLLC1 | 21-August-2019 | 22 | 0 | 0 | 208 | 1 | 15 | 0 | 246 |
| ReedLandLLC1 | 21-August-2019 | 14 | 0 | 0 | 158 | 7 | 39 | 1 | 219 |
| ReedLandLLC2 | 21-August-2019 | 3 | 0 | 0 | 121 | 0 | 7 | 0 | 131 |
| ReedLandLLC2 | 21-August-2019 | 18 | 0 | 0 | 62 | 0 | 5 | 0 | 85 |
| Rock_03 | 29-June-2021 | 3 | 0 | 0 | 0 | 0 | 0 | 10 | 13 |
| Rock_03 | 29-June-2021 | 4 | 0 | 0 | 0 | 0 | 0 | 14 | 18 |
| Rock_04 | 29-June-2021 | 2 | 0 | 0 | 0 | 0 | 0 | 0 | 2 |
| Rock_04 | 29-June-2021 | 2 | 0 | 0 | 0 | 0 | 1 | 1 | 4 |
| Short_01 | 17-July-2021 | 4 | 0 | 0 | 28 | 2 | 0 | 0 | 34 |
| SodaGleason | 13-August-2019 | 16 | 0 | 0 | 83 | 23 | 3 | 0 | 125 |
| SodaGleason | 13-August-2019 | 0 | 0 | 0 | 76 | 8 | 0 | 0 | 84 |
| Solar_01 | 2-July-2021 | 1 | 0 | 0 | 0 | 1 | 0 | 2 | 4 |
| SpringerWHMA1 | 23-August-2019 | 22 | 0 | 2 | 237 | 0 | 1 | 0 | 260 |
| SpringerWHMA1 | 23-August-2019 | 29 | 0 | 0 | 143 | 1 | 9 | 0 | 182 |
| STB10 | 16-July-2019 | 0 | 0 | 0 | 0 | 0 | 0 | 0 | 0 |
| STB10 | 16-July-2019 | 0 | 0 | 0 | 0 | 0 | 0 | 0 | 0 |
| STB11 | 15-July-2019 | 2 | 0 | 0 | 1 | 0 | 0 | 0 | 3 |
| STB11 | 15-July-2019 | 4 | 0 | 0 | 1 | 0 | 0 | 0 | 5 |
| STB11 | 16-July-2019 | 0 | 0 | 0 | 18 | 0 | 0 | 0 | 18 |
| STB11 | 16-July-2019 | 1 | 0 | 0 | 19 | 0 | 0 | 0 | 20 |
| STB12 | 18-July-2019 | 12 | 0 | 0 | 28 | 16 | 0 | 0 | 56 |
| STB18 | 19-July-2019 | 41 | 0 | 2 | 118 | 3 | 0 | 0 | 162 |
| STB18 | 19-July-2019 | 34 | 0 | 2 | 150 | 14 | 0 | 0 | 198 |
| STB19 | 17-July-2019 | 59 | 0 | 0 | 68 | 0 | 0 | 0 | 127 |
| STB19 | 17-July-2019 | 48 | 0 | 0 | 49 | 4 | 8 | 0 | 109 |
| STB4 | 16-July-2019 | 15 | 0 | 0 | 28 | 1 | 1 | 0 | 45 |
| STB4 | 16-July-2019 | 5 | 0 | 0 | 12 | 0 | 8 | 0 | 25 |
| STB6 | 18-July-2019 | 8 | 0 | 0 | 29 | 2 | 4 | 0 | 43 |
| STB6 | 18-July-2019 | 6 | 0 | 0 | 64 | 1 | 5 | 0 | 76 |
| STBBLM | 19-July-2019 | 13 | 0 | 0 | 17 | 0 | 0 | 0 | 30 |
| STBBLM | 19-July-2019 | 25 | 0 | 0 | 45 | 5 | 0 | 0 | 75 |
| Syb_01 | 8-July-2021 | 12 | 0 | 0 | 3 | 1 | 0 | 0 | 16 |
| Syb_01 | 8-July-2021 | 12 | 0 | 0 | 5 | 0 | 0 | 0 | 17 |
| TableMountain1 | 20-August-2019 | 2 | 0 | 0 | 24 | 2 | 0 | 0 | 28 |
| TableMountain1 | 20-August-2019 | 4 | 0 | 0 | 32 | 7 | 0 | 0 | 43 |
| TableMountain2 | 20-August-2019 | 0 | 0 | 0 | 31 | 0 | 0 | 0 | 31 |
| TableMountain2 | 20-August-2019 | 3 | 0 | 0 | 42 | 1 | 0 | 0 | 46 |
| TB001 | 17-June-2019 | 7 | 0 | 0 | 12 | 4 | 1 | 0 | 24 |
| TB002 | 17-June-2019 | 0 | 0 | 0 | 0 | 0 | 0 | 0 | 0 |
| TB002 | 17-June-2019 | 0 | 0 | 0 | 1 | 1 | 0 | 0 | 2 |
| TB003 | 18-June-2019 | 5 | 0 | 0 | 7 | 45 | 0 | 0 | 57 |
| TB003 | 18-June-2019 | 11 | 0 | 0 | 3 | 60 | 6 | 0 | 80 |
| TB004 | 18-June-2019 | 20 | 0 | 0 | 15 | 45 | 0 | 0 | 80 |
| TB004 | 18-June-2019 | 35 | 0 | 0 | 15 | 60 | 2 | 0 | 112 |
| TB005 | 19-June-2019 | 80 | 0 | 0 | 0 | 15 | 1 | 0 | 96 |
| TB005 | 19-June-2019 | 200 | 0 | 0 | 62 | 87 | 5 | 0 | 354 |
| TB006 | 19-June-2019 | 12 | 0 | 0 | 45 | 45 | 0 | 0 | 102 |
| TB006 | 19-June-2019 | 62 | 0 | 0 | 22 | 150 | 17 | 0 | 251 |
| TBSE3 | 17-July-2019 | 13 | 0 | 0 | 22 | 3 | 0 | 0 | 38 |
| TBSE3 | 17-July-2019 | 15 | 0 | 0 | 27 | 0 | 0 | 0 | 42 |
| Thun_01 | 22-July-2021 | 3 | 0 | 0 | 3 | 17 | 0 | 0 | 23 |
| Thun_01 | 22-July-2021 | 0 | 0 | 0 | 9 | 12 | 1 | 0 | 22 |
| TTBW001 | 24-June-2019 | 11 | 0 | 0 | 5 | 15 | 0 | 0 | 31 |
| TTBW001 | 24-June-2019 | 35 | 0 | 0 | 7 | 50 | 15 | 1 | 108 |
| TTBW002 | 24-June-2019 | 4 | 0 | 0 | 5 | 27 | 0 | 7 | 43 |
| TTBW002 | 24-June-2019 | 31 | 0 | 0 | 3 | 50 | 10 | 17 | 111 |
| TW14 | 27-June-2019 | 11 | 0 | 0 | 22 | 4 | 5 | 0 | 42 |
| TW14 | 27-June-2019 | 4 | 0 | 0 | 15 | 4 | 1 | 0 | 24 |
| TW7 | 4-July-2019 | 9 | 0 | 0 | 15 | 3 | 1 | 0 | 28 |
| TW8 | 27-June-2019 | 1 | 0 | 0 | 18 | 0 | 0 | 0 | 19 |
| TW8 | 27-June-2019 | 1 | 0 | 0 | 26 | 2 | 5 | 0 | 34 |
| TW9 | 4-July-2019 | 3 | 0 | 0 | 0 | 0 | 0 | 0 | 3 |
| TWBLM1 | 28-June-2019 | 140 | 0 | 0 | 19 | 23 | 2 | 0 | 184 |
| WH001 | 25-June-2019 | 8 | 0 | 0 | 5 | 2 | 0 | 0 | 15 |
| WH001 | 25-June-2019 | 6 | 0 | 0 | 17 | 0 | 3 | 0 | 26 |
| Wheat_01 | 8-July-2021 | 5 | 0 | 0 | 1 | 0 | 0 | 2 | 8 |
| Wheat_01 | 8-July-2021 | 35 | 0 | 1 | 0 | 0 | 0 | 0 | 35 |
| Wheat_03 | 7-July-2021 | 5 | 0 | 0 | 0 | 0 | 0 | 0 | 5 |
| Wheat_03 | 7-July-2021 | 5 | 0 | 0 | 0 | 0 | 0 | 0 | 5 |
| Wheat_04 | 8-July-2021 | 1 | 0 | 0 | 0 | 0 | 0 | 0 | 1 |
| Wheat_04 | 8-July-2021 | 2 | 0 | 0 | 0 | 0 | 0 | 0 | 2 |
| Wri_04 | 18-August-2021 | 0 | 0 | 0 | 13 | 1 | 0 | 0 | 14 |
| Wri_05 | 18-August-2021 | 0 | 0 | 0 | 1 | 0 | 0 | 0 | 1 |
| Wri_05 | 18-August-2021 | 0 | 0 | 0 | 0 | 0 | 0 | 0 | 0 |
| York | 13-August-2019 | 26 | 0 | 0 | 151 | 25 | 2 | 0 | 204 |
| York | 13-August-2019 | 28 | 1 | 1 | 99 | 12 | 1 | 0 | 140 |
Table A3.
The 32 potential climatic and landscape predictors evaluated to create the species distribution models for Monarchs and Regal Fritillary butterflies.
Table A3.
The 32 potential climatic and landscape predictors evaluated to create the species distribution models for Monarchs and Regal Fritillary butterflies.
| Climate Predictors | Landscape Predictors |
|---|---|
| Bioclim1 | % Bare ground |
| Bioclim2 | Contagion (aggregation of patches) |
| Bioclim3 | Distance to water |
| Bioclim4 | Elevation |
| Bioclim5 | Forest cover |
| Bioclim6 | Frost days |
| Bioclim7 | Growing degree days |
| Bioclim8 | Herbaceous cover |
| Bioclim9 | Surface organic matter cover |
| Bioclim10 | Sagebrush cover |
| Bioclim11 | Shrub cover |
| Bioclim12 | Topographic position index (11) |
| Bioclim13 | Bare ground cover |
| Bioclim14 | |
| Bioclim15 | |
| Bioclim16 | |
| Bioclim17 | |
| Bioclim18 | |
| Bioclim19 |
References
- Warren, M.S.; Maes, D.; van Swaay, C.A.M.; Goffart, P.; Van Dyck, H.; Bourn, N.A.D.; Wynhoff, I.; Hoare, D.; Ellis, S. The decline of butterflies in Europe: Problems, significance, and possible solutions. Proc. Natl. Acad. Sci. USA 2021, 118, e2002551117. [Google Scholar] [CrossRef]
- Edwards, C.B.; Zipkin, E.F.; Henry, E.H.; Haddad, N.M.; Forister, M.L.; Burls, K.J.; Campbell, S.P.; Crone, E.E.; Diffendorfer, J.; Douglas, M.R.; et al. Rapid butterfly declines across the United States during the 21st century. Science 2025, 387, 1090–1094. [Google Scholar] [CrossRef] [PubMed]
- Sanchez-Bayo, F.; Wyckhuys, K.A.G. Worldwide decline of the entomofauna: A review of its drivers. Biol. Conserv. 2019, 232, 8–27. [Google Scholar] [CrossRef]
- Thomas, J.A.; Telfer, M.G.; Roy, D.B.; Preston, C.D.; Greenwood, J.J.D.; Asher, J.; Fox, R.; Clarke, R.T.; Lawton, J.H. Comparative losses of British butterflies, birds, and plants and the global extinction crisis. Science 2004, 303, 1879–1881. [Google Scholar] [CrossRef]
- Lebuhn, G.; Droege, S.; Connor, E.F.; Gemmill-Herren, B.; Potts, S.G.; Minckley, R.L.; Griswold, T.; Jean, R.; Kula, E.; Roubik, D.W.; et al. Detecting insect pollinator declines on regional and global scales. Conserv. Biol. 2013, 27, 113–120. [Google Scholar] [CrossRef] [PubMed]
- Maxwell, S.L.; Fuller, R.A.; Brooks, T.M.; Watson, J.E. Biodiversity: The ravages of guns, nets and bulldozers. Nature 2016, 536, 143–145. [Google Scholar] [CrossRef]
- Wagner, D.; Grames, E.; Forister, M.; Berenbaum, M.; Stopak, D. Insect declines in the Anthropocene: Death by a thousand cuts. Proc. Nat. Acad. Sci. USA 2020, 118, e2023989118. [Google Scholar] [CrossRef]
- Maes, D.; Van Dyck, H. Butterfly diversity loss in Flanders (north Belgium): Europe’s worst case scenario? Biol. Conserv. 2001, 99, 263–276. [Google Scholar] [CrossRef]
- Elith, J.; Phillips, S.J.; Hastie, T.; Dudík, M.; Chee, Y.E.; Yates, C.J. A statistical explanation of MaxEnt for ecologists. Divers. Distrib. 2011, 17, 43–57. [Google Scholar] [CrossRef]
- Silva, D.P.; Spigoloni, Z.A.; Camargos, L.M.; de Andrade, A.F.A.; De Marco, P.; Engel, M.S. Distributional modeling of Mantophasmatodea (Insecta: Notoptera): A preliminary application and the need for future sampling. Org. Divers. Evol. 2016, 16, 259–268. [Google Scholar] [CrossRef]
- Newbold, T. Applications and limitations of museum data for conservation and ecology, with particular attention to species distribution models. Prog. Phys. Geogr. 2010, 34, 3–22. [Google Scholar] [CrossRef]
- Rodriguez, J.P.; Brotons, L.; Bustamante, J.; Seoane, J. The application of predictive modelling of species distribution to biodiversity conservation. Divers. Distrib. 2007, 13, 243–251. [Google Scholar] [CrossRef]
- Tronstad, L.M.; Bell, C.; Cook, K.; Dillon, M.E. Using Species Distribution Models to Assess the Status of the Declining Western Bumble Bee (Hymenoptera: Apidae: Bombus occidentalis) in Wyoming, USA. Environments 2025, 12, 2. [Google Scholar] [CrossRef]
- Pelletier, T.A.; Crisafulli, C.; Wagner, S.; Zellmer, A.J.; Carstens, B.C. Historical Species Distribution Models Predict Species Limits in Western Plethodon Salamanders. Syst. Biol. 2015, 64, 909–925. [Google Scholar] [CrossRef] [PubMed]
- Tronstad, L.M.; Brown, K.M.; Andersen, M.D. Using species distribution models to guide field surveys for an apparently rare aquatic beetle. J. Fish Wildl. Manag. 2018, 9, 330–339. [Google Scholar] [CrossRef]
- Marcer, A.; Sáez, L.; Molowny-Horas, R.; Pons, X.; Pino, J. Using species distribution modelling to disentangle realised versus potential distributions for rare species conservation. Biol. Conserv. 2013, 166, 221–230. [Google Scholar] [CrossRef]
- Amirkhiz, R.G.; Frey, J.K.; Cain, J.W., III; Breck, S.W.; Bergman, D.L. Predicting spatial factors associated with cattle depredations by the Mexican wolf (Canis lupus baileyi) with recommendations for depredation risk modeling. Biol. Conserv. 2018, 224, 327–335. [Google Scholar] [CrossRef]
- Selby, G. Regal Fritillary (Speyeria Idalia Drury): A Technical Conservation Assessment. USDA Forest Service, Rocky Mountain Region, Species Conservation Project. 2007. Available online: https://www.fs.usda.gov/Internet/FSE_DOCUMENTS/stelprdb5206808.pdf (accessed on 1 April 2025).
- Swengel, A.B. Comments to USFWS on Petition to List Regal Fritillary Federally. 2015. Available online: https://www.researchgate.net/ (accessed on 2 February 2019).
- Henderson, R.A.; Meunier, J.; Holoubek, N.S. Disentangling effects of fire, habitat, and climate on an endangered prairie-specialist butterfly. Biol. Conserv. 2018, 218, 41–48. [Google Scholar] [CrossRef]
- Moranz, R.A.; Fuhlendorf, S.D.; Engle, D.M. Making sense of a prairie butterfly paradox: The effects of grazing, time since fire, and sampling period on regal fritillary abundance. Biol. Conserv. 2014, 173, 32–41. [Google Scholar] [CrossRef]
- Swengel, S.R.; Schlicht, D.; Olsen, F.; Swengel, A.B. Declines of prairie butterflies in the midwestern USA. J. Insect Conserv. 2011, 15, 327–339. [Google Scholar] [CrossRef]
- Rendón-Salinas, E.; Fajardo-Arroyo, A.; Avera-Alonso, G. Forest Surface Occupied by Monarch Butterfly Hibernation Colonies in December 2014; World Wildlife Fund Report: Morges, Switzerland, 2015; pp. 1–4. [Google Scholar]
- Xerces Society. Xerces Society for Insect Conservation. Available online: https://xerces.org (accessed on 8 March 2022).
- Pleasants, J.M.; Oberhauser, K.S. Milkweed loss in agricultural fields because of herbicide use: Effect on the monarch butterfly population. Insect Conserv. Divers. 2013, 6, 135–144. [Google Scholar] [CrossRef]
- Zaya, D.N.; Pearse, I.S.; Spyreas, G. Long-Term Trends in Midwestern Milkweed Abundances and Their Relevance to Monarch Butterfly Declines. BioScience 2017, 67, 343–356. [Google Scholar] [CrossRef]
- Stenoien, C.; Nail, K.R.; Zalucki, J.M.; Parry, H.; Oberhauser, K.S.; Zalucki, M.P. Monarchs in decline: A collateral landscape-level effect of modern agriculture. Insect Sci. 2018, 25, 528–541. [Google Scholar] [CrossRef]
- Crone, E.E.; Pelton, E.M.; Brown, L.M.; Thomas, C.C.; Schultz, C.B. Why are monarch butterflies declining in the West? Understanding the importance of multiple correlated drivers. Ecol. Appl. 2019, 29, e01975. [Google Scholar] [CrossRef] [PubMed]
- Short, Z.; Tronstad, L.M. Monarchs reproduce in eastern Wyoming and were not parasitized by Ophryocystis elektroscirrha. Prairie Nat. 2024, 56, 1–9. [Google Scholar]
- Dingle, H.; Zalucki, M.P.; Rochester, W.A.; Armijo-Prewitt, T. Distribution of the monarch butterfly, Danaus plexippus (L.) (Lepidoptera: Nymphalidae), in western North America. Biol. J. Linn. Soc. 2005, 85, 491–500. [Google Scholar] [CrossRef]
- Jepsen, S.; Schweitzer, D.F.; Young, B.; Sears, N. Conservation Status and Ecology of the Monarch Butterfly in the United States; The Xerces Society for Intvertebrate Conservation: Portland, OR, USA, 2015. [Google Scholar]
- BAMONA. Butterflies and Moths of North America. Available online: https://www.butterfliesandmoths.org (accessed on 8 March 2022).
- Xerces Society; US Fish and Wildlife Service; Idaho Department of Fish and Game; Washington Department of Fish and Wildlife. Western Monarch Milkweed Mapper. Available online: www.monarchmilkweedmapper.org (accessed on 4 December 2020).
- Curtis, J.; Grimes, K. Wyoming Climate Atlas. Available online: https://www.wrds.uwyo.edu/sco/climateatlas/ (accessed on 24 February 2025).
- Kopper, B.J.; Charlton, R.E.; Margolies, D.C. Oviposition Site Selection by the Regal Fritillary, Speyeria idalia, as Affected by Proximity of Violet Host Plants. J. Insect Behav. 2000, 13, 651–665. [Google Scholar] [CrossRef]
- Caven, A.J.; King, K.C.; Wiese, J.D.; Brinley Buckley, E.M. A descriptive analysis of Regal Fritillary (Speyeria idalia) habitat utilizing biological monitoring data along the big bend of the Platte River, NE. J. Insect Conserv. 2017, 21, 183–205. [Google Scholar] [CrossRef]
- Ehrenreich, J.H.; Aikman, J.M. An Ecological Study of the Effect of Certain Management Practices on Native Prairie in Iowa. Ecol. Monogr. 1963, 33, 113–130. [Google Scholar] [CrossRef]
- Kopper, B.J.; Margolies, D.C.; Charlton, R.E. Life History Notes on the Regal Fritillary, Speyeria idalia (Drury) (Lepidoptera: Nymphalidae), in Kansas Tallgrass Prairie. J. Kans. Entomol. Soc. 2001, 74, 172–177. [Google Scholar]
- Brower, L. Monarch butterfly orientation: Missing pieces of a magnificent puzzle. J. Exp. Biol. 1996, 199, 93–103. [Google Scholar] [CrossRef] [PubMed]
- Knight, A.; Brower, L.P. The influence of eastern North American autumnal migrant monarch butterflies (Danaus plexippus L.) on continuously breeding resident monarch populations in southern Florida. J. Chem. Ecol. 2009, 35, 816–823. [Google Scholar] [CrossRef] [PubMed]
- Alonso-Mejia, A.; Rendon-Salinas, E.; Montesinos-Patino, E.; Brower, L.P. Use of lipid reserves by Monarch butterflies overwintering in Mexico: Implications for conservation. Ecol. Appl. 1997, 7, 934–947. [Google Scholar] [CrossRef]
- Kaufman, K.; Brock, J.P. Field Guide to Butterflies of North America; Houghton Mifflin Harcourt Publishing Company: New York, NY, USA, 2003. [Google Scholar]
- Venables, W.N.; Ripley, B.D. Modern Applied Statistics with S, 4th ed.; Springer: New York, NY, USA, 2002. [Google Scholar]
- Lenth, R. Emmeans: Estimated Mearginal Means, Aka Least-Squares Means, R package version 1.7.2.; Comprehensive R Archive Network; R Foundation for Statistical Computing: Vienna, Austria, 2022. [Google Scholar]
- Lukasz, K. Mblm: Median-Based Linear Models, R package version; R Foundation for Statistical Computing: Vienna, Austria, 2019. [Google Scholar]
- Wickham, H. The split-apply-combine strategy for data analysis. J. Stat. Softw. 2011, 40, 1–29. [Google Scholar] [CrossRef]
- Wickham, H.; Averick, M.; Bryan, J.; Chang, W.; McGowan, L.D.A.; François, R.; Grolemund, G.; Hayes, A.; Henry, L.; Hester, J.; et al. Welcome to the tidyverse. J. Open Source Softw. 2019, 4, 1686. [Google Scholar] [CrossRef]
- Tuthil, D. Personal communication, 2021.
- Channell, R.; Lomolino, M.V. Dynamic biogeography and conservation of endangered species. Nature 2000, 403, 84–86. [Google Scholar] [CrossRef]
- Pearson, R.G.; Raxworthy, C.J.; Nakamura, M.; Townsend Peterson, A. Predicting Species Distributions from Small Numbers of Occurrence Records: A Test Case Using Cryptic Geckos in Madagascar. J. Biogeogr. 2007, 34, 102–117. [Google Scholar] [CrossRef]
- McCullough, K.; Albanese, G.; Haukos, D.A.; Ricketts, A.M.; Stratton, S. Management regime and habitat response influence abundance of regal fritillary (Speyeria idalia) in tallgrass prairie. Ecosphere 2019, 10, e02845. [Google Scholar] [CrossRef]
- Christman, M.E.; Spears, L.R.; Strange, J.P.; Pearse, W.D.; Burchfield, E.K.; Ramirez, R.A. Land cover and climate drive shifts in Bombus assemblage composition. Agric. Ecosyst. Environ. 2022, 339, 108113. [Google Scholar] [CrossRef]
- Rhoades, P.R.; Koch, J.B.; Waits, L.P.; Strange, J.P.; Eigenbrode, S.D. Evidence for Bombus occidentalis (Hymenoptera: Apidae) populations in the Olympic Peninsula, the Palouse Prairie, and forests of northern Idaho. J. Insect Sci. 2016, 16, 20. [Google Scholar] [CrossRef]
- Thorp, R.; Jepsen, S.; Black, S.H. Status Review of Three Formerly Common Species of Bumble Bee in the Subgenus Bombus. Prepared for the Xerces Society of Invertebrate Conservation. 2008. Available online: https://xerces.org/sites/default/files/2019-10/xerces_2008_bombus_status_review_0.pdf (accessed on 5 November 2019).
- Cameron, S.A.; Lozier, J.D.; Strange, J.P.; Koch, J.B.; Cordes, N.; Solter, L.F.; Griswold, T.L. Patterns of widespread decline in North American bumble bees. Proc. Natl. Acad. Sci. USA 2011, 108, 662–667. [Google Scholar] [CrossRef] [PubMed]
- Colla, S.R.; Packer, L. Evidence for decline in eastern North American bumblebees (Hymenoptera: Apidae), with special focus on Bombus affinis Cresson. Biodivers. Conserv. 2008, 17, 1379–1391. [Google Scholar] [CrossRef]
- Tripodi, A.D.; Szalanski, A.L. The bumble bees (Hymenoptera: Apidae: Bombus) of Arkansas, fifty years later. J. Melittology 2015, 50, 1–17. [Google Scholar] [CrossRef]
- Sheffield, C.S.; Richardson, L.; Cannings, S.; Ngo, H.; Heron, J.; Williams, P.H. Biogeography and designatable units of Bombus occidentalis Greene and B. terricola Kirby (Hymenoptera: Apidae) with implications for conservation status assessments. J. Insect Conserv. 2016, 20, 189–199. [Google Scholar] [CrossRef]
- Geest, E.A.; Baum, K.A. Environmental Variables Influencing Five Speyeria (Lepidoptera: Nymphalidae) Species’ Potential Distributions of Suitable Habitat in the Eastern United States. Environ. Entomol. 2021, 50, 633–648. [Google Scholar] [CrossRef]
- Swartz, M.T.; Ferster, B.; Vulinec, K.; Paulson, G. Measuring regal fritillary butterfly (Speyeria idalia) habitat requirements in south-central Pennsylvania: Implications for the conservation of an imperiled butterfly. Northeast. Nat. 2015, 22, 812–829. [Google Scholar] [CrossRef]
- Marschalek, D.A.; Wolcott, D.M. Regal Fritillary (Argynnis idalia) Monitoring Techniques, Movement, and Habitat Use. Prairie Nat. 2024, 56, 10–26. [Google Scholar]
- Curtis, R.J.; Brereton, T.M.; Dennis, R.L.H.; Carbone, C.; Isaac, N.J.B.; Diamond, S. Butterfly abundance is determined by food availability and is mediated by species traits. J. Appl. Ecol. 2015, 52, 1676–1684. [Google Scholar] [CrossRef]
- iNaturalist. Available online: https://www.inaturalist.org/ (accessed on 19 October 2020).
- Hodkinson, I.D. Terrestrial insects along elevation gradients: Species and community responses to altitude. Biol. Rev. 2005, 80, 489–513. [Google Scholar] [CrossRef]
- Zalucki, M.P.; Lammers, J.H. Dispersal and egg shortfall in Monarch butterflies: What happens when the matrix is cleaned up? Ecol. Entomol. 2010, 35, 84–91. [Google Scholar] [CrossRef]
- Kasten, K.; Stenoien, C.; Caldwell, W.; Oberhauser, K.S. Can roadside habitat lead monarchs on a route to recovery? J. Insect Conserv. 2016, 20, 1047–1057. [Google Scholar] [CrossRef]
- Herbarium, R.M. RM Herbarium Specimen Database. Available online: https://rmh.uwyo.edu/data/search.php (accessed on 14 May 2020).
- Pocius, V.M.; Debinski, D.M.; Pleasants, J.M.; Bidne, K.G.; Hellmich, R.L.; Brower, L.P. Milkweed Matters: Monarch Butterfly (Lepidoptera: Nymphalidae) Survival and Development on Nine Midwestern Milkweed Species. Environ. Entomol. 2017, 46, 1098–1105. [Google Scholar] [CrossRef]
- Swengel, A.B.; Swengel, S.R. A ten-year study to monitor populations of the Regal Fritillary, Speyeria Idalia, (Lepidoptera: Nymphalidae) in Wisconsin, U.S.A. Great Lakes Entomol. 2001, 34, 97–115. [Google Scholar] [CrossRef]
- Leone, J.B.; Larson, D.L.; Larson, J.L.; Pennarola, N.; Oberhauser, K. Adult Monarch (Danaus plexippus) Abundance Is Higher in Burned Sites Than in Grazed Sites. Front. Ecol. Evol. 2019, 7, 435. [Google Scholar] [CrossRef]
- Schönbach, P.; Wan, H.; Gierus, M.; Bai, Y.; Müller, K.; Lin, L.; Susenbeth, A.; Taube, F. Grassland responses to grazing: Effects of grazing intensity and management system in an Inner Mongolian steppe ecosystem. Plant Soil 2011, 340, 103–115. [Google Scholar] [CrossRef]
- McGranahan, D.A.; Engle, D.M.; Wilsey, B.J.; Fuhlendorf, S.D.; Miller, J.R.; Debinski, D.M. Grazing and an invasive grass confound spatial pattern of exotic and native grassland plant species richness. Basic Appl. Ecol. 2012, 13, 654–662. [Google Scholar] [CrossRef]
- Bakker, C.; Blair, J.M.; Knapp, A.K. Does resource availability, resource heterogeneity or species turnover mediate changes in plant species richness in grazed grasslands? Oecologia 2003, 137, 385–391. [Google Scholar] [CrossRef]
- Olff, H.; Ritchie, M.E. Effects of herbivores on grassland plant diversity. Trends Ecol. Evol. 1998, 13, 261–265. [Google Scholar] [CrossRef]
- Stewart, G.B.; Pullin, A.S. The relative importance of grazing stock type and grazing intensity for conservation of mesotrophic ‘old meadow’ pasture. J. Nat. Conserv. 2008, 16, 175–185. [Google Scholar] [CrossRef]
- DeBano, S.J.; Roof, S.M.; Rowland, M.M.; Smith, L.A. Diet Overlap of Mammalian Herbivores and Native Bees: Implications for Managing Co-occurring Grazers and Pollinators. Nat. Areas J. 2016, 36, 458–477. [Google Scholar] [CrossRef]
- Tadey, M. Indirect effects of grazing intensity on pollinators and floral visitation. Ecol. Entomol. 2015, 40, 451. [Google Scholar] [CrossRef]
- Souther, S.; Loeser, M.; Crews, T.E.; Sisk, T. Complex response of vegetation to grazing suggests need for coordinated, landscape-level approaches to grazing management. Glob. Ecol. Conserv. 2019, 20, e00770. [Google Scholar] [CrossRef]
- Ries, L.; Debinski, D.M. Butterfly Responses to Habitat Edges in the Highly Fragmented Prairies of Central Iowa. J. Anim. Ecol. 2001, 70, 840–852. [Google Scholar] [CrossRef]
- Kurylo, J.S.; Threlfall, C.G.; Parris, K.M.; Ossola, A.; Williams, N.S.G.; Evans, K.L. Butterfly richness and abundance along a gradient of imperviousness and the importance of matrix quality. Ecol. Appl. 2020, 30, e02144. [Google Scholar] [CrossRef]
- Stahlheber, K.A.; D’Antonio, C.M. Using livestock to manage plant composition: A meta-analysis of grazing in California Mediterranean grasslands. Biol. Conserv. 2013, 157, 300–308. [Google Scholar] [CrossRef]
- Willmer, P.G.; Cunnold, H.; Ballantyne, G. Insights from measuring pollen deposition: Quantifying the pre-eminence of bees as flower visitors and effective pollinators. Arthropod-Plant Interact. 2017, 11, 411–425. [Google Scholar] [CrossRef]
- Brattström, O.; Kjellén, N.; Alerstam, T.; Åkesson, S. Effects of wind and weather on red admiral, Vanessa atalanta, migration at a coastal site in southern Sweden. Anim. Behav. 2008, 76, 335–344. [Google Scholar] [CrossRef]
- Cormont, A.; Malinowska, A.H.; Kostenko, O.; Radchuk, V.; Hemerik, L.; WallisDeVries, M.F.; Verboom, J. Effect of local weather on butterfly flight behaviour, movement, and colonization: Significance for dispersal under climate change. Biodivers. Conserv. 2010, 20, 483–503. [Google Scholar] [CrossRef]
- Delattre, T.; Baguette, M.; Burel, F.; Stevens, V.M.; Quénol, H.; Vernon, P. Interactive effects of landscape and weather on dispersal. Oikos 2013, 122, 1576–1585. [Google Scholar] [CrossRef]
- Owen, D.F.; Wiegert, R.G. A Southward Movement of the Painted Lady Butterfly in Wyoming. Southwest. Nat. 1985, 30, 158–159. [Google Scholar] [CrossRef]
- Debinski, D.M. Genetic diversity assessment in a metapopulation of the butterfly Euphydryas gillettii. Biol. Conserv. 1994, 70, 25–31. [Google Scholar] [CrossRef]
- Britten, H.B.; Brussard, P.F.; Murphy, D.D. The pending extinction of the uncompahgre Fritillary butterfly. Conserv. Biol. 1994, 8, 86–94. [Google Scholar] [CrossRef]
- Bowers, M.D.; Williams, E.H. Variable chemical defense in the checkerspot butterfly Euphydryas gillettii (Lepidoptera, Nymphalidae). Ecol. Entomol. 1995, 20, 208–212. [Google Scholar] [CrossRef]
- Auckland, J.N.; Debinski, D.M.; Clark, W.R. Survival, movement, and resource use of the butterfly Parnassius clodius. Ecol. Entomol. 2004, 29, 139–149. [Google Scholar] [CrossRef]
- DeChaine, E.G.; Martin, A.P. Historical biogeography of two alpine butterflies in the Rocky Mountains: Broad-scale concordance and local-scale discordance. J. Biogeogr. 2005, 32, 1943–1956. [Google Scholar] [CrossRef]
- McCoy, R.C.; Garud, N.R.; Kelley, J.L.; Boggs, C.L.; Petrov, D.A. Genomic inference accurately predicts the timing and severity of a recent bottleneck in a nonmodel insect population. Mol. Ecol. 2014, 23, 136–150. [Google Scholar] [CrossRef] [PubMed]
- Szcodronski, K.E.; Debinski, D.M.; Klaver, R.W. Occupancy modeling of Parnassius clodius butterfly populations in Grand Teton National Park, Wyoming. J. Insect Conserv. 2018, 22, 267–276. [Google Scholar] [CrossRef]
- Van Dyck, H.; Van Strien, A.J.; Maes, D.; Van Swaay, C.A.M. Declines in Common, Widespread Butterflies in a Landscape under Intense Human Use. Conserv. Biol. 2009, 23, 957–965. [Google Scholar] [CrossRef]
- Graves, T.A.; Janousek, W.M.; Gaulke, S.M.; Nicholas, A.C.; Keinath, D.A.; Bell, C.M.; Cannings, S.; Hatfield, R.G.; Heron, J.M.; Koch, J.B.; et al. Western bumble bee: Declines in the continental United States and range-wide information gaps. Ecosphere 2020, 11, e03141. [Google Scholar] [CrossRef]
- Wei, N.; Kaczorowski, R.L.; Arceo-Gómez, G.; O’Neill, E.M.; Hayes, R.A.; Ashman, T.-L. Pollinators contribute to the maintenance of flowering plant diversity. Nature 2021, 597, 688–692. [Google Scholar] [CrossRef]
- Flather, C.; Sieg, C. Species Rarity: Definition, Causes and Classification. In Conservation of Rare or Little-Known Species: Biological, Social and Economic Considerations; Raphael, M., Molina, R., Eds.; Island Press: Washington, DC, USA, 2007. [Google Scholar]
- Post van der Burg, M. Measuring butterfly persistence in the face of deep uncertainty: A case study using the regal fritillary. Front. Ecol. Evol. 2024, 12, 1482783. [Google Scholar] [CrossRef]
- Post van der Burg, M.; MacDonald, G.; Hefley, T.; Glassberg, J. Point-scale habitat and weather patterns influence the distribution of regal fritillaries in the central United States. EcoSphere 2023, 14, e4429. [Google Scholar] [CrossRef]
- Biesmeijer, J.C.; Roberts, S.P.; Reemer, M.; Ohlemüller, R.; Edwards, M.; Peeters, T.; Schaffers, A.P.; Potts, S.G.; Kleukers, R.; Thomas, C.D.; et al. Parallel declines in pollinators and insect-pollinated plants in Britain and the Netherlands. Science 2006, 313, 351–354. [Google Scholar] [CrossRef]
- Gibson, R.; Nelson, I.; Hopkins, G.; Hamlett, B.; Memmott, J. Pollinator webs, plant communities and the conservation of rare plants: Arable weeds as a case study. J. Appl. Ecol. 2006, 43, 246–257. [Google Scholar] [CrossRef]
Disclaimer/Publisher’s Note: The statements, opinions and data contained in all publications are solely those of the individual author(s) and contributor(s) and not of MDPI and/or the editor(s). MDPI and/or the editor(s) disclaim responsibility for any injury to people or property resulting from any ideas, methods, instructions or products referred to in the content. |
© 2025 by the authors. Licensee MDPI, Basel, Switzerland. This article is an open access article distributed under the terms and conditions of the Creative Commons Attribution (CC BY) license (https://creativecommons.org/licenses/by/4.0/).