Abstract
Pollution in mining areas represents a major environmental issue, significantly impacting ecosystems and human health. This study highlights propolis as an efficient natural bioindicator for detecting and assessing the degree of contamination in these areas. The objective of this study is to determine the levels of metals (Pb, Cd, As, Cr, Fe, Mn, Cu, and Zn) in propolis from mining exploitation areas in Romania, specifically in the counties of Alba, Hunedoara, Maramureș, and Caraș-Severin. Although mining operations are closed, the anthropogenic impact varies due to differences in the surface areas of the zones affected, the areas occupied by waste heaps, local hydrological conditions, and partial ecological rehabilitation efforts. To highlight the impact of contamination, a reference area considered unaffected by anthropogenic activities was used as a benchmark for each county. The values obtained in the investigated area were compared with those from this control zone to determine the differences and the specific impact of pollution. Maximum values were recorded in Roșia Montană for Pb (9.27 mg·kg−1), Cd (0.17 mg·kg−1), and As (0.87 mg·kg−1); in Băile Borșa for Fe (150.23 mg·kg−1) and Zn (2.9 mg·kg−1); in Certeju de Sus for Cu (6 mg·kg−1) and Cr (7.01 mg·kg−1); and in Moldova Nouă for Mn (25.43 mg·kg−1). The maximum content values of phenols (189.49 mg·kg−1 in Alba County) and flavonoids (88.06 mg·kg−1 in Caraș-Severin) were recorded, as well as the minimum IC50 antioxidant activity (0.33 µg·mL−1). Propolis from these areas showed antimicrobial activity against five bacterial strains (Staphylococcus aureus, Escherichia coli, Pseudomonas aeruginosa, Enterococcus faecalis, and Streptococcus mutans) and five fungal strains (Candida albicans, Aspergillus niger, Aspergillus flavus, Cryptococcus neoformans, and Penicillium chrysogenum), although such antimicrobial and antifungal activities were more intense in unpolluted areas. The present study reveals that propolis is a natural indicator of heavy metal pollution in mining areas. These data support the usefulness of propolis due to its high capacity to accumulate and reflect environmental contaminants.
1. Introduction
Bees serve as significant bioindicators for assessing environmental pollution. Their role in signaling the presence of contaminants is evidenced by elevated mortality rates or by the identification of toxic residues in various bee-related products such as honey, pollen, propolis, and larvae []. Due to them collecting pollen and nectar within a 2–5 km radius, bees are exposed to various chemical and physical pollutants from the environment, a factor which can affect their health and the quality of bee products []. Bee products can provide important information about the state of the surrounding environment, which is why bees are extensively studied for ecological purposes []. Pollution comes from both natural sources and human activities, such as exhaust gas emissions, heavy metals, pesticides, radioactive waste, and veterinary medicines used to treat bee diseases [].
Propolis is a natural resinous compound synthesized by honeybees from bioactive substances collected from plant buds, exudates, and various vegetal sources []. Raw propolis typically consists of approximately 50% resins, 30% wax, 10% essential oils, 5% pollen, and 5% various organic compounds []. The chemical composition of propolis includes substances from several major groups of compounds, such as polyphenols, benzoic acids and their derivatives, cinnamic alcohol, cinnamic acid and its derivatives, sesquiterpenes, triterpenic hydrocarbons, benzaldehyde derivatives, alcohols, ketones, heteroaromatic compounds, terpenic and sesquiterpenic alcohols with their derivatives, aliphatic hydrocarbons, minerals, sterols, sterolic hydrocarbons, sugars, and amino acids [].
The occurrence of metals in propolis is linked to environmental contamination resulting from human activities in the vicinity of apiaries []. This contamination can arise from various sources, including air, water, vegetation, and soil [].
The increase in atmospheric emissions from anthropogenic sources of pollution negatively affects the environment []. The main sources of environmental pollution in mining areas are emissions of dust and toxic gases from mining and ore processing activities, discharge of hazardous chemicals, as well as improper disposal of industrial waste []. The presence of toxic elements in propolis is linked to environmental pollution of anthropogenic origin in the vicinity of the apiaries, stemming from various sources such as air, water, vegetation, and soil []. Potential contributors to cadmium and lead contamination include industrial activities []. The most extensively studied toxic metals in propolis are arsenic, mercury, cadmium, lead, nickel, chromium, and tin [,]. The concentration levels of toxic trace elements in propolis are directly influenced by the degree of environmental pollution in the sampling area. Consequently, propolis can serve as a bioindicator of environmental contamination, particularly with respect to heavy metals []. In numerous studies, metal concentrations in propolis have been assessed across various types of environments. In Poland, the reported values range from 0.89 to 2.94 µg·g−1 for lead, 12.5 to 54.4 µg·kg−1 for cadmium, 8 to 24 µg·g−1 for iron, 137 to 823 µg·g−1 for manganese, and 17.7 to 71.5 µg·g−1 for zinc []. Tosic et al. [] reported lead levels between 2 and 9.7 mg·kg−1, cadmium levels from 0.067 to 0.31 mg·kg−1, iron ranging from 116 to 284 mg·kg−1, manganese between 3.98 and 14.36 mg·kg−1, copper from 2.22 to 8.7 mg·kg−1, and zinc values between 19.2 and 75.1 mg·kg−1 in Serbian propolis. In two regions of Russia, Vakhonina et al. [] reported values of up to 0.19 mg·kg−1 for lead, 0.164 mg·kg−1 for cadmium, and 1.04 µg·kg−1 for arsenic.
It is known that all types of propolis have antimicrobial properties. The activity of propolis against many types of microorganisms, including yeasts, viruses, bacteria, and parasites has already been shown []. Therefore, due to their antimicrobial effect, bee products can be used in the treatment of a wide range of human diseases. Although the antimicrobial effects of bee products have been used since ancient times, their exact mechanisms of action remain incompletely understood []. Propolis, known for its rich composition of bioactive compounds, acts against a wide range of microorganisms by inhibiting bacterial growth and stimulating the immune response []. Flavonoids and phenols in propolis help prevent and eliminate microbial and fungal infections, including molds and pathogenic bacteria [].
The aim of this study is to monitor the heavy metal content in propolis from four mining basins in Romania compared to propolis obtained from adjacent protected areas, and to highlight their variation depending on the specific characteristics of the region where the apiary is located. The study comparatively investigates the content of flavonoids, phenols, and metals in propolis samples from mining and protected areas, correlating them with antimicrobial activity. The scientific contribution lies in analyzing both toxic metals (Pb, Cd, As, Cr) and essential metals (Fe, Mn, Cu, Zn) to evaluate their impact on the biological activity of propolis. This study evaluates the potential of propolis as a natural indicator of environmental heavy metal pollution in mining areas, emphasizing its ability to accumulate and reflect the presence of contaminants. From an applied perspective, the results help better comprehend the influence of pollution on the composition and therapeutic properties of propolis. This information is valuable for beekeeping, the pharmaceutical industry, and consumer safety.
2. Materials and Methods
2.1. Propolis Sampling Areas
In June 2024, 10–20 g of raw propolis was collected from every hive in every apiary (approximately 25 hives per apiary). The propolis was produced by the honey bee native to Romania (Apis mellifera carpatica), a subspecies of the European honey bee (Apis mellifera) which evolved under the specific pedo-climatic (temperate continental) and floral conditions of the Carpathian region. The reason why June was chosen is that it is considered the peak working period for beekeepers and bees. In this month, in Romania, bee colonies reach maximum development, the hive population is at its most numerous, and nectar collections are abundant due to the massive flowering of melliferous plants.
Figure 1 and Figure 2 show the map of Romania along with the sampling points from the studied mining areas.
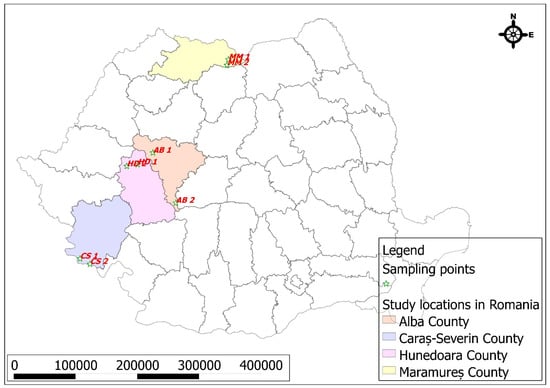
Figure 1.
Map of Romania and the counties with mining basins where the propolis samples were collected.
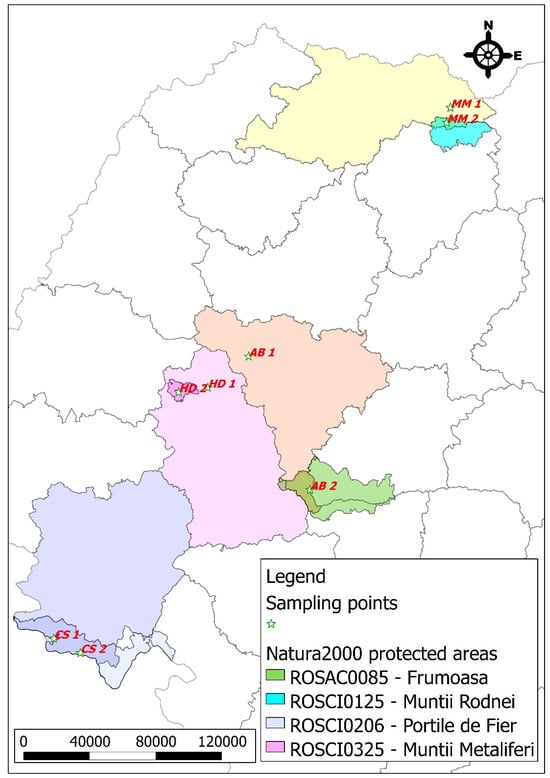
Figure 2.
Propolis sampling points corresponding to mining basins and protected areas.
These locations were selected based on their historical and ongoing mining activities, as well as their varying degrees of anthropogenic impact. The reference points in adjacent protected areas serve as control sites to compare the levels of heavy metals in propolis, providing a clearer assessment of pollution levels and spatial distribution. The marked sampling points highlight the key regions investigated, offering a visual representation of the study’s geographic scope.
The maps presented in Figure 1 and Figure 2 were generated using the open-source software QGIS, incorporating both vector and raster data sourced from the website https://geo-spatial.org, (accessed on 15 June 2024) along with vectorized data created by the authors. The points displayed were derived from GPS coordinates collected in the field during the sample collection process, utilizing the Android mobile application Spyglass.
The delineated areas of investigation were established based on the need for a comparative analysis between mining zones, characterized by exposure to heavy metal contamination, and protected natural areas, which serve as control sites with minimal anthropogenic influence. The selected regions are shown in Table 1.

Table 1.
Coding and identification of propolis sampling areas from Romania.
The investigated areas in Romania are recognized as major mining basins with a long-standing tradition of exploitation of metalliferous resources. At Roșia Montană, the exploitation of mineral resources such as gold, silver, copper, zinc, lead, and tellurium has been carried out [], with mineral resources such as gold, silver, zinc, lead, and copper extracted from Certeju de Sus []. Băile Borșa was once the most important center for iron and gold mining in the Maramureș region, home to one of the oldest mining basin exploitations in Romania and the deepest in Europe []. At Moldova Nouă, the exploitation of mineral resources such as copper and zinc has been carried out [].
These mining operations are currently closed, but the environmental impact varies from one site to another due to the different areas affected by mining activities, the spaces occupied by waste heaps, and local hydrological conditions. Since extraction activities in those areas have ceased, there are no longer controlled discharges of wastewater from the technological process that can be quantified. The waste heaps and abandoned, non-rehabilitated mines are subject to bacterial leaching, and, as a result of this process, acidic waters loaded with heavy metals are released, impacting water resources and aquatic biodiversity both in mining areas and downstream rivers. Human impacts also vary depending on the environmental rehabilitation efforts made by the authorities, such efforts being significant in some areas and almost nonexistent in others [].
-The Roșia Montană mining area has a long history of gold extraction, dating back to the Roman period. The human impact is significant, with large areas of land affected, as the predominant exploitations were surface based, but also included underground mining. Previous mining activities have led to the deforestation of extensive areas, landscape degradation, and soil deterioration, impacting local ecosystems [].
-The Certej mining area is known for the extraction of gold and silver ores, being one of the most important mining regions for precious metals in Romania. Intensive mining began in the 19th century and is currently halted. Extraction was carried out both through underground mines and surface mining methods, both of which generate waste. The environmental impact is similar to that of the Roșia Montană area but of lower intensity.
-The Băile Borșa mining area dates back to the Middle Ages and experienced significant development in the 19th and 20th centuries. It is particularly known for the extraction of copper, silver, gold, and lead ores. This area, located in the Maramureș Mountains within a spectacular natural setting, has been heavily affected by mining activities. Extraction was primarily conducted through underground mines, which reached considerable depths. In the 1970s, surface mining began, having a major visual and environmental impact and creating a crater over 200 m deep and approximately 1 km in diameter, one of the largest in Europe [,].
-The Moldova Nouă mine, located in Caraș-Severin County, has a long history, dating back to the Roman period, when gold and copper were extracted. Mining activities resumed in the 19th century and experienced significant development in the 20th century, with intensive extraction of copper and other metals such as gold, silver, and lead. Extraction was primarily conducted through underground mines, some reaching considerable depths, exceeding 1000 m [].
This comparative approach aims to assess the impact of mining activities on the chemical composition of propolis samples by contrasting data from mining zones with those from ecologically preserved regions. Thus, the following protected areas were chosen for the collection of control propolis samples:
1. The Natura 2000 site ROSAC0085 Frumoasa spans the territories of four counties: Alba (19%), Sibiu (60%), Vâlcea (19%), and Hunedoara (2%). The site was designated as a protected natural area through the Romanian Minister of Environment and Sustainable Development’s Order no. 1964/2007. The protection objectives of the site include the conservation of natural habitats and species of community interest, maintaining biological diversity, and ensuring the ecological integrity of the area. Among the protected habitats, some of which are priority habitats, are heathlands, beech and spruce forests, mountain and subalpine meadows and pastures, as well as habitats specific to wetlands and acid bogs. Plant species of community interest include Buxbaumia viridis (green shield-moss), Campanula serrata (saw bellflower), Dicranum viride (green fork moss), Drepanocladus vernicosus (varnished hook-moss), Eleocharis carniolica (Carniolan spikerush), and Tozzia carpathica (Carniolan spikerush or Carpathian Tozzia). The fauna species of community interest present in the site include the brown bear (Ursus arctos), wolf (Canis lupus), red fox (Vulpes vulpes), and lynx (Lynx lynx). Other conservation targets of the site include various species of invertebrates, amphibians, and fish. These habitats and species contribute to the biodiversity of the site and are protected through specific conservation measures to maintain and improve their conservation status [].
2. The Natura 2000 site ROSCI0125 Rodna Mountains spans the territories of the counties of Maramureș and Bistrița-Năsăud. It was designated as a protected natural area through the Romanian Order no. 1964/2007, with subsequent amendments and additions. The protection objectives of the site aim to conserve natural habitats and species of community interest, maintain biological diversity, and ensure the ecological integrity of the region. Among the protected habitats, some with priority status, are various plant associations with Alnus glutinosa (black alder), Fagus sylvatica (European beech), Picea abies (Norway spruce), and Larix decidua (European larch), different types of alpine and boreal mountain meadow and pasture habitats, heathland habitats, bogs and swamps, cave habitats, scree slopes, rocky cliffs, and petrifying springs with travertine formations. The plant species of community interest present at the site include rare and protected species such as Dicranum viride (green fork moss), Hamatocaulis vernicosus (varnished hook-moss), Tozzia carpathica (Carpathian tozzia), Buxbaumia viridis (green shield-moss), Meesia longiseta (long-stalked meesia), and Ligularia sibirica (Siberian ligularia). The fauna is represented by mammals such as the brown bear (Ursus arctos), lynx (Lynx lynx), wolf (Canis lupus), and otter (Lutra lutra), along with high diversity of bats. Additionally, the site hosts an important diversity of fish, amphibians, reptiles, and invertebrates, contributing to the faunistic richness of the region. To maintain ecological balance and protect these species and habitats, specific conservation measures are implemented, aimed at ensuring a favorable protection status and supporting the maintenance of biodiversity in one of the most spectacular mountain ranges in Romania [].
3. The Natura 2000 site ROSCI0206 Iron Gates is located in the southwest of Romania, along the Danube River, and spans the territories of the counties of Mehedinți and Caraș-Severin. It was designated as a protected natural area through Romanian Government Decision no. 1048/2013, which approves the management plan and regulations of the Iron Gates Natural Park. The conservation objectives of the site focus on preserving natural habitats and species of community interest, maintaining biological diversity, and ensuring the ecological integrity of the region. Among the protected habitats, some with priority status are forests with various associations of Fagus sylvatica (beech), Quercus petraea (sessile oak), Tilia cordata (linden), Fraxinus excelsior (ash), Salix alba (willow), and Populus alba (white poplar); habitats of flowing and standing waters, natural lakes; subcontinental scrublands; lowland meadows and alluvial pastures; rupicolous, panonic, xerophilic, and steppe habitats; communities of forest edges; scree habitats, rocky slopes, and caves. The plant species of community interest present at the site include rare and protected species such as Agrimonia pilosa (hairy agrimony), Paeonia officinalis ssp. Banatica (Banat peony), Tulipa hungarica (Hungarian tulip), Stipa danubialis (Danube feather grass), Himantoglossum caprinum (goat orchid), Asplenium adulterinum (bastard spleenwort), Echium russicum (Russian viper’s bugloss), Marsilea quadrifolia (European water clover), Pulsatilla grandis (greater pasque flower), and Thlaspi jankae (Janka’s pennycress). The fauna is represented by mammals such as the wolf (Canis lupus), lynx (Lynx lynx), and otter (Lutra lutra), along with various species of bats, invertebrates, and species of fish, amphibians, and reptiles. To maintain ecological balance and protect these species and habitats, specific conservation measures are implemented to ensure a favorable protection status and support the maintenance of biodiversity in one of the most valuable natural areas in Romania [].
4. The Natura 2000 site ROSCI0325 Metaliferi Mountains is located in the territory of Hunedoara County and covers an area of approximately 14,303 hectares. This protected area is part of a network of sites connecting the Apuseni Mountains with the Southern Carpathians and includes compact forest areas in the western part of the Metaliferi Mountains, characterized by oak and beech forests. The protection objectives of the site aim to conserve natural habitats and species of community interest, maintain biological diversity, and ensure the ecological integrity of the region. Among the protected habitats are oak (Quercus petraea) and beech (Fagus sylvatica) forests, which provide favorable conditions for various species of fauna and flora. The fauna of community interest present at the site includes mammal species such as the wolf (Canis lupus), brown bear (Ursus arctos), lynx (Lynx lynx), and otter (Lutra lutra), along with various species of bats [].
2.2. Determination of Metals in Propolis Samples
A total of 0.5 g of each propolis sample was weighed accurately and placed in Teflon digestion vessels, with 10 mL of concentrated HNO3 (Suprapure, Merck KGaA, Darmstadt, Germany) added to each sample. The mineralization process was performed using the TRANSFORM 680 microwave digestion system (Aurora Instruments, Vancouver, BC, Canada) at approximately 85–95 °C for 60 min until full dissolution of the sample. After cooling, the mineralized solutions were filtered through a 0.45 µm filter. The resulting clear solution was diluted to a fixed volume with deionized water (Sigma-Aldrich, St. Louis, MO, USA). The metal content of the mineralized samples was determined by aspirating them into the flame of the atomic absorption spectrometer (Perkin Elmer AA700, Waltham, MA, USA). The instrument was calibrated using standard solutions with known concentrations of each target metal. All samples were drawn into the flame, and the absorption of radiation at the element-specific wavelengths was measured. The metal concentrations were calculated based on the calibration curves obtained and expressed in mg·kg−1 of dry matter []. For the preparation of the calibration curve, standard solutions of 1000 mg·L−1 of the investigated metals (Certipur Merck, Darmstadt, Germany) were used. To verify the calibration curve, an ICP calibration standard solution (Agilent Technologies, Santa Clara, CA, USA), containing lead, cadmium, and zinc at 1001 ± 5 µg·mL−1, as well as chromium, iron, manganese, copper, and zinc at 1000 ± 5 µg·mL−1, was used. A propolis sample was fortified at the maximum allowable concentration []: 1 mg·kg−1 for lead and cadmium, 1.5 mg·kg−1 for arsenic, and 1 mg·kg−1 for chromium, iron, manganese, copper, and zinc. The limit of quantification (LOQ) for each metal is represented by the first point on the calibration curve. For each metal, 10 readings were taken from the solution at the LOQ concentration (lead, iron: 0.2 mg·L−1; cadmium, arsenic, chromium, manganese, zinc: 0.02 mg·L−1; copper: 0.05 mg·L−1), with the standard deviation of repeatability at LOQ being less than 10%.
2.3. Biological Parameters Analyzed for Propolis
1. Determination of total phenolic content was achieved using the Folin–Ciocalteu method [,]. Initially, 50 g of dehydrated raw propolis was solubilized in 150 mL of 96% ethanol and homogenized using a Climo-Shaker ISF1-XC shaker incubator (Kuhner, Basel, Switzerland) at 700 rpm and 35 °C for 48 h, with the sample shielded from light. The mixture was then filtered through filter paper to obtain a clear ethanolic extract. For the Folin–Ciocalteu assay, 1 mL of the ethanolic extract was mixed with 5 mL of distilled water, followed by the addition of 1 mL of a Folin–Ciocalteu reagent (diluted 1:1 with water). After 5 min of incubation, 4 mL of a 7.5% Na2CO3 solution was introduced. The obtained sample was maintained in the dark at 20 °C for 30 min. Absorbance was measured at 765 nm using a Lambda 20 UV/VIS spectrophotometer (Perkin Elmer, Washington, DC, USA) and distilled water as the blank. The phenolic concentrations were determined by comparing the sample absorbance with a standard gallic acid calibration curve (0–200 µg·mL−1). The results are presented as milligrams of gallic acid (3,4,5-trihydroxybenzoic acid) equivalents per gram of propolis extract (mg GAE·g−1). The samples were analyzed in triplicates, and the results are presented as the mean ± standard deviation (SD).
2. Determination of total flavonoid content was achieved using the AlCl3 method [,]. A quantity of 1 g of powdered propolis (cleaned, frozen, and triturated in a mortar and pestle) was mixed with 2.5 mL of 96% ethanol, and the obtained solution was spun in a Centra CL2 centrifuge (Thermo Fisher Scientific Inc., Waltham, MA, USA) at 300 rpm for 24 h. Then, 25 mL of 80% ethanol (C2H5OH) was added to the supernatant. For the flavonoid assay, 0.5 mL of the ethanolic extract was mixed with 0.1 mL of 10% Folin’s phenol reagent, 0.1 mL of 1M potassium acetate (CH3COOK), 1.5 mL of 95% C2H5OH, and 2.8 mL of distilled water. The mixture was protected from the light for 1 h to enable the formation of the flavonoid–AlCl3 complex. The absorbance was recorded at 425 nm using a PerkinElmer Lambda 20 UV/VIS spectrophotometer (Waltham, MA, USA). The flavonoid concentration was determined using a quercetin calibration curve (0–100 µg·mL−1) and expressed as milligrams of quercetin equivalents/100 g of propolis (mg QE·100 g−1). The samples were analyzed in triplicates, and the results are expressed as the mean of each sample.
3. Antioxidant activity was measured using the DPPH method [,]. The antioxidant activity of propolis was evaluated by assessing its radical scavenging activity (RSA) using DPPH (2,2-diphenyl-1-picrylhydrazyl) (Sigma-Aldrich, USA) as a free radical. To prepare the propolis extract, 1 g of propolis was homogenized with 70% C2H5OH solution (1:100 w/v) and kept at 20 °C for 24 h. Subsequent to the complete evaporation of the ethanol, the resulting concentrated dry extract was employed for further analysis. The following were prepared for the test: a 0.6 mg·mL−1 propolis solution and a 0.1 mM ethanolic DPPH solution. The absorbance of the mixtures was measured at λ = 517 nm using a Lambda 20 UV/VIS spectrophotometer (Perkin Elmer UV/VIS, Washington, DC, USA). The absorbance (A) was recorded at the beginning of the reaction and again after 10 and 20 min of incubation. All measurements were performed in triplicates. The antioxidant activity was calculated using the following formula: % RSA = (ADPPH − Asample)/ADPPH × 100. The free radical scavenging capacity of each propolis sample was quantified as the IC50 value (half maximal inhibitory concentration of the radicals DPPH). To determine the IC50, RSA values were calculated for five different concentrations of propolis (0.6, 1, 2, 3, and 4 mg·mL−1).
4. Antimicrobial activity. Aqueous propolis extracts were obtained using the methodology outlined in our prior study []. Briefly, propolis powders in an aqueous suspension were refluxed for one hour, centrifuged twice, then 80% of the initial volume was evaporated by heating. The aqueous extracts that were obtained were stored in a dark, dry environment until further use. To test the antimicrobial properties, a concentration of 0.1 g·mL−1 was used. The antibacterial properties of propolis extracts were evaluated using five bacterial strains: Staphylococcus aureus (ATCC 25923), Escherichia coli (ATCC 25922), Pseudomonas aeruginosa (ATCC 27853), Enterococcus faecalis (ATCC 29212), and Streptococcus mutans (ATCC 25175). Additionally, antifungal efficacy was tested against five fungal strains: Candida albicans (ATCC 10231), Aspergillus brasiliensis (niger) (ATCC 16404), Aspergillus flavus (ATCC 9643), Cryptococcus neoformans (ATCC 36556), and Penicillium chrysogenum (ATCC 10106). The suppliers for the strains were Thermo Fisher Scientific Inc. (Waltham, MA, USA) and MicroBioLogics Inc. (St. Cloud, MN, USA).
Antimicrobial activity was assessed using the disk diffusion method, following CLSI guidelines [], using overnight cultures in sterile normal saline adjusted to 0.5 McFarland, as described in our previous studies [,].
The culture media used were Mueller–Hinton agar (Merck KGaA, Darmstadt, Germany) for bacterial strains and Sabouraud 4% dextrose agar (Merck KGaA) for fungal strains. A total of 50 μL of extract (0.1 g·mL−1) was applied to ~6 mm filter paper discs. The following were used as positive controls: discs impregnated with 5 μg of ciprofloxacin (Bio-Rad, Hercules, Marnes-la-Coquette, France) were utilized for bacterial strains and discs containing 1 μg of voriconazole (Bio-Rad, France) were employed for fungal strains. The diameter of the zones of inhibition (in mm) was measured using a DIN 862 ABS digital caliper (Fuzhou Conic Industrial Co., Ltd., Fuzhou, China). All tests were performed in triplicates, the results being expressed as the average of the three tests.
2.4. Statistical Analysis
Pearson’s correlation analysis was performed using the following data: phenols and flavonoids versus the diameter of the inhibition zone of microbial strains; phenols, flavonoids, and antioxidant activity (IC50) versus metals; and metals versus the diameter of the inhibition zone of microbial strains. The Minitab software, version 21 (Minitab LLC, State College, PA, USA), was used, and p-values < 0.05 were considered statistically significant.
The statistical significance of the heavy metal content and maximum allowed level, the diameter of inhibition, and the response to antibiotics were estimated (Minitab LLC, State College, PA, USA) by Student’s t-test (p < 0.01).
3. Results
3.1. Chemical Analysis of Propolis
The biological activity values of the propolis samples collected from different areas are shown in Table 2, highlighting the comparative analysis between mining zones and protected natural areas. The mining areas include Roșia Montană (AB1), Certeju de Sus (HD1), Băile Borșa (MM1), and Moldova Nouă (CS1). These were compared to their corresponding protected natural areas.
Table 2.
Evaluation of the biological activity of the propolis samples.
The results revealed notable differences in the biological activity of propolis between mining areas and protected natural zones. In terms of phenolic content, the lowest value was recorded in the mining area MM1 (120.80 mg GAE·g−1), while the highest was recorded in the protected zone CS2 (193.46 mg GAE·g−1), indicating a richer phenolic composition in the conserved areas. Similarly, flavonoid content was minimal in AB1 (33.20 mg QE·g−1) and reached its peak in CS2 (88.06 mg QE·g−1), with consistently higher flavonoid concentrations in the samples from the protected regions.
With respect to the ability of propolis to inhibit 50% of free radicals, as reflected by IC50 values, the strongest antioxidant activity was observed in AB2 (0.333 µg·mL−1), while the weakest was found in CS1 (0.937 µg·mL−1). A lower IC50 value indicates a higher antioxidant activity of propolis [].
Generally, protected areas exhibited lower IC50 values, demonstrating better antioxidant capacity compared to mining zones. These results suggest that environmental factors, such as heavy metal exposure in mining regions, may reduce the bioactive potential of propolis.
Table 3 shows the concentrations of heavy metals (toxic) in propolis samples collected from the investigated areas—mining areas and protected areas.
Table 3.
Evaluation of toxic metal concentrations in the propolis samples.
The analysis of toxic metals in propolis from the investigated regions reveals notable variations in contamination levels. Lead concentrations were highest in AB1 (9.27 mg·kg−1), a mining area, indicating significant contamination. In contrast, AB2 (protected area) showed much lower levels (0.97 mg·kg−1), demonstrating a cleaner environment. Other mining zones such as HD1 (7.05 mg·kg−1) and CS1 (5.12 mg·kg−1) also exhibited high lead levels, while protected areas like HD2 (0.77 mg·kg−1), MM2 (0.62 mg·kg−1), and CS2 (0.95 mg·kg−1) had lower concentrations, aligning with the expected trend of lower contamination levels in protected zones.
Similarly, for cadmium, the highest levels were found in AB1 (0.17 mg·kg−1), once again reflecting the impact of mining. AB2 showed the lowest levels (0.04 mg·kg−1), reinforcing the idea of protected areas having fewer contaminants. HD1 (0.14 mg·kg−1), MM1 (0.11 mg·kg−1), and CS1 (0.09 mg·kg−1) displayed moderate cadmium concentrations, while the lowest values were observed in HD2 (0.07 mg·kg−1) and MM2 (0.03 mg·kg−1).
Arsenic contamination was highest in the AB1 mining areas (0.87 mg·kg−1) and lower in AB2 (0.30 mg·kg−1), which is a protected area. HD1 (0.58 mg·kg−1) and CS1 (0.71 mg·kg−1) also showed moderate levels of arsenic, while HD2 (0.17 mg·kg−1) and MM2 (0.09 mg·kg−1) had the lowest concentrations, indicating the cleaner environment of protected regions.
Finally, the chromium levels were highest in HD1 (7.01 mg·kg−1), followed by CS1 (5.04 mg·), MM1 (2.80 mg·kg−1), and AB1 (2.04 mg·kg−1), showing that mining areas contributed to high chromium contamination. In contrast, the protected zones, including AB2 (0.06 mg·kg−1) and MM2 (0.05 mg·kg−1), had much lower chromium levels.
The data show that mining zones are significantly more contaminated with heavy metals such as lead, cadmium, arsenic, and chromium. In contrast, protected and natural areas exhibit much lower levels of these toxic metals.
Table 4 presents the concentrations of essential metals in propolis samples, such metals being beneficial in small amounts but possibly becoming harmful if their concentrations exceed certain limits.
Table 4.
Evaluation of essential metal concentrations in propolis samples.
The analysis of essential metals in propolis reveals notable variations between the mining and protected areas. Iron concentrations were highest in MM1 (150.43 mg·kg−1), a mining zone, followed by HD1 (102.26 mg·kg−1). AB1 also showed a relatively high iron content (95.73 mg·kg−1), while lower values were recorded in all protected areas. For manganese, CS1 (25.43 mg·kg−1) exhibited the highest concentration. In contrast, protected zones like AB2 (1.30 mg·kg−1) and MM2 (1.69 mg·kg−1) had much lower manganese levels. Copper levels were highest in HD1 (6.00 mg·kg−1), followed by AB1 (4.99 mg·kg−1) and CS1 (5.40 mg·kg−1). Protected areas like AB2 (2.20 mg·kg−1) and CS2 (1.19 mg·kg−1) showed significantly lower concentrations of copper. Finally, for zinc, the highest concentration was found in MM1 (3.28 mg·kg−1). In contrast, protected areas AB2 (1.56 mg·kg−1) and CS2 (1.65 mg·kg−1) showed relatively low zinc levels.
The results suggest that, while mining zones tend to have higher concentrations of essential metals, protected areas show significantly lower levels.
3.2. Microbiological Analysis of Propolis
Table 5 shows the diameters of the inhibition zones for the propolis samples from the mining areas and preserved areas in Romania against bacterial strains.
Table 5.
Antimicrobial activity of propolis samples against selected bacterial strains—inhibition zone diameter (mm).
The inhibition zone diameters of propolis samples for different bacterial strains, compared with Ciprofloxacin (5 µg) as the standard antibiotic, reveal interesting trends. For S. aureus, the inhibition zones ranged from 24 mm to 30 mm, with the highest effectiveness observed in the protected areas AB2 and CS2 (both 30 mm). Propolis samples from mining areas, such as AB1 and HD1, showed slightly smaller zones, ranging from 24 mm to 26 mm.
For E. coli, the inhibition zones varied between 24 mm and 32 mm. AB2 showed the largest zone (32 mm), while CS1 and MM1 had smaller zones (24 mm and 26 mm). The inhibition diameter of Ciprofloxacin was 29 mm, while in some samples collected from protected areas, this value was higher (30 mm or 32 mm).
In the case of P. aeruginosa, inhibition zones ranged from 24 mm to 30 mm, with HD2 showing the largest zone at 30 mm, followed by MM2 and CS2 (28 mm and 29 mm, respectively). Propolis samples from mining areas, such as AB1 and MM1, had smaller zones, indicating less effective antimicrobial properties.
For E. faecalis, the inhibition zones ranged from 25 mm to 29 mm, with AB2 showing the largest zones (29 mm), while AB1 had a slightly smaller zone (28 mm). The Ciprofloxacin inhibition zone was 27 mm, which aligns with the effectiveness of propolis from certain mining and protected areas.
Finally, for S. mutans, the inhibition zones varied from 21 mm to 26 mm, with the largest zones observed in CS2 and HD2 (both 26 mm), while the smallest was recorded in HD1 (21 mm). This indicates that some propolis samples, particularly those from protected areas, are more effective against S. mutans than others.
Propolis from protected areas such as AB2, CS2, and HD2 generally demonstrated larger inhibition zones across a range of microbial strains, suggesting stronger antimicrobial properties compared to samples from mining areas like AB1 and MM1.
Table 6 shows the diameters of the inhibition zone for the propolis samples from the mining areas and preserved areas in Romania against fungal strains.
Table 6.
Antimicrobial activity of propolis samples against selected fungal strains—inhibition zone diameter (mm).
The diameters of the inhibition zones of the propolis samples with respect to various fungal strains, when compared with Voriconazole (1 µg) as the standard antifungal, provide insights into the antimicrobial properties of propolis from different regions. Here is a summary of the results.
For C. albicans, the inhibition zones ranged from 18 mm to 22 mm, with the highest zones recorded in AB2 and CS2 (both 22 mm). The smallest zones were observed in AB1 and CS1, with diameters of 18 mm and 19 mm, respectively. Voriconazole showed a significant inhibition zone of 37 mm, indicating that it was more effective than the propolis samples.
In the case of A. niger, the diameter of the inhibition zones ranged from 16 mm to 26 mm, with CS2 showing the largest zone (26 mm) and AB1 showing the smallest (16 mm). Voriconazole had the largest inhibition zone at 45 mm, suggesting that it is considerably more effective than the propolis samples.
For A. flavus, the diameter of the inhibition zones ranged from 18 mm to 27 mm, with CS2 showing the largest zone (27 mm) and HD1 and HD2 the smallest (18 mm). Again, Voriconazole had a larger zone of 43 mm, indicating that it is more potent than the propolis samples.
Regarding C. neoformans, the inhibition zones varied between 15 mm and 21 mm, with the largest zones observed in HD2 (21 mm). Voriconazole demonstrated a significant inhibition zone of 39 mm, which was larger than that of the propolis samples.
For P. chrysogenum, the inhibition zones ranged from 17 mm to 27 mm, with the highest zone observed in AB2 and CS2 (both 27 mm). The lowest zone was in MM1 (17 mm). Voriconazole showed the smallest inhibition zone for this strain, at 18 mm, which indicates that, in this case, propolis samples from almost all areas performed similarly to or better than Voriconazole.
Overall, protected areas like AB2, CS2, and HD2 generally demonstrated larger inhibition zones against the fungal strains, suggesting a stronger antifungal activity compared to samples from mining areas like AB1 and MM1.
4. Discussion
In Romania and worldwide, the number of threats faced by bees is increasing, particularly from diseases, pathogens, and environmental pollution, including heavy metal contamination of both natural and anthropogenic sources []. Natural sources include processes such as rock degradation, volcanic eruptions, and soil formation []. Particularly in mining areas, bees are exposed to various toxic substances that enter their system []. Furthermore, the level of environmental contamination increases year by year, thus disrupting ecological balance.
Bees are excellent indicators of environmental pollution due to the fact that they obtain raw materials from a limited area of 2–3 km around the hive. In addition, their bodies are covered with hairs that capture various particles, thereby enhancing direct interaction with their surrounding environment [].
The existing literature emphasizes the use of propolis as a natural indicator of pollution in mining areas, showcasing its ability to detect contaminants like heavy metals and pesticides []. Propolis, due to its ability to absorb pollutants from the environment, has been studied as a bioindicator for environmental quality assessments, particularly in areas affected by mining activities [].
Formicki et al. [] showed that propolis and pollen from certain areas were significantly contaminated with lead. Popov et al. [] demonstrated a connection between the metal content of the soil and propolis samples from four locations in Macedonia. Anthropogenic activities, such as mining, have a significant impact on the local flora, causing heavy metal accumulation in the soil and vegetation. This indirectly affects bees and their byproducts, such as honey and propolis, through the contamination of pollen and nectar [].
In polluted industrial regions of Poland, the average concentrations of zinc, copper, lead, arsenic, and cadmium have been estimated at 56.28, 7.12, 6.91, 0.745, and 0.218 mg·kg−1, respectively []. The values align with the findings from our research conducted in polluted mining areas. On the other hand, Hodel et al. [] did not identify cadmium in Brazilian propolis but only lead (0.006–0.72 µg·g−1), arsenic (0.048–8.47 µg·g−1), and copper (0.57–11.6 µg·g−1). These values are significantly lower than those obtained in our studies, even for protected areas, suggesting mild anthropogenic or natural pollution in these regions as well. Propolis serves as a valuable bioindicator of environmental pollution due to its ability to accumulate trace metals from the surrounding ecosystem. While arsenic (with concentrations between 0.007 and 1.806 mg·kg−1) can originate from natural sources such as volcanic soils and groundwater, elevated levels indicate contamination from metallurgical and chemical industries []. Comparable findings were reported in propolis samples from the Opole and LGOM areas, with average concentrations of 0.561 and 0.670 mg·kg−1, respectively []. This contamination correlates with high arsenic accumulation in the soil, reaching up to 2500 mg·kg−1 in industrial zones [].
Cadmium concentrations varied between 0.006 and 0.811 mg·kg−1, with an average of 0.203 mg·kg−1. As a toxic heavy metal primarily linked to industrial activities, pesticide use, and soil contamination, cadmium presence in propolis reflects environmental pollution []. Previous studies have reported lower cadmium levels (0.043–0.116 mg·kg−1) in copper industry regions but significantly higher values (0.513–0.795 mg·kg−1) in cement industry areas. Further research in the Wałbrzych region indicates cadmium concentrations averaging 0.260 mg·kg−1 []. Cadmium values range from a minimum of 5.99 µg·kg−1 to a maximum of 336 µg·kg−1, with an average value of approximately 60.2 µg·kg−1 [].
Copper, an essential element for bee metabolism, exhibited concentrations ranging from 1.09 to 18.32 mg·kg−1, with an average of 8.94 mg·kg−1. Copper plays a crucial role in enzymatic reactions and antioxidant mechanisms; however, excessive amounts may result from industrial pollution and become toxic. Roman [] reported significantly higher copper levels in propolis from Głogów, ranging from 23.51 to 34.15 mg·kg−1, while Dogan et al. [] observed even greater concentrations (45–96 mg·kg−1) in Turkish propolis. Soós et al. [], in their research, found an average copper concentration of 2.91 mg·kg−1, with a range from 0.713 to 17.4 mg·kg−1.
Lead, one of the most toxic heavy metals, was detected in propolis with concentrations ranging from 0.39 to 18.29 mg·kg−1, averaging 6.54 mg·kg−1. Lead pollution is commonly linked to industrial emissions, road traffic, and soil contamination. The present findings align with previous studies, where Roman [] observed mean lead concentrations of 18.39 mg·kg−1 in propolis from Głogów and 6.73–17.83 mg·kg−1 in Rudna. Similar results were recorded in Opole, where lead levels varied between 6.62 and 13.63 mg·kg−1, confirming that lead contamination in propolis remains consistently high [].
Zinc concentrations ranged from 10.91 to 115.22 mg·kg−1, with an average of 55.79 mg·kg−1. Zinc is essential for bees, contributing to immunity and enzymatic functions. Although less toxic than lead or cadmium, excessive zinc levels may indicate industrial pollution and disrupt bee metabolism. The concentration of zinc ranges from a minimum value of 16.1 mg·kg−1 to a maximum value of 2260 mg·kg−1, with an average of approximately 171.5 mg·kg−1 [].
The average iron concentration is 263.64 mg·kg−1, with a range of 36.8–706 mg·kg−1, while for chromium the range is 0.223–4.920 mg·kg−1, with an average value of 1.091. For manganese, the minimum is 0.887 mg·kg−1, the maximum is 19.0 mg·kg−1, and the average is 6.99 mg·kg−1 [].
Regarding antimicrobial activity, previous studies have shown that strain types and the types of bee product exert influence on the diameter of inhibition zones []. Thus, the chemical composition and quality of these products can influence their antimicrobial activity. It has been demonstrated that there is a correlation between the antimicrobial activity of propolis samples and their flavonoid and phenolic compound content [].
The relationship between chemical parameters and antimicrobial activity was assessed through statistical analysis, providing a deeper understanding of the correlations and their potential significance. A Pearson’s correlation analysis was conducted to assess the relationship between the total phenol and flavonoid content of each propolis sample from both mining and protected areas and their inhibition zone diameter values. The results are presented in Table 7 and Table 8.
Table 7.
Pearson’s correlation coefficients and significance for flavonoid and phenol content vs. antibacterial activity in propolis from mining and preserved areas.
Table 8.
Pearson’s correlation coefficients and significance for flavonoid and phenol content vs. antifungal activity in propolis from mining and preserved areas.
The data presented in Table 7 reveal the comparative Pearson’s correlation coefficients (r—absolute value) for the association between flavonoid and phenol content in propolis samples from mining and preserved areas and their antibacterial activity against different bacterial strains. At the same time, the table indicates the direction of significance and the interpretation of the correlation coefficient r.
For S. aureus, in the mining area, there is a negative correlation between flavonoids and the bacterium. However, the phenolic content has a moderate positive correlation (r = 0.48). In the preserved area, flavonoids show a strong positive correlation with S. aureus (r = 0.71). In the preserved area, flavonoids show a weak negative correlation, while phenols exhibit a moderate positive correlation (r = 0.44), suggesting that phenols play a more significant role in inhibiting E. coli in the preserved area. For P. aeruginosa, phenols have a moderate positive correlation (r = 0.32). For E. faecalis, in the preserved area, phenols show a stronger positive correlation (r = 0.66). For S. mutans, in the mining area, phenols show a stronger negative correlation.
In the mining areas, flavonoids generally show weak-to-negative correlations with bacterial inhibition [], while phenols tend to have weak or moderate positive correlations, especially against S. aureus and P. aeruginosa []. In the preserved areas, flavonoids show positive correlations with bacterial inhibition, particularly against S. aureus, while phenols have stronger positive correlations, especially against E. faecalis [].
Table 8 shows the comparative Pearson’s correlation coefficients (r) for the association between flavonoid and phenol content in propolis samples and antifungal activity in both the mining and preserved areas.
For C. albicans, the mining areas show a strong positive correlation (r = 0.97) between flavonoids and the fungus. In the preserved areas, flavonoids and phenols have a good positive correlation (r = 0.74 and r = 0.94). For A. niger, the mining areas reveal a moderate positive correlation with phenols (r = 0.72). In the preserved areas, flavonoids have a very strong positive correlation (r = 0.92), and phenols show a strong positive correlation (r = 0.72), indicating that both compounds are significantly involved in inhibiting this fungus. For A. flavus, in the preserved areas, flavonoids exhibit a strong positive correlation (r = 0.86), while phenols show a moderate positive correlation (r = 0.58). For C. neoformans, in the mining areas, flavonoids have a moderate positive correlation (r = 0.68). For P. chrysogenum, the mining areas show a strong negative correlation with flavonoids and a very strong positive correlation with phenols (r = 0.82). In the preserved areas, flavonoids show a moderate positive correlation (r = 0.68), while phenols show a weak positive correlation.
Flavonoids generally show stronger correlations with fungal inhibition in the preserved areas, especially against C. albicans and A. niger, while phenols tend to show stronger effects in the mining areas, particularly against P. chrysogenum [].
Table 9 presents the Pearson’s correlation coefficients (r) for the association between the flavonoid and phenol content and the antioxidant activity of propolis and its metal and metalloid content.
Table 9.
Pearson’s correlation coefficients and significance for the relationship between biological activity and metal content in propolis samples.
Comparing the values for the mining areas and the protected areas based on the relationship among metal cations, the content of phenols and flavonoids, and the antioxidant capacity (IC50), we observe significant differences that reflect the influence of pollution on the synthesis of bioactive compounds. In the mining areas, high concentrations of heavy metals negatively affect both the synthesis of flavonoids and the antioxidant capacity, especially in the case of cadmium and lead.
On the other hand, in the protected (unpolluted) areas, metal cations have a much more favorable impact on bioactive compounds. In the case of lead, positive correlations were recorded with both phenols (r = 0.92) and flavonoids (r = 0.73), without significantly affecting antioxidant capacity. Similarly, arsenic and zinc show significant positive correlations with phenols and flavonoids (r above 0.85 in both cases).
Iron and manganese have lower positive correlations with phenols and flavonoids, and the antioxidant capacity is slightly reduced in their presence (IC50 r = 0.86 for Fe and r = −0.23 for Mn). Thus, in the protected areas, heavy metals influence the synthesis of phenols and flavonoids in a much more balanced manner, generally contributing to the maintenance of good antioxidant activity. Unlike the mining areas, where negative effects predominate, here positive correlations prevail, especially in the case of lead, arsenic, and zinc [].
Studies suggest that some essential metals in propolis, such as zinc, copper, and iron, can impact its antioxidant activity. The relationship between the content of essential and toxic metals and the biological activity of propolis is influenced by the type of metals and their concentrations. These metals are involved in biochemical processes that can modulate the antioxidant activity of propolis, for example, by forming metal–phenol complexes that can enhance the ability to neutralize free radicals. At the same time, an excessive content of heavy metals can negatively affect the antioxidant activity of propolis and even become toxic [].
Table 10 and Table 11 present the Pearson’s correlation coefficients (r) for the association between the metal and metalloid content and the inhibition of different bacterial strains from mining and protected areas.
Table 10.
Pearson’s correlation coefficients and significance for the relationship between inhibition zone diameter values and metal content in propolis samples from mining areas.
Table 11.
Pearson’s correlation coefficients and significance for the relationship between inhibition zone diameter values and metal content in propolis samples from protected areas.
The correlation between the inhibition of different bacterial strains and heavy metal content reflects how bacteria are influenced by metal pollutants in mining or polluted environments.
Bacteria from mining areas are differently influenced by heavy metals, with each strain showing specific responses that suggest adaptability or inhibition depending on the metal present and its concentration [].
In protected areas, the correlation values between bacterial strain inhibition and heavy metal content reflect different dynamics compared to what is observed in mining areas. In protected environments, the concentrations of heavy metals are generally lower, and bacteria are not exposed to the same toxic stress. This can be seen in the correlation patterns, where some bacteria exhibit increased tolerance, while others show fewer negative interactions.
Table 12 and Table 13 present the Pearson’s correlation coefficients for the relationship between fungal strains and metal content in propolis samples from mining areas and protected areas, respectively.
Table 12.
Pearson’s correlation coefficients and significance for the relationship between inhibition zone diameter values for fungal strains and metal content in propolis samples from mining areas.
Table 13.
Pearson correlation’s coefficients and significance for the relationship between inhibition zone diameter values for fungal strains and metal content in propolis samples from protected areas.
In the mining areas, the correlation analysis regarding the inhibition of fungal species by heavy metals shows a different response compared to that obtained with respect to bacteria. Fungi such as C. albicans, A. niger, and P. chrysogenum exhibit various mechanisms of adaptation and tolerance to heavy metals. These correlations can provide insights into their potential use for bioremediation in such environments.
C. albicans shows strong negative correlations with Pb, Cd, As, Mn, and Cu, and positive correlations with Cr and Fe. A. niger exhibits a strong negative correlation with Pb and Cd. A. flavus shows a positive correlation with As (r = 0.58) and also with Mn (r = 0.67), indicating potential adaptation to this metal.
C. neoformans presents positive correlations with Fe (r = 0.84) and Zn (r = 0.82), suggesting high adaptability. Unlike the other fungal species, P. chrysogenum displays positive correlations with Pb, Cd, As, Mn, and Cu, indicating high tolerance to these metals.
In the protected areas, the correlation values for the inhibition of fungal species show a different interaction with heavy metals compared to that observed in the mining areas, highlighting the more favorable conditions and lower pollutant levels in these environments. Fungi such as C. albicans and A. niger seem to be better adapted to clean environments, maintaining strong positive correlations with certain essential metals, while C. neoformans shows a different sensitivity.
C. albicans shows strong positive correlations with Pb, As, Zn, Cr, and Fe, indicating a favorable influence on its development at the low concentrations found in the protected areas. A. niger shows positive correlations with Pb, As, Cr, Fe, and Mn, indicating high adaptability to these metals. A. flavus shows significant positive correlations with Pb, As, Zn, Cr, and Fe.
Unlike the other species, C. neoformans shows negative correlations with most metals, indicating high sensitivity to these metals. P. chrysogenum shows moderate positive correlations with Pb, As, Cr, Cu, and Zn, indicating good tolerance. Fe and Mn have high positive correlations, suggesting excellent adaptation to the presence of these metals.
5. Conclusions
Propolis is an efficient natural bioindicator, capable of indicating the presence and level of heavy metal contamination in mining areas. The highest concentrations of heavy metals were recorded in intensively exploited mining areas such as Roșia Montană, Certeju de Sus, Băile Borșa, and Moldova Nouă. Comparing samples from the investigated mining areas with those from protected areas highlighted a significant impact of human activities on heavy metal contamination.
The comparative analysis of propolis samples from mining and protected areas revealed significant differences in chemical composition, biological activity, and heavy metal contamination. Propolis from protected areas had a higher content of phenolic compounds and flavonoids, thus demonstrating superior antioxidant capacity compared to samples from mining areas. The results highlight that environmental factors may reduce the bioactive potential of propolis from mining-affected regions.
Microbiological analysis demonstrated that propolis from protected areas exhibited stronger antimicrobial activity against bacteria and fungi compared to samples from mining areas.
The study confirms that propolis from protected areas presents superior quality, both chemically and microbiologically. It has a higher content of bioactive compounds and lower contamination levels, demonstrating stronger antioxidant and antimicrobial activity. In contrast, propolis from mining areas is affected by heavy metal contamination, significantly reducing its therapeutic potential. The results emphasize the importance of environmental conservation and natural resource protection in obtaining high-quality propolis with potential health benefits.
Author Contributions
Conceptualization, M.G. and M.L.V.; methodology, M.G.; software, M.T.C.; validation, M.L.V., I.G. and M.G.; formal analysis, I.G.; investigation, M.G.; resources, M.T.C.; data curation, M.P.; writing—original draft preparation, M.G.; writing—review and editing, M.T.C.; visualization, M.L.V.; supervision, M.P.; project administration, M.P.; funding acquisition, M.T.C. All authors have read and agreed to the published version of the manuscript.
Funding
This research received no external funding.
Data Availability Statement
The original contributions presented in this study are included in the article. Further inquiries can be directed to the corresponding author.
Acknowledgments
We would like to thank the beekeepers who donated the propolis samples for their outstanding support during this research project. We are grateful to the students of “1 Decembrie 1918” University of Alba Iulia who contributed to the success of this research, helping facilitate laboratory analyses.
Conflicts of Interest
The authors declare no conflicts of interest.
References
- Celli, G.; Maccagnani, B. Honey bees as bioindicators of environmental pollution. Bull. Insectology 2003, 56, 137–139. [Google Scholar]
- Cunningham, M.M.; Tran, L.; McKee, C.G.; Ortega Polo, R.; Newman, T.; Lansing, L.; Griffiths, J.S.; Bilodeau, G.J.; Rott, M.; Guarna, M.M. Honey bees as biomonitors of environmental contaminants, pathogens, and climate change. Ecol. Indic. 2022, 134, 108457. [Google Scholar] [CrossRef]
- Durazzo, A.; Lucarini, M.; Plutino, M.; Lucini, L.; Aromolo, R.; Martinelli, E.; Souto, E.B.; Santini, A.; Pignatti, G. Bee Products: A Representation of Biodiversity, Sustainability, and Health. Life 2021, 11, 970. [Google Scholar] [CrossRef]
- de Jongh, E.J.; Harper, S.L.; Yamamoto, S.S.; Wright, C.J.; Wilkinson, C.W.; Ghosh, S.; Otto, S.J.G. One Health, One Hive: A scoping review of honey bees, climate change, pollutants, and antimicrobial resistance. PLoS ONE 2022, 17, e0242393. [Google Scholar] [CrossRef]
- Wagh, V.D. Propolis: A wonder bees product and its pharmacological potentials. Adv. Pharmacol. Sci. 2013, 2013, 308249. [Google Scholar] [CrossRef] [PubMed]
- Horváth, G.; Farkas, Á.; Papp, N.; Bencsik, T.; Ács, K.; Gyergyák, K.; Kocsis, B. Chapter 3—Natural Substances from Higher Plants as Potential Anti-MRSA Agents; Rahman, A., Ed.; Studies in Natural Products Chemistry; Elsevier: Amsterdam, The Netherlands, 2016; Volume 47, pp. 63–110. [Google Scholar] [CrossRef]
- Kurek-Górecka, A.; Rzepecka-Stojko, A.; Górecki, M.; Stojko, J.; Sosada, M.; Świerczek-Zięba, G. Structure and Antioxidant Activity of Polyphenols Derived from Propolis. Molecules 2014, 19, 78–101. [Google Scholar] [CrossRef] [PubMed]
- Conti, M.E.; Astolfi, M.L.; Mele, G.; Ristorini, M.; Vitiello, G.; Massimi, L.; Canepari, S.; Finoia, M.G. Performance of bees and beehive products as indicators of elemental tracers of atmospheric pollution in sites of the Rome province (Italy). Ecol. Indic. 2022, 140, 109061. [Google Scholar] [CrossRef]
- Silva, A.S.; Araújo, A.B.; Souza, S.C.; Santos, E.; Silva, F.A. Study of the Cu, Mn, Pb and Zn dynamics in soil, plants and bee pollen from the region of Teresina (PI), Brazil. An. Acad. Bras. Ciênc. 2012, 84, 881–889. [Google Scholar] [CrossRef]
- Popa, M.; Corches, M.; Popa, D.; Glevitzky, M. Educating Future Engineers for the Prevention of Heavy Metals Contamination of Surface Waters in Mining Areas. The Case of Zlatna, Alba County. Procedia Soc. Behav. Sci. 2013, 83, 408–412. [Google Scholar] [CrossRef]
- Dehkordi, M.M.; Nodeh, Z.P.; Dehkordi, K.S.; Salmanvandi, H.; Khorjestan, R.R.; Ghaffarzadeh, M. Soil, air, and water pollution from mining and industrial activities: Sources of pollution, environmental impacts, and prevention and control methods. Results Eng. 2024, 23, 102729. [Google Scholar] [CrossRef]
- Dumitrel, G.A.; Popa, M.; Glevitzky, M.; Vica, M.L.; Todoran, A. Evaluation of Soil Heavy Metal Pollution in the Zlatna Region. J. Environ. Prot. Ecol. 2013, 14, 1569–1576. [Google Scholar]
- González-Martín, M.I.; Escuredo, O.; Revilla, I.; Vivar-Quintana, A.M.; Coello, M.C.; Riocerezo, C.P.; Moncada, G.W. Determination of the Mineral Composition and Toxic Element Contents of Propolis by Near Infrared Spectroscopy. Sensors 2015, 15, 27854–27868. [Google Scholar] [CrossRef] [PubMed]
- Murashova, E.A.; Tunikov, G.M.; Nefedova, S.A.; Karelina, O.A.; Byshova, N.G.; Serebryakova, O.V. Major factors determining accumulation of toxic elements by bees and honey products. Int. Transact. J. Eng. Mana. Appl. Sci. Technol. 2020, 11, 11A03N. [Google Scholar] [CrossRef]
- Balali-Mood, M.; Naseri, K.; Tahergorabi, Z.; Khazdair, M.R.; Sadeghi, M. Toxic Mechanisms of Five Heavy Metals: Mercury, Lead, Chromium, Cadmium, and Arsenic. Front. Pharmacol. 2021, 12, 643972. [Google Scholar] [CrossRef]
- Roman, A.; Popiela, E.; Dobrzansk, Z. The Propolis as a Bioindicator of Environmental Heavy Metals Pollution. Available online: https://www.cabidigitallibrary.org/doi/pdf/10.5555/20113298458 (accessed on 6 March 2025).
- Formicki, G.; Greń, A.; Stawarz, R.; Zyśk, B.; Gał, A. Metal Content in Honey, Propolis, Wax, and Bee Pollen and Implications for Metal Pollution Monitoring. Pol. J. Environ. Stud. 2013, 22, 99–106. [Google Scholar]
- Tosic, S.; Stojanovic, G.; Mitic, S.; Pavlovic, A.; Alagic, S. Mineral composition of selected serbian propolis samples. J. Apic. Sci. 2017, 61, 5–15. [Google Scholar] [CrossRef]
- Vakhonina, E.A.; Lapynina, E.P.; Lizunova, A.S. Study of toxic elements in propolis. IOP Conf. Ser. Earth Environ. Sci. 2021, 845, 012122. [Google Scholar] [CrossRef]
- Saeed, F.; Ahmad, R.S.; Arshad, M.U.; Niaz, B.; Batool, R.; Naz, R.; Ansar Rasul Suleria, H. Propolis to curb lifestyle related disorders: An overview. Int. J. Food Prop. 2016, 19, 420–437. [Google Scholar] [CrossRef]
- Vică, M.L.; Glevitzky, M.; Heghedűş-Mîndru, R.C.; Glevitzky, I.; Matei, H.V.; Balici, S.; Popa, M.; Teodoru, C.A. Potential Effects of Romanian Propolis Extracts against Pathogen Strains. Int. J. Environ. Res. Public Health 2022, 19, 2640. [Google Scholar] [CrossRef]
- Vică, M.L.; Glevitzky, M.; Dumitrel, G.-A.; Bostan, R.; Matei, H.V.; Kartalska, Y.; Popa, M. Qualitative Characterization and Antifungal Activity of Romanian Honey and Propolis. Antibiotics 2022, 11, 1552. [Google Scholar] [CrossRef]
- Curifuta, M.; Vidal, J.; Sánchez-Venegas, J.; Contreras, A.; Salazar, L.A.; Alvear, M. The in vitro antifungal evaluation of a commercial extract of Chilean propolis against six fungi of agricultural importance. Agric. Nat. Resour. 2012, 39, 347–359. [Google Scholar] [CrossRef]
- Dumitrel, G.A.; Glevitzky, M.; Popa, M.; Vică, M.L. Studies regarding the heavy metals pollution of streams and rivers in Rosia Montana Area, Romania. J. Environ. Prot. Ecol. 2015, 16, 850–860. [Google Scholar]
- Zobrist, J.; Sima, M.; Dogaru, D.; Senila, M.; Yang, H.; Popescu, C.; Roman, C.; Bela, A.; Frei, L.; Dold, B.; et al. Environmental and socioeconomic assessment of impacts by mining activities—A case study in the Certej River catchment, Western Carpathians, Romania. Environ. Sci. Pollut. Res. 2009, 16, 14–26. [Google Scholar] [CrossRef] [PubMed]
- Fodor, D.; Georgescu, M. Romanian Mining—Past, Present and a Possible Future. Min. Rev. 2023, 29, 67–79. [Google Scholar] [CrossRef]
- Radu, V.M.; Vîjdea, A.M.; Ivanov, A.A.; Alexe, V.E.; Dincă, G.; Cetean, V.M.; Filiuță, A.E. Research on the Closure and Remediation Processes of Mining Areas in Romania and Approaches to the Strategy for Heavy Metal Pollution Remediation. Sustainability 2023, 15, 15293. [Google Scholar] [CrossRef]
- Cobârzan, B. Environmental rehabilitation of closed mines. A case study on Romania. Transylv. Rev. Adm. Sci. 2008, 4, 34–43. [Google Scholar]
- Ciugudean, H. Ancient gold minning in Transylvania: The Roşia Montană—Bucium area. Caiete ARA 2012, 3, 101–178. [Google Scholar]
- Wollmann, V. The Development of Mining Technology in the Cărăşeni Mountains in the Second Half of the 18th Century; Muzeul Judeţean Reşiţa Publishing House: Reșița, Romania, 1971; pp. 197–216. (In Romanian) [Google Scholar]
- Birou, V. The mining exploitation in the Caraș Mountains in the 18th century as seen by foreign researchers. Stud. Și Artic. Istor. SAI 1957, 2, 157–178. (In Romanian) [Google Scholar]
- Drăgan, A.; Crețan, R.; Jucu, I.S.; Hrițcu, A.A. Revitalizing post-communist urban industrial areas: Divergent narratives in the imagining of copper mine reopening and tourism in a Romanian town. Cities 2024, 154, 105379. [Google Scholar] [CrossRef]
- Government of Romania. Order No. 1.158 of 24 June 2016 on the Approval of the Management Plan and Regulation for Natura 2000 Sites ROSCI0085 Frumoasa and ROSPA0043 Frumoasa; Ministry of Environment, Waters and Forests: Bucharest, Romania, 2016. Published in Official Gazette No. 681 of 2 September 2016. (In Romanian)
- Government of Romania. Order No. 307 of 1 April 2019 on the Approval of the Management Plan and Regulation for Rodna Mountains National Park, ROSCI0125 Rodna Mountains, ROSPA0085 Rodna Mountains, and Other Nationally Protected Natural Areas; Ministry of Environment: Bucharest, Romania, 2019. Published in Official Gazette No. 349 of 7 May 2019. (In Romanian)
- Government of Romania. Decision No. 1.048 of 11 December 2013 on the Approval of the Management Plan and Regulation for the Iron Gates Natural Park; Government of Romania: Bucharest, Romania, 2013. Published in Official Gazette No. 119 of 18 February 2014. (In Romanian)
- National Agency for Protected Natural Areas (ANANP). President’s Note No. 2411/19.04.2021 on the Approval of the Minimum Set of Measures for the Conservation of Biological Diversity, as Well as the Conservation of Natural Habitats, Wild Flora and Fauna, Public Safety, and Investments in ROSCI Munții Metaliferi; ANANP: Bucharest, Romania, 2021. Available online: https://ananp.gov.ro/wp-content/uploads/ROSCI0325-SKM_28722030314270.V.pdf (accessed on 2 February 2025). (In Romanian)
- Finger, D.; Filho, I.K.; Torres, Y.R.; Quináia, S.P. Propolis as an indicator of environmental contamination by metals. Bull. Environ. Contam. Toxicol. 2014, 92, 259–264. [Google Scholar] [CrossRef]
- Russian Federation—Technical Regulations of the Russia-Kazakhstan-Belarus Customs Union TR CU 021/2011 on Food Safety. Available online: https://www.rustandard.com/images/CU_TR/TR_CU_021.2011_Safety_of_Food_Products.pdf (accessed on 3 March 2025).
- Singleton, V.L.; Orthofer, R.; Lamuela-Raventós, R.M. Analysis of total phenols and other oxidation substrates and antioxidants by means of Folin-Ciocalteu reagent. Methods Enzymol. 1999, 29, 10–18. [Google Scholar]
- Woisky, R.G.; Salatino, A. Analysis of propolis: Some parameters and procedures for chemical quality control. J. Apic. Res. 1998, 37, 99–105. [Google Scholar]
- Alothman, M.; Bhat, R.; Karim, A.A. Antioxidant capacity and phenolic content of selected tropical fruits from Malaysia, extracted with different solvents. Food Chem. 2009, 115, 785–788. [Google Scholar]
- Chang, C.C.; Yang, M.H.; Wen, H.M.; Chern, J.K. Estimation of Total Flavonoid Content in Propolis by Two Complementary Colorimetric Methods. J. Food Drug Anal. 2002, 10, 178–182. [Google Scholar]
- Mărghitas, L.A.; Dezmirean, D.; Moise, A.; Mihai, C.; Laslo, L. DPPH method for evaluation of propolis antioxidant activity. Bull. Univ. Agric. Sci. 2009, 66, 253–258. [Google Scholar]
- Popova, M.; Bankova, V.; Butovska, D.; Petkov, V.; Nikolova-Damyanova, B.; Sabatini, A.G.; Marcazzan, G.L.; Bogdanov, S. Validated methods for the quantification of biologically active constituents of poplar type propolis. Phytochem. Anal. 2004, 15, 235–240. [Google Scholar]
- Vica, M.L.; Glevitzky, I.; Glevitzky, M.; Siserman, C.V.; Matei, H.V.; Teodoru, C.A. Antibacterial Activity of Propolis Extracts from the Central Region of Romania against Neisseria gonorrhoeae. Antibiotics 2021, 10, 689. [Google Scholar] [CrossRef]
- Clinical and Laboratory Standard Institute. Performance Standards for Antimicrobial Susceptibility Testing. 2020. Available online: https://clsi.org/media/3481/m100ed30_sample.pdf (accessed on 27 January 2025).
- Rivero-Cruz, J.F.; Granados-Pineda, J.; Pedraza-Chaverri, J.; Pérez-Rojas, J.M.; Kumar-Passari, A.; Diaz-Ruiz, G.; Rivero-Cruz, B.E. Phytochemical Constituents, Antioxidant, Cytotoxic, and Antimicrobial Activities of the Ethanolic Extract of Mexican Brown Propolis. Antioxidants 2020, 9, 70. [Google Scholar] [CrossRef]
- Gekière, A.; Vanderplanck, M.; Michez, D. Trace metals with heavy consequences on bees: A comprehensive review. Sci. Total Environ. 2023, 895, 165084. [Google Scholar] [CrossRef]
- Roozbahani, M.M.; Sobhanardakani, S.; Karimi, H.; Sorooshnia, R. Natural and Anthropogenic Source of Heavy Metals Pollution in the Soil Samples of an Industrial Complex; a Case Study. Iran. J. Toxicol. 2015, 9, 1336–1341. [Google Scholar]
- Encerrado-Manriquez, A.M.; Pouv, A.K.; Fine, J.D.; Nicklisch, S.C.T. Enhancing knowledge of chemical exposures and fate in honey bee hives: Insights from colony structure and interactions. Sci. Total Environ. 2024, 916, 170193. [Google Scholar] [CrossRef] [PubMed]
- Santos, L.F.; Silva, A.S.; Correia, C.R.; Mano, J.F. Physical immobilization of particles inspired by pollination. Proc. Natl. Acad. Sci. USA 2019, 116, 5405–5410. [Google Scholar] [CrossRef]
- Balderrama-Carmona, A.P.; Ramos-García, V.; Ruiz-López, L.; Felipe-Ortega-Fonseca, X. Propolis as a Bioindicator of Contamination with Toxic Metals. In Heavy Metal Remediation; Kumar, N., Ed.; Earth and Environmental Sciences Library; Springer: Cham, Switzerland, 2024. [Google Scholar] [CrossRef]
- Popov, B.; Hristova, V.K.; Presilski, S.; Shariati, M.A.; Najman, S. Assessment of heavy metals in propolis and soil from the Pelagonia region, Republic of Macedonia. Maced. J. Chem. Chem. Eng. 2017, 36, 23–33. [Google Scholar] [CrossRef][Green Version]
- Goretti, E.; Pallottini, M.; Rossi, R.; La Porta, G.; Gardi, T.; Cenci Goga, B.T.; Elia, A.C.; Galletti, M.; Moroni, B.; Petroselli, C.; et al. Heavy metal bioaccumulation in honey bee matrix, an indicator to assess the contamination level in terrestrial environments. Environ. Pollut. 2020, 256, 113388. [Google Scholar] [CrossRef]
- Hodel, K.V.S.; Machado, B.A.S.; Santos, N.R.; Costa, R.G.; Menezes-Filho, J.A.; Umsza-Guez, M.A. Metal Content of Nutritional and Toxic Value in Different Types of Brazilian Propolis. Sci. World J. 2020, 2020, 4395496. [Google Scholar] [CrossRef]
- Roman, A. Bees and their products as pollution bioindicator in the copper (LGOM) and lime-cement (Opole) industry areas. Sci. Exerc. Books Agric. Univ. Wroc. 1997, 323, 175–193. [Google Scholar]
- Kulevanova, S.; Stafilov, T.; Dorevski, K. Determination of some macroelements in propolis by atomic absorption spectrometry. Acta Pharm. 1995, 45, 45–52. [Google Scholar]
- Roman, A. Concentration of Chosen Trace Elements of Toxic Properties in Bee Pollen Loads. Polish J. of Environ. Stud. 2009, 18, 265–272. [Google Scholar]
- Soós, Á.; Bódi, É.; Várallyay, S.; Molnár, S.; Kovács, B. Element composition of propolis tinctures prepared from Hungarian raw propolis. LWT 2022, 154, 112762. [Google Scholar] [CrossRef]
- Dogan, M.; Silici, S.; Saraymen, R.; Ilhan, I.O. Element content of propolis from different regions of Turkey. Acta Aliment. 2006, 35, 127–130. [Google Scholar]
- Tajik, H.; Shokouhi, F. In vitro evaluation of antimicrobial efficacy of natural honey in comparison with sulfonamide derivatives. J. Anim. Vet. Adv. 2009, 8, 23–25. [Google Scholar]
- Yan, Y.; Xia, X.; Fatima, A.; Zhang, L.; Yuan, G.; Lian, F.; Wang, Y. Antibacterial Activity and Mechanisms of Plant Flavonoids against Gram-Negative Bacteria Based on the Antibacterial Statistical Model. Pharmaceuticals 2024, 17, 292. [Google Scholar] [CrossRef]
- DeLeon, S.; Clinton, A.; Fowler, H.; Everett, J.; Horswill, A.R.; Rumbaugh, K.P. Synergistic interactions of Pseudomonas aeruginosa and Staphylococcus aureus in an in vitro wound model. Infect. Immun. 2014, 82, 4718–4728. [Google Scholar] [CrossRef] [PubMed]
- Bouchelaghem, S. Propolis characterization and antimicrobial activities against Staphylococcus aureus and Candida albicans: A review. Saudi J. Biol. Sci. 2022, 29, 1936–1946. [Google Scholar] [CrossRef]
- Ożarowski, M.; Karpiński, T.M.; Alam, R.; Łochyńska, M. Antifungal Properties of Chemically Defined Propolis from Various Geographical Regions. Microorganisms 2022, 10, 364. [Google Scholar] [CrossRef] [PubMed]
- Asiminicesei, D.M.; Fertu, D.I.; Gavrilescu, M. Impact of Heavy Metal Pollution in the Environment on the Metabolic Profile of Medicinal Plants and Their Therapeutic Potential. Plants 2024, 13, 913. [Google Scholar] [CrossRef]
- Woźniak, M.; Sip, A.; Mrówczyńska, L.; Broniarczyk, J.; Waśkiewicz, A.; Ratajczak, I. Biological Activity and Chemical Composition of Propolis from Various Regions of Poland. Molecules 2022, 28, 141. [Google Scholar] [CrossRef]
- Pande, V.; Pandey, S.C.; Sati, D.; Bhatt, P.; Samant, M. Microbial Interventions in Bioremediation of Heavy Metal Contaminants in Agroecosystem. Front. Microbiol. 2022, 13, 824084. [Google Scholar] [CrossRef]
Disclaimer/Publisher’s Note: The statements, opinions and data contained in all publications are solely those of the individual author(s) and contributor(s) and not of MDPI and/or the editor(s). MDPI and/or the editor(s) disclaim responsibility for any injury to people or property resulting from any ideas, methods, instructions or products referred to in the content. |
© 2025 by the authors. Licensee MDPI, Basel, Switzerland. This article is an open access article distributed under the terms and conditions of the Creative Commons Attribution (CC BY) license (https://creativecommons.org/licenses/by/4.0/).