Article

Can Ecological Outcomes Be Used to Assess Soil Health?

by
Isabella C. F. Maciel
1,*,
Guilhermo F. S. Congio
2,
Eloa M. Araujo
1,
Morgan MathisonSlee
3,
Matt R. Raven
3 and
Jason E. Rowntree
4
1
Noble Research Institute, 2510 Sam Noble Pkwy, Ardmore, OK 73401, USA
2
Department of Animal Science, Luiz de Queiroz College of Agriculture, University of Sao Paulo, Avenida Padua Dias 11, Piracicaba 13418-900, SP, Brazil
3
Department of Community Sustainability, Michigan State University, 480 Wilson Rd, East Lansing, MI 48824, USA
4
Department of Animal Science, Michigan State University, 474 S Shaw Ln, East Lansing, MI 48824, USA
*
Author to whom correspondence should be addressed.
Environments 2025, 12(3), 85; https://doi.org/10.3390/environments12030085
Submission received: 7 February 2025 / Revised: 3 March 2025 / Accepted: 7 March 2025 / Published: 12 March 2025

Abstract

:
Soil health is typically evaluated using physical, chemical, and biological parameters. However, identifying cost-effective and interpretable metrics remains a challenge. The effectiveness of ecological outcome verification (EOV) in predicting soil health in grazing lands was assessed at 22 ranches. Sixty-four soil samples were analyzed using the Haney soil health test (HSHT) and phospholipid fatty acid (PLFA). Of 104 variables, 13 were retained following principal component analysis (PCA), including variables associated with plant community, carbon dynamics, and microbial community structure. Soils with enriched microbial and organic matter (SOM) characteristics supported a healthier ecological status, as corroborated by greater EOV scores. Water-extractable organic carbon (WEOC) was positively correlated to plant functional groups, whereas SOM was positively correlated with plant biodiversity and functional groups. Total bacteria were positively correlated with all EOV parameters. Microbial biomass (MB) was positively correlated with both water and energy cycle indexes, whereas arbuscular mycorrhizal fungi (AMF) was positively correlated with the water cycle. From the multiple regression analyses, water infiltration emerged as a key predictor of soil respiration and WEOC. Overall, the ecological outcomes measured by EOV have the potential to serve as a proxy for soil health, providing a practical tool for producers to make informed land management decisions.

1. Introduction

Grazing lands are the largest and most diverse resource in the world, covering 60% of the world’s agricultural land, and play a crucial role in supporting soil and ecosystem functions, such as water, energy, and biodiversity cycles [1,2]. The capacity of soil to function as a vital living ecosystem is vital for the sustainability of ranching operations and rural socioeconomic development [3]. Recognizing the key role soil plays in producing food, sustaining plant and animal productivity, and enhancing environmental quality [4], soil health has been gaining increased attention in recent years. Soil health indicates the capacity of soil to function as a vital living system to sustain biological productivity, promote environmental quality, and maintain plant and animal health [5,6].
Healthy grazing land soils are crucial for sequestering carbon, preserving soil organic matter (SOM), and nutrient cycling, which help mitigate climate change and improve resilience during extreme weather events [7]. Soil health is typically evaluated using a variety of physical, chemical, and biological parameters, which provide insights into soil functionality [8,9] and support producers’ assessment of soil functioning and long-term sustainability [10]. Soil properties such as SOM content, water infiltration rates, nutrient availability, and microbial activity are frequently monitored by researchers and producers to assess soil health. However, identifying the most effective and interpretable metrics remains a challenge.
The Haney soil health test (HSHT), which is based primarily on soil biological activity, has emerged in recent years as a new approach to assessing soil health [11]. This test quantifies soil health by incorporating both soil chemistry and biology into decision-making tools. Although the HSHT is promising due to its focus on linking soil biology with soil fertility and soil health, it may need extensive field evaluation and refinement in contrasting soils and climates across the United States [12].
The phospholipid fatty acid (PLFA) test has become one of the most common methods to study soil microbial structure [13] since microbial activity is a crucial determinant of nutrient cycling, OM decomposition, and overall soil fertility [14,15]. While traditional metrics focus largely on chemical and physical properties, a shift toward incorporating biological assessments, especially soil microbial diversity, could provide a more holistic understanding of soil health [16]. These metrics, however, also suffer from the challenge of interpretation. Currently, microbial biomass and diversity do not have clear and universally applicable thresholds, which makes it difficult to correlate them directly to land management outcomes.
One of the challenges associated with assessing soil health on grazing lands is the cost and complexity of laboratory analyses. Many soil health metrics require sophisticated tests that can be unaffordable for producers, particularly those managing large areas. Additionally, interpreting these results is not straightforward. The diversity of land uses, soil types, and management practices adds another layer of complexity to soil health assessments. Soil varies greatly across different regions, even within the same land area, making it difficult to establish benchmarks that can be applied universally [17]. Grazing intensity, movement patterns, and vegetation types further affect soil properties, meaning the impact of a given management practice varies depending on the specific context [18,19]. Consequently, understanding soil health requires an approach that incorporates this complexity, rather than relying on a one-size-fits-all set of metrics.
In recent years, alternative grazing land assessment frameworks, such as ecological outcomes verification (EOV), have emerged as a more accessible means for producers to track ecological health by focusing on outcomes like plant diversity, water infiltration, and soil parameters [20]. Establishing correlations between EOV indicators and parameters from laboratory-based methods such as HSHT and PLFA tests is a critical step in validating its usefulness. Once these correlations are established, EOV could serve as a valuable proxy for the more costly and labor-intensive soil health assessments, allowing producers to make data-driven decisions while saving time and resources. This creates opportunities for further research into how EOV aligns with biological, physical, and chemical soil metrics, particularly in the context of grazing land management.
This study aimed to identify soil and vegetation metrics that best reflect soil health in grazing lands and explore the relationship between soil health assessments and ecological outcomes. Lastly, we investigated the potential for EOV to serve as a proxy for soil health, providing an accessible tool for producers. Our integrative approach may help bridge the gap between field-based ecological assessments and laboratory-based soil health tests, enhancing the ability of producers to make informed decisions that support the outcomes of their grazing management.

2. Materials and Methods

2.1. Site Selection and Description

This study was conducted on two ranches at Noble Research Institute (NRI) and 20 privately owned ranches in the US Southern Great Plains and Cross Timbers (CRT) ecoregion, across 26,255 ha and 18 counties in Oklahoma and Texas (Table S1).
Private ranches were selected based on responses from an online survey distributed widely to pasture-based beef cattle (Bos spp.) producers in OK and TX. They were categorized based on a spectrum of grazing management practices. More information about producer recruitment and categorization methods can be found in Vivas and Hodbod [19].
The main land use of these livestock operations was cow–calf beef cattle production, and they varied in terms of amount and type of native rangelands and introduced pastures. The native rangelands comprised native tall and mid grasses along with forbs and some woody shrub species. Dropseed (Sporobolus spp. R. Br.), little bluestem [Schizachyrium scoparium (Michx.) Nash], silver bluestem [Bothriochloa laguroides (DC.) Herter], broomsedge bluestem (Andropogon virginicus L.), and Indiangrass [Sorghastrum nutans (L.) Nash] were the most prevalent native grass species, while bermudagrass [Cynodon dactylon (L.) Pers.] and Johnsongrass [Sorghum halepense (L.) Pers.] were the most common introduced grass species. Soil orders included Mollisol, Alfisol, Vertisol, and Inceptisol with a broad range of textures. The climate is humid subtropical (Cfa according to Köppen classification) characterized by hot summers and cold winters with rainfall historically ranging from 683 to 1196 mm yr−1. Rainfall data were obtained from weather stations near the Oklahoma [21] and Texas [22] ranches. More information about the ranches is provided in Table S1.

2.2. Field Sampling

At each NRI ranch, six monitoring sites were established, while at each of the 20 privately owned ranches, a single site was established, resulting in a total of 32 monitoring sites. Comprehensive above- and below-ground assessments were conducted at these sites. The monitoring sites (approximately six ha) were selected based on their representation of the ranches’ typical grazing management while assuring consistent land use and soil types. Sampling occurred in June 2022 at the NRI ranches and from July to October 2023 at the privately owned ranches.
Short- and long-term monitoring protocols were performed following the EOV methodology [20]. A reference area was identified for the CRT ecoregion [23], described as the best-known expression of biodiversity, site stability, and ecosystem function [24], and used as a reference for all sites. An ecological health matrix was developed for the CRT ecoregion encompassing 15 leading indicators: live canopy, microfauna, four vegetation functional groups, contextually desirable rare and undesirable species, litter abundance and decomposition, dung decomposition, wind and water erosion, soil capping, and presence and amount of bare soil (Table S2). Functional groups and key species were determined based on their relative abundance, their representativeness of the functional group, and their sensitivity to grazing management. Desirable plants are species that disappear or become rare under improper grazing management, whereas undesirable plants are favored and become frequent under improper grazing management. Some of the ecological indicators are universal, and some of them were calibrated to the specific ecoregion based on the potential of the indicator [25]. All sites and the reference area were monitored using the ecological health matrix designed for the CRT ecoregion (Table S2).

2.2.1. Short-Term Monitoring (STM)

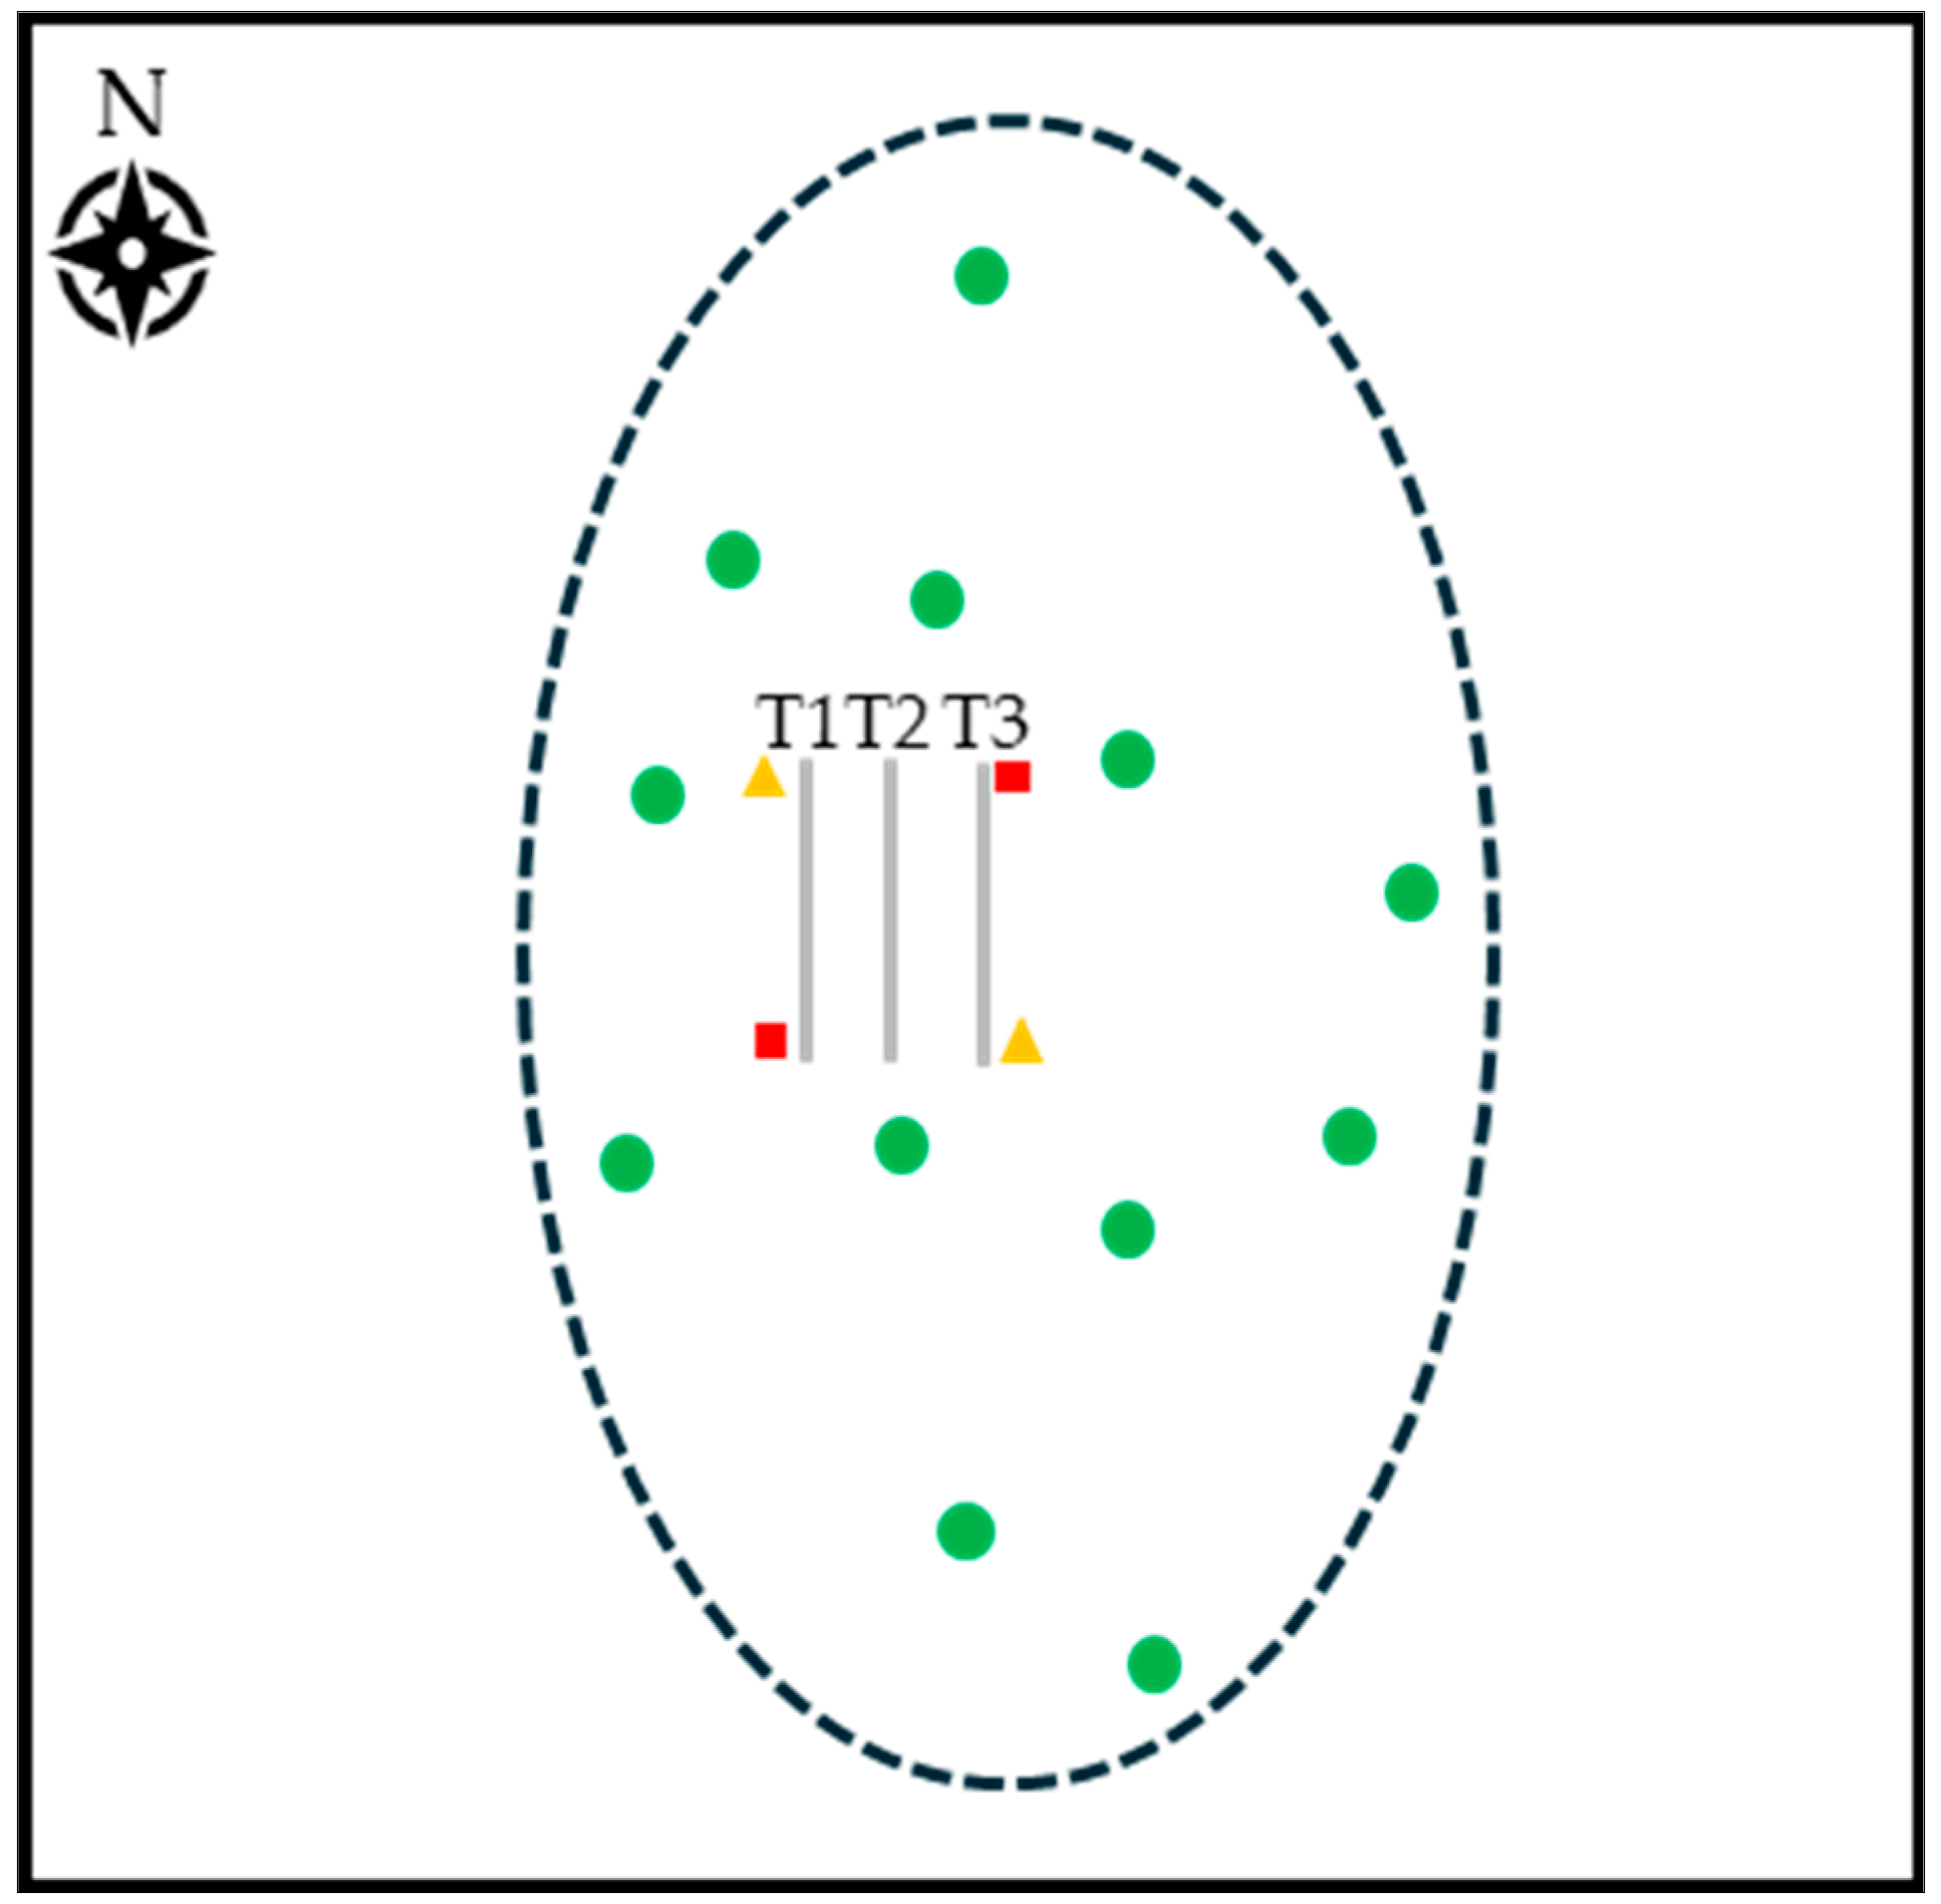
Twelve sampling locations were randomly distributed within the monitoring site (Figure 1), and the STM protocol was performed within a 15 m radius area of each location. Latitude and longitude were recorded at each location for future assessments. Visual estimation of herbage mass and quality, grazing intensity, and grazing pattern and the assessment of the 15 leading indicators described above [20] were evaluated. Each indicator was scored based on visual appraisals by two trained observers, and the cumulative score of all indicators was used to determine the ecological health index (EHI), which ranged from −140 to +120.
In addition to EHI, indexes for each ecosystem process were calculated using the equation adapted from Tongway and Hindley, 2004 [26], including water cycle (WCI), mineral cycle (MCI), community dynamics (CDI), and energy cycle (ECI) indexes, according to Equation (1):
I = 1 M a x i D
where I = index value (WCI, MCI, CDI or ECI), Max = maximum possible value of the total scores of related indicators, i = total scores of related indicators, and D = difference between maximum and minimum possible values of the total scores of related indicators. The indicators related to each ecosystem process are detailed in Table S3.

2.2.2. Long-Term Monitoring (LTM)

The LTM protocol was performed within the monitoring site (Figure 1). In addition to the STM indicators, LTM provided quantitative data from lagging indicators that included more details regarding biodiversity, water infiltration, and soil health indicators encompassed in the HSHT.
The LTM assessment was performed along three 25 m long transects spaced 6.5 m apart (T1, T2, and T3) [20] (Figure 1). Soil cover and plant biodiversity were estimated using the point and flexible area method [27]. T1 and T2 were used to identify soil surface and vegetation composition by lowering a surveyor’s pin vertically every 0.25 cm along each transect. A total of 100 points per transect were assessed. At each point, the contact of the pin was documented, identifying whether it intersected a plant, bare soil, litter, or rock. If a plant was intersected, the species was recorded. An additional area (1 m strip on each side of T2) was used to identify and count any species that were not touched along T1 and T2. The search for new species was then extended to the entire area between T1 and T3 (25 × 13 m) to record any plants that were not previously identified. The measurements were used to calculate the percentage of bare ground and litter, vegetation cover (by plant species and functional groups), and biodiversity indicators such as vegetation richness and Shannon–Wiener index. T3 was used to score EHI using the ecological health matrix (Table S2). Indicators were scored inside a 0.5 × 25 m strip on the right side of T3 (i.e., outside of the 25 × 13 m area). Besides the EHI, the functional indexes for each ecosystem process were also calculated for T3 using Equation (1).
Soil water infiltration was measured by installing two single-ring infiltrometers (16 cm diameter × 11.5 cm depth), one 5 m away from the north side of T3 and one 5 m away from the south side of T1, both outside of the 25 × 13 m area (Figure 1). The forage was clipped to ground level with electric grass clippers, and all vegetation was removed without disturbing the surface of the soil. Each ring was installed until it was halfway into the soil surface. Soil was then gently pressed against the inner edges of the ring to prevent water from leaking out through the sides. An initial wetting was performed by pouring 450 mL of water onto plastic cling film inside the ring and then carefully removing the film to allow water to wet the soil surface. After the water infiltrated, an additional 450 mL of water was added into the ring, and the time (in minutes) required for the water to infiltrate was recorded; therefore, the longer the time, the slower the infiltration rate. If the infiltration time exceeded 30 min, it was recorded as greater than 30 min [20].
Two soil samples composed of approximately 15 soil cores (2.5 cm diameter, 15 cm depth) were collected from each monitoring site. The depth of 15 cm was selected because it is the most representative of root systems and nutrient uptake. Samples were collected 5 m away from the north side of T1 and 5 m away from the south side of T3, both outside of the 25 × 13 m area (Figure 1). Samples were kept on ice in labeled Ziploc bags and were refrigerated until shipping to the laboratory (Regen Ag Lab, LLC, Pleasanton, NE, USA) for HSHT and PLFA analyses.

2.3. Laboratory Analyses

2.3.1. Haney Soil Health Test

The HSHT is a laboratory dual-extraction procedure for estimating the overall health of agricultural soils [28]. Soil samples were air-dried and processed into 2 mm particles. A two-gram soil sample was extracted with deionized water and analyzed for total water-extractable nitrogen, water-extractable organic nitrogen (WEON), and water-extractable organic carbon (WEOC).
Other aliquots of the soil (2 g) were treated with a combination of organic acids (malic, citric, and oxalic acids) for the extraction of plant available nutrients, such as total and inorganic P, ammonium, nitrate, K, Mg, Ca, Na, Zn, Fe, Mn, Cu, S, and Al on Inductively Coupled Argon Plasma (ICAP) [29].
Analyses of pH, soluble salts, and available K, N, and P were also performed. Available nutrients include inorganic and potentially mineralizable forms [28].
Soil organic matter was estimated by the loss of ignition (LOI). A two-gram soil sample was placed in a dry oven (105 °C) for two hours and then weighed prior to being placed in a muffle furnace (360 °C) for two hours and 15 min. Once cooled, samples were weighed, and LOI was calculated by the difference between dry weight and ash weight, divided by ash weight.
Soil respiration was measured by rewetting a soil sample via capillary action with deionized water at a 2:1 soil-to-water ratio, incubating for 24 h at 24 °C, and quantifying the carbon dioxide produced using SR-1 Soil Respiration System created by Soil Health Innovations, LLC (Pleasanton, NE, USA) [28].

2.3.2. Phospholipid Fatty Acid Test

The PLFA analysis was used to estimate total soil microbial biomass. Soil microbial PLFA were extracted from freeze-dried soil samples using a chloroform–methanol extraction mixture modified to incorporate a phosphate buffer [30]. The PLFA portion of the fatty acids was removed by solid phase extraction (SPE) and then methylated. Samples were analyzed on a gas chromatographic using Agilent’s ChemStation and MIDI’s Sherlock software systems. The gas chromatographic was equipped with a 25 m Ultra 2 (5%-phenyl)-methyl polysiloxane column provided by J&W Scientific (Folsom, CA, USA). The abundance of individual fatty acids was determined as nmol g−1 of dry soil, and PLFA concentrations were calculated based on the 19:0 (methyl nonadecanoate, C20H40O2) internal standard concentration. Standard nomenclature was used to describe PLFA parameters. Overall, microbial community composition represented by PLFA-related parameters was separated into bacteria and fungi groups.

2.4. Data Analysis

All statistical analyses were performed in R language using RStudio (Version 2023.12.1+402). The three subsets of data (i.e., EOV, HSHT, and PLFA) were examined for the presence of outliers using boxplot and to identify outliers functions. Due to the abundance of parameters in the dataset, a principal component analysis (PCA) was performed in each subset separately to reduce the dimensionality of data. The prcomp function from the ‘Stats’ package was used for this purpose. Table S4 contains a detailed description of all parameters from the three subsets included in the first PCA. Eight of the thirty-eight variables were retained in the EOV subset. Both HSHT and PLFA subsets were reduced from 40 and 27 to 3 and 5 variables, respectively. Both subsets were then combined, and a new PCA was performed to identify whether ranches with healthier soils were correlated with greater EOV scores.
To examine bivariate relationships among soil parameters and EOV indicators, Spearman’s correlation analysis was carried out using the rcorr function in the ‘Hmisc’ package. Multiple regression models were fitted to predict both HSHT and PLFA soil variables. A sequential approach by incrementally adding levels of variables was used to develop models with increasing complexity. First, only EOV variables were used as independent variables and HSHT and PLFA soil parameters as dependent variables. In the next level, HSHT and PLFA were added to the EOV parameters to predict other variables. The backward multistep selection approach was used to identify the most important covariates to predict each dependent variable. Additionally, the presence of multicollinearity among covariates in fitted models was examined based on the variance inflation factor [31]. Models were selected when all independent variables were significant (p < 0.05) and had a variance inflation factor of less than 10 [32]. All models were fitted using the lm procedure in the ‘Stats’ package.

3. Results

3.1. Principal Component Analysis

The PCA for the EOV subset is summarized in Table 1. Five out of thirty-seven variables (Table S4) were retained in two principal components (PC), which accounted for 94.3% of the total variance. PC1 explained 77.9% of the total variance and greater negative loadings for CDI, EHI, and vegetation richness. PC2 explained 16.4% of the total variance, where the number of functional groups had a negative loading, and herbage mass presented the greatest positive loading.
The PCA for the HSHT subset retained only three variables (Table 2) out of the forty initially assessed (Table S4). The first two PCs explained 96.6% of the total variance, with WEOC and soil respiration with greater positive loadings in PC1 and SOM and soil respiration with the greatest positive and negative loadings in PC2, respectively.
The PCA for the PLFA subset retained five (Table 3) out of twenty-seven variables (Table S4) in two PCs, which accounted for 92.5% of the total variance. Total fungi and total microbial biomass had the greatest positive loadings in PC1, whereas total bacteria and arbuscular mycorrhizal fungi (AMF) had the greatest positive and negative loadings in PC2, respectively.
The PCA, including both HSHT and PLFA subsets, is summarized in Table 4. PC1 explained 62.0% of the total variance and showed greater positive loadings for total fungi, total microbial biomass, and saprophytic fungi. The second PC, which explained an additional 22.5% of the total variance, was characterized by strong negative loadings from all HSHT parameters (i.e., soil respiration, WEOC, and SOM) and positive loading for AMF. Statistical summaries of the selected variables are provided in Table S5.
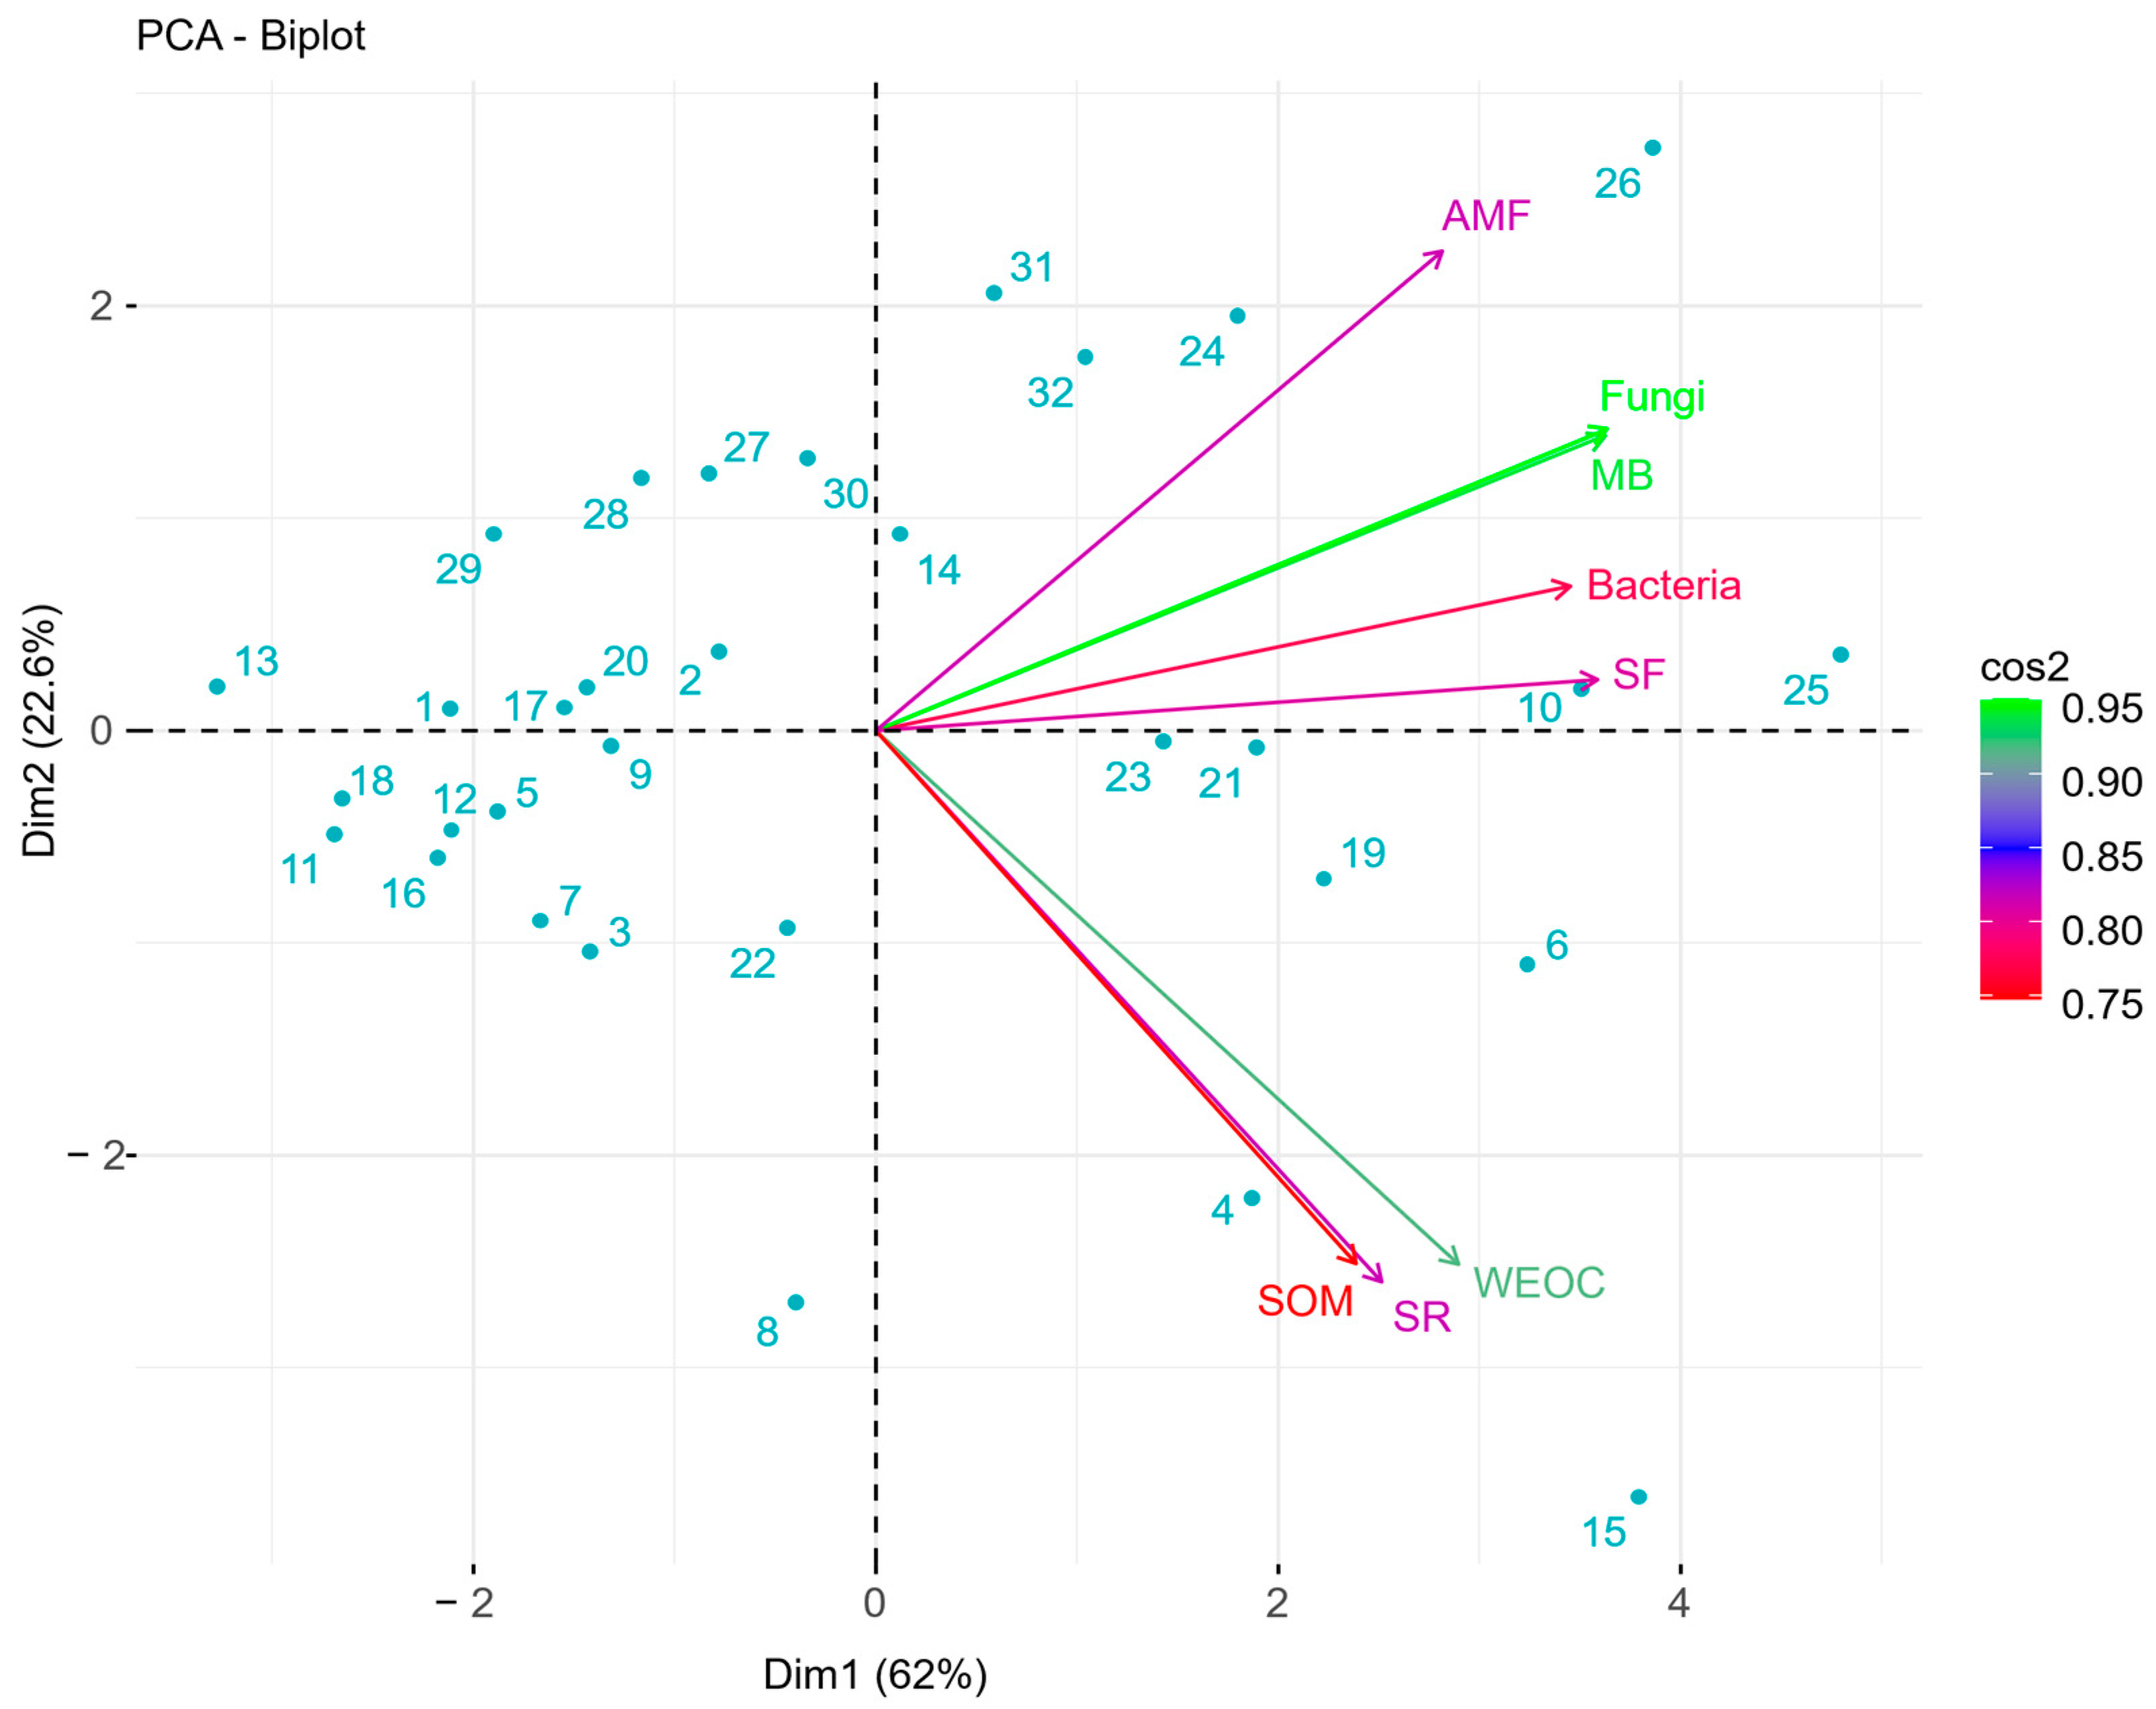
Monitoring sites located in the top-left quadrant were characterized by low values of HSHT and PLFA parameters, while sites in the top and bottom-right quadrants presented greater PLFA and HSHT values (Figure 2). On the other hand, sites in the bottom-left quadrant had low PLFA and intermediate HSHT values. Based on this distribution, sites located on the right-side quadrants were considered the healthiest soils in the dataset. The average values of all parameters according to the distribution of sampling sites in the quadrants are shown in Table 5. Sites displayed on the right side presented greater average values of HSHT, PLFA, and EOV parameters compared to those on the left side.

3.2. Spearman’s Correlation Matrix

The interrelationships between HSHT, PLFA, and EOV parameters are presented in Table 6. Within each subset, variables were positively correlated among themselves. Variables in both HSHT and PLFA subsets displayed strong (p < 0.05; 0.59 < ρ < 0.80) and very strong (p < 0.05; ρ > 0.79) positive relationships among themselves. Within the EOV subset, the EHI had stronger relationships with its peers (p < 0.05; ρ > 0.57). All four ecosystem processes exhibited strong relationships with EOV parameters, with the ECI and CDI each presenting five strong positive relationships with others. Across subsets, WEOC was the HSHT variable with more and stronger positive relationships with PLFA parameters (p < 0.05; ρ > 0.39). Considering HSHT and EOV subsets, WEOC was weakly and positively correlated to functional groups (p < 0.05; 0.19 < ρ < 0.40), whereas SOM was moderately and positively correlated with both the CDI and functional groups (p < 0.05; 0.39 < ρ < 0.60). For the PLFA subset, total bacteria were positively correlated with all EOV parameters in a range from weak to moderate relationships (p < 0.05; 0.35 < ρ < 0.58). Still, total microbial biomass was positively and moderately correlated with both the WCI and ECI (p < 0.05; 0.39 < ρ < 0.60), whereas AMF presented a strong positive relationship with the WCI (p < 0.05; 0.59 < ρ < 0.80).

3.3. Multiple Regression Models

Statistical summaries of the selected variables are provided in Table S5. The water infiltration time was the single EOV parameter selected to predict both soil respiration and WEOC (Table 7). In both equations, water infiltration (expressed as the time required for the soil to infiltrate 450 mL of water) was negatively related to the dependent variables. SOM was positively and negatively correlated with accumulated rainfall and water infiltration, respectively.
The inclusion of PLFA variables during the backward multistep selection approach did not improve the predictive performance of soil respiration (Table 8). However, both WEOC and SOM equations were improved when PLFA covariates were also made available to be selected. Both water infiltration and saprophytic fungi were negatively and positively correlated with WEOC, respectively. SOM was the most accurately predicted HSHT variable with several EOV and PLFA covariates being selected. Gram-negative bacteria, the MCI, water infiltration, and the fungi–bacteria (F:B) ratio were negatively correlated with SOM, whereas the ECI, bare ground, litter, trees, and saprophytic fungi had positive relationships with SOM.
The equations developed to predict PLFA variables using only EOV parameters as covariates are shown in Table 9. Accumulated rainfall and the Shannon–Wiener index were each negatively related with three PLFA variables. On the other hand, shrubs, trees, and vegetation richness had positive relationships in four equations. Total microbial biomass and AMF were the most accurately predicted PLFA variables.
The second level of complexity for PLFA equations is shown in Table 10. Overall, when HSHT parameters were also available to be selected during the backward multistep selection approach, PLFA variables were more accurately predicted, with the exception of AMF (Table 10 vs. Table 9). WEON was positively correlated with all PLFA variables. The proportion of shrubs was also selected and positively correlated to AMF. Soil calcium concentration was positively correlated to saprophytic fungi.

4. Discussion

4.1. Linking Ecological Outcomes with Soil Health Metrics

This study evaluated the potential of EOV to be used as a proxy assessment of soil health by examining the relationships between EOV indicators and laboratory-based soil health metrics. Our analyses revealed that a small subset of variables can capture a significant portion of variance in ecological and soil health data, demonstrating the potential for EOV to serve as an effective tool for monitoring soil health.
EOV indicators such as community dynamics, vegetation richness, number of functional groups, and herbage mass captured the majority of the total variance associated with our dataset. This indicates that ecological indicators related to plant community diversity play a prominent role in maintaining the ecosystem’s structural and functional integrity, as plants serve as the primary source of OM and energy for sustaining many soil ecosystem functions [33,34]. The EHI, which is the sum of 15 ecological indicators assessed in the STM protocol, was also a good indicator to explain the variance of the dataset. Xu et al., 2019 [24] reported a positive correlation between the EHI and vegetation richness, which aligns with the results of this study. For the HSHT subset, carbon-related parameters such as WEOC and soil respiration were crucial for explaining changes in soil health. Recent studies have highlighted the importance of soil carbon and its link with other soil functions, such as nutrient and water cycling and greenhouse gas emissions, especially in grazing lands [35,36,37,38]. Additionally, soil carbon responds to management practices, an essential criterion for evaluating soil health [38]. The results from the PLFA subset highlighted the importance of microbial community structure and its function as major components in soil health assessments. Microbial biomass and specific communities such as fungi, bacteria, and AMF were the most important parameters, which aligns with Yang et al., 2022 [39].
The interconnectedness between the three subsets is particularly evident in Spearman’s correlation matrix (Table 6). Notably, EOV parameters had the strongest positive relationships across subsets, particularly with PLFA parameters (e.g., microbial biomass). Total bacteria correlated positively with all EOV indicators, while AMF showed strong correlations with the WCI. This suggests that microbial diversity and activity, often promoted by greater SOM and biodiversity, play a central role in enhancing ecological processes such as nutrient and water cycling [10]. Total microbial biomass and the functional groups were closely related to vegetation parameters (e.g., vegetation richness) and soil nutrients (e.g., WEOC), which is consistent with previous findings [39,40]. Microbial communities play a fundamental role in the biogeochemical cycling of essential nutrients, including carbon, nitrogen, phosphorus, and sulfur, contributing to overall ecosystem productivity [41]. Furthermore, microbial decomposition of plant and animal residues is essential for nutrient recycling and maintaining soil organic matter [42].
van Es and Karlen, 2019 [43] assessed soil health parameters from three long-term trials and found different correlations among variables from individual sites, suggesting that results can be impacted by soil properties (e.g., soil types) and management practices. According to Stanley et al., 2024 [44], climatic, edaphic, and plant ecophysiology factors, along with optimal grazing management, also play a crucial role in soil organic carbon (SOC) sequestration. It is important to note that our study comprised a diverse range of grazing management practices, with diverse land uses, soil types, and a wide range of physical, chemical, and biological soil properties, which allowed for a comprehensive assessment of soil health. Such diversity ensures that the findings are not limited to a single management approach, enhancing their applicability across a wide range of landscapes.
The PCA biplot (Figure 2) revealed distinct groups of sampling sites across four quadrants. Variables grouped in two clusters, one for HSHT parameters and the other for PLFA parameters, suggesting that sites are differentiated based on shared characteristics related to soil health metrics [45]. The right-side quadrants were characterized by greater values for both HSHT and PLFA parameters, representing the healthiest soils. The increase in WEOC, SOM, and total microbial biomass in those quadrants compared to the left-side quadrants were 38, 62, and 186%, respectively. The structured behavior of variables suggests that soils with enriched microbial diversity and greater carbon and SOM support a healthier ecological state [46], as corroborated by the greater EOV values in those quadrants. These sites demonstrated active nutrient cycling and carbon availability, which fostered microbial growth and diversity, thereby supporting more sustainable and resilient ecosystems. Ecological outcomes verification could be an option for identifying efficient nutrient cycling, carbon and SOM availability, and robust microbial communities, which are essential for maintaining ecosystem functionality. Previous studies described the potential of microbial diversity to alter terrestrial ecosystem processes, soil functional stability [47,48], and the amount of carbon and SOM. Highlighting the relationships between physical, chemical, and biological soil parameters underscores the importance of a holistic approach towards soil health management.

4.2. Strengthening the Link Between EOV and Soil Test Metrics—Modeling HSHT and PLFA Parameters

The sequential approach, allowing only one group of variables as covariates in the first step of development (e.g., EOV to predict PLFA parameters) and then providing two groups at a second level (e.g., EOV + HSHT to predict PLFA parameters), provided more accurate models. Overall, more complex models consistently enhanced predictive ability compared to simpler models [49]. However, although prediction performance is likely to be improved at the expense of model complexity [50], the trade-off between the on-farm availability of variable inputs and prediction accuracy must be carefully considered [51]. Models with increasing complexity may include covariates that are costly and infeasible to obtain [52].
This study has identified key covariates to predict both HSHT and PLFA parameters. Water infiltration time was identified as the most important covariate to predict HSHT variables. There were significant negative relationships between water infiltration time, soil respiration, WEOC, and SOM in both categories of model complexity (Table 7 and Table 8). Conversely, the time that it takes for water to infiltrate (i.e., 1/WI) is positively related to soil respiration, WEOC, and SOM, aligning with previous studies [43,53]. The broad range of soil types assessed in this study confirms the impact of inherent soil properties, such as structure and texture, on water infiltration [53]. As emphasized by Bagnall et al., 2022 [53], identifying soil parameters, including soil hydraulic function, is critical for understanding the impact of management practices. Given the significance of water infiltration, it is essential to highlight the simplicity and practicality of this measurement for producers, as it provides a valuable tool for predicting other soil health variables.
At the first level of complexity, rainfall was identified as having a positive relationship with SOM (Table 7), whereas at the second level, several covariates were selected. Mean annual precipitation was also identified as a significant predictor of SOC elsewhere [54,55]. At the second level of complexity, the MCI, water infiltration, Gram-negative bacteria, and the F:B ratio were negatively related to SOM, while the ECI, bare ground, litter, trees, and saprophytic fungi presented significant positive relationships with SOM (Table 8). The ecological indicators related to the MCI are live organisms (i.e., macrofauna), litter incorporation and decomposition, and bare soil, whereas ECI indicators are limited to live canopy abundance and bare ground (Table S3). Previous studies have identified vegetation type as a key factor influencing SOC stocks, with effects attributed to the length and area of the root system and the amount and chemical composition of deposited litter [54,56].
Fanin et al., 2019 [57] reported that Gram-negative bacteria are more dependent on simple carbon compounds derived from plants (e.g., alkyl and N-alkyl compounds), whereas the Gram-positive bacteria use more SOM-derived carbon sources, which are more recalcitrant (e.g., carbonyl, aryl, and ketone compounds) and stable. A negative relationship between the F:B ratio and SOC is also reported in the literature, where less fungal biomass has been associated with less soil carbon sequestration [58]. Six et al., 2006 [59] explained that shifts toward fungal dominance may increase SOC and reduce its turnover rate due to enhanced fungal-mediated soil aggregation and/or shifts in the microbial biomass physiology [58]. Still, saprophytic fungi were identified as a key covariate predicting SOC (Table 8), which agrees with Spearman’s correlation matrix (Table 6). In our study, saprophytic fungi exhibited a positive correlation with WEOC. This relationship can be attributed to the findings of Zhao et al., 2024 [60], who demonstrated that hyphae of saprophytic fungi secrete extracellular biopolymers that enhance soil aggregate stability, which is correlated with SOC.
Rainfall was negatively related to total microbial biomass, total fungi, and AMF (Table 9). Soil moisture, which is affected by rainfall gradients, is known to affect microbial community composition [61]. Microorganisms need water to maintain their physiological status, and soil moisture also affects the availability of both substrate and oxygen for microbes’ growth [62]. Hawkes et al., 2011 [61] reported that fungi respond directly to rainfall levels, with more abundant, diverse, and consistent communities under drought conditions and less abundant, less diverse, and more variable communities during wetter periods. AMF requires oxygen for their metabolic processes, and their functionality may be compromised when the soil becomes waterlogged and anaerobic. Further studies have corroborated the strong effect of rainfall on the composition and function of soil fungal communities, especially AMF, whereas saprophytic fungi were not affected [61,63].
The main EOV-specific vegetation parameters used to predict PLFA parameters were the proportion of shrubs and trees and vegetation richness (Table 9). Plant diversity influences soil microbial biodiversity via two main pathways [64]: first, by increasing the net primary productivity, and second, by leading towards a greater diversity of litter and root exudates [65]. Zhao et al., 2014 [64] mentioned that specific plant species may be more important and sometimes prevail over plant diversity in controlling soil microbial biodiversity. Plant diversity explained one-third of the variance in total plant biomass, whereas specific plant species accounted for about two-thirds [66].
The WEON was selected as a covariate as it was positively related to predicting all HSHT parameters at the second level of complexity (Table 10). This positive relationship between nitrogen and total microbial biomass and bacteria was also reported in Australia [67]. Total nitrogen was also found to be the most important variable correlated with PLFA parameters, including total microbial biomass, total bacteria, Gram-negative bacteria, total fungi, and other diversity indexes [68]. Soil inorganic nitrogen, however, seemed to be more important than WEON in explaining changes in bacterial and fungal communities in forest ecosystems in China [62]. Another parameter that is frequently reported as an important modulator of soil microbes’ growth is soil pH [67]. However, our results showed that pH was not selected to predict any PLFA parameters. Soil calcium concentration, which is related to pH, was positively correlated to saprophytic fungi.
5. Conclusions

The findings from this study suggest that EOV indicators, particularly those related to vegetation community structure (e.g., number of functional groups, vegetation richness) and ecosystem functions (e.g., water cycle and mineral cycle indexes), along with water infiltration time, can effectively predict soil health metrics included in both HSHT and PLFA tests. Additionally, microbial parameters such as total fungi and AMF provide valuable insights when combined with EOV, improving predictions of SOM and nutrient dynamics.
In conclusion, EOV is a viable proxy for assessing soil health as a stand-alone tool or in conjunction with the above analyses, particularly in contexts where direct measurements of soil health may be limited. Ecological outcomes offer a more holistic view of soil health that goes beyond individual chemical or biological parameters, integrating both ecosystem structure and function. Future work could focus on refining these models and exploring their applicability across diverse ecosystems and land use practices, ultimately guiding sustainable land management practices.

Supplementary Materials

The following supporting information can be downloaded at https://www.mdpi.com/article/10.3390/environments12030085/s1, Table S1: Site characterization of ranches sampled in Oklahoma and Texas, United States; Table S2: EOV ecological health matrix for the Cross Timbers ecoregion; Table S3: Ecological outcomes verification (EOV) short-term indicators and their related ecosystem processes; Table S4: Ecological outcomes verification (EOV), Haney soil health test (HSHT), and phospholipid fatty acid (PLFA) parameters included in the first principal components analyses; Table S5: Summary statistics of selected variables from ecological outcomes verification (EOV), Haney soil health test (HSHT), and phospholipid fatty acid (PLFA) datasets.

Author Contributions

Conceptualization, I.C.F.M. and G.F.S.C.; Data curation, I.C.F.M., G.F.S.C. and E.M.A.; Formal analysis, G.F.S.C.; Funding acquisition, J.E.R.; Methodology, I.C.F.M., G.F.S.C., M.R.R. and J.E.R.; Project administration, I.C.F.M. and J.E.R.; Supervision, I.C.F.M.; Validation, I.C.F.M. and G.F.S.C.; Visualization, I.C.F.M., G.F.S.C. and E.M.A.; Writing—original draft, I.C.F.M. and G.F.S.C.; Writing—review and editing, I.C.F.M., G.F.S.C., E.M.A., M.M., M.R.R. and J.E.R. All authors have read and agreed to the published version of the manuscript.

Funding

This research was funded by the Foundation for Food and Agriculture Research (FFAR grant number: DSnew-0000000028), Noble Research Institute, Greenacres Foundation, The Jones Family Foundation, and Butcherbox. The content of this publication is solely the responsibility of the authors and does not necessarily represent the official views of our funders.

Data Availability Statement

The datasets presented in this article are not readily available because the data are part of an ongoing study.

Acknowledgments

We would like to thank Sindy Interrante for her critical review and Thomas James, Taner Hale, Maira Sparks, and Myoung-Hwan Chi for their support in field sampling.

Conflicts of Interest

The authors declare no conflicts of interest.

Abbreviations

The following abbreviations are used in this manuscript:
EOVEcological outcome verification
HSHTHaney soil health test
PLFAPhospholipid fatty acid
PCAPrincipal component analysis
SOMSoil organic matter
WEOCWater-extractable organic carbon
MBMicrobial biomass
AMFArbuscular mycorrhizal fungi
NRINoble Research Institute
CRTCross Timbers ecoregion
STMShort-term monitoring
EHIEcological health index
WCIWater cycle index
MCIMineral cycle index
CDICommunity dynamics index
ECIEnergy cycle index
LTMLong-term monitoring
TTransect
WEONWater-extractable organic nitrogen
PCPrincipal component
SRSoil respiration
SFSaprophytic fungi
DMDry matter
WISoil water infiltration time
F:BFungi–bacteria ratio
GNBGram-negative bacteria
SOCSoil organic carbon

References

  1. Food and Agriculture Organization of the United Nations. The State of Food and Agriculture—Innovation in Family Farming. Available online: https://openknowledge.fao.org/server/api/core/bitstreams/f6b32ac3-74c8-4c4b-ac6b-60a21d74202f/content (accessed on 26 November 2024).
  2. Follett, R.F.; Reed, D.A. Soil Carbon Sequestration in Grazing Lands: Societal Benefits and Policy Implications. Rangel. Ecol. Manag. 2010, 63, 4–15. [Google Scholar] [CrossRef]
  3. Ellili-Bargaoui, Y.; Walter, C.; Lemercier, B.; Michot, D. Assessment of Six Soil Ecosystem Services by Coupling Simulation Modelling and Field Measurement of Soil Properties. Ecol. Indic. 2021, 121, 107211. [Google Scholar] [CrossRef]
  4. Doran, J.W. Soil Health and Global Sustainability: Translating Science into Practice. Agric. Ecosyst. Environ. 2002, 88, 119–127. [Google Scholar] [CrossRef]
  5. Doran, J.W.; Zeiss, M.R. Soil Health and Sustainability: Managing the Biotic Component of Soil Quality. Appl. Soil Ecol. 2000, 15, 3–11. [Google Scholar] [CrossRef]
  6. Teague, R.; Kreuter, U. Managing Grazing to Restore Soil Health, Ecosystem Function, and Ecosystem Services. Front. Sustain. Food Syst. 2020, 4, 534187. [Google Scholar] [CrossRef]
  7. Schuman, G.E.; Janzen, H.H.; Herrick, J.E. Soil Carbon Dynamics and Potential Carbon Sequestration by Rangelands. Environ. Pollut. 2002, 116, 391–396. [Google Scholar] [CrossRef]
  8. Bending, G.D.; Turner, M.K.; Rayns, F.; Marx, M.-C.; Wood, M. Microbial and Biochemical Soil Quality Indicators and Their Potential for Differentiating Areas under Contrasting Agricultural Management Regimes. Soil Biol. Biochem. 2004, 36, 1785–1792. [Google Scholar] [CrossRef]
  9. Barrios, E. Soil Biota, Ecosystem Services and Land Productivity. Ecol. Econ. 2007, 64, 269–285. [Google Scholar] [CrossRef]
  10. Teague, R.; Dowhower, S. Links of Microbial and Vegetation Communities with Soil Physical and Chemical Factors for a Broad Range of Management of Tallgrass Prairie. Ecol. Indic. 2022, 142, 109280. [Google Scholar] [CrossRef]
  11. Singh, S.; Jagadamma, S.; Yoder, D.; Yin, X.; Walker, F. Agroecosystem Management Responses to Haney Soil Health Test in the Southeastern United States. Soil Sci. Soc. Am. J. 2020, 84, 1705–1721. [Google Scholar] [CrossRef]
  12. Chu, M.; Singh, S.; Walker, F.R.; Eash, N.S.; Buschermohle, M.J.; Duncan, L.A.; Jagadamma, S. Soil Health and Soil Fertility Assessment by the Haney Soil Health Test in an Agricultural Soil in West Tennessee. Commun. Soil Sci. Plant Anal. 2019, 50, 1123–1131. [Google Scholar] [CrossRef]
  13. Frostegård, Å.; Tunlid, A.; Bååth, E. Use and Misuse of PLFA Measurements in Soils. Soil Biol. Biochem. 2011, 43, 1621–1625. [Google Scholar] [CrossRef]
  14. Jeffery, S.; Harris, J.A.; Rickson, R.J.; Ritz, K. Effects of Soil-surface Microbial Community Phenotype upon Physical and Hydrological Properties of an Arable Soil: A Microcosm Study. Eur. J. Soil Sci. 2010, 61, 493–503. [Google Scholar] [CrossRef]
  15. Nottingham, A.T.; Whitaker, J.; Ostle, N.J.; Bardgett, R.D.; McNamara, N.P.; Fierer, N.; Salinas, N.; Ccahuana, A.J.Q.; Turner, B.L.; Meir, P. Microbial Responses to Warming Enhance Soil Carbon Loss Following Translocation across a Tropical Forest Elevation Gradient. Ecol. Lett. 2019, 22, 1889–1899. [Google Scholar] [CrossRef] [PubMed]
  16. Mijangos, I.; Pérez, R.; Albizu, I.; Garbisu, C. Effects of Fertilization and Tillage on Soil Biological Parameters. Enzyme Microb. Technol. 2006, 40, 100–106. [Google Scholar] [CrossRef]
  17. Jones, J.W.; Antle, J.M.; Basso, B.; Boote, K.J.; Conant, R.T.; Foster, I.; Godfray, H.C.J.; Herrero, M.; Howitt, R.E.; Janssen, S.; et al. Toward a New Generation of Agricultural System Data, Models, and Knowledge Products: State of Agricultural Systems Science. Agric. Syst. 2017, 155, 269–288. [Google Scholar] [CrossRef]
  18. Comer, J.; Perkins, L. Resistance of the Soil Microbial Community to Land-Surface Disturbances of High-Intensity Winter Grazing and Wildfire. J. Environ. Manag. 2021, 279, 111596. [Google Scholar] [CrossRef]
  19. Vivas, J.; Hodbod, J. Exploring the Relationship between Regenerative Grazing and Ranchers’ Wellbeing. J. Rural. Stud. 2024, 108, 103267. [Google Scholar] [CrossRef]
  20. Savory Institute. EOV summary. In Ecological Outcome Verified, Version 3.0; Savory Institute: Boulder, CO, USA, 2021. [Google Scholar]
  21. Mesonet. Available online: https://www.mesonet.org/ (accessed on 4 November 2024).
  22. National Weather Service. National Oceanic and Atmospheric Administration. Available online: https://www.weather.gov/ (accessed on 4 November 2024).
  23. The Nature Conservancy. A Conservation Blueprint for the Crosstimbers & Southern Tallgrass Prairie Ecoregion; CSTP Ecoregional Planning Team, The Natiure Conservancy: San Antonio, TX, USA, 2009; Available online: www.conserveonline.org (accessed on 6 January 2025).
  24. Xu, S.; Rowntree, J.; Borrelli, P.; Hodbod, J.; Raven, M.R. Ecological Health Index: A Short Term Monitoring Method for Land Managers to Assess Grazing Lands Ecological Health. Environments 2019, 6, 67. [Google Scholar] [CrossRef]
  25. Pellant, M.; Shaver, P.L.; Pyke, D.A.; Herrick, J.E.; Lepak, N.; Riegel, G.; Kachergis, E.; Newingham, B.A.; Toledo, D.; Busby, F.E. Interpreting Indicators of Rangeland Health, Version 5. Tech Ref 1734-6; U.S. Department of the Interior, Bureau of Land Management, National Operations Center: Denver, CO, USA, 2020. Available online: https://www.blm.gov/documents/national-office/blm-library/technical-reference/interpreting-indicators-rangeland-health-0 (accessed on 4 November 2024).
  26. Tongway, D.J.; Hindley, N.L. Landscape Function Analysis: Procedures for Monitoring and Assessing Landscapes with Special Reference to Minesite and Rangelands; CSIRO: Canberra, Australia, 2004; 80p.
  27. Halloy, S.; Ibañez, M.; Yager, K. Point and flexible area sampling for rapid inventories of biodiversity status. Ecol. Boliv. 2011, 46, 46–56. [Google Scholar]
  28. Haney, R.L.; Haney, E.B.; Smith, D.R.; Harmel, R.D.; White, M.J. The Soil Health Tool—Theory and Initial Broad-Scale Application. Appl. Soil Ecol. 2018, 125, 162–168. [Google Scholar] [CrossRef]
  29. Haney, R.L.; Haney, E.B.; Harmel, R.D.; Smith, D.R.; White, M.J. Evaluation of H3A for Determination of Plant Available P vs. FeAlO Strips. Open J. Soil Sci. 2016, 6, 175–187. [Google Scholar] [CrossRef]
  30. White, D.C.; Davis, W.M.; Nickels, J.S.; King, J.D.; Bobbie, R.J. Determination of the Sedimentary Microbial Biomass by Extractible Lipid Phosphate. Oecologia 1979, 40, 51–62. [Google Scholar] [CrossRef]
  31. Zuur, A.F.; Ieno, E.N.; Elphick, C.S. A Protocol for Data Exploration to Avoid Common Statistical Problems. Methods Ecol. Evol. 2010, 1, 3–14. [Google Scholar] [CrossRef]
  32. Chatterjee, S.; Hadi, A.S.; Price, B. Regression Analysis by Examples, 3rd ed.; Wiley VCH: New York, NY, USA, 2000. [Google Scholar]
  33. Lehmann, J.; Kleber, M. The Contentious Nature of Soil Organic Matter. Nature 2015, 528, 60–68. [Google Scholar] [CrossRef] [PubMed]
  34. Ponge, J.-F. The Soil as an Ecosystem. Biol. Fertil Soils 2015, 51, 645–648. [Google Scholar] [CrossRef]
  35. Lal, R. Soil Health and Carbon Management. Food Energy Secur. 2016, 5, 212–222. [Google Scholar] [CrossRef]
  36. Conant, R.T.; Cerri, C.E.P.; Osborne, B.B.; Paustian, K. Grassland Management Impacts on Soil Carbon Stocks: A New Synthesis. Ecol. Appl. 2017, 27, 662–668. [Google Scholar] [CrossRef]
  37. Bai, Y.; Cotrufo, M.F. Grassland Soil Carbon Sequestration: Current Understanding, Challenges, and Solutions. Science 2022, 377, 603–608. [Google Scholar] [CrossRef]
  38. Liptzin, D.; Norris, C.E.; Cappellazzi, S.B.; Bean, G.M.; Cope, M.; Greub, K.L.H.; Rieke, E.L.; Tracy, P.W.; Aberle, E.; Ashworth, A.; et al. An Evaluation of Carbon Indicators of Soil Health in Long-Term Agricultural Experiments. Soil Biol. Biochem. 2022, 172, 108708. [Google Scholar] [CrossRef]
  39. Yang, T.; Li, X.; Hu, B.; Wei, D.; Wang, Z.; Bao, W. Soil Microbial Biomass and Community Composition along a Latitudinal Gradient in the Arid Valleys of Southwest China. Geoderma 2022, 413, 115750. [Google Scholar] [CrossRef]
  40. Fierer, N.; Wood, S.A.; Bueno de Mesquita, C.P. How Microbes Can, and Cannot, Be Used to Assess Soil Health. Soil Biol. Biochem. 2021, 153, 108111. [Google Scholar] [CrossRef]
  41. Tang, S.; Ma, Q.; Marsden, K.A.; Chadwick, D.R.; Luo, Y.; Kuzyakov, Y.; Wu, L.; Jones, D.L. Microbial community succession in soil is mainly driven by carbon and nitrogen contents rather than phosphorus and Sulphur contents. Soil Biol. Biochem. 2023, 180, 109019. [Google Scholar] [CrossRef]
  42. Bhattacharyya, S.S.; Ros, G.H.; Furtak, K.; Iqbal, H.M.N.; Parra-Saldivar, R. Soil carbon sequestration—An interplay between soil microbial community and soil organic matter dynamics. Sci. Total Environ. 2022, 815, 152928. [Google Scholar] [CrossRef] [PubMed]
  43. van Es, H.M.; Karlen, D.L. Reanalysis Validates Soil Health Indicator Sensitivity and Correlation with Long-term Crop Yields. Soil Sci. Soc. Am. J. 2019, 83, 721–732. [Google Scholar] [CrossRef]
  44. Stanley, P.L.; Wilson, C.; Patterson, E.; Machmuller, M.B.; Cotrufo, M.F. Ruminating on Soil Carbon: Applying Current Understanding to Inform Grazing Management. Glob. Chang. Biol. 2024, 30, e17223. [Google Scholar] [CrossRef]
  45. Feeney, C.J.; Robinson, D.A.; Keith, A.M.; Vigier, A.; Bentley, L.; Smith, R.P.; Garbutt, A.; Maskell, L.C.; Norton, L.; Wood, C.M.; et al. Development of Soil Health Benchmarks for Managed and Semi-Natural Landscapes. Sci. Total Environ. 2023, 886, 163973. [Google Scholar] [CrossRef]
  46. Li, C.; Fultz, L.M.; Moore-Kucera, J.; Acosta-Martínez, V.; Kakarla, M.; Weindorf, D.C. Soil Microbial Community Restoration in Conservation Reserve Program Semi-Arid Grasslands. Soil Biol. Biochem. 2018, 118, 166–177. [Google Scholar] [CrossRef]
  47. Philippot, L.; Raaijmakers, J.; Lemanceau, P.; Van Der Putten, W. Going Back to the Roots: The Microbial Ecology of the Rhizosphere. Nat. Rev. Microbiol. 2013, 11, 789–799. [Google Scholar] [CrossRef]
  48. Tardy, V.; Mathieu, O.; Lévêque, J.; Terrat, S.; Chabbi, A.; Lemanceau, P.; Ranjard, L.; Maron, P. Stability of Soil Microbial Structure and Activity Depends on Microbial Diversity. Environ. Microbiol. Rep. 2014, 6, 173–183. [Google Scholar] [CrossRef]
  49. Congio, G.F.S.; Bannink, A.; Mayorga, O.L.; Rodrigues, J.P.P.; Bougouin, A.; Kebreab, E.; Carvalho, P.C.F.; Berchielli, T.T.; Mercadante, M.E.Z.; Valadares-Filho, S.C.; et al. Improving the Accuracy of Beef Cattle Methane Inventories in Latin America and Caribbean Countries. Sci. Total Environ. 2023, 856, 159128. [Google Scholar] [CrossRef]
  50. Moraes, L.E.; Strathe, A.B.; Fadel, J.G.; Casper, D.P.; Kebreab, E. Prediction of Enteric Methane Emissions from Cattle. Glob. Chang. Biol. 2014, 20, 2140–2148. [Google Scholar] [CrossRef]
  51. Belanche, A.; Hristov, A.N.; van Lingen, H.J.; Denman, S.E.; Kebreab, E.; Schwarm, A.; Kreuzer, M.; Niu, M.; Eugène, M.; Niderkorn, V.; et al. Prediction of Enteric Methane Emissions by Sheep Using an Intercontinental Database. J. Clean. Prod. 2023, 384, 135523. [Google Scholar] [CrossRef]
  52. Niu, M.; Kebreab, E.; Hristov, A.N.; Oh, J.; Arndt, C.; Bannink, A.; Bayat, A.R.; Brito, A.F.; Boland, T.; Casper, D.; et al. Prediction of Enteric Methane Production, Yield, and Intensity in Dairy Cattle Using an Intercontinental Database. Glob. Chang. Biol. 2018, 24, 3368–3389. [Google Scholar] [CrossRef] [PubMed]
  53. Bagnall, D.K.; Morgan, C.L.S.; Bean, G.M.; Liptzin, D.; Cappellazzi, S.B.; Cope, M.; Greub, K.L.H.; Rieke, E.L.; Norris, C.E.; Tracy, P.W.; et al. Selecting Soil Hydraulic Properties as Indicators of Soil Health: Measurement Response to Management and Site Characteristics. Soil Sci. Soc. Am. J. 2022, 86, 1206–1226. [Google Scholar] [CrossRef]
  54. Jobbágy, E.G.; Jackson, R.B. The Vertical Distribution of Soil Organic Carbon and Its Relation to Climate and Vegetation. Ecol. Appl. 2000, 10, 423–436. [Google Scholar] [CrossRef]
  55. Rasmussen, C.; Heckman, K.; Wieder, W.R.; Keiluweit, M.; Lawrence, C.R.; Berhe, A.A.; Blankinship, J.C.; Crow, S.E.; Druhan, J.L.; Hicks Pries, C.E.; et al. Beyond Clay: Towards an Improved Set of Variables for Predicting Soil Organic Matter Content. Biogeochemistry 2018, 137, 297–306. [Google Scholar] [CrossRef]
  56. Merilä, P.; Malmivaara-Lämsä, M.; Spetz, P.; Stark, S.; Vierikko, K.; Derome, J.; Fritze, H. Soil Organic Matter Quality as a Link between Microbial Community Structure and Vegetation Composition along a Successional Gradient in a Boreal Forest. Appl. Soil Ecol. 2010, 46, 259–267. [Google Scholar] [CrossRef]
  57. Fanin, N.; Kardol, P.; Farrell, M.; Nilsson, M.-C.; Gundale, M.J.; Wardle, D.A. The Ratio of Gram-Positive to Gram-Negative Bacterial PLFA Markers as an Indicator of Carbon Availability in Organic Soils. Soil Biol. Biochem. 2019, 128, 111–114. [Google Scholar] [CrossRef]
  58. Malik, A.A.; Chowdhury, S.; Schlager, V.; Oliver, A.; Puissant, J.; Vazquez, P.G.M.; Jehmlich, N.; von Bergen, M.; Griffiths, R.I.; Gleixner, G. Soil Fungal:Bacterial Ratios Are Linked to Altered Carbon Cycling. Front. Microbiol. 2016, 7, 1247. [Google Scholar] [CrossRef]
  59. Six, J.; Frey, S.D.; Thiet, R.K.; Batten, K.M. Bacterial and Fungal Contributions to Carbon Sequestration in Agroecosystems. Soil Sci. Soc. Am. J. 2006, 70, 555–569. [Google Scholar] [CrossRef]
  60. Zhao, R.; Kuzyakov, Y.; Zhang, H.; Wang, Z.; Li, T.; Shao, L.; Jiang, L.; Wang, R.; Li, M.; Sun, O.J.; et al. Labile Carbon Inputs Offset Nitrogen-Induced Soil Aggregate Destabilization via Enhanced Growth of Saprophytic Fungi in a Meadow Steppe. Geoderma 2024, 443, 116841. [Google Scholar] [CrossRef]
  61. Hawkes, C.V.; Kivlin, S.N.; Rocca, J.D.; Huguet, V.; Thomsen, M.A.; Suttle, K.B. Fungal Community Responses to Precipitation. Glob. Chang. Biol. 2011, 17, 1637–1645. [Google Scholar] [CrossRef]
  62. Zhou, W.P.; Shen, W.J.; Li, Y.E.; Hui, D.F. Interactive Effects of Temperature and Moisture on Composition of the Soil Microbial Community. Eur. J. Soil Sci. 2017, 68, 909–918. [Google Scholar] [CrossRef]
  63. Huang, Q.; Jiao, F.; Huang, Y.; Li, N.; Wang, B.; Gao, H.; An, S. Response of Soil Fungal Community Composition and Functions on the Alteration of Precipitation in the Grassland of Loess Plateau. Sci. Total Environ. 2021, 751, 142273. [Google Scholar] [CrossRef] [PubMed]
  64. Zhao, J.; Wan, S.; Zhang, C.; Liu, Z.; Zhou, L.; Fu, S. Contributions of Understory and/or Overstory Vegetations to Soil Microbial PLFA and Nematode Diversities in Eucalyptus Monocultures. PLoS ONE 2014, 9, e85513. [Google Scholar] [CrossRef] [PubMed]
  65. Wardle, D.A. The Influence of Biotic Interactions on Soil Biodiversity. Ecol. Lett. 2006, 9, 870–886. [Google Scholar] [CrossRef]
  66. Tilman, D.; Lehman, C.L.; Thomson, K.T. Plant Diversity and Ecosystem Productivity: Theoretical Considerations. Proc. Natl. Acad. Sci. USA 1997, 94, 1857–1861. [Google Scholar] [CrossRef]
  67. Xue, P.P.; Carrillo, Y.; Pino, V.; Minasny, B.; McBratney, A.B. Soil Properties Drive Microbial Community Structure in a Large Scale Transect in South Eastern Australia. Sci. Rep. 2018, 8, 11725. [Google Scholar] [CrossRef]
  68. Zhong, W.; Gu, T.; Wang, W.; Zhang, B.; Lin, X.; Huang, Q.; Shen, W. The Effects of Mineral Fertilizer and Organic Manure on Soil Microbial Community and Diversity. Plant Soil 2010, 326, 523. [Google Scholar] [CrossRef]
Figure 1. Scheme of a 6 ha monitoring site (dotted line) within a given pasture (solid line) including twelve sampling locations (STM protocol, green circles) and the three transects (T1, T2, and T3) of the long-term monitoring (LTM protocol, gray bars) with locations where soil cores (yellow triangles) and water infiltration (red squares) samples were taken.
Environments 12 00085 g001
Figure 2. Principal component analysis biplot of Haney soil heath test and phospholipid fatty acid test parameters, including 32 monitoring sites (blue dots). SR: soil respiration, WEOC: water-extractable organic carbon, SOM: soil organic matter, MB: total microbial biomass, Bacteria: total bacteria, Fungi: total fungi, AMF: arbuscular mycorrhizal fungi, SF: saprophytic fungi.
Environments 12 00085 g002
Table 1. Summary of the principal component (PC) analysis for the EOV subset, including coefficients, eigenvalues, and variances.
EOV 1 ParametersPC1PC2
Ecological health index−0.4740.305
Community dynamics index−0.4940.124
Herbage mass−0.4150.560
Vegetation richness−0.440−0.440
Functional groups−0.406−0.611
Eigenvalue3.900.82
Total variance (%)77.916.4
Cumulative variance (%)77.994.3
1 Ecological outcomes verification.
Table 2. Summary of the principal component (PC) analysis for the HSHT subset, including coefficients, eigenvalues, and variances.
HSHT 1 ParametersPC1PC2
Soil respiration0.581−0.545
Water-extractable organic carbon0.607−0.204
Soil organic matter0.5420.813
Eigenvalue2.500.40
Total variance (%)83.413.2
Cumulative variance (%)83.496.6
1 Haney soil health test.
Table 3. Summary of the principal component (PC) analysis for the PLFA subset, including coefficients, eigenvalues, and variances.
PLFA 1 ParametersPC1PC2
Microbial biomass0.4780.080
Total bacteria0.4320.456
Total fungi0.479−0.202
Arbuscular mycorrhizal fungi0.412−0.761
Saprophytic fungi0.4310.407
Eigenvalue4.120.51
Total variance (%)82.410.1
Cumulative variance (%)82.492.5
1 Phospholipid fatty acid test.
Table 4. Summary of the principal component (PC) analysis for both HSHT and PLFA subsets, including coefficients, eigenvalues, and variances.
HSHT 1 and PLFA 2 ParametersPC1PC2
Soil respiration0.282−0.483
Water-extractable organic carbon0.325−0.467
Soil organic matter0.268−0.466
Microbial biomass0.4070.258
Total bacteria0.3870.127
Total fungi0.4080.264
Arbuscular mycorrhizal fungi0.3160.420
Saprophytic fungi0.4020.045
Eigenvalue4.961.80
Total variance (%)62.022.5
Cumulative variance (%)62.084.5
1 Haney soil health test, 2 Phospholipid fatty acid test.
Table 5. HSHT, PLFA, and EOV parameters averaged according to the distribution of sampling sites in the quadrants of the HSHT/PLFA PCA biplot.
ParametersRight-Side QuadrantsSDLeft-Side
Quadrants
SD
Sites (n)13-19-
HSHT 1
Soil respiration, mg kg−117615160.735.9
Water-extractable organic carbon, mg kg−125770.118635.7
Soil organic matter, %3.501.572.161.40
PLFA 2
Microbial biomass, ng g−1490414641710939
Total bacteria, ng g−11142314432247
Total fungi, ng g−1823290167158
Saprophytic fungi, ng/g42320873.564.8
Arbuscular mycorrhizal fungi, ng g−140122693.4107
EOV 3
Ecological health index, score37.623.219.422.3
Water cycle index, score27.73.6522.310.3
Mineral cycle index, score46.68.5441.911.3
Energy cycle index, score11.44.177.368.03
Community dynamics index, score16.819.12.3117.0
Herbage mass 4, kg DM ha−118249471459781
Vegetation richness, n29.614.720.29.58
Functional groups, n5.771.744.581.58
1 Haney soil health test, 2 Phospholipid fatty acid test, 3 Ecological outcomes verification, 4 kilograms of dry matter per hectare.
Table 6. Spearman’s correlation matrix 1 including HSHT, PLFA, and EOV parameters.
Parameters 2SRWEOCSOMMBBacteriaFungiAMFSFEHIWCIMCIECICDIHerbageRichnessFG
SR1.000.790.750.470.590.450.370.480.300.200.170.400.360.280.320.30
WEOC0.791.000.820.480.600.400.260.440.380.070.220.390.430.320.360.33
SOM0.750.821.000.400.560.390.240.420.430.110.170.460.530.400.410.49
MB0.470.480.401.000.890.920.860.880.400.550.390.500.360.230.230.21
Bacteria0.590.600.560.891.000.790.720.760.490.410.350.570.480.360.390.37
Fungi0.450.400.390.920.791.000.900.960.370.540.280.400.360.180.220.26
AMF0.370.260.240.860.720.901.000.780.390.610.360.450.380.220.190.18
SF0.480.440.420.880.760.960.781.000.280.470.190.300.300.110.200.28
EHI0.300.380.430.400.490.370.390.281.000.270.590.800.930.860.700.58
WCI0.200.070.110.550.410.540.610.470.271.000.560.530.110.15−0.06−0.06
MCI0.170.220.170.390.350.280.360.190.590.561.000.650.320.400.10−0.01
ECI0.400.390.460.500.570.400.450.300.800.530.651.000.670.820.400.24
CDI0.360.430.530.360.480.360.380.300.930.110.320.671.000.840.770.71
Herbage0.280.320.400.230.360.180.220.110.860.150.400.820.841.000.600.45
Richness0.320.360.410.230.390.220.190.200.70−0.060.100.400.770.601.000.86
FG0.300.330.490.210.370.260.180.280.58−0.06−0.010.240.710.450.861.00
1 Gradients of blue indicate statistical significance at p < 0.05 (dark being highest and light being lowest correlation), HSHT: Haney soil health test, PLFA: Phospholipid fatty acid test, EOV: Ecological outcomes verification. 2 SR: soil respiration, WEOC: water-extractable organic carbon, SOM: soil organic matter, MB: total microbial biomass, Bacteria: total bacteria, Fungi: total fungi, AMF: arbuscular mycorrhizal fungi, SF: saprophytic fungi, EHI: ecological health index, WCI: water cycle index, MCI: mineral cycle index, ECI: energy cycle index, CDI: community dynamics index, Herbage: herbage mass, Richness: vegetation species richness, FG: vegetation functional groups.
Table 7. Equations to predict HSHT variables using only EOV parameters as covariates 1.
Parameters 2Equations 3RSE 4R2Adjusted R2p-Value
Soil respiration181.26 *** − (0.09 ** × WI)98.680.270.250.002
WEOC261.55 *** − (0.06 *** × WI)51.10.350.330.0003
Soil organic matter1.93 * + (0.07 ** × Rainfall) − (0.019 *** × WI)1.0240.610.59<0.0001
1 HSHT: Haney soil health test, EOV: Ecological outcomes verification. 2 Soil respiration (ppm); WEOC: water-extractable organic carbon (ppm); Soil organic matter (%); 3 WI, soil water infiltration time; Rainfall: 12-month accumulated rainfall (mm), * p < 0.05, ** p < 0.01, *** p < 0.001; 4 RSE: residual standard error.
Table 8. Equations to predict HSHT variables using EOV and PLFA parameters as covariates 1.
Parameters 2Equations 3RSE 4R2Adjusted R2p-Value
Soil respiration181.26 *** − (0.09 ** × WI)98.680.270.250.002
WEOC226.16 *** − (3.85 ** × WI) + (0.10 * × SF)47.540.460.420.0001
Soil organic matter4.81 *** − (0.08 ** × MCI) + (0.23 *** × ECI) + (0.28 * × Bare) + (0.06 *** × Litter) + (0.59 * × Trees) − (0.0005 * × WI) − (0.004 ** × GNB) + (0.007 *** × SF) − (2.52 *** × F:B)0.680.870.82<0.0001
1 HSHT: Haney soil health test, EOV: ecological outcomes verification, PLFA: phospholipid fatty acid test. 2 Soil respiration (ppm); WEOC: water-extractable organic carbon (ppm); Soil organic matter (%); 3 WI: soil water infiltration time; SF: saprophytic fungi (ng g−1); MCI: mineral cycle index; ECI: energy cycle index; Bare: bare ground frequency (%); Litter: litter frequency (%); Trees: trees frequency (%); GNB: Gram-negative bacteria (ng g−1); F:B: fungi–bacteria ratio, * p < 0.05, ** p < 0.01, *** p < 0.001; 4 RSE: residual standard error.
Table 9. Equations to predict PLFA variables using only EOV parameters as covariates 1.
Parameters 2Equations 3RSE 4R2Adjusted R2p-Value
Microbial biomass5113.67 ** − (93.07 * × Rainfall) + (104.50 * × Shrubs) + (1230.11 * × Trees) + (142.44 *** × Richness) − (2120.27 *** × Shannon)14670.540.450.0001
Total bacteria394.53 ** + (37.82 *** × Richness) − (397.17 ** × Shannon)3650.370.330.001
Total fungi1141.78 *** − (25.49 * × Rainfall) + (368.00 ** × Trees)344.60.280.230.009
AMF494.37 ** − (15.68 ** × Rainfall) + (20.91 ** × Shrubs) + (207.66 * × Trees) + (10.89 * × Richness) − (159.03 * × Shannon) + (0.12 * × WI)162.40.570.470.0009
Saprophytic fungi342.99 *** − (0.16 ** × WI)201.30.210.180.008
1 PLFA: Phospholipid fatty acid test, EOV: Ecological outcomes verification. 2 Microbial biomass: total microbial biomass (ng g−1); Bacteria: total bacteria (ng g−1); Fungi: total fungi (ng g−1); AMF: arbuscular mycorrhizal fungi (ng g−1); saprophytic fungi (ng g−1); 3 Rainfall: 12-month accumulated rainfall (mm); Shrubs: shrubs frequency (%); Trees: trees frequency (%); Richness: vegetation species richness (n); Shannon: vegetation Shannon–Wiener diversity index; WI: soil water infiltration time; * p < 0.05, ** p < 0.01, *** p < 0.001; 4 RSE: residual standard error.
Table 10. Equations to predict PLFA variables using EOV and HSHT parameters as covariates 1.
Parameters 2Equations 3RSE 4R2Adjusted R2p-Value
Microbial biomass−2470.14 * + (380.22 *** × WEON)1343.00.550.54<0.0001
Total bacteria−473.18 * + (82.88 *** × WEON)317.40.510.49<0.0001
Total fungi−485.62 * + (63.80 *** × WEON)311.90.390.370.0001
AMF−229.83 a + (13.04 * × Shrubs) + (29.47 ** × WEON)1700.460.420.0001
Saprophytic fungi−255.87 b + (26.57 ** × WEON) + (0.15 * × Ca)1790.400.350.0006
1 PLFA: Phospholipid fatty acid test, EOV: Ecological outcomes verification, HSHT: Haney soil health test. 2 Microbial biomass: total microbial biomass (ng g−1); Bacteria: total bacteria (ng g−1); Fungi: total fungi (ng g−1); AMF: arbuscular mycorrhizal fungi (ng g−1); saprophytic fungi (ng g−1); 3 WEON: water-extractable organic nitrogen (mg kg−1); Shrubs: shrubs frequency (%); Ca: soil calcium concentration (mg kg−1); * p < 0.05, ** p < 0.01, *** p < 0.001, a p = 0.068, b p = 0.052; 4 RSE: residual standard error.
Disclaimer/Publisher’s Note: The statements, opinions and data contained in all publications are solely those of the individual author(s) and contributor(s) and not of MDPI and/or the editor(s). MDPI and/or the editor(s) disclaim responsibility for any injury to people or property resulting from any ideas, methods, instructions or products referred to in the content.