1. Introduction
The packaging industry significantly contributes to global environmental impacts, particularly through material extraction, energy consumption, and waste generation. Among various packaging types, tinplate cans play a crucial role in sectors such as lubricants, food, and household products due to their durability, excellent barrier properties, and recyclability. However, concerns about the sustainability of tinplate packaging stem from its substantial environmental footprint, primarily driven by the energy-intensive processes involved in material production, which result in considerable greenhouse gas (GHG) emissions [
1].
Tinplate is a low-carbon steel (0.05–0.025% C) coated with ~0.00076 mm of tin on each side via electrolytic deposition [
2]. The process involves cleaning, electroplating, and melting the tin layer for a smooth finish. Tinplate combines steel’s strength with tin’s corrosion resistance, non-toxicity, and solderability [
3]. While its recyclability offers an advantage over alternative materials, steel production remains highly carbon-intensive, contributing ~7% of global GHG and 11% of CO
2 emissions. Between 2000 and 2020, global steel production more than doubled, with China accounting for 53% in 2020. Growing demand, particularly in developing countries, continues to outpace efficiency gains, likely driving further increases in energy use and emissions [
4].
Steel is the world’s most recycled material, with 82.5% of steel packaging in Europe being recycled. As a permanent material, steel is fully recyclable, with scrap replacing raw materials in production. Every steel plant operates as a recycling facility, ensuring a continuous loop. To provide a clear benchmark, European tinplate producers use a standardized formula to calculate recycled content, determining it at 58% for steel packaging in Europe [
5]. End-of-life (EoL) stainless steel scrap is recycled using Electric Arc Furnaces, which are more energy-efficient than integrated processes [
6]. However, stringent quality standards and low trace element requirements for tinplate cans may sustain demand for primary steel in the EU [
7]. High-quality primary steel is also essential to meet the strict technical requirements of tinplate for food packaging and other applications [
8].
Given the pressing need for sustainability improvements in the packaging industry, tinplate aerosol cans present a valuable opportunity for reducing environmental impacts [
9,
10]. Improving the sustainability of tinplate packaging requires a comprehensive approach that considers energy-intensive production processes, material selection, transportation, and EoL management. Furthermore, auxiliary processes within the tinplate packaging supply chain—such as the use of offset aluminum printing plates, wood pallets [
11], and the application of paints, enamels, varnishes, rubber, cardboard, and plastics—further contribute to its environmental impact [
7]. Life cycle assessment provides a robust framework for evaluating these aspects, enabling the identification of strategies to minimize the environmental footprint while enhancing resource efficiency and recyclability [
12,
13].
Few studies have explored the environmental impacts of tinplate packaging materials, with most focusing on general aspects of its life cycle or comparing tinplate to other packaging materials for specific product distribution. To the authors’ knowledge, none have specifically focused on the life cycle environmental impacts of three-piece tinplate aerosol cans. This gap highlights the need for a detailed analysis of these cans, which are widely used in various industries, to better understand their environmental footprint and identify opportunities for sustainability improvements.
For instance, Hospido et al. [
14] conducted an LCA of canned tuna production, identifying processing as the primary contributor to environmental impact, accounting for 85% of acidification potential (AP) and 95% of global warming potential (GWP). Within this stage, tinplate production and transportation represent 60.85% of GWP and 54.76% of AP. The study suggests that packaging modifications, such as increasing recycled tinplate content or adopting alternative materials, could significantly reduce environmental impacts. However, successful implementation depends on broader factors, including economic feasibility, logistics (collection, sorting, transport), and consumer acceptance.
APEAL [
15] assessed the environmental impact of tinplate coil production in Europe using 2012–2013 data and following ISO 14040/44 [
12,
13] and Worldsteel LCA methods. The study covers the full production process, from raw material extraction to manufacturing, and includes the European average recycling rate. It represents 95% of European tinplate production, with data from 11 sites of ArcelorMittal, Tata Steel, ThyssenKrupp Rasselstein, and U.S. Steel Košice. The data were independently reviewed and updated in the previous 2008–2009 study. The key environmental impacts per kilogram of tinplate (excluding EoL) are as follows: GWP is 2.27 kg CO
2 eq, AP is 4.0 × 10
−3 kg SO
2 eq, eutrophication potential (EP) is 4.5 × 10
−4 kg PO
4 eq, photochemical ozone creation potential (POCP) is 7.6 × 10
−3 kg C
2H
4 eq, and primary energy demand (PED) is 28.9 MJ. APEAL stresses the need for regular updates to LCA data to reflect industry advancements. The dataset is available in the International Life Cycle Database (ILCD). However, the study does not include the production of tinplate aerosol cans, which is the focus of the present research, nor does it cover the EoL phase.
Almeida et al. [
16] review the role of packaging in seafood products through both qualitative and quantitative LCAs. The review reveals that most seafood LCAs focus on the direct environmental impacts of packaging materials, with some studies exploring alternative options. The quantitative analysis reveals that canned packaging has the highest climate change impact, accounting for 42% of the total impact while representing 27% of the product’s weight. In contrast, packaging for frozen, chilled, and processed seafood has a significantly lower impact, contributing less than 5% to the climate change impact while comprising 6% of the product’s weight. Materials such as aluminum, tinplate, and glass have a higher environmental impact than plastic and paper. The study emphasizes the importance of accurate data on these materials to improve environmental assessments of seafood products.
Wei-han et al. [
17] discuss the environmental impacts of high-functional steel products, which, although they may increase environmental loads during production, often perform better in terms of environmental friendliness during use. They emphasize the importance of LCA in evaluating these products’ environmental impact across their entire life cycle. Case studies from Baoshan Iron & Steel Co. (Baosteel) highlight the effectiveness of LCA in eco-materials evaluation and eco-design. One example shows that reducing the tinplate thickness for two-piece steel cans from 0.280 to 0.225 mm results in a 14.5% reduction in CO
2 emissions over the cans’ life cycle. The paper highlights LCA as a scientific and systematic method for assessing the environmental performance of products throughout their life cycle.
Dupriez’s study [
18] for Metal Packaging Europe assesses the environmental impacts of steel and aluminum packaging in Europe, tracking performance from the year 2000 to 2013. Key findings include that reducing packaging weight by 1% directly lowers climate impact by the same percentage, while a 10% increase in recycling reduces emissions by 9% for steel and 18% for aluminum. Additionally, using 100% renewable electricity can cut climate impact by 7–9%.
The Aerosol Alliance conducted an LCA study to assess the environmental impact of spray paint, revealing that each spray can generate approximately 3.3 kg CO
2-eq. The study covers the production, use, and EoL stages [
19].
Dey et al. [
20] note that tinplate has been used in food packaging for over 200 years, with its sustainability depending on cost and environmental impact. Steel and tin (~75% of production costs) drive efforts to optimize materials and reduce tin use. Growing eco-awareness fosters innovation in steelmaking, tinplating, and can fabrication.
Sphera’s LCA study on tin production [
9] highlights the scarcity of global environmental impact data. Improved LCA data enhance industry insights, enabling better environmental management. Given tin’s broad applications, up-to-date life cycle information is crucial. This study enhances data quality and representativeness, supporting the industry’s sustainability efforts.
The integration of renewable energy sources into industrial processes represents a promising avenue for reducing the environmental footprint of packaging production [
21]. With the growing economic feasibility of renewable technologies, particularly photovoltaic (PV) electricity systems and green hydrogen [
22], there is increasing potential to mitigate carbon emissions in energy-intensive industries. Additionally, green hydrogen is emerging as a low-carbon alternative in industries such as steelmaking, with potential applications in the production of aerosol cans. The International Renewable Energy Agency (IRENA) reports that the cost of PV electricity technology has decreased by over 80% since 2010, making it a cost-effective solution for industries looking to reduce their dependence on carbon-intensive grid electricity [
23].
The study by Nugent and Sovacool [
24] reviews 153 life cycle studies on greenhouse gas emissions for wind and PV electricity, narrowing them down to 41 relevant peer-reviewed assessments. It finds that wind electricity emissions range from 0.4 to 364.8 g CO
2-eq/kWh (mean 34.1), and PV electricity emissions range from 1 to 218 g CO
2-eq/kWh (mean 49.9). While both technologies are considered “low-carbon”, they are not emissions-free. The study emphasizes the need for more rigorous life cycle assessments and suggests that energy storage may increase GHG intensity for both wind and solar systems. It also highlights that specific configurations and technologies, such as larger wind turbines and certain types of PV electricity systems, can help reduce emissions. To maximize the effectiveness of wind and solar energy in combating climate change, it is crucial to optimize factors such as system size and storage. Similarly, the National Renewable Energy Laboratory (NREL) reports that greenhouse gas emissions for PV electricity systems range from 10 to 36 g CO
2-eq/kWh [
25], while Jungbluth [
26] estimates emissions for various PV electricity systems to be between 39 and 110 g CO
2-eq/kWh.
Green hydrogen is emerging as a viable alternative to fossil fuels, particularly in energy-intensive industries like steelmaking. Produced via electrolysis powered by renewable energy, it presents a sustainable solution for steel production, significantly reducing emissions [
27]. Major steel producers, including Thyssenkrupp and ArcelorMittal, are setting ambitious targets to cut CO
2 emissions through the use of green hydrogen. For instance, Thyssenkrupp, based in Germany, aims to reduce CO
2 emissions by 30% by 2030 and achieve carbon neutrality by 2045 [
28].
While the adoption of renewable energy in the packaging sector is still in its early stages, this study examines how PV electricity and green hydrogen can mitigate the environmental impacts of energy use in tinplate aerosol packaging production. Using the LCA methodology, it assesses the environmental impacts of tinplate aerosol can production from a cradle-to-gate perspective, highlighting the potential benefits of integrating these renewable energy solutions into the manufacturing process.
To the best of the authors’ knowledge, this is the first LCA study on three-piece tinplate aerosol cans. No existing literature specifically addresses the life cycle environmental impacts of these cans, highlighting a significant gap in research on this type of packaging. The need for a comprehensive analysis is underscored by the widespread use of these cans in various industries and the growing emphasis on sustainable packaging solutions. Such an analysis could provide valuable insights into their environmental footprint and uncover opportunities for improving sustainability.
This study not only quantifies the environmental impacts but also identifies key opportunities for reducing the carbon footprint of aerosol packaging production. By pinpointing the processes and materials that contribute most to environmental impacts, stakeholders can make informed decisions to optimize production, minimize resource use, and enhance overall sustainability. The findings offer a clear pathway for improving the environmental performance of aerosol packaging, promoting more sustainable practices within the sector. Furthermore, the insights gained may serve as a reference for other sectors facing similar challenges, illustrating how energy transitions can foster environmental improvements.
2. Materials and Methods
The LCA methodology, as outlined by the ISO 14040 [
12] and ISO 14044 [
13] standards, involves four key phases: (I) goal and scope definition; (II) life cycle inventory (LCI); (III) life cycle impact assessment (LCIA); and (IV) interpretation. This section outlines the assumptions and considerations applied in each phase of the LCA for tinplate aerosol cans production, with a particular emphasis on the energy transition and material usage throughout the process.
2.1. Study Goal
This study assesses the environmental impacts of producing 1000 three-piece tinplate aerosol cans by a Portuguese packaging company using a comprehensive LCA. It compares two energy scenarios: the current one, relying on electricity from the Portuguese grid and 100% natural gas, and an optimized renewable energy scenario with 100% PV electricity and a thermal energy mix of 20% green hydrogen and 80% natural gas. Green hydrogen in the renewable energy scenario is produced via PEM electrolysis, powered entirely by PV electricity. The study also compares three electricity sources (100% solar, 100% wind, and 100% hydro) for green hydrogen production. Using a “cradle-to-gate” approach, the study evaluates the life cycle impacts, identifies process hotspots, and highlights materials that affect environmental performance. The aim is to uncover opportunities for reducing environmental impacts by transitioning to renewable energy and adopting cleaner technologies.
2.2. Study Scope
Functional unit: The functional unit (FU) for this LCA study is defined as the production of 1000 tinplate aerosol cans, each with a height of 240 mm, a diameter of 65 mm, a capacity of 600 mL, a tinplate thickness of 0.18 mm, and a weight of 101.96 g. The assessment considers only the empty cans, excluding the filling process and the liquid content. This product-based FU is designed to reflect the primary function of producing aerosol containers and ensures consistency with established practices in packaging LCAs, enabling comparability with similar studies, such as those focused on aluminum cans. By using this standardized FU, the study facilitates the evaluation and quantification of environmental impacts across the entire production process while also supporting the comparison of these impacts under different energy scenarios.
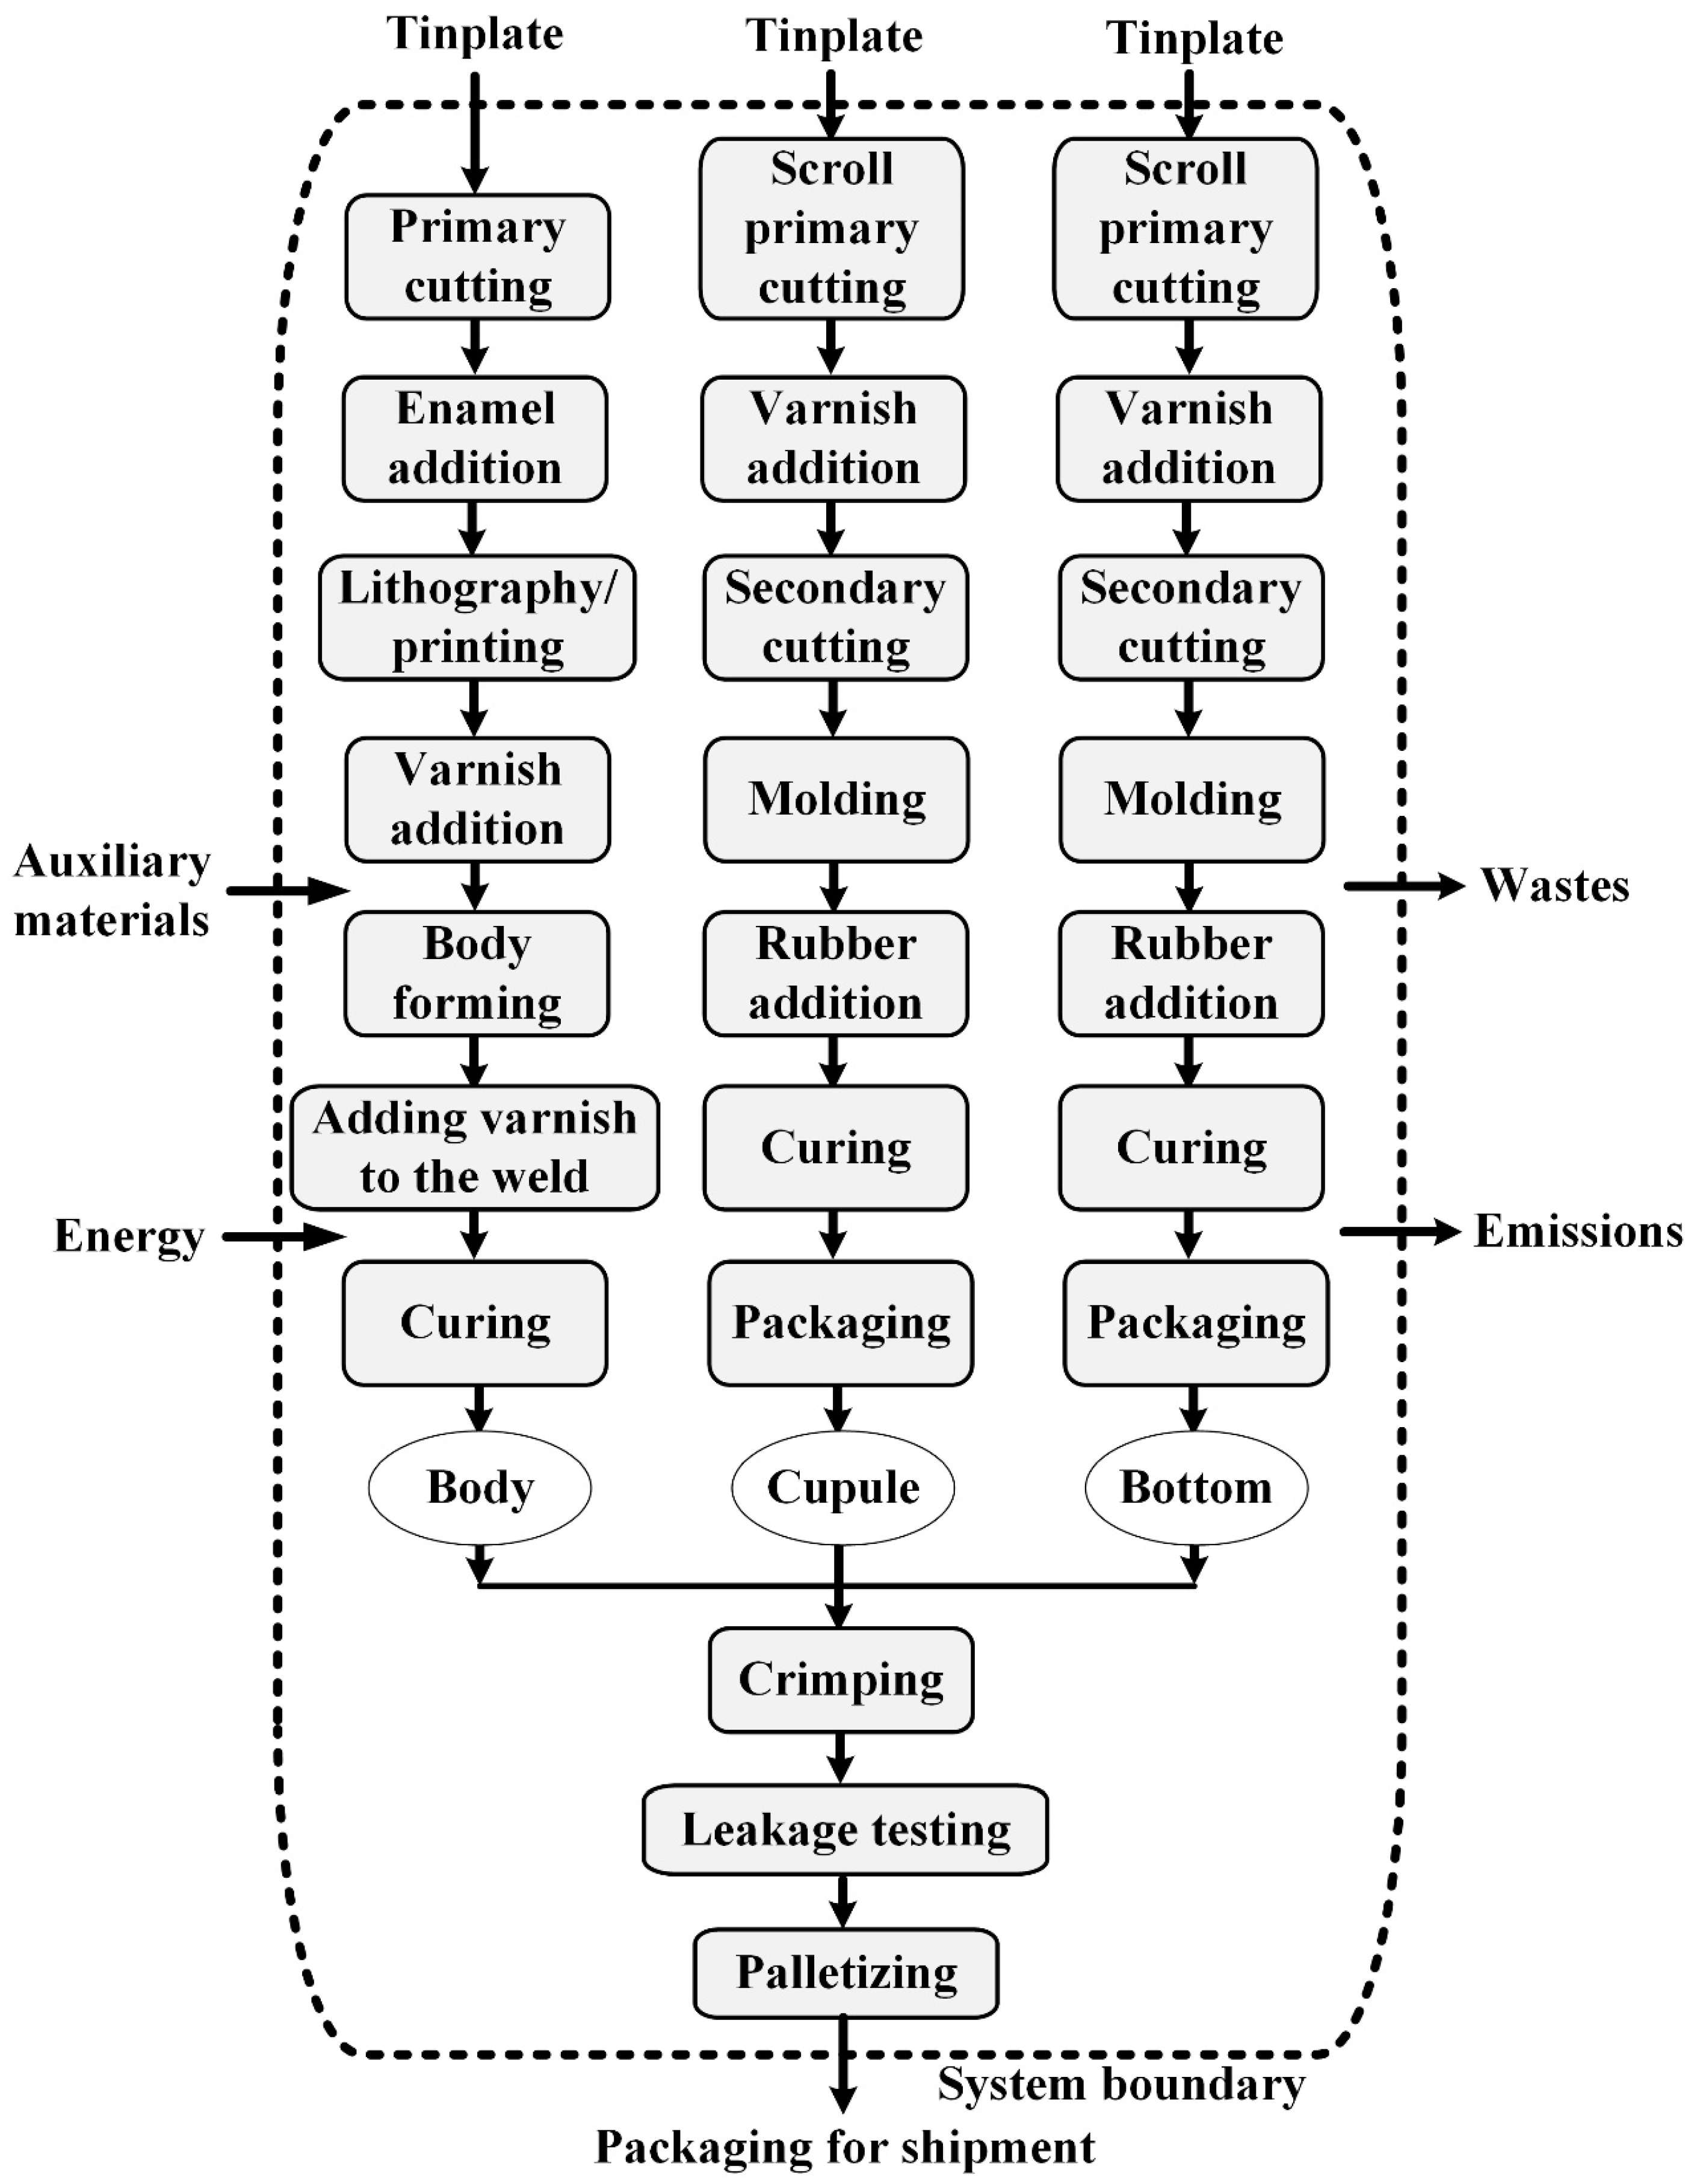
System boundary: This LCA follows a “cradle-to-gate” approach, encompassing the life cycle stages from raw material extraction to the final assembly of the tinplate aerosol can, as illustrated in
Figure 1. The system boundary includes the processing of essential materials such as tinplate, paints, enamels, varnishes, and sealing rubber, all crucial for the production of the aerosol can. Other auxiliary materials include wood pallets, offset aluminum printing plates, Kraft paper, cardboard, PET straps, and plastic nets. It also accounts for the energy inputs required during manufacturing, including both electricity and thermal energy. However, the study excludes post-production stages, including can filling, distribution, use, and end-of-life processes, as they fall outside the defined system boundaries.
The production of tinplate aerosol cans under study, manufactured by a Portuguese packaging company, begins with the arrival of tinplate coils at the facility, weighing an average of 9 tons. The coil width is carefully selected to minimize material waste, while the thickness meets the specific requirements of the tinplate packaging. The coils are stored in a temperature-controlled warehouse, wrapped in plastic covers to protect them from humidity and environmental elements.
The production process begins with primary cutting, where each tinplate roll is unrolled and cut into individual sheets. The type of cut depends on the component being produced: straight cuts are used for the packaging bodies, while scroll cuts are used for the caps and bottoms. Scroll cuts are preferred for circular components as they help minimize material waste. After cutting, the sheets are stacked and bundled, preparing them for the lithography process.
For the caps and bottoms, a varnish is applied to the tinplate sheets, while an enamel coating is applied to the sheets for the body. These coated sheets are then passed through a natural gas-fired oven, where the coating is cured at around 180 °C.
Before printing, the sheets for the body are treated with a flame to remove any residual fats and moisture, ensuring that the ink will adhere properly. The printing process used is ultraviolet (UV) printing, also known as offset printing. Although UV printing is slower than conventional methods, it is preferred for its high-quality results and its ability to efficiently produce large volumes of lithographed sheets.
The printing process begins with pre-press, where the digital files are separated into individual colors, and each color is engraved onto aluminum transport plates. These plates are then used in the printing machine, which has multiple stations, each dedicated to one color. As the sheets move through the printing machine, a series of rollers transfer ink from the engraved plates to the sheets, applying the ink only to the predetermined areas. The ink is then transferred to a rubber offset cylinder, which stamps the design onto the tinplate. This method ensures high-quality prints, as the sheets pass through printing cylinders that apply pressure, and the ink is then cured using UV radiation chambers. Once the ink has dried, a protective varnish is applied to the sheet to shield the packaging from environmental factors. The sheet then passes through the natural gas-fired oven again, where the protective coating is cured. Once cured, the sheets are ready for the next phase, where they are cut again—either longitudinally and transversally for straight cuts or in a scroll pattern, depending on whether they are intended for the packaging bodies or for components like bottoms and caps.
The production of tinplate aerosol cans follows a process similar to other packaging methods but includes some distinct steps. These cans are made up of three main components: the body, bottom, and cap, which are produced and assembled separately. The bottom is designed with a concave shape to withstand the internal pressure of the aerosol. This shape is achieved through a multi-step stamping process. The cap is shaped through a series of die and punch steps, with intermediate forms created to reach the final design. To ensure a leak-proof seal, a sealing rubber is applied to the edges of the bottom and cap, where they will be joined and then cured. The bottoms and caps are packaged in Kraft paper and stacked, with plastic netting placed between the layers to separate them, ensuring they remain organized and ready for assembly. The flat body is rolled into shape and welded, and varnish is applied to the weld before being cured. Once all three components are produced, the assembly process begins. The cap and bottom are crimped onto the body to create the finished aerosol can.
After assembly, the finished cans are stacked onto a wood pallet, with each layer separated by cardboard sheets to prevent damage. Cardboard corner protectors are added for additional stability and protection during transport and storage. Finally, the entire pallet is wrapped in stretch film to secure the aerosol cans for shipment.
2.3. Life Cycle Inventory: Data and Assumptions
The life cycle inventory (LCI) quantifies the materials, energy, and resources consumed throughout the aerosol packaging production process based on the defined functional unit. This comprehensive approach facilitates a detailed assessment of the environmental impacts at each stage, from raw material extraction to the factory gate.
Data sources and methodology: The analysis integrates primary data obtained directly from a Portuguese manufacturing company, covering foreground processes such as material usage, resource consumption, and energy requirements. This ensures an accurate and detailed inventory for the production phase. For background processes, including raw material extraction, material production, energy generation, and transportation, the study relies on data from the ecoinvent v3.9 database [
29] and SimaPro v9.6 process modeling. This combination of real industrial data and well-established LCI sources ensures a comprehensive and representative environmental impact assessment.
Energy modeling: Energy consumption is categorized into grid electricity and on-site renewable energy generation. For grid electricity, the ecoinvent v3.9 dataset for the Portuguese electricity mix was applied, reflecting the regional energy characteristics. For on-site PV electricity generation, the corresponding ecoinvent v3.9 dataset was used to capture its environmental impacts accurately.
Tinplate modeling. Due to the lack of a specific ecoinvent v3.9 dataset for tinplate, the process was modeled in SimaPro v9.6. In this approach, tinplate was represented as a composite material made up of 99% steel and 1% tin [
2], with each component sourced from the relevant ecoinvent datasets to accurately estimate its environmental footprint. The steel used in tinplate is assumed to have a recycled content of 58%, as reported by APEAL [
5].
Green hydrogen modeling: Since ecoinvent v3.9 does not provide data for green hydrogen production via polymer electrolyte membrane (PEM) electrolysis, the process was modeled in SimaPro v9.6. The model incorporates demineralized water consumption of 0.009 m
3 per kg of H
2 based on chemical reaction stoichiometry [
30]. Energy requirements for the process were set at 55 kWh per kg of H
2, as reported by Smolinka [
31], who indicated that energy requirements for producing 1 kg of H
2 via PEM electrolysis range from 43 to 55 kWh/kg H
2, depending on system efficiency and operating conditions. This value is further corroborated by Noor Azam et al. [
32], whose parametric analysis of PEM electrolysis found energy consumption as low as 54.22 kWh/kg H
2 under optimal conditions. Notably, the process equipment for the PEM electrolysis was not included in the model, as relevant data were unavailable in the LCA software database. Based on these parameters, three electricity sources were compared for green hydrogen production: 100% PV electricity, 100% wind electricity, and 100% hydroelectricity.
Table 1 outlines the ecoinvent v3.9 LCI datasets used for each material and energy input in this study, reflecting the sources and methodologies employed for modeling
2.4. Life Cycle Impact Assessment: Rationale for Method Selection
This LCA study adopts an attributional approach, focusing on the environmental impacts directly associated with the production of tinplate aerosol cans without considering potential changes to the existing system.
For the environmental impact assessment, the ReCiPe 2016 Midpoint (E) method [
33] was selected due to its wide acceptance and comprehensive evaluation of 18 environmental impact categories, offering a balanced overview of the product’s environmental footprint. This method is commonly used in LCA studies [
34,
35], ensuring comparability with other research in the field. ReCiPe 2016 emphasizes long-term sustainability, supports clear communication and reporting, aligns with regulatory frameworks, and promotes continuous environmental improvement. Its results are widely recognized by LCA practitioners and the environmental assessment community, making them both understandable and actionable for stakeholders. This method offers a comprehensive overview of the product’s environmental footprint, addressing the following 18 potential environmental impact categories:
Global warming potential (GWP, kg CO2 eq);
Stratospheric ozone depletion potential (ODP, kg CFC11 eq);
Ionizing radiation potential (IRP, kBq Co-60 eq);
Ozone formation, human health potential (HOFP, kg NOx eq);
Fine particulate matter formation potential (PMFP, kg PM2.5 eq);
Ozone formation, terrestrial ecosystems potential (EOFP, kg NOx eq);
Terrestrial acidification potential (TAP, kg SO2 eq);
Freshwater eutrophication potential (FEP, kg P eq);
Marine eutrophication potential (MEP, kg N eq);
Terrestrial ecotoxicity potential (TETP, kg 1,4-DCB);
Freshwater ecotoxicity potential (FETP, kg 1,4-DCB);
Marine ecotoxicity potential (METP, kg 1,4-DCB);
Human carcinogenic toxicity potential (HTPc, kg 1,4-DCB);
Human non-carcinogenic toxicity potential (HTPnc, kg 1,4-DCB);
Land use potential (LOP, m2a crop eq);
Mineral resource scarcity potential (SOP, kg Cu eq);
Fossil resource scarcity potential (FFP, kg oil eq);
Water consumption potential (WCP, m3).
In ReCiPe 2016, the Equalitarian (E) perspective was chosen for this study as it is generally considered the most balanced in terms of sustainability because it ensures the needs of both present and future generations are addressed. In contrast, the Hierarchist (H) perspective prioritizes scientific and policy-driven decision-making, while the Individualist (I) perspective allows for more personal, market-based decisions with less focus on long-term environmental sustainability [
33].
The Midpoint approach provides detailed insights into specific environmental impacts, such as climate change, enabling more targeted actions to improve environmental performance. By focusing on midpoint indicators rather than endpoints, this method allows for the early identification of potential environmental issues, facilitating proactive solutions before they escalate to endpoint levels. This approach enhances the management of environmental impacts, reducing the risk of irreversible damage and fostering better sustainability outcomes [
33].
3. Results
3.1. Life Cycle Inventory and Process Energy Scenarios
Table 2 presents the life cycle inventory for producing 1000 three-piece tinplate aerosol cans under two energy scenarios. Scenario 1 relies on grid electricity and 100% natural gas, using 23.40 kWh of grid electricity and 4.50 m
3 of natural gas. In contrast, Scenario 2 utilizes 100% PV electricity and a fuel mix of 20% green hydrogen and 80% natural gas, with 0.9 kg of green hydrogen produced through proton exchange membrane (PEM) electrolysis powered by PV electricity. The material inputs are identical in both scenarios, resulting in 101.96 kg of aerosol cans (equivalent to the functional unit of 1000 tinplate aerosol cans). The key difference lies in the energy sources, with Scenario 2 utilizing renewable energy.
Each tinplate aerosol can weigh 101.96 g, with a total tinplate consumption of approximately 112.00 kg per 1000 cans. As a result, the tinplate scrap generated amounts to 10.04 kg, which represents about 8.97% of the total material used. This scrap is then sent for recycling.
To produce 1000 cans, an average weight of 5.2 kg of offset aluminum printing plates is used to print on tinplate sheets. Although reusable, the plates lose their printing quality after several uses and become saturated, rendering them unsuitable for further production. At this point, they are discarded for recycling.
The EU wood pallet, with dimensions of 1200 mm × 800 mm, can transport 1000 aerosol cans arranged across five levels: four levels with 227 cans each and one level with 92 cans. Weighing 25 kg, the pallet is typically reused up to eight times. To calculate its weight contribution per use, the total weight (25 kg) is divided by the number of reuses (8), resulting in 3.125 kg per use. This represents the portion of the pallet’s weight allocated to transporting 1000 aerosol cans. To maximize its lifespan, the packaging company repairs the pallets internally at their pallet selection center, where broken slats are fixed, protruding nails are addressed, and other necessary repairs are made. At the end of their life cycle, the pallets are either sent for recycling or incinerated with energy recovery.
3.2. Environmental Impact Assessment of 1000 Tinplate Aerosol Cans
Figure 2 illustrates the relative contribution (%) of key life cycle inventory items to the potential environmental impacts associated with the production of 1000 tinplate aerosol cans (functional unit, FU).
Tinplate has the highest environmental impact across most categories, primarily due to resource scarcity and health concerns. The most significant impacts arise from mineral resource scarcity (75.39 kg Cu eq/FU, 98%), human carcinogenic toxicity (2.32 × 10
4 kg 1,4-DCB/FU, 96%), and human non-carcinogenic toxicity (1.14 × 10
5 kg 1,4-DCB/FU, 86%), which highlight serious health concerns related to toxic substances released during production. Additionally, freshwater eutrophication (0.13 kg P eq/FU, 85%), marine ecotoxicity (1.57 × 10
5 kg 1,4-DCB/FU, 85%), and terrestrial ecotoxicity (1.62 × 10
3 kg 1,4-DCB/FU, 84%) also pose substantial ecological risks, underscoring the need for better management of toxic emissions to protect human health and ecosystems. Global warming (216.65 kg CO
2 eq/FU, 75%) is another critical impact, emphasizing the importance of reducing carbon emissions. Other notable concerns include fossil resource scarcity (0.13 kg oil eq/FU, 85%), which indicates a reliance on non-renewable resources, and water consumption (1.90 m
3/FU, 74%), pointing to significant pressure on water resources. While stratospheric ozone depletion (65%) and land use (13%) are less critical, they still contribute to the overall environmental burden, highlighting the need for more sustainable resource management. Despite its high environmental burden, tinplate’s recyclability offers a potential path to reducing its carbon footprint. Recycling steel can cut energy consumption by up to 75% and conserve resources while also reducing water use by 40% [
8]. The 58% recycled metal content in tinplate cans underscores the important role recycling plays in minimizing environmental impacts [
5]. However, compared to other composite materials, tinplate’s energy-intensive production process makes it less sustainable unless improvements in recycling and cleaner production technologies are implemented [
20]. By maximizing recycling rates and transitioning to cleaner energy sources in production, tinplate’s environmental impact could be significantly reduced, contributing to a more sustainable, circular economy.
The offset aluminum printing plates have the greatest environmental impact in freshwater ecotoxicity (16.90 kg 1,4-DCB/FU, 33%), followed by terrestrial acidification (0.16 kg SO
2 eq/FU, 16%), and ionizing radiation (2.49 kBq Co-60 eq/FU, 15%). It also significantly contributes to stratospheric ozone depletion (1.47 × 10
−5 kg CFC11 eq/FU, 14%), global warming (36.66 kg CO
2 eq, 13%), and fine particulate matter formation (0.09 kg PM
2.5 eq/FU, 13%). Other notable impacts include ozone formation in human health (0.11 kg NOx eq/FU, 12%), marine ecotoxicity (1.98 × 10
4 kg 1,4-DCB, 11%), and fossil resource scarcity (0.01 kg oil eq/FU, 9%). The offset aluminum plates also contribute to freshwater eutrophication (0.01 kg P eq/FU, 9%), human non-carcinogenic toxicity (1.14 × 10
4 kg 1,4-DCB/FU, 9%), and water consumption (0.23 m
3/FU, 9%). Finally, human carcinogenic toxicity (3%), land use (1%), and mineral resource scarcity (1%) have minimal impacts. To reduce these impacts, improving aluminum recycling, sourcing materials sustainably, and shifting to digital printing technologies are key strategies [
36]. These measures would help minimize resource use, energy demand, and emissions, making the printing process more environmentally sustainable.
Wood pallets’ primary environmental impact is LOP (32.95 m
2a crop eq/FU, 81%), highlighting the large area required for wood production. Other impacts are minimal, including GWP (4%), ODP (5%), and IRP (6%), indicating low emissions. PMFP, MEP, and human health toxicity are minor (1-5%). WCP (5%) and FFP (2%) are relatively low. Overall, land use is the main concern, with other impacts remaining low. While their CO
2 emissions (11.2 kg CO
2 eq/FU, 4%) are relatively low compared to materials like tinplate, the substantial land footprint of wood pallets underscores the importance of adopting sustainable sourcing practices. Using certified sustainable wood or exploring alternatives, such as recycled materials, can help reduce these land use impacts. Additionally, the typical reuse of pallets up to eight times in this study helps to lower their overall environmental burden [
37].
Varnishes, paints, and primers have significant environmental impacts, with WCP (7%) and TAP (7%) being the most prominent, indicating pressure on water resources and soil quality. GWP (3%) and IRP (6%) reflect moderate carbon emissions and radiation risks. ODP (4%) and PMFP (3%) contribute to ozone depletion and air pollution, respectively. FFP (2%) and HTPnc (2%) are relatively low but still relevant. LOP, FEP, and MEP all have minimal contributions (under 3%). Overall, the primary concerns are WCP and TAP.
Grid electricity and natural gas contribute marginally to most impact categories, typically under 5%. For instance, for electricity from the grid, the most significant environmental impacts are IRP (8%), indicating radiation concerns, and GWP (3%), reflecting moderate global warming potential. Other notable impacts include WCP (3%) for water consumption, TAP (3%) for terrestrial acidification, and TETP (3%) for terrestrial ecotoxicity. Lesser impacts include ODP (5%), HOFP (2%), and HTPnc (2%), among others.
For natural gas, the impacts are generally lower, with GWP (1%) and ODP (1%) being the most significant. IRP, HOFP, and FFP contribute minimally (0-2%), with negligible effects in areas like TAP, FEP, and MEP. The marginal influence of operational energy suggests that improving material sourcing, recycling rates, and energy efficiency in raw material extraction could yield more substantial reductions in environmental impacts than focusing solely on energy use during production.
For Kraft paper and cardboard, the most significant environmental impacts are MEP (5.8%), followed by ODP (2.9%) and IRP (1.6%). LOP (2.1%) and FFP (0.7%) also contribute notably, while other impacts, such as GWP (1.1%) and HOFP (0.8%), are relatively minor. For packaging materials, the key environmental concerns are ODP (2.3%) and IRP (0.5%), with smaller contributions from GWP (0.4%) and WCP (0.5%). For sealing rubber, environmental impacts are generally minimal, with low contributions to ODP (0.2%), IRP (0.4%), and other areas like GWP (0.2%) and FEP (0.1%).
3.3. Comparative Analysis of Total Environmental Impacts Across Energy Scenarios
Table 3 presents a comparative analysis of the total environmental impacts associated with Scenario 1, which relies on Portuguese grid electricity and 100% natural gas, and Scenario 2, which utilizes 100% PV electricity along with a fuel mix of 20% green hydrogen and 80% natural gas. The green hydrogen in Scenario 2 is produced through PEM electrolysis, which is entirely powered by PV electricity.
The results indicate that Scenario 2 leads to a modest reduction in GWP by 0.9%, a 1.5% decrease in ODP, and a 3.5% reduction in IRP, reflecting a lower reliance on fossil fuels. Air pollution-related impacts, such as HOFP and EOFP, remain unchanged, while PMFP increases by 1.4%. TAP shows no significant change, indicating stable acid rain precursors. Regarding ecotoxicity, FETP rises by 2.5%, and TETP increases by 5.6%, likely driven by the material demands of photovoltaic panels and hydrogen infrastructure. METP and HTPc remain unaffected, while HTPnc shows a minor increase of 0.8%.
In terms of resource and land use, LOP decreases by 0.6%, suggesting slight efficiency improvements, while SOP remains largely unchanged, indicating that the integration of photovoltaic and hydrogen technologies has a minimal impact on critical material demands. FFP sees a 2.3% reduction, reflecting decreased fossil fuel dependency. However, WCP rises by 3.1%, likely due to the water requirements of hydrogen production.
Overall, while Scenario 2 integrates renewable energy sources, the reductions in environmental impacts are modest, with GWP dropping by less than 1% and FFP decreasing by just over 2%. At the same time, certain impact categories, such as ecotoxicity and PMFP, show increases of up to 5.6%, suggesting trade-offs. These results imply that the benefits of photovoltaic electricity and green hydrogen depend on the energy mix, production processes, and overall system efficiency.
It is important to emphasize that the improvements observed in the energy scenarios are relatively modest because the analysis considers both foreground and background processes. However, the energy scenarios account only for changes in the energy consumption of the foreground processes within the packaging company, specifically for the manufacture of 1000 cans. These foreground processes involve the direct energy use within the packaging facility. In contrast, no changes were made to the energy consumption of background processes, which include the production of raw materials and the fabrication of photovoltaic panels and hydrogen infrastructure in Scenario 2—since these fall outside the direct responsibility of the packaging company.
Although the background processes can have a significant impact on the overall environmental performance of the system, they are not within the company’s control. Therefore, improvements in the energy efficiency or sustainability of these processes would be outside the scope of the packaging company’s direct influence. As a result, the modest environmental gains observed in the energy scenarios should be interpreted within this context, as they specifically reflect the company’s energy use during tinplate can manufacturing. A more comprehensive analysis, including background processes, would offer a broader perspective on the potential environmental impacts, but it would need to acknowledge that those improvements depend on other sectors, such as the energy and materials industries.
3.4. Energy Consumption Impacts in Tinplate Can Production: Scenario Analysis
Since the background processes are outside the direct control of the packaging company,
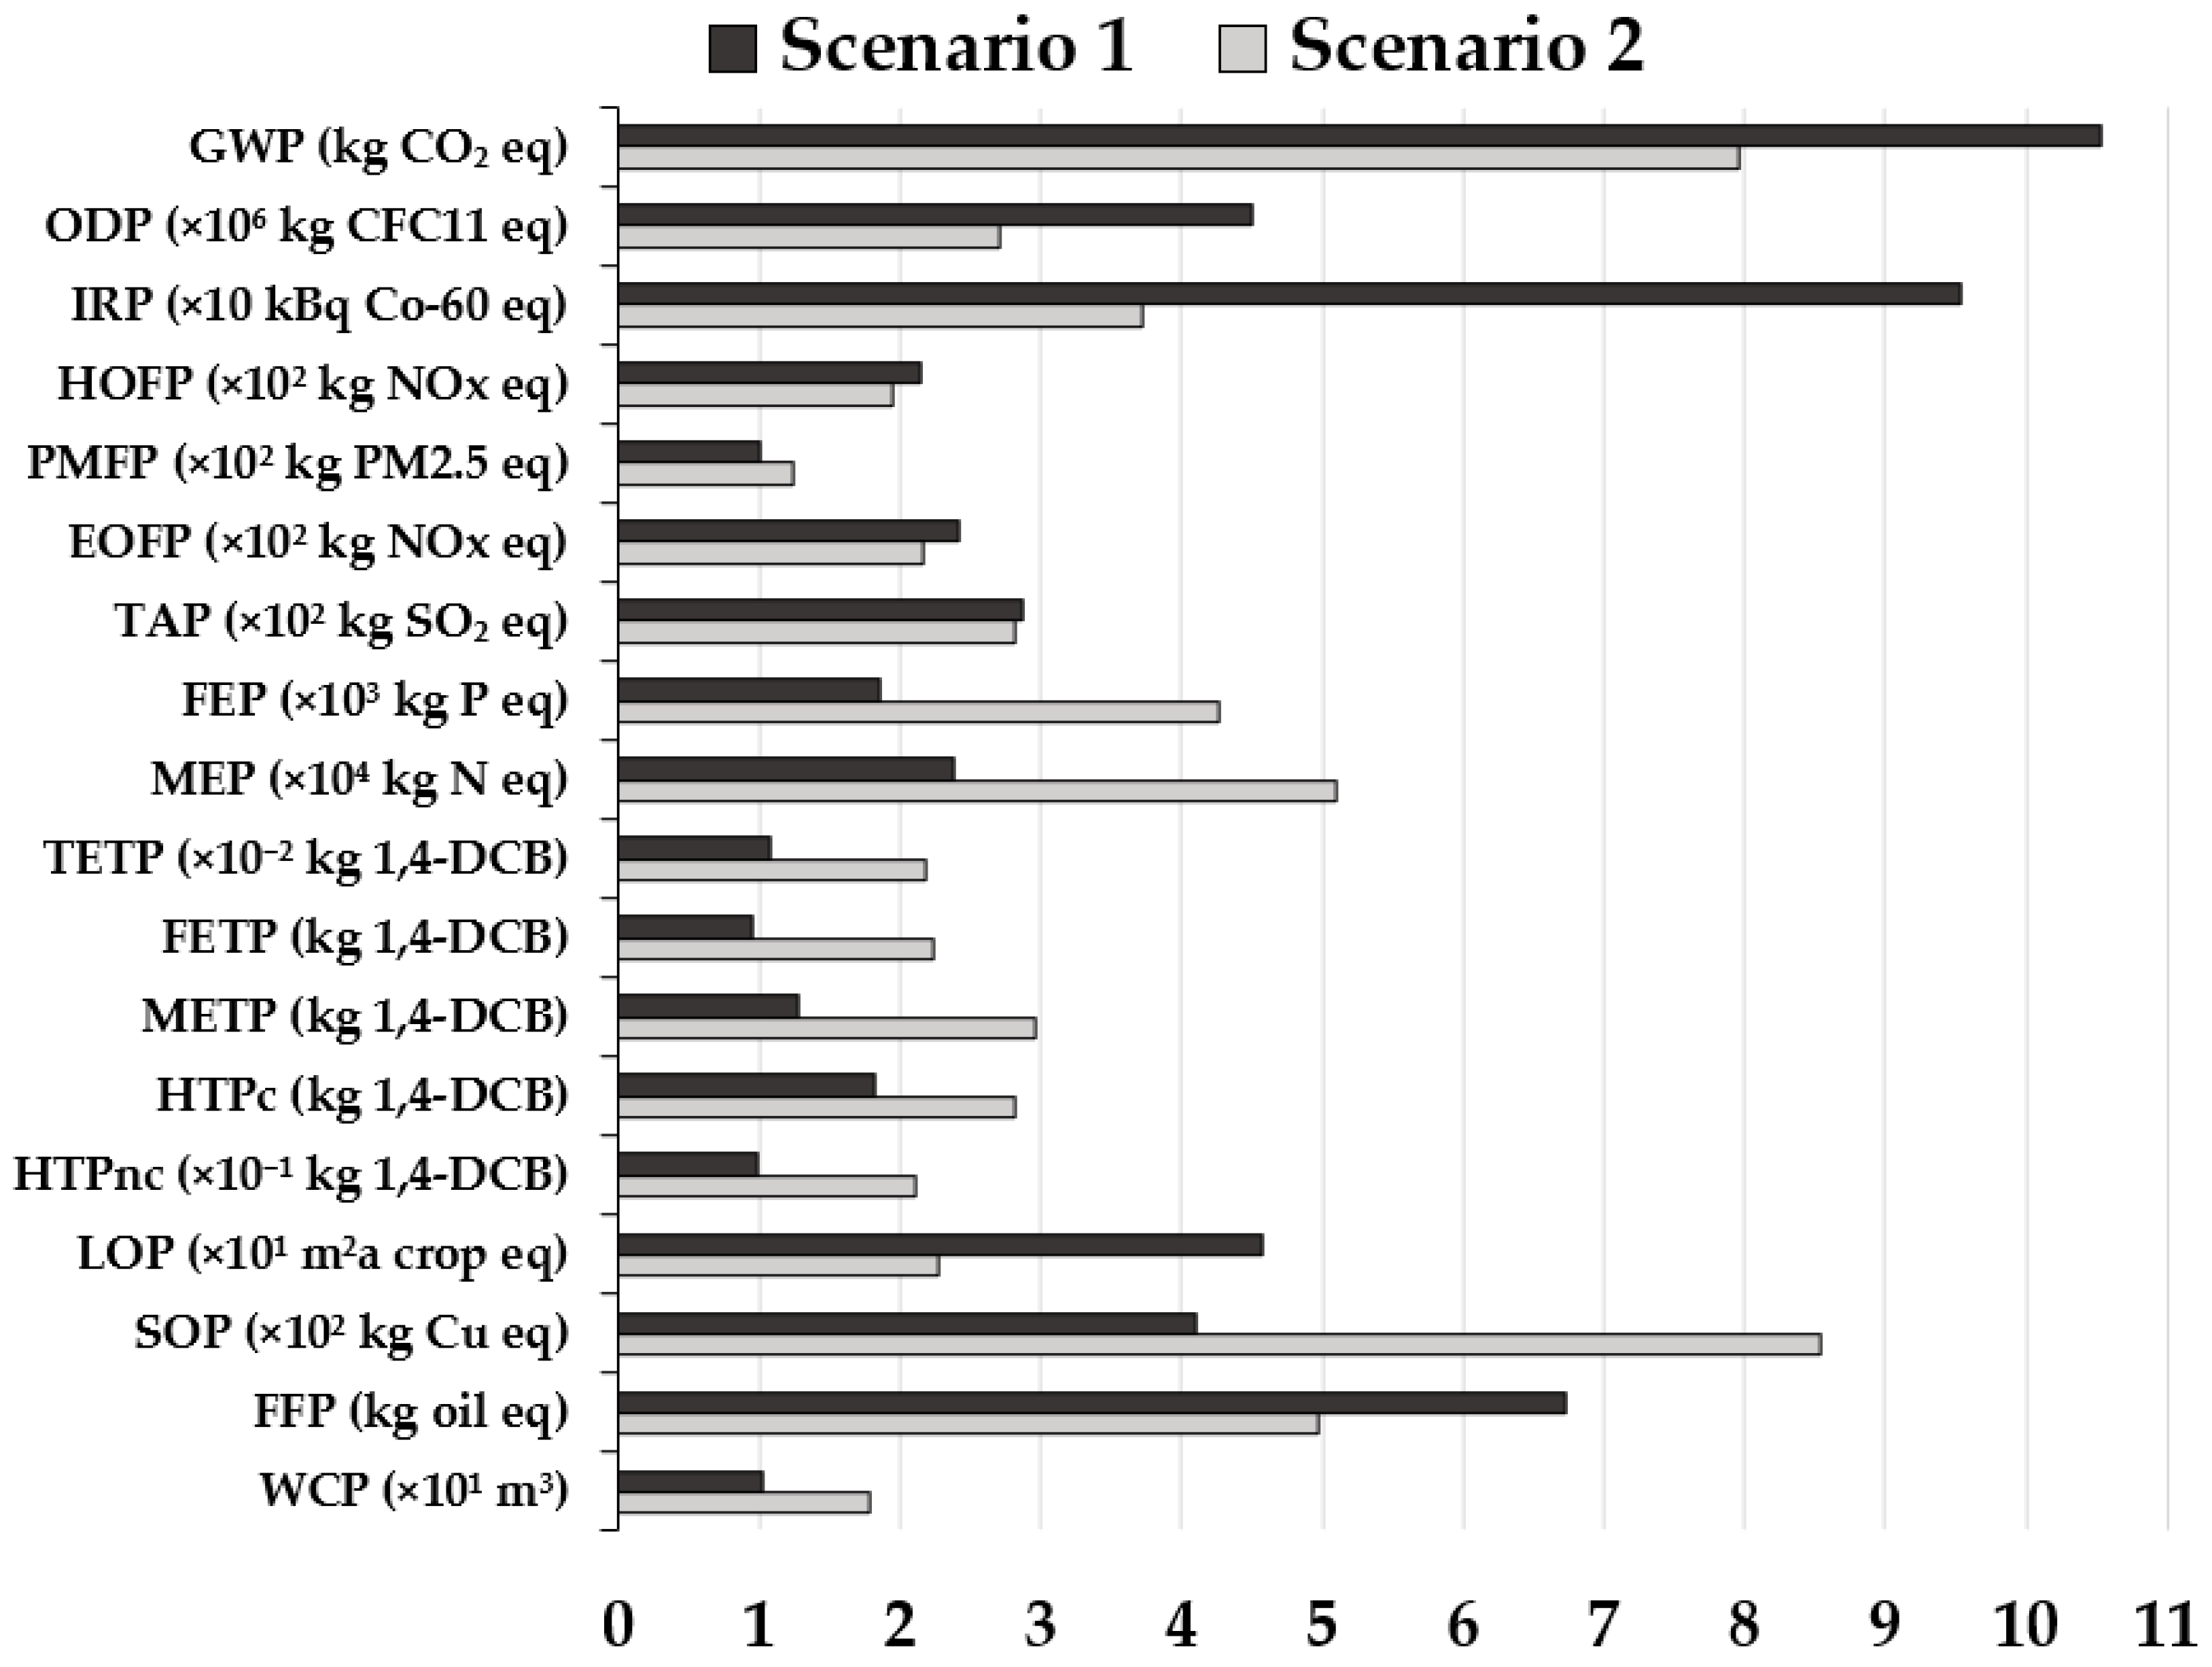
Figure 3 presents a focused analysis of the environmental impacts specifically related to energy consumption in the production of 1000 cans. This analysis isolates energy-related impacts within the foreground processes under the company’s responsibility, excluding those tied to material production. Scenario 1 relies on Portuguese grid electricity and 100% natural gas, whereas Scenario 2 incorporates 100% photovoltaic electricity, complemented by a fuel mix of 20% green hydrogen and 80% natural gas. The green hydrogen in Scenario 2 is produced via PEM electrolysis, powered entirely by PV electricity.
In comparing the environmental impacts specifically related to energy consumption in the production of 1000 cans under the two energy scenarios, Scenario 2 demonstrates a significant reduction in GWP, showing a 24.4% decrease (7.96 kg CO2 eq/FU) compared to Scenario 1 (10.54 kg CO2 eq/FU). This highlights the clear environmental advantage of transitioning to renewable energy for climate change mitigation. Similarly, Scenario 2 results in a 39.8% reduction in ODP, with 2.71 × 10⁶ kg CFC11 eq/FU, compared to 4.51 × 10⁶ kg CFC11 eq/FU in Scenario 1, indicating a decrease in ozone-depleting effects linked to the use of renewable energy. Furthermore, Scenario 2 achieves a 60.9% reduction in IRP, with 3.73 kBq Co-60 eq/FU, compared to 9.54 kBq Co-60 eq/FU in Scenario 1, signifying lower radiation-related environmental impacts due to renewable energy sources.
However, Scenario 2 also presents trade-offs. FEP increases by 128%, with 4.26 kg P eq/FU compared to 1.86 kg P eq/FU in Scenario 1. This increase may be attributed to the environmental impacts of green hydrogen production and the life cycle of photovoltaic systems. Additionally, TAP shows only a modest reduction of 2%, with 2.82 kg SO2 eq/FU in Scenario 2 compared to 2.87 kg SO2 eq/FU in Scenario 1, indicating limited improvements in acidification effects. Scenario 2 also shows a 20% increase in HTPc, while Scenario 1 exhibits a 30% lower HTPnc, particularly for non-carcinogenic toxicity, suggesting potential risks tied to the full life cycle of green hydrogen production.
In terms of land use, Scenario 2 presents a notable environmental advantage, with a 50.3% reduction in LOP, decreasing to 2.28 m2a crop eq/FU compared to 4.58 m2a crop eq/FU in Scenario 1, reflecting the reduced land transformation requirements of renewable energy. However, the rise in SOP by 107.5%, from 4.11 kg Cu eq/FU in Scenario 1 to 8.54 kg Cu eq/FU in Scenario 2, is driven by the higher demand for materials like copper in photovoltaic panel production. Moreover, Scenario 2 shows a 74.8% increase in WCP, with 1.78 m3/FU compared to 1.02 m3/FU in Scenario 1, likely due to the water-intensive processes involved in photovoltaic panels and hydrogen production.
Despite significant reductions in IRP (60.9%), LOP (50.3%), ODP (39.8%), and GWP (24.4%), as well as smaller reductions in HOFP, EOFP, TAP, and FFP in Scenario 2, highlighting its positive impact on climate change and radiation, further optimization of renewable energy technologies is necessary to address the increase in PMFP, FEP, MEP, TETP, FETP, METP, HTPc, HTPnc, SOP, and WCP.
The findings of this study are consistent with those of Mata et al. [
34], who analyzed an alternative scenario of PV electricity and reported reductions in GWP, ODP, and IRP, highlighting the environmental benefits of adopting renewable energy. Additionally, the authors also report increases in categories such as SOP, related to resource use, and TETP, likely due to production processes or materials in energy systems. Similarly, Novais et al. [
35] analyzed alternative renewable energy scenarios (PV and wind electricity) and observed reductions in GWP, ODP, and IRP, along with increases in TETP and SOP.
3.5. Environmental Impacts of Green Hydrogen Production: Comparison of Energy Sources
In the previously analyzed energy scenarios, green hydrogen in Scenario 2 was produced via PEM electrolysis, powered entirely by PV electricity. To compare the production of green hydrogen using other energy sources,
Table 4 provides an overview of the environmental impacts associated with producing 1 kg of green hydrogen through PEM electrolysis using three electricity sources: 100% solar, 100% wind, and 100% hydro. The impact values presented reflect both the electrochemical hydrogen production reaction using demineralized water (0.009 m
3 per kg of H
2) [
30] and the energy required to power it (55 kWh per kg of H
2) [
31].
The table highlights the trade-offs involved in choosing between the three electricity sources for green hydrogen production. Wind electricity stands out as the most climate-friendly and water-efficient option, with relatively low impacts across most categories. PV electricity, while effective in terms of generating clean energy, has higher environmental impacts in terms of global warming potential, resource use, and land use. Hydropower, although water-intensive, presents a more moderate impact in terms of global warming potential and toxicity, but its environmental effects, especially on aquatic ecosystems, remain significant.
Green hydrogen produced using wind electricity has the lowest carbon footprint in terms of GWP, at 0.85 kg CO
2 eq/kg H
2, making it the most climate-friendly option. PV electricity follows with a higher impact of 3.62 kg CO
2 eq kg H
2, likely due to emissions from PV panel manufacturing and material extraction. Hydropower has a moderate GWP of 2.87 kg CO
2 eq/kg H
2, primarily linked to emissions from reservoir construction and maintenance. The World Economic Forum [
38] indicates that green hydrogen production typically has a carbon intensity ranging from 0 to 0.5 kg CO
2 eq/kg H
2, and the Green Hydrogen Standard [
39] sets a maximum threshold of 1 kg CO
2 eq/kg H
2 for green hydrogen projects. However, the GWP values in
Table 4 exceed these thresholds because they include both the demineralized water required for the electrochemical hydrogen production reaction and the energy needed to power the process.
In the ODP category, PV electricity has the highest impact, followed by wind and hydroelectric power. This can be primarily attributed to the use of certain materials in the manufacturing processes, such as refrigerants used in PV systems, which contribute to ozone depletion. In contrast, wind and hydroelectricity sources have lower ODP impacts, reflecting their cleaner manufacturing processes, particularly in terms of using materials with minimal ozone-depleting potential.
PV electricity exhibits the highest IRP, followed by wind and hydro. This difference is primarily attributed to the materials used in PV panel manufacturing, particularly certain metals and the energy-intensive processes involved in their production. In contrast, wind and hydropower technologies have significantly lower IRP, as their manufacturing processes rely less on materials and processes associated with ionizing radiation emissions.
Wind electricity has the lowest impact on ozone formation (both for HOFP and EOFP) and PMFP, making it the most favorable option for human health and the environment compared to PV electricity and hydroelectricity.
Hydropower has a significant impact on FEP, primarily due to nutrient runoff from reservoirs, whereas wind and solar PV exhibit much lower values. This heightened impact stems from hydropower’s dependence on large-scale reservoirs, which can lead to nutrient leaching and algal blooms, disrupting aquatic ecosystems. In contrast, PV electricity and wind electricity, with their minimal direct interaction with water bodies, contribute far less to eutrophication, making them more favorable in this regard.
PV electricity exhibits significantly higher values for TETP and FETP compared to wind and hydro, reflecting the presence of toxic substances such as cadmium and other heavy metals in photovoltaic panel manufacturing. Wind electricity, however, shows a higher impact on HTPc, likely due to materials like fiberglass and other compounds used in turbine production, while hydropower has the lowest toxicity across both categories. The elevated ecotoxicity of PV electricity is expected, given the hazardous materials involved in panel production. Meanwhile, hydropower’s lower toxicity impact can be attributed to its minimal chemical input, though its large-scale infrastructure can still have significant ecological consequences.
Hydro- and PV electricity has the highest LOP impact, while wind electricity has a lower impact. Hydroelectricity shows the highest land use impact, primarily due to the creation of reservoirs, which can affect large areas of land. The land use for hydropower mainly results from the construction of dams and reservoirs, which require significant space and often lead to habitat loss. In contrast, wind farms and solar farms can be located in less sensitive areas. Despite this, the higher land use of PV electricity suggests that large-scale solar farms could be more land-intensive compared to wind farms, which tend to have less land disruption.
PV electricity has a relatively high impact on SOP, particularly for metals like copper, which are used in PV panel production. Wind and hydro, on the other hand, require fewer resources in comparison, especially in terms of FFP, with hydro showing the lowest scarcity for fossil resources. The higher FFP associated with PV electricity is due to its reliance on specific rare minerals and metals, which are more limited. In contrast, wind and hydroelectricity systems are less dependent on such materials, relying on more widely available resources, which contributes to their lower FFP scores.
Hydropower has the highest WCP, at 1.62 m
3, due to evaporation from reservoirs, while PV electricity has a relatively low water consumption (0.13 m
3) and wind has the lowest (0.017 m
3), making it the most suitable option for water-scarce regions. The significant water consumption associated with hydropower is mainly due to its impact on water bodies, with evaporation being a primary factor. In contrast, wind and PV electricity do not rely on water-intensive processes, making them more sustainable options, particularly in water-scarce regions. These values account for both the production of electricity used in PEM electrolysis and the consumption of demineralized water for the electrochemical hydrogen production reaction. According to Océane Mbaguta [
30], hydrogen production by electrolysis typically uses 0.009 m
3 of demineralized water per kg of H
2, consistent with the chemical reaction stoichiometry. For process equipment cooling with a recirculating tower system, water use ranges from 0.021 to 0.095 m
3/kg of H
2, with consumptive use between 0.005 and 0.018 m
3/kg of H
2. A once-through cooling system requires 0.69 to 2.2 m
3/kg of H
2.
This comparison highlights the importance of considering local environmental conditions and resource availability when selecting an energy source for green hydrogen production, particularly when evaluating the full life cycle impacts across various environmental categories. Among the options, PV electricity stands out as the most feasible for local implementation by the packaging company. However, all three renewable energy sources—solar, wind, and hydro—can be accessed through Power Purchase Agreements (PPAs), enabling the company to source green electricity externally if necessary. This approach offers flexibility in choosing the most appropriate renewable energy supply while ensuring a sustainable hydrogen production process.
4. Conclusions
This study assessed the environmental impacts of producing 1000 tinplate aerosol cans by a Portuguese packaging company using a comprehensive LCA while comparing alternative energy scenarios. Tinplate emerged as the material with the highest environmental impacts, particularly in human health (carcinogenic and non-carcinogenic toxicity), marine and terrestrial ecotoxicity, and global warming. Offset aluminum printing plates primarily affect freshwater ecotoxicity, terrestrial acidification, and ionizing radiation. To mitigate these impacts, improving recycling processes, material sourcing, and adopting digital printing technologies are recommended. Wood pallets, with their most significant environmental impact on land use, also contribute to global warming, ozone depletion, and ionizing radiation. Reuse and sustainable sourcing can help lower their environmental footprint. Varnishes, paints, and primers primarily affect water consumption and terrestrial acidification, with moderate effects on global warming and ionizing radiation. Adopting sustainable production methods could help reduce these impacts. Grid electricity and natural gas, associated only with the packaging company processes, show relatively low environmental impacts, with grid electricity mainly affecting ionizing radiation and global warming, while natural gas contributes to global warming and ozone depletion. Kraft paper and cardboard are most impacted by marine eutrophication, ozone depletion, and ionizing radiation, with smaller contributions from land use and fossil resource scarcity. Sealing rubber, however, shows minimal environmental impacts. Overall, improving recycling rates, sustainable sourcing, and cleaner production technologies are key strategies for reducing the environmental impacts of these materials.
In the comparative analysis of energy scenarios, Scenario 2, which utilizes renewable energy, shows modest improvements in some impact categories, such as slight reductions in GWP, ODP, and IRP, along with a decrease in PMFP. However, increases in ecotoxicity impacts (FETP, TETP) highlight the material demands of renewable energy technologies, particularly photovoltaic panels. These limited improvements stem from focusing only on the packaging company’s energy use, excluding upstream processes like raw material production and hydrogen infrastructure, which are outside the company’s control.
When focusing solely on the environmental impacts of energy consumption within the packaging company (i.e., foreground processes), Scenario 2 shows notable reductions in GWP (24.4%), ODP (39.8%), and IRP (60.9%), highlighting the advantages of renewable energy in mitigating climate change, ozone depletion, and radiation impacts. However, trade-offs include increases in FEP by 128%, HTPc by 20%, LOP by 50.3%, and WCP by 74.8%, which reflect the environmental costs associated with green hydrogen production and photovoltaic systems. Despite the improvements, further optimization of renewable energy technologies is necessary to address these trade-offs.
In the analysis of green hydrogen production using PEM electrolysis with three energy sources, wind electricity stands out as the most environmentally favorable option, with the lowest environmental impacts across most impact categories. While PV electricity is effective, it has higher impacts related to global warming, resource use, and land use. Hydropower, although water-intensive, has moderate impacts but can significantly affect aquatic ecosystems. The selection of the energy source for green hydrogen production should consider local environmental conditions. Although PV electricity is the most feasible for the packaging company, all three renewable energy options can be accessed, for example, through PPAs, offering flexibility in sourcing renewable energy for sustainable hydrogen production.


 ,
, 


