Article

Impact of Pollution on Physico-Chemical Parameters and Diatom Communities Diversity in the Main Tributaries of the Arieș River, Romania

by
Mirel Glevitzky
1,2,
Mihai Teopent Corcheş
2,* and
Doriana Maria Popa
3
1
Faculty of Informatics and Engineering, “1 Decembrie 1918” University of Alba Iulia, 15-17 Unirii Street, 510009 Alba Iulia, Romania
2
Faculty of Engineering Hunedoara, Politehnica University Timişoara, 5 Revolutiei Street, 331128 Hunedoara, Romania
3
Alba Iulia County Emergency Hospital, 23 Bd. Revoluției 1989, 510096 Alba Iulia, Romania
*
Author to whom correspondence should be addressed.
Environments 2025, 12(10), 389; https://doi.org/10.3390/environments12100389
Submission received: 8 September 2025 / Revised: 16 October 2025 / Accepted: 16 October 2025 / Published: 18 October 2025

Abstract

Human activities in the Apuseni Mountains region, Romania, especially in the Roșia Montană mining area, have significantly impacted water quality in the Arieș River tributaries. This study assessed the main physico-chemical and salinity parameters, along with the contents of trace elements (As, Cd, Co, Cr, Cu, Fe, Mn, and Ni) dissolved in water, as well as in the Abrud, Ștefanca, Valea Seșii, and Sârtaș rivers, the main tributaries of the Arieș River. Maximum concentrations of trace elements were observed in Valea Seșii (e.g., Zn up to 716 µg/L, Fe up to 562 µg/L), while Abrud and Sartăș showed moderate contamination. Diatom analysis revealed a high prevalence of Achnanthidium minutissimum and Planothidium lanceolatum, with teratological forms of A. minutissimum being the most frequent, indicating stress from pollutants. Saprobic index values ranged from 1.21 to 1.91, reflecting water quality from good to moderately impacted. The integration of chemical and biological data highlights the cumulative effects of mining and agricultural activities, demonstrating the utility of combined monitoring for effective freshwater management. Our results showed that numerous diatom taxa are currently present in samples collected from various watercourses within the Aries River basin, reflecting both the biological diversity and the variable influence of environmental factors on aquatic communities.

1. Introduction

Rivers represent major receptors of pollutants originating from diverse anthropogenic sources, carrying chemicals, nutrients, and trace elements derived from households, processing facilities, and urban areas [1]. Surface runoff and uncontrolled discharges facilitate the accumulation of these contaminants in water bodies, thereby degrading water quality and disrupting the balance of aquatic ecosystems. Such pollution generates complex consequences, including eutrophication, biodiversity loss, and risks to human health, with significant implications for the sustainable management of water resources [2].
The historical assessment of mining activities in the region of Apuseni Mountains of Transylvania, Romania, highlights a cumulative environmental impact, primarily linked to acid mine drainage processes and the mobilization of trace elements. These processes have resulted in the contamination of both surface and groundwater bodies, fostering bioaccumulation and ecotoxicity phenomena, with long-term consequences for the functioning of aquatic ecosystems [3]. The Roșia Montană River, a tributary of the Abrud River, presents strongly acidic conditions, with pH values ranging between 2.69 and 3.95, especially in the downstream sections. At the same time, sulfate levels exceed 3600 mg/L, while concentrations of trace elements such as Fe, Zn, As, and Mn increase significantly, reflecting severe pollution largely attributable to discharges from mining galleries [4].
The region under study is heavily influenced by mining activities, which represent the primary source of environmental pollution. Mining operations, including ore extraction and waste disposal, generate significant quantities of heavy metals and acid mine drainage, which can severely affect water quality, soil composition, and ecosystem health [5,6]. Similar environmental issues have been documented in other mining regions worldwide, such as in Chile, Peru, and South Africa, where metal contamination in surface and groundwater has been linked to both historical and ongoing mining activities [7,8,9]. In this context, assessing the metal content in water bodies is crucial for understanding the extent and impact of pollution. Therefore, any study focusing on water contamination should explicitly highlight these aspects from the outset, ensuring that the title, abstract, and introduction reflect the connection between mining practices and metal pollution, and that this link is consistently maintained throughout the manuscript.
Mining operations within the Arieș River basin have significantly affected aquatic ecosystems, leading to progressive declines in water quality and biodiversity [10]. Studies conducted over the past two decades revealed that pollution from mining, industrial, and domestic sources has altered the chemical and biological characteristics of the river system [11,12]. The most affected areas show reduced diatom diversity and increased organic and toxic loads, while recent research confirms diatoms as reliable bioindicators for assessing the ecological impacts of mining activities [13,14].
Human society has always depended on mineral and metal resources for economic, social, and cultural purposes. The increasing demand for these resources has led to production models with significant environmental impacts, which makes the mining and processing industry face major sustainability challenges [15]. The extraction and processing of metalliferous ores contribute significantly to the accumulation of trace elements in soils and sediments. Such pollution has detrimental effects on ecosystems, including rivers and other aquatic environments in the area [16]. The environmental impact of mining in the Roșia Montană area varies significantly depending on the methods used for exploiting gold deposits, the size and nature of these deposits, and the management of waste dumps and tailings ponds, pollution control, and implemented remediation measures [17].
Diatoms are key components of river ecosystems and sensitive indicators of water quality. Their response to environmental stressors, including trace elements, has been studied in both polluted catchments and laboratory experiments, demonstrating their potential for assessing metal contamination [18]. The structure and diversity of periphytic diatom communities, affected by metal pollution, are strongly influenced by the variability of environmental factors, highlighting the complex interaction between chemical stress and local ecological conditions [19]. Morphological variability in diatoms may be either adaptive or non-adaptive in response to environmental conditions. In the latter case, teratological forms arise, usually affecting valve morphology or striation patterns. Such alterations can be transmitted during reproduction, leading to populations that exhibit morphological traits distinct from those of the parental lineage [20].
The aim of this study is to assess the water quality in the main tributaries of the Aries River near the Roșia Montană mining area, by integrating physico-chemical and biological analyses, including heavy metal and nutrient concentrations, diatom community structure, and the occurrence of teratological forms. These were carried out in order to identify the impact of anthropogenic activities on aquatic ecosystems, establish the degree of organic and metallic pollution, and provide relevant information for the sustainable management of freshwater resources.

2. Materials and Methods

2.1. Study Area and Its Characteristics

The study monitored the watercourses within the Arieș–Turda hydrotechnical system, on the territory of the Arieș Hydrographic Basin, located in the Metaliferi Mountains. These are represented by the Abrud, Ștefanca, Valea Șesii, and Sartaș rivers. The area is well known for its mining activities, which determine the drainage of mine waters into the mentioned watercourses, as well as the existence of tailings ponds associated with the mining and processing processes of minerals. The investigated area is located on the territory of Alba County, Romania. The monitoring points are located in the vicinity of the mining operations in the Roșia Montană region, according to Figure 1 and Supplementary Table S1.
Supplementary Table S1 presents the river water sampling points in the Aries River Basin along with coding and their main characteristics.

2.2. Water Sampling

To obtain an overall picture of the river water quality in the tributaries of the Arieș River, samples were collected over a period of 3 years: 2022, 2023, and 2024 (in January, April, July, and October). For each sampling event at each site, a single water sample of sufficient volume was collected to allow determination of the physical and chemical parameters. This ensured a wide range covering all seasons, various climatic conditions, precipitation levels, and flow rates of the investigated rivers.

2.3. Analysis of River Water Samples

2.3.1. River Water Quality Parameters

The pH values of the river water samples were determined using a Voltcraft PH-100ATC pH meter (Conrad Electronic SE, Hirschau, Germany).
Total Suspended Solids (TSSs). A 100 mL river water sample was filtered under vacuum. The filter was then dried at 105 °C in a flask until its weight stabilized. Calculation: TSS [mg/L]: (c2 − c1) · 1000/V (mg/L). c1—mass of the filter flask (mg); c2—mass of the filter flask and retained solids (mg); V = volume of the river water sample analyzed (mL) [21].
Dissolved Oxygen (DO). An amount of 250 mL of river water was treated with a 40% MnSO4 solution and a solution consisting of 30 g NaOH and 15 g KI per 100 mL. The formed solution is titrated with a Na2S2O3 0.025 N solution. Calculation: DO = (V · f · CN · EOxygen)/(V1 − 4) · 1000 (mg O2/L water), where V is the volume (mL) of Na2S2O3 0.025 N solution used in the titration, V1 is the volume (mL) of the water sample used, f is the factor of the Na2S2O3 0.025 N solution, and Cn is the normal concentration of the Na2S2O3 solution [22].
Biochemical Oxygen Demand (BOD). The bottles were filled with the sample, avoiding air bubbles. The initial DO (DO0) was determined immediately. The bottles were sealed and placed in an incubator at 20 ± 1 °C, in the dark. After 5 days, the final DO (DO5) was determined from other identical bottles (the initial one is not reopened). The BOD5 was determined on an undiluted water sample using the equation: DBO5[mgO2/L] = OD0 − OD5 [23].
Chemical Oxygen Demand (COD-Cr). Untreated or homogenized water samples were placed into reaction tubes, avoiding air bubbles. Measured amounts of reagents, including 0.5 mL of 0.015 mol/L K2Cr2O7, 0.2 mL HgSO4, and 2.5 mL Ag2SO4, were added to each tube. For COD-Cr determination, 2 mL of the homogenized water sample was also added prior to analysis. The tubes were sealed and heated in a reactor at 150 °C for about two hours and then cooled for 20 min. The dissolved oxygen concentration in the samples is measured. The contents were transferred to titration beakers, rinsed with distilled water, and titrated with 0.012 mol/L FeH8N2O8S2 (Mohr’s salt) in the presence of ferroin until a reddish-brown color appeared. A blank with distilled water was used for correction. Calculation: COD-Cr = ((8000 · c · (V1 − V2))/V0) · r, where c is the concentration of the FeH8N2O8S2 solution, V0 is the sample volume, V1 is the volume of titrant used for the blank, V2 is the volume used for the sample, and r is the dilution factor [24].
Ammonium nitrogen (N-NH4). An amount of 40 mL of river water sample was mixed with 4.00 mL of colored reagent and 4.00 mL of C3Cl2N3NaO3 solution, and then diluted with distilled water to a final volume of 50 mL. Fill up to the mark with distilled water. After shaking, the flask is placed for 1 h in a water bath at 25 °C, and the absorbance is measured at λ = 655 nm. Calculations: Ammonium (N) = c · r [mg/L], where c—ammonium concentration in the photometered solution in mg/L; r—dilution factor 40 mL/sample volume used), Ammonium = N/0.777 [mg/L]. (1 mg/L of NH4+ corresponds to 0.777 mg/L of nitrogen) [25].
Nitrite nitrogen (N-NO2). An amount of 40 mL of water sample is mixed with 2 mL of sulfanilamide solution and 2 mL of NEDA solution, and then diluted with distilled water to a final volume of 50 mL. After 15 min, the absorbance is measured at 540 nm: Nitrites (N) = c × r [mg N/L], where c is the nitrogen content in the photometrically analyzed solution, in mg/L, and r is the dilution factor, defined as 40 mL divided by the volume of sample used for analysis. To express nitrites as NO2, the following formula is used: Nitrites (NO2) = (c × r)/0.304 [mg NO2/L], where 0.304 is the conversion factor from mg/L N to mg/L NO2, corresponding to the relationship 1 mg/L NO2 = 0.304 mg/L N [26].
Nitrate nitrogen (N-NO3). An amount of 5 mL of the river water sample was treated with 0.5 mL of NaN3 solution and 0.2 mL of CH3-COOH, and then evaporated to dryness. An amount of 1 mL of sodium salicylate solution was added and evaporated again. An amount of 1 mL of concentrated sulfuric acid was added, and the mixture was left for ten minutes. After adding 10 mL of distilled water and 10 mL of alkaline solution, the mixture is transferred to a 25 mL flask, placed in a 25 °C water bath for ten minutes, and then filled to the mark. The absorbance was measured at 415 nm using a blank with double-distilled water. If the nitrogen concentration exceeds 0.2 mg/L, a smaller sample volume is diluted before analysis. Calculations: N[mg/L]= (c × r × 25)/Vsample, where c is the nitrogen concentration [mg/L] determined in the photometered solution from the calibration curve, r is the dilution factor, and Vsample is the volume of the sample taken for analysis [mL]. The value 25 represents the final volume of the volumetric flask [mL]. To express the concentration as nitrate [mg/L NO3], it is considered that 1 mg/L NO3 corresponds to 0.226 mg/L N. Thus, the conversion is made according to the relation: NO3[mg/L] = N[mg/L]/0.226 [27].

2.3.2. River Water Salinity Parameters

Electrical conductivity (EC) was measured using a Eureka Manta 2 multiparameter probe (Eureka Inc., Austin, TX, USA).
Solids, Filterable Residue (FR). A 100 mL water sample was filtered, and the filtrate was evaporated and then dried at 105 °C to constant weight. Calculation: FR mg/L = (c2 − c1) × 1000/V (mg/L), where c1—mass of the empty crucible (mg), c2—mass of the crucible with the filter residue dried at 105 °C (mg), and V—volume of the water sample (mL) [28].
Bicarbonates. An amount of 100 mL of river water was titrated with 0.1 N HCl using phenolphthalein and then methyl orange as indicators. The volume of HCl used in the second titration corresponds to the bicarbonate concentration, which is calculated as HCO3 = (V × N × 61 × 1000)/Vsample, mg/L, where V = volume of HCl used for bicarbonate titration (L); N = normality of HCl; 61 = molar mass of HCO3 (mg/mmol) [29].
Chlorides. An amount of 100 mL of the river water sample is placed in an Erlenmeyer flask and the pH is adjusted to 5–9.5. An amount of 1 mL of potassium chromate indicator was added, and the solution was titrated with 0.02 mol/L AgNO3. For the blank, use water instead of the sample. Calculation: Cl (mg/L) = (V − V0) × NAgNO3 × FAgNO3 × d × f)Vsample, where V = volume of AgNO3 used for the sample (mL); V0 = volume of AgNO3 used for the blank (mL); NAgNO3 = normality of AgNO3 (0.02 mol/L); FAgNO3 = factor of the AgNO3 solution; d = dilution factor; f = 35,453 mg/mol; Vsample = sample volume (mL, usually 100 mL) [30].
Sulfate. A measured volume of water sample was treated with BaCl2 to precipitate sulfate as BaSO4, forming a turbid suspension. The turbidity was measured at 420 nm, and sulfate concentrations were determined from a calibration curve, expressed as mg/L SO42− [31].

2.3.3. ICP-MS Metal Analysis in River Water Samples

Water samples were first filtered through 25 mm diameter syringe filters with 0.45 µm pore PTFE membrane pre-washed with diluted nitric acid (d = 1.4, 1:1) to achieve a pH ≤ 2, and the filtered samples were thoroughly mixed before analysis and stored at 4 °C prior to analysis. The samples were subjected to microwave-assisted digestion using the Transform 680 system (Aurora Instruments Ltd., Vancouver, BC, Canada). Mineralization was performed in TFM-PTFE vessels with real-time monitoring of temperature and pressure. Complete sample decomposition was achieved using a 3:1 mixture of hydrochloric and nitric acids (Aqua regia, Merck, Germany). After digestion, the resulting clear solutions were diluted to a final volume of 25 mL with distilled water. Elemental analysis was conducted using an Agilent 7700x ICP-MS instrument (Agilent Technologies, Tokyo, Japan) equipped with MicroMist nebulizer and H2 collision/reaction cell gas line, as well as an ASX520 autosampler. All measurements were performed in triplicate and processed with MassHunter Workstation Software, version G7201A A.01.02 [32].

2.4. Sampling of Periphytic Biofilm from Submerged Surfaces

Biofilm samples were collected on 25.04.2024 by scraping with a disposable plastic toothbrush from at least five submerged stones, each with a surface area of at least 10 cm2, selecting areas with water flow below 20 cm/s. After scraping, the toothbrush was periodically rinsed in a plastic tray containing approximately 50 mL of river water. Once sampling was complete, the resulting suspension was transferred to a polyethylene container and preserved with Lugol’s solution (1 mL per 1 L of sample) to inhibit cell division and prevent decomposition of organic material [33].
Under controlled laboratory conditions, benthic diatoms were cleaned using the hot H2O2 method to remove organic material, stabilizing their siliceous frustules for subsequent analysis. The sample was homogenized by agitation, and 10 mL of the suspension was moved to a laboratory beaker. Then, 20 mL of hydrogen peroxide was added, and the mixture was heated in a water bath at 90 °C until complete oxidation of the organic material (1–3 h). After heating, the beaker walls were rinsed with distilled water, and the suspension was allowed to settle. The washing process was repeated three times to remove any residual peroxide. The diatom suspension was then concentrated in a small volume of distilled water and transferred to a clean vial. After settling, excess supernatant was removed with a Pasteur pipette. A drop of the remaining suspension was placed on a clean microscope slide and evaporated gently using a hot plate. The prepared sample was examined under a Zeiss Axio LAB.A1 light microscope (Carl Zeiss Microscopy GmbH, Jena, Germany) at 1000× magnification, and 300–600 individual diatom valves were identified. Data were interpreted using the saprobic index method [34]. The saprobic value for each species was obtained from Romanian Order no. 161/2006 [35]. Based on the saprobic valence, species were assigned values as follows: Oligosaprobic–1 (o); Oligo-beta-mesosaprobic–1.5 (o–β); Beta-mesosaprobic–2 (β); Beta-alpha-mesosaprobic–2.5 (β–α); Alpha-mesosaprobic–3 (α); Alpha-meso-polisaprobic–3.5 (α–p); Polisaprobic–4 (p). The relative frequency of each species was calculated as a percentage (F. Rel%) using the formula: FRel% = (total count/species count) × 100. p is the number of individuals of a species and ∑p is the total number of individuals in the sample. Based on relative frequency, a weighted frequency (h) was assigned according to the following scale: <1%→h = 1; 1–3%→h = 2; >3–10%→h = 3; >10–20%→h = 4; >20–30%→h = 5; >30–40%→h = 7; >40–100%→h = 9. The saprobic index (S) was calculated using the formula S = ∑(si⋅hi)/∑hi, where si is the saprobic value of species i, and hi is its weighted frequency. The saprobic index was interpreted as follows: 1.0–<1.5→Oligosaprobic (no pollution, Class I quality); 1.5–<1.8→Oligo-beta-mesosaprobic (slight pollution, Class I quality); 1.8–<2.3→Beta-mesosaprobic (moderate pollution, Class II quality); 2.3–<2.7→Beta-alpha-mesosaprobic (moderate to critical pollution, Class III quality); 2.7–<3.2→Alpha-mesosaprobic (strong pollution, Class IV quality); 3.2–<3.5→Alpha-meso-polisaprobic (strong to very strong pollution, Class V quality); 3.5–4→Polisaprobic (very strong pollution, Class V quality) [36].

2.5. Statistical Analysis

Canonical Correspondence Analysis (CCA) was performed to assess variations in water quality and the distribution of diatom species across sampling sites using PAST software (version 5.2.1). Principal Component Analysis (PCA) and Pearson correlation coefficients between trace element concentrations and diatom species distribution were calculated using Minitab (version 21.4.1).

3. Results

For water quality assessment, a chemical analysis of rivers in the Arieș basin, tributaries with major impact from areas with mining activities, is carried out to identify natural and anthropogenic influences and to monitor seasonal and geographical variations in the chemical composition of the water and diatom species.
The following presents the physico-chemical parameters for the Abrud River at three sampling points: at the source, downstream of the confluence with the Roșia Montană River, and upstream of the confluence with the Arieș River. This analysis allows a comparative assessment of surface water quality, highlighting the impact of pollution caused by acid waters from the Roșia Montană River, a tributary of the Abrud River.
Table 1, Table 2 and Table 3 show the physico-chemical parameters of the Abrud River at its source, in the locality of Bucium Sat.
The water quality classes used in this study were established based on the thresholds defined by the Romanian Ministry of Environment Order No. 161/2006 [35] and in accordance with the European Union Water Framework Directive [37]. These classes categorize water bodies into five quality levels—High, Good, Moderate, Poor, and Bad—based on deviations from reference or natural conditions, using physico-chemical parameters.
The analysis of the physico-chemical parameters of the Abrud River in the village of Bucium Sat (at the source) indicates generally very good water quality, corresponding to Class I for most parameters, with a single exception in October 2024 when the pH reached 8.7, suggesting slight alkalinization possibly due to natural processes or minor anthropogenic influences.
Between 2022 and 2024, the Abrud River at Bucium Sat exhibited low salinity. These results indicate weakly mineralized water with no significant influence from saline pollution sources.
Cadmium, one of the most toxic metals, varied between 0.28 and 0.63 μg/L, slightly exceeding the Class I limit of 0.5 μg/L in a few isolated cases (July 2022, April and July 2023, July 2024), temporarily placing the water in Class II for this parameter. These minor increases may be associated with periods of intense runoff or seasonal mobilization from soils. Dissolved metals were present at very low concentrations.
Although the biofilm samples were collected on a single date (25 April 2024), they provide a snapshot of the ecosystem’s status at that time. These results are interpreted alongside long-term chemical and physical monitoring data to assess the influence of mining activities in the area, so even a single biological sample can offer valuable insight into the potential impacts of local mining on the aquatic ecosystem.
Table 4 presents the diatom species identified in the water of the Abrud River at its source, in the Bucium Sat area (A1), the number of individuals for each species, the associated saprobic zone, and the saprobic value.
The diatom composition and the saprobic index (1.91) indicate water with low organic pollution, corresponding to a moderate ecological class. The dominant species in the β and o-β zones suggest a slightly impacted environment by organic matter, but with generally good conditions for maintaining the aquatic ecosystem.
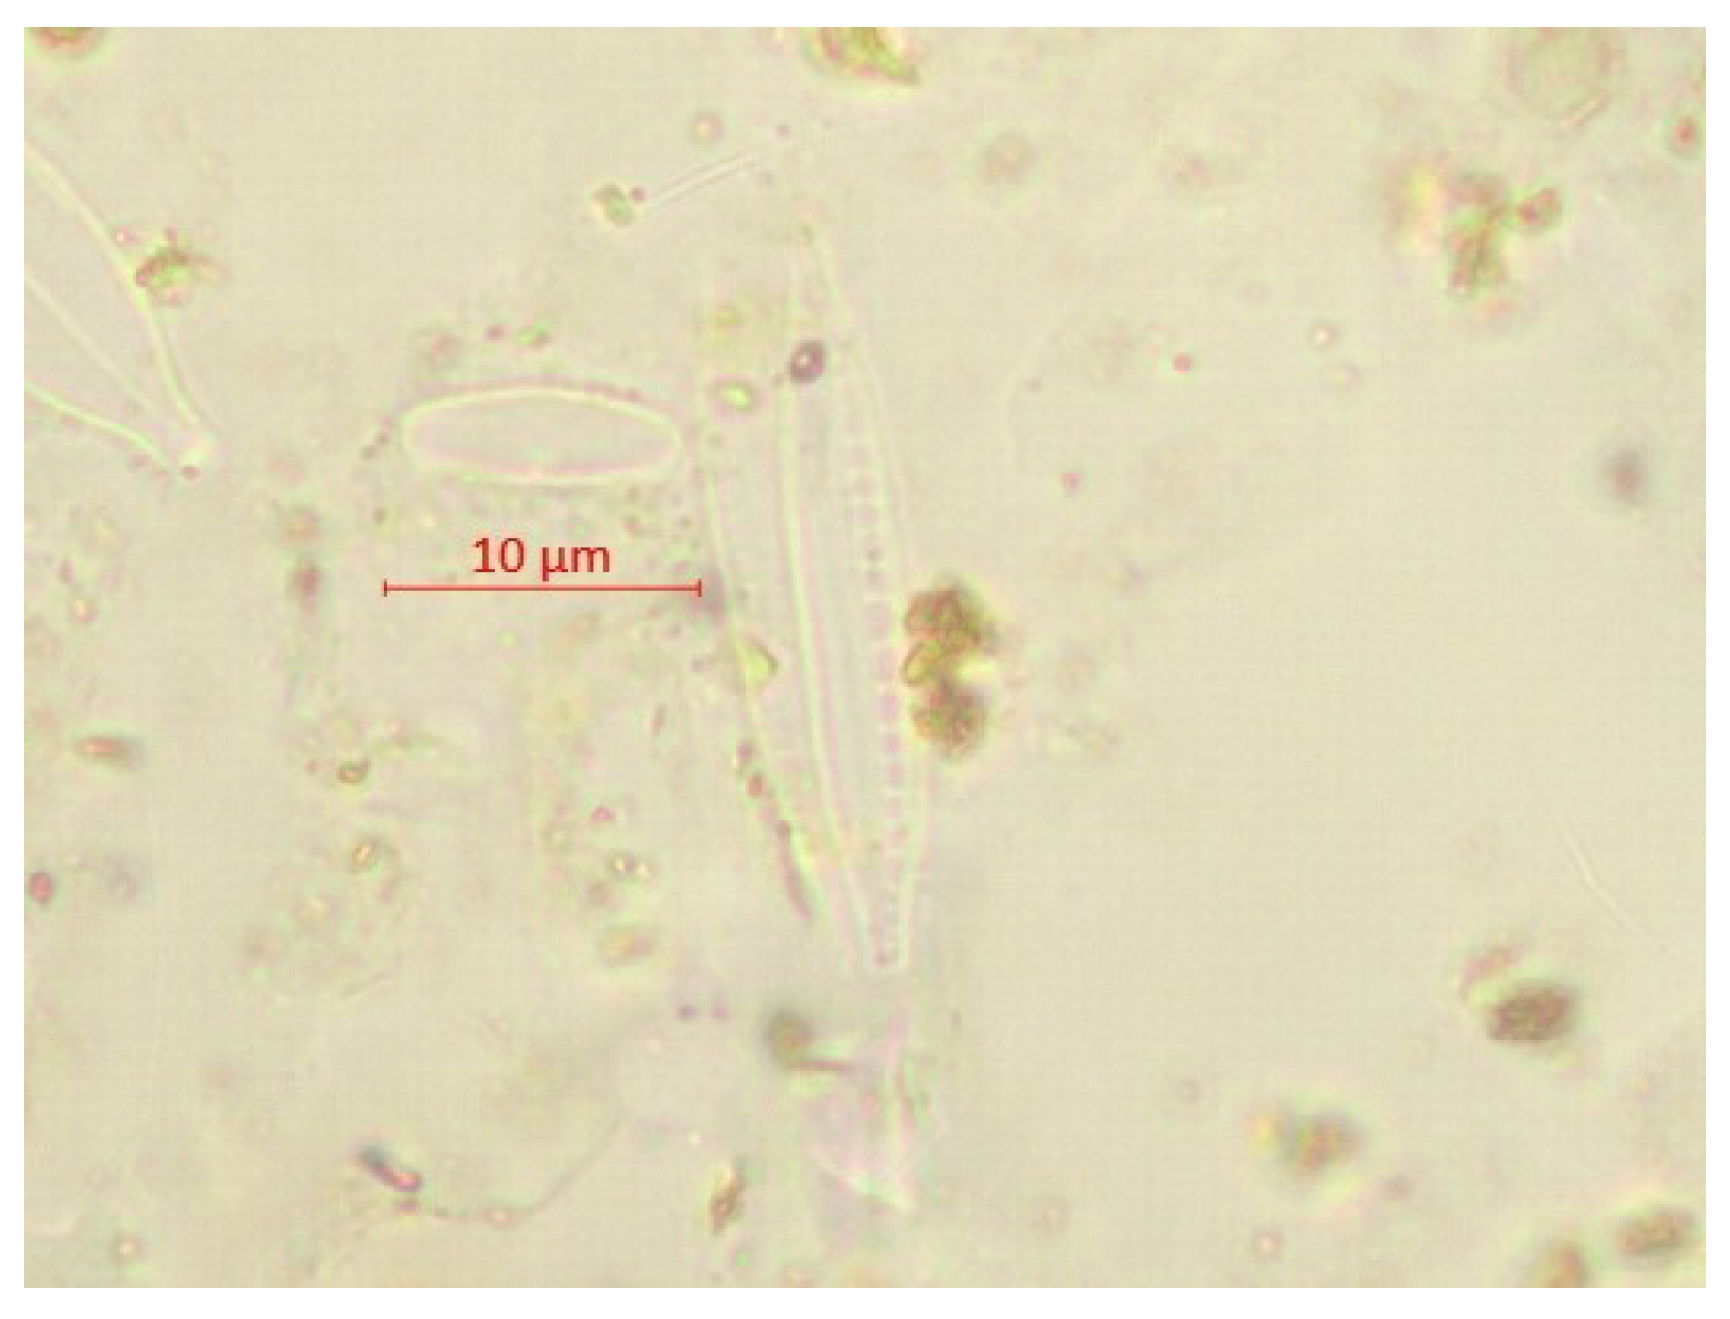
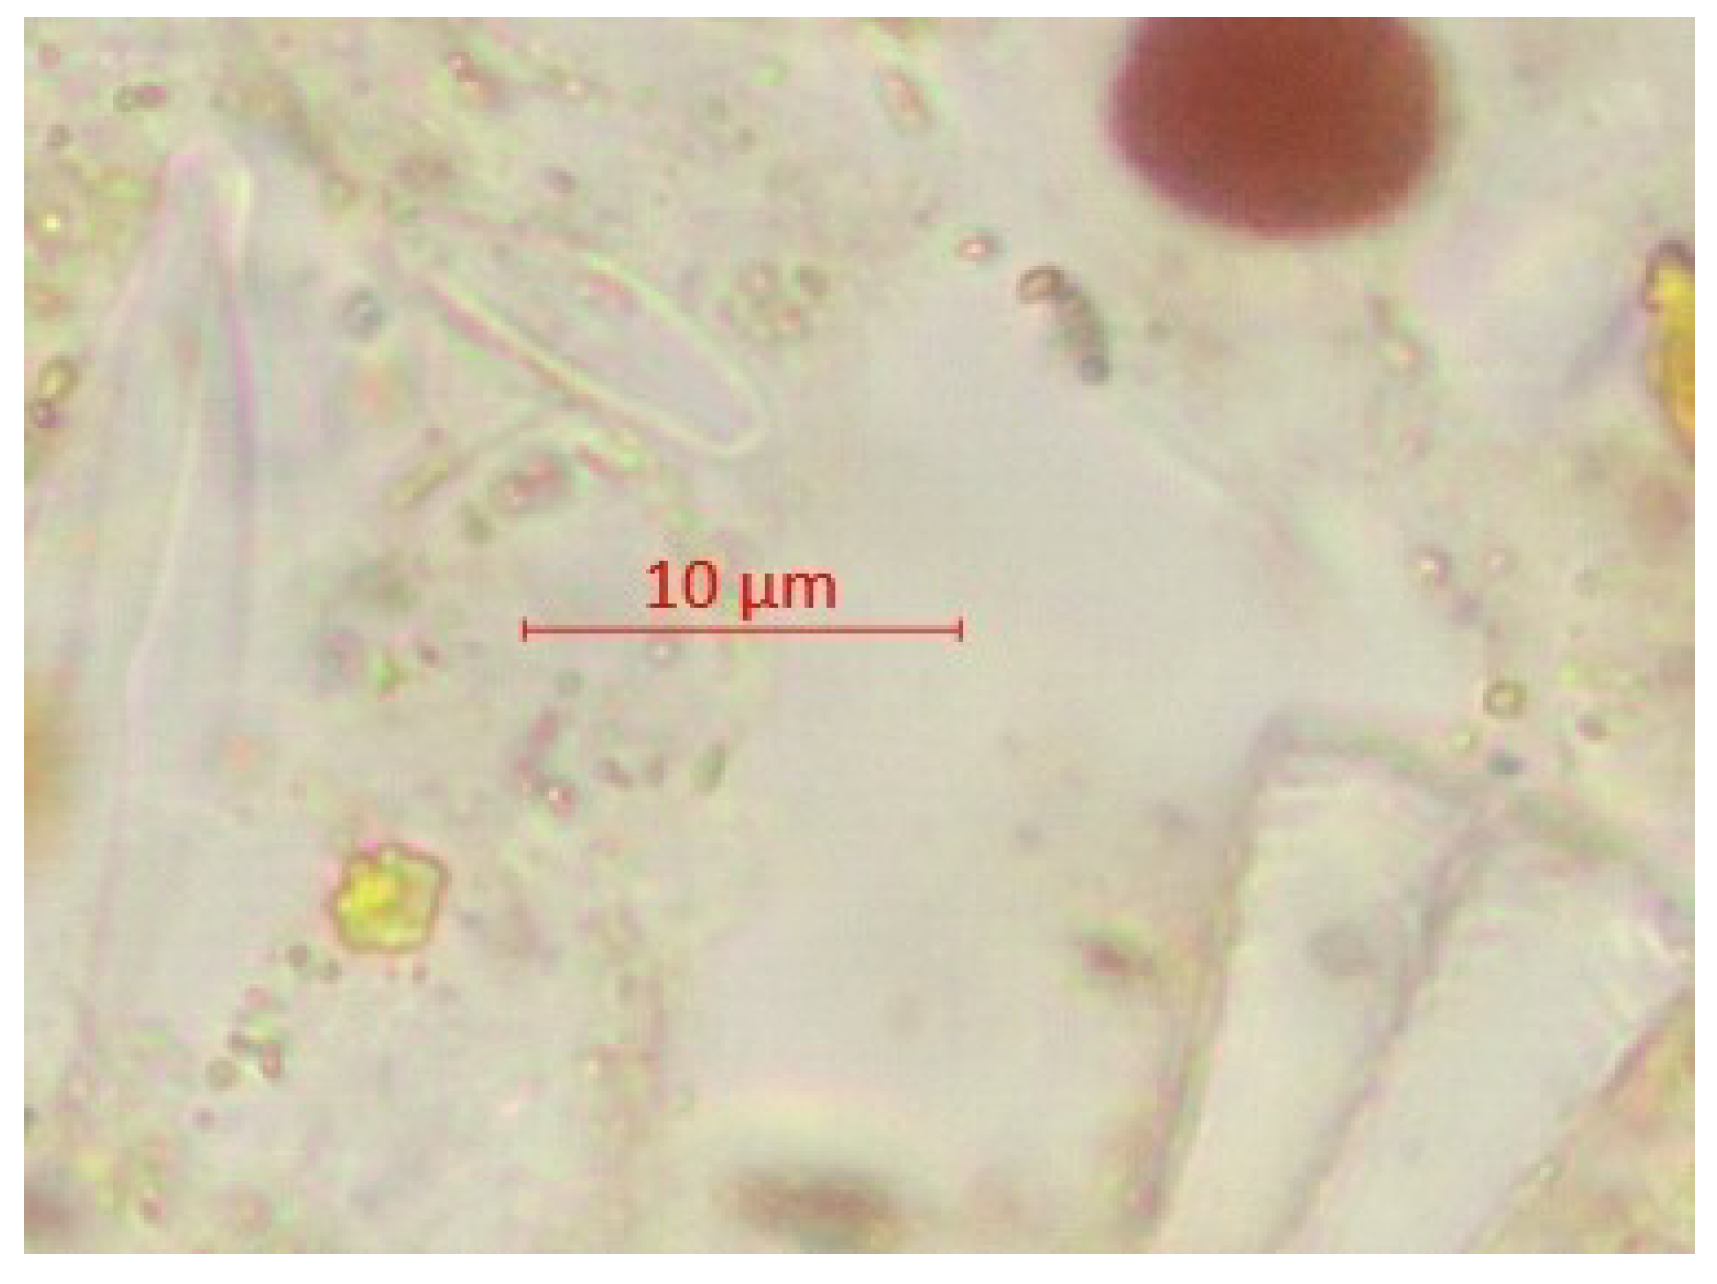
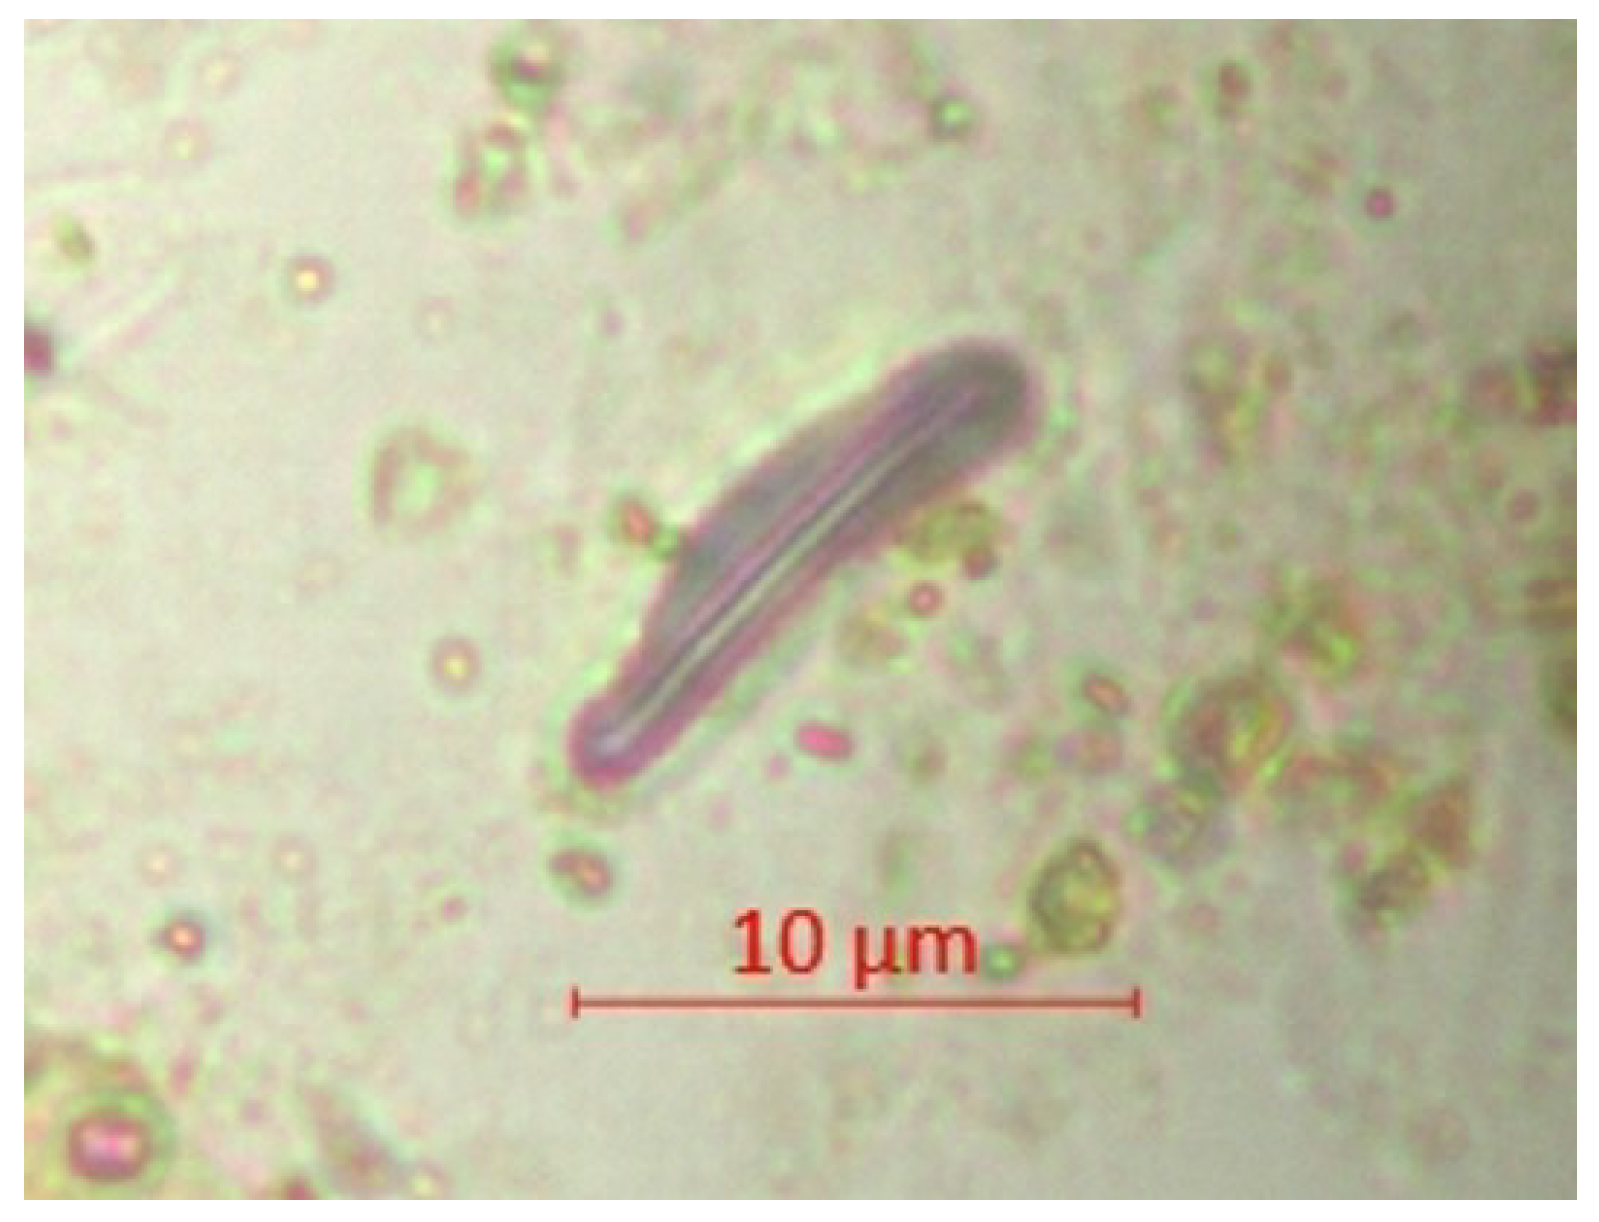
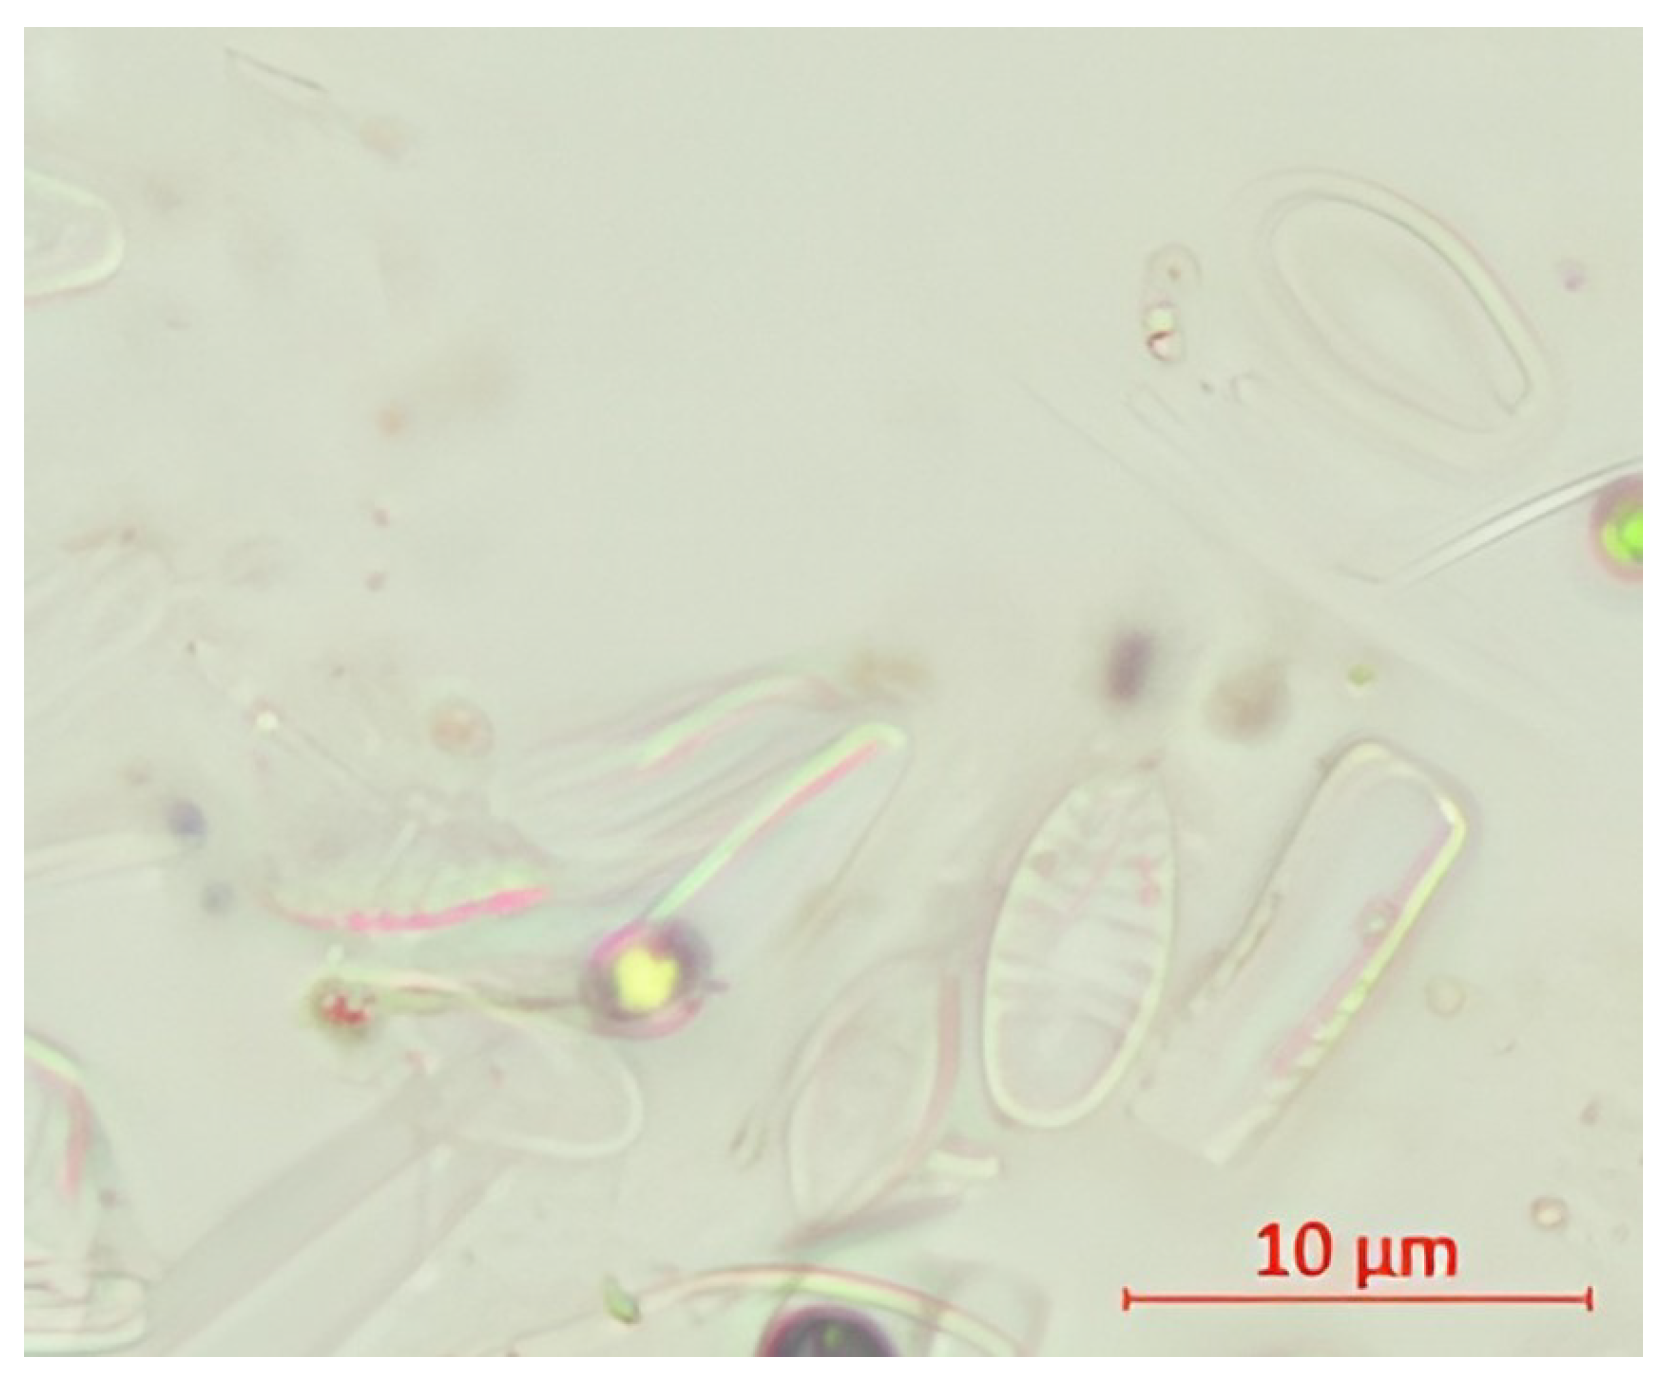
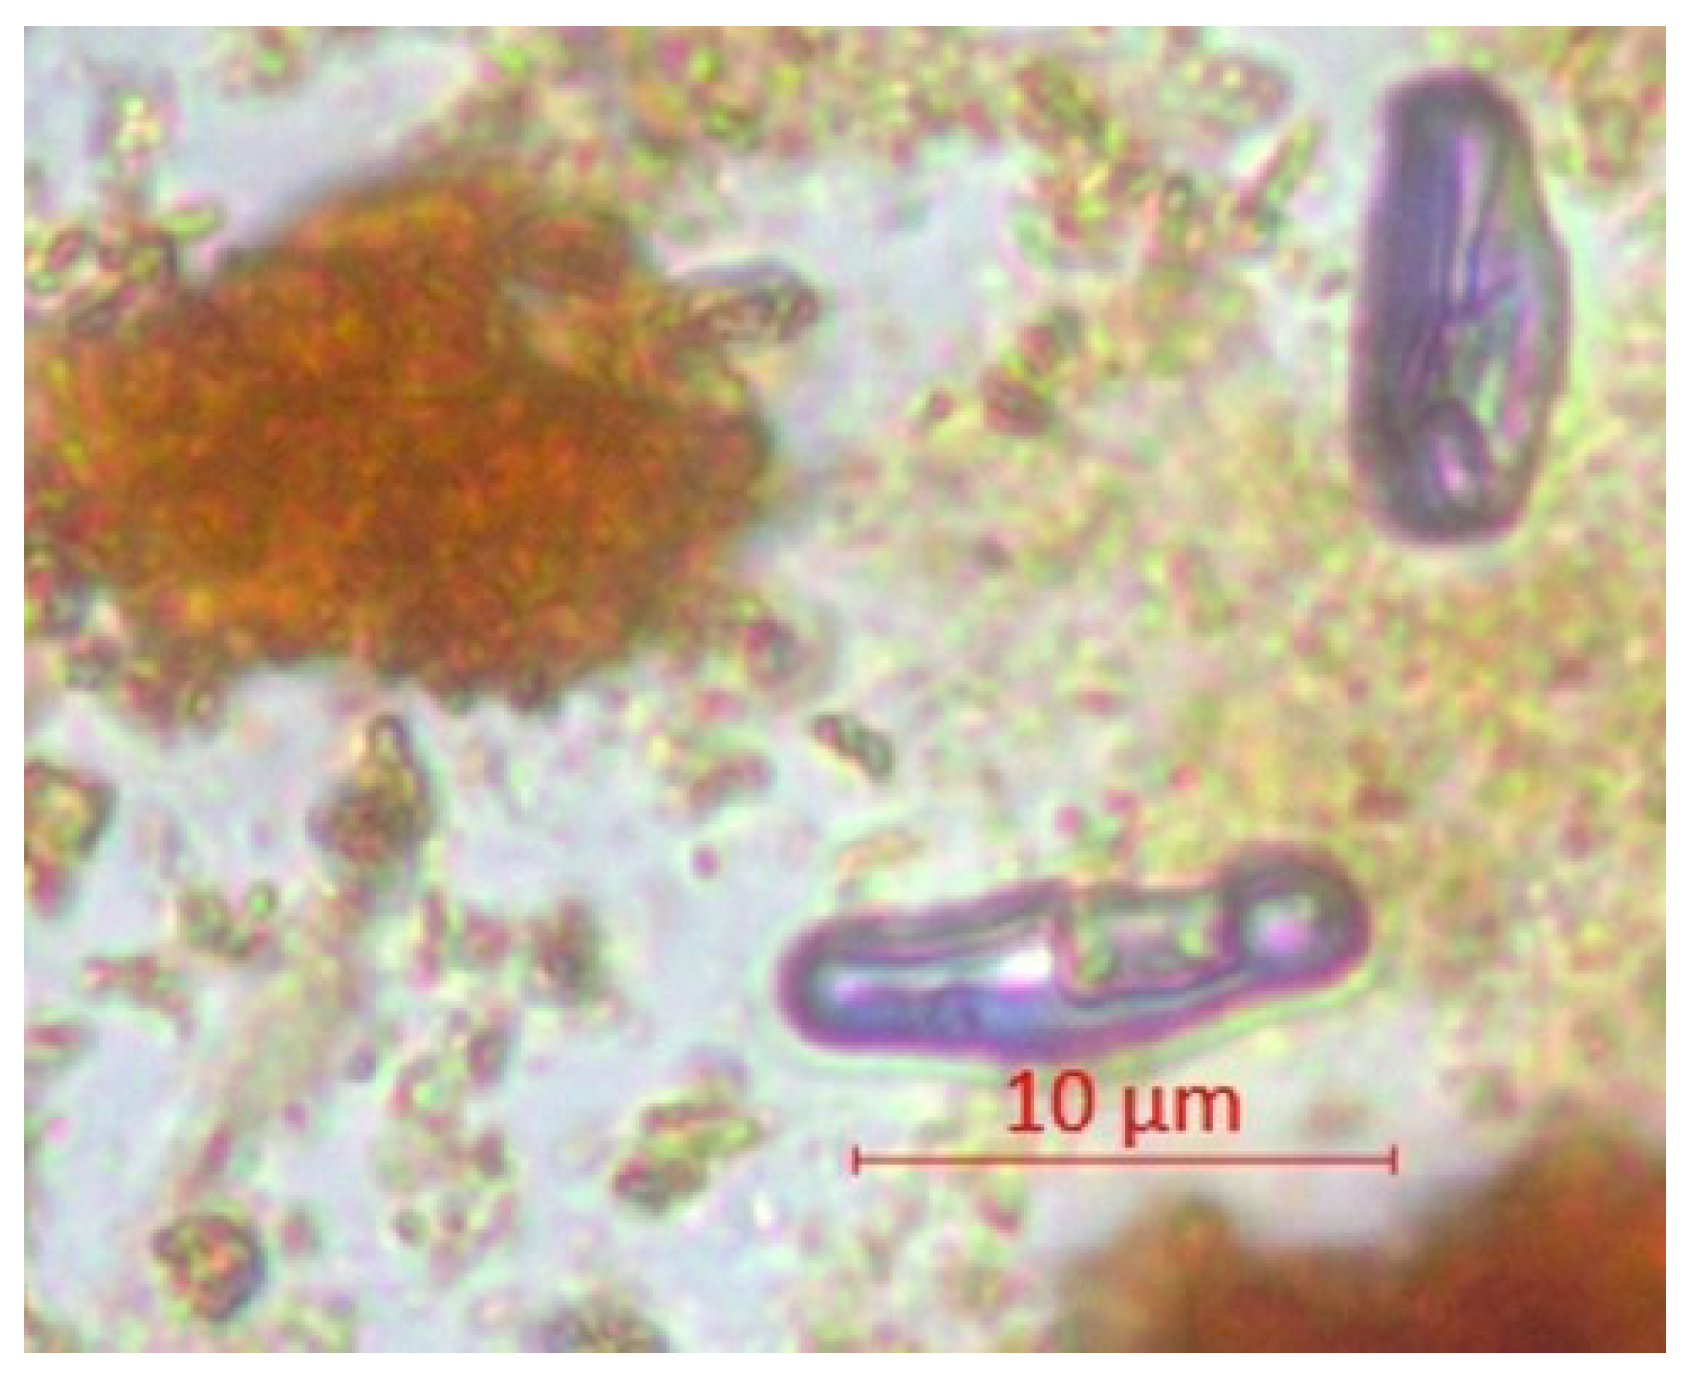
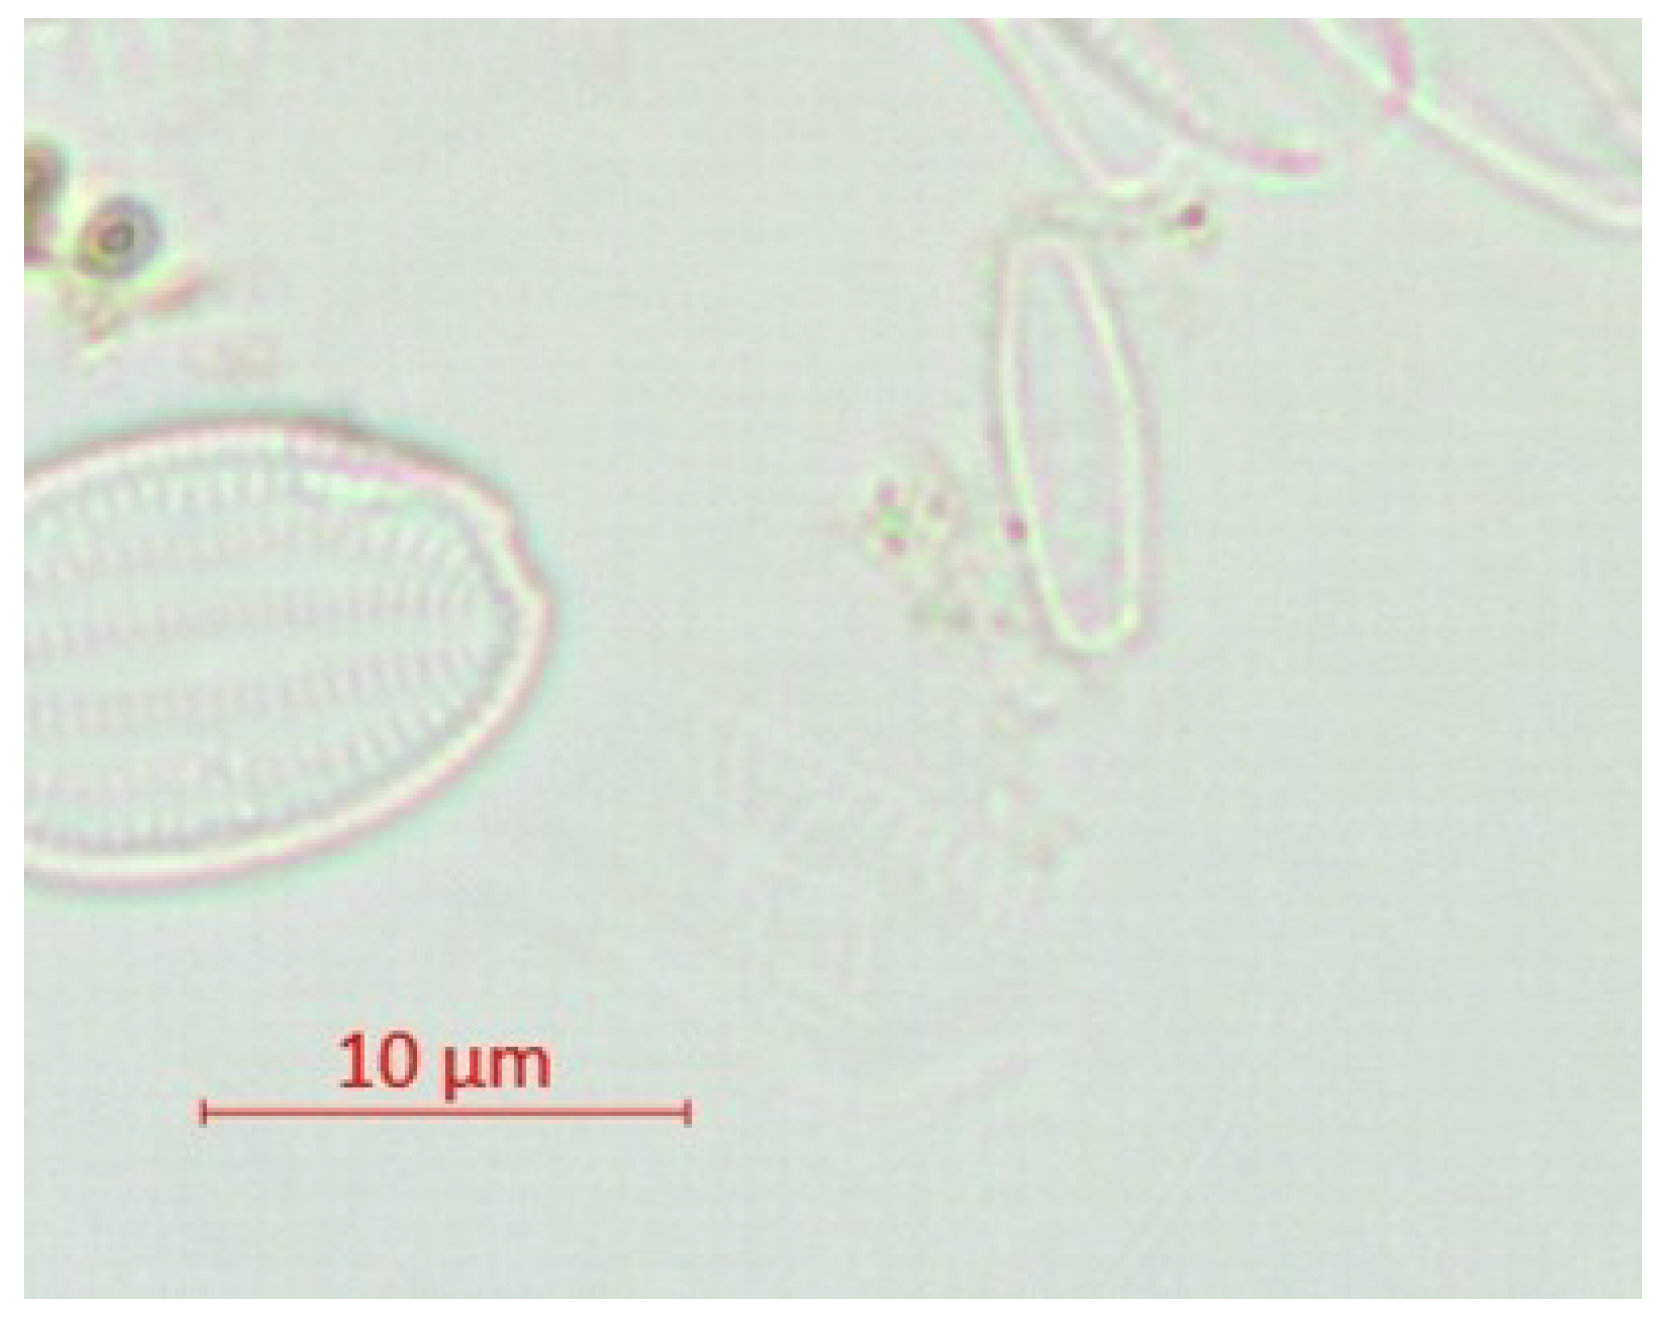
Figure 2 and Figure 3 show a comparison between normal and teratological diatom forms, representing samples collected from the tributaries of the Aries River at site A1.
Table 5, Table 6 and Table 7 present the physico-chemical parameters of the Abrud River downstream of its confluence with the Roșia Montană River.
After the confluence with the Roșia Montană River, the physico-chemical parameters of the Abrud River show a noticeable increase in pollution compared to upstream. Although pH generally remains stable, pronounced decreases were observed during the summer, reaching 4.5 in 2024, indicating significant acidification, likely due to acid mine drainage in the Roșia Montană area.
Dissolved oxygen levels remain good (8–8.8 mg/L), indicating a relatively preserved self-purification capacity. However, BOD5 and COD-Cr values reflect increased biodegradable and oxidizable organic matter. Ammonium nitrogen and nitrite concentrations are significantly elevated, frequently exceeding Class I and II limits.
Downstream of the Roșia Montană River confluence, the Abrud River shows a significant increase in water mineralization. Sulfate concentrations exceed 200 mg/L in summer, approaching Class III, suggesting infiltration from sulfate-rich mining areas. The combination of high conductivity, minerals, and sulfates points to significant anthropogenic impact, particularly from mining. These parameters highlight continuous chemical pressure on the aquatic ecosystem during the warm season.
The Abrud River exhibits a severe load of toxic trace elements, especially during the summer, indicating strong anthropogenic influences, likely from historical and ongoing mining activities.
Cadmium concentrations consistently exceeded the permissible limits, peaking above 9 µg/L in July 2023 (Class IV–V), posing a significant risk to aquatic life. Cobalt, nickel, and chromium remain elevated, with chromium reaching 61.74 µg/L in July 2024. Copper shows extreme summer values (>180 µg/L), far above the 20 µg/L limit, likely due to runoff from mining tailings. Iron and manganese reach 4.74 mg/L and 24.04 mg/L, respectively, placing the water in Classes III–V. Zinc exceeds 600 µg/L in summer, reaching over 960 µg/L in 2023, signaling significant industrial pollution with clear ecotoxic effects.
Table 8 presents the diatom species identified at the Cărpeniș station (A2), their individual counts, saprobic zones, and saprobic values, providing a basis for assessing the ecological quality and organic pollution level of the water.
The saprobic index (1.22) indicates very low organic pollution (Class I–II). Dominant species from the o-β and α zones suggest good environmental conditions with minimal organic impact. In the Abrud River (Cărpeniș), the saprobic index indicates a very good water status in terms of organic matter load. However, A. minutissimum was identified, representing 78.21% of the total counted individuals. Additionally, 21.56% of these individuals exhibited teratological forms, which occur under heavy metal contamination. This indicates the presence of an ecological niche formed by acidic waters in the area, allowing this species, adapted to lower pH, to thrive and occur in high numbers. The result of the saprobic index does not provide a realistic assessment of the water body’s condition. However, the strong dominance of A. minutissimum suggests, as supported by the high metal values shown in Table 8, that metal pollution has a significant impact, with only minor variations in concentration over time. In this case, the evaluation of the water body should be based solely on the presence of metals and pH variations, excluding the saprobic assessment.
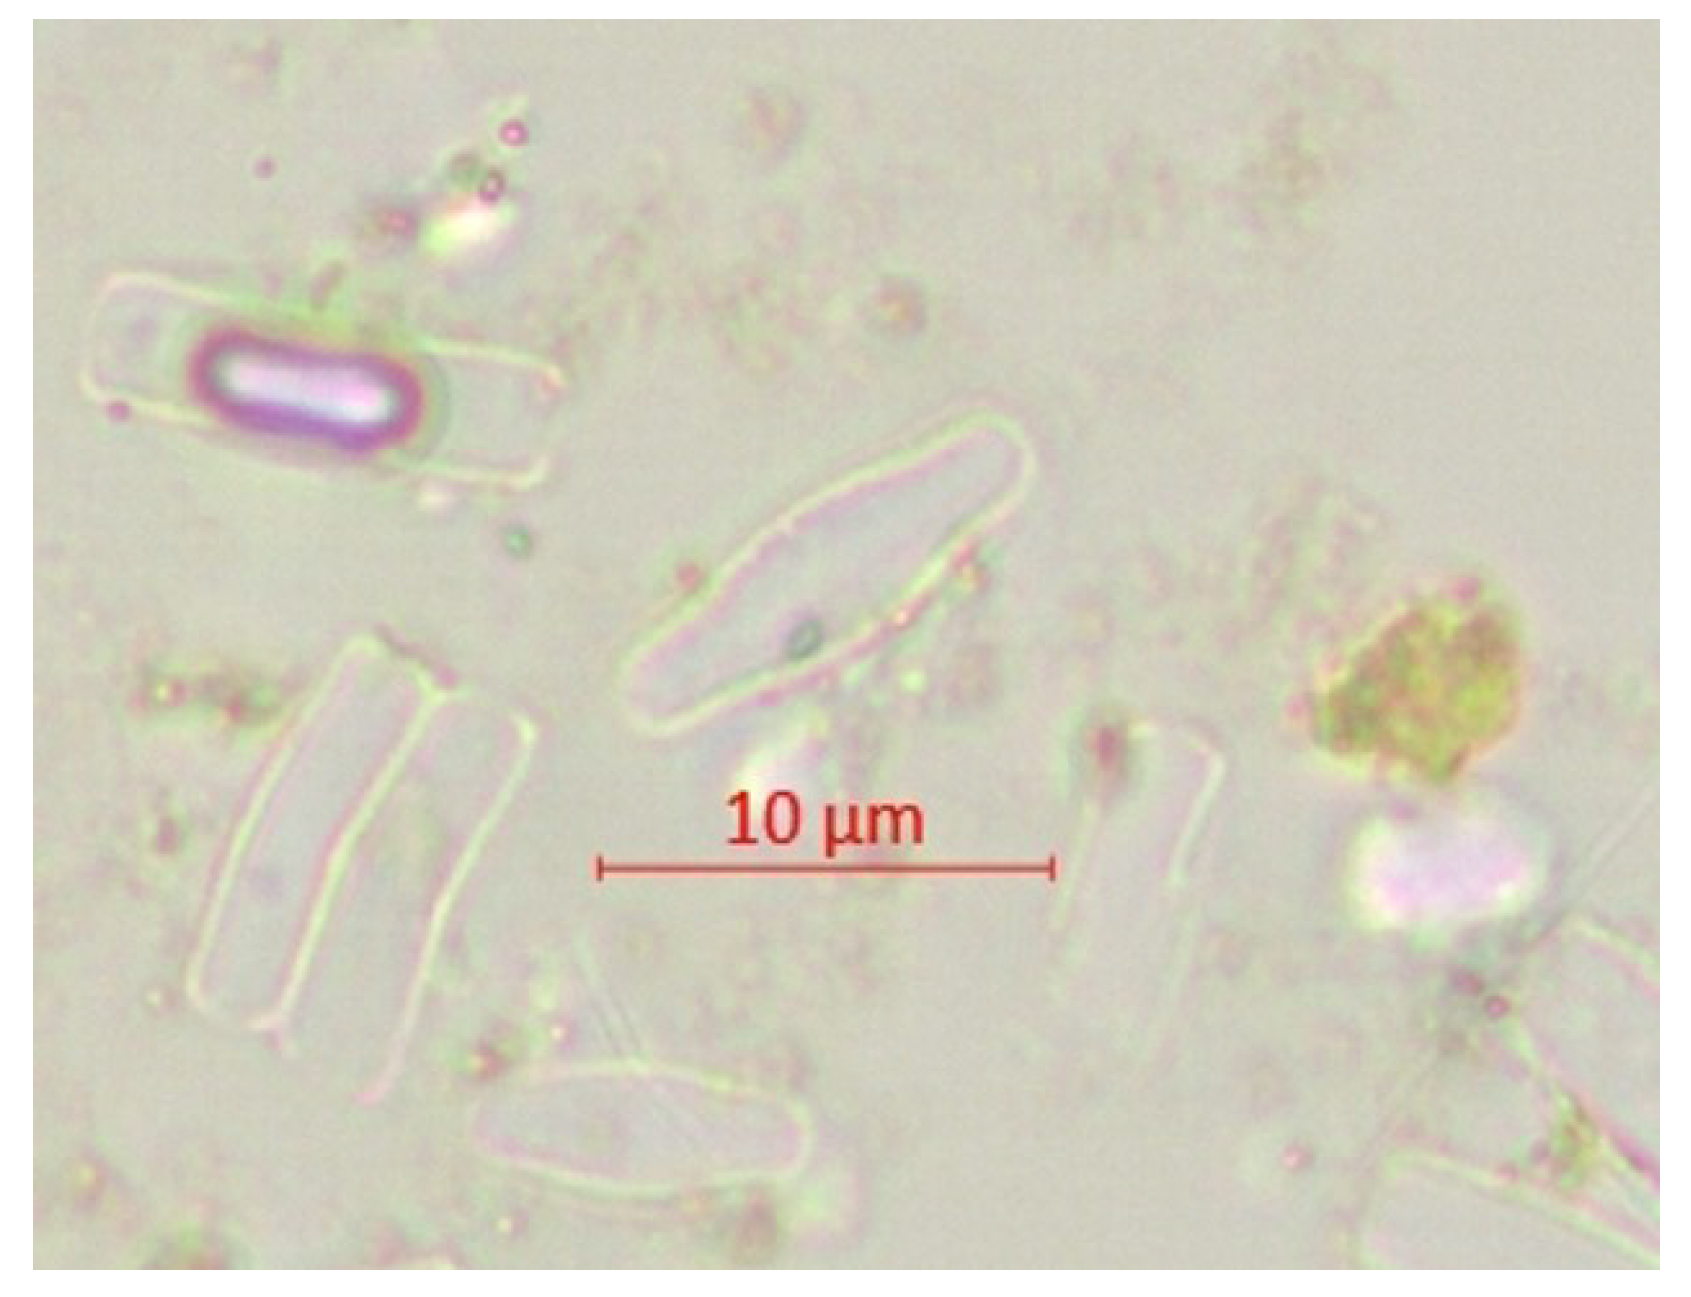
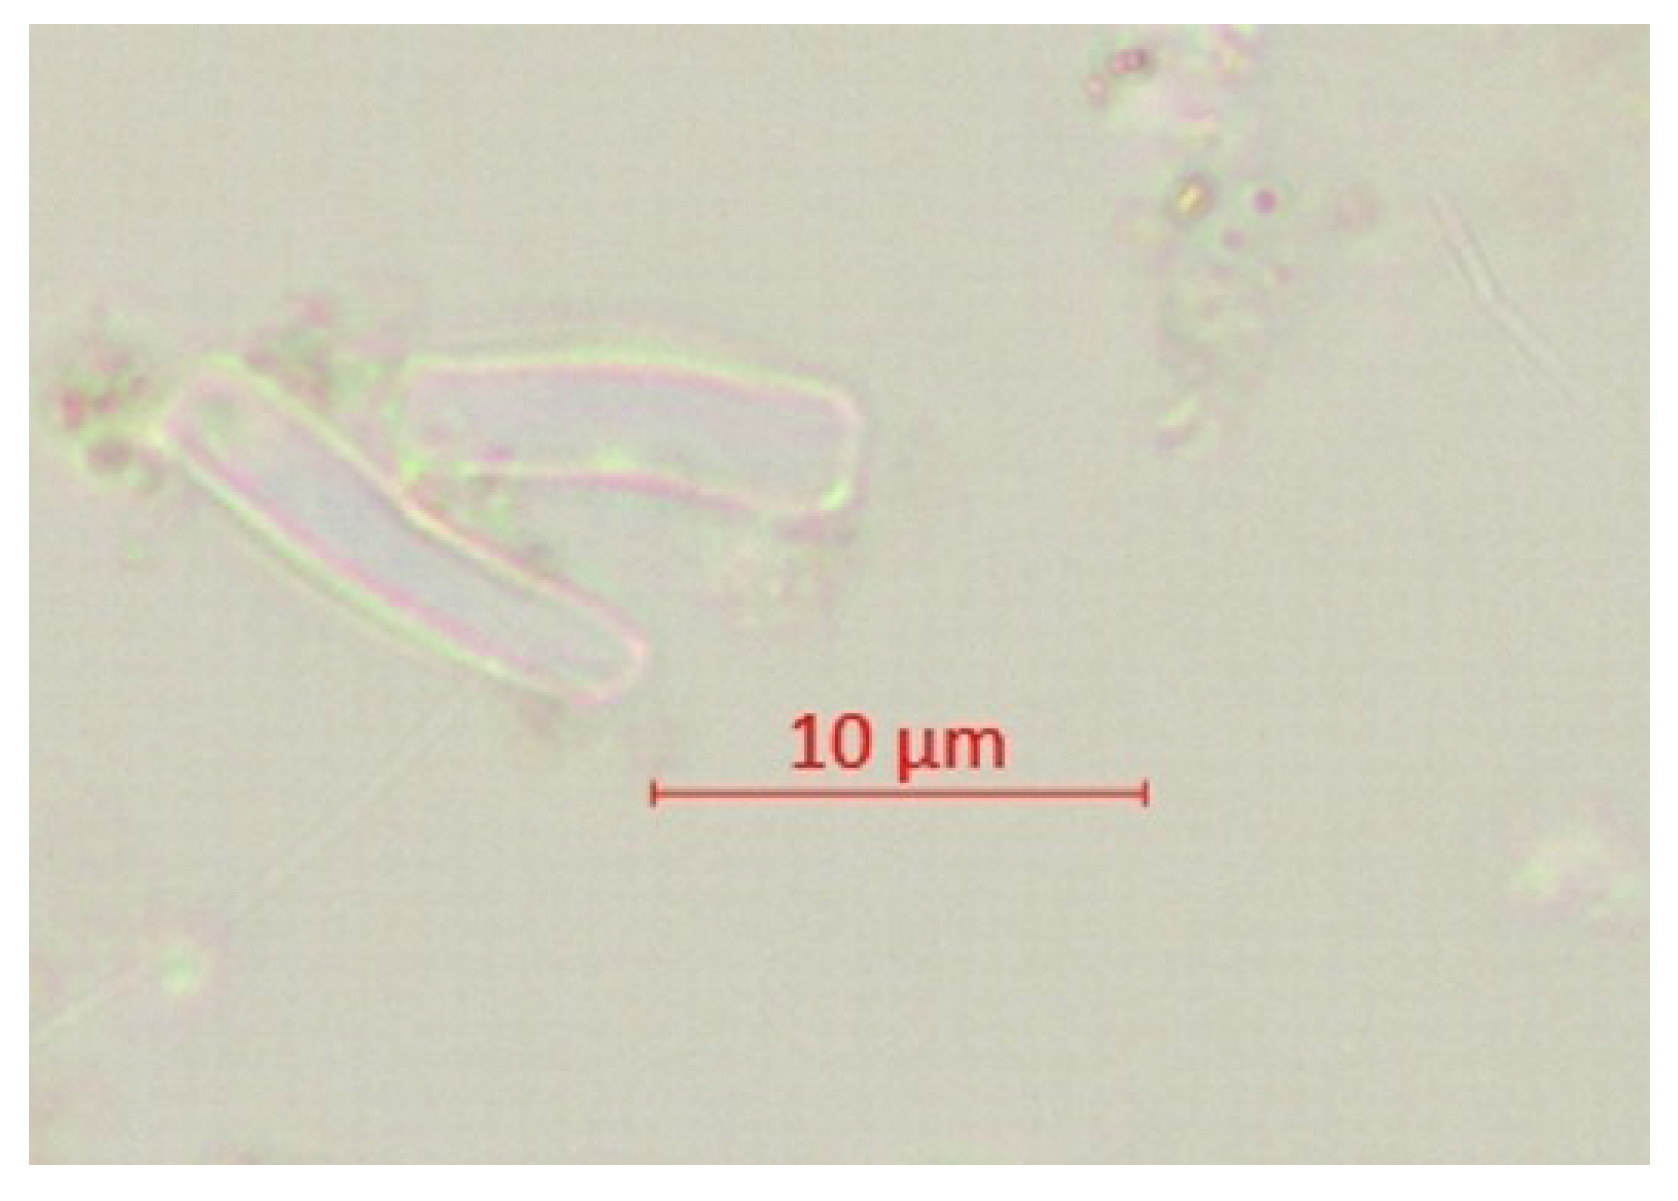
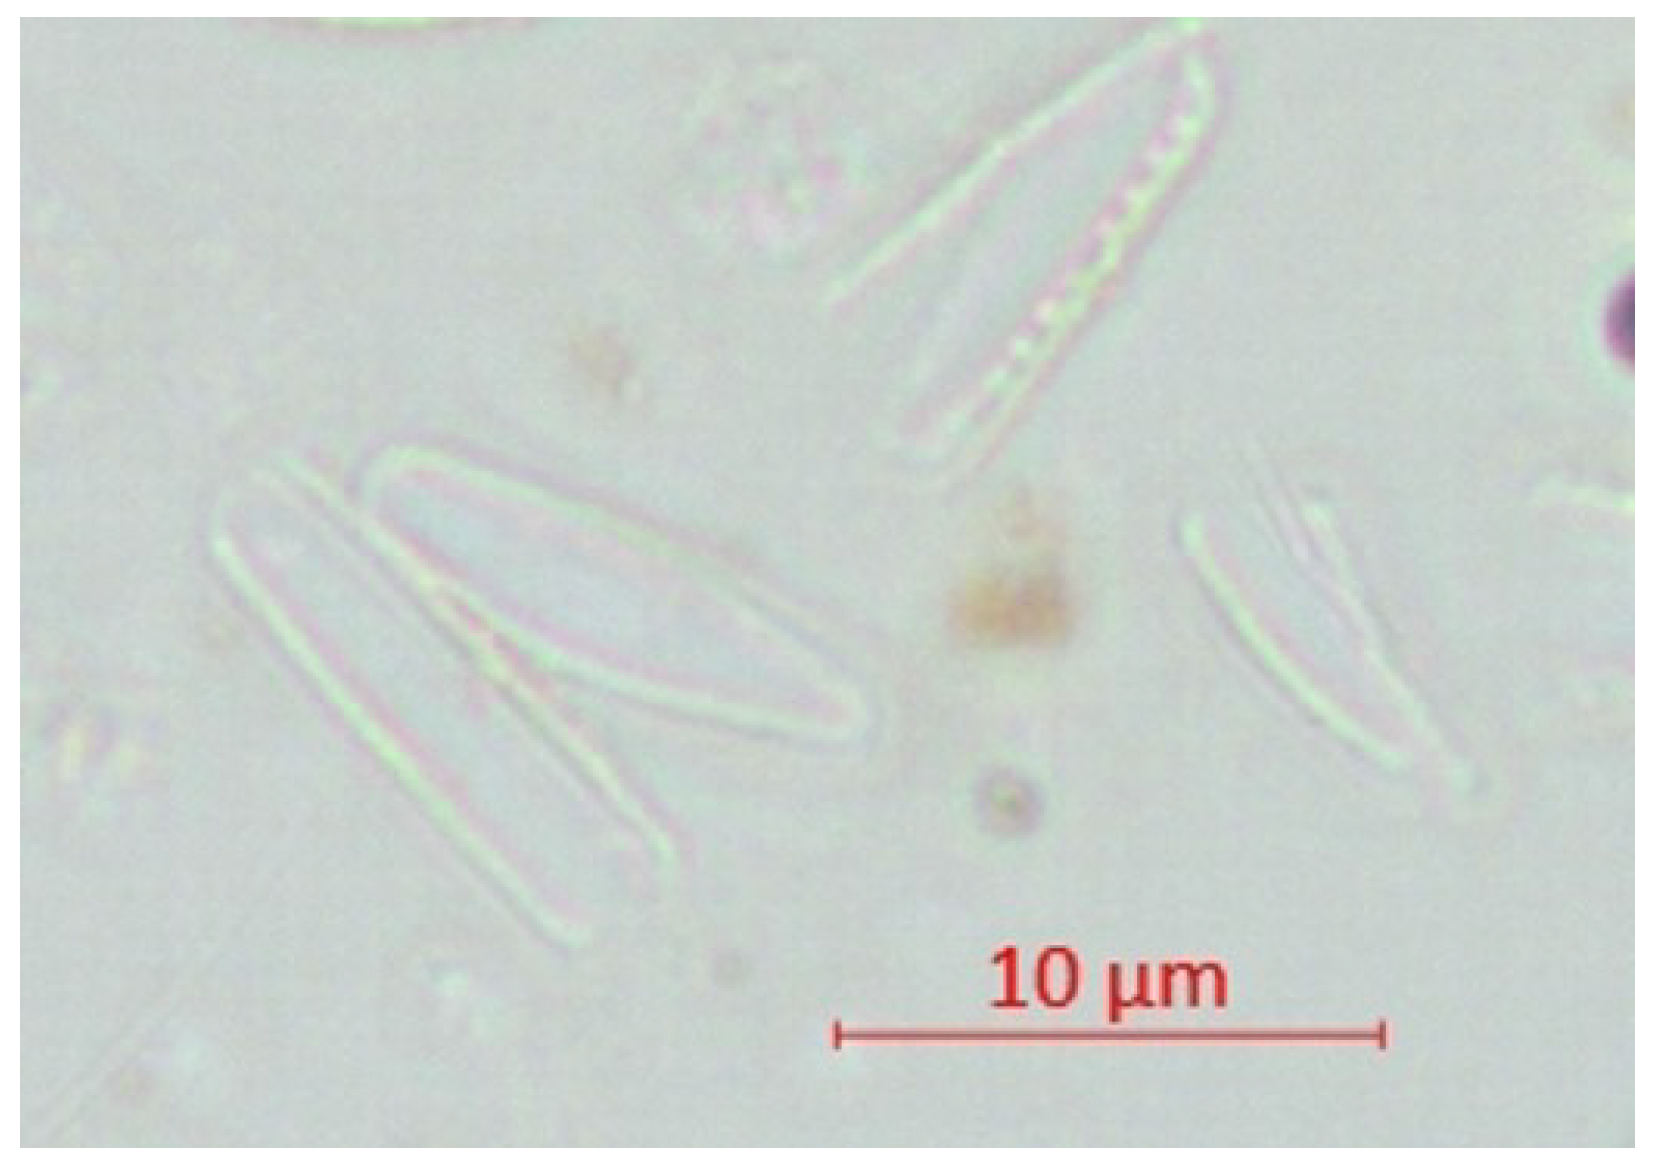
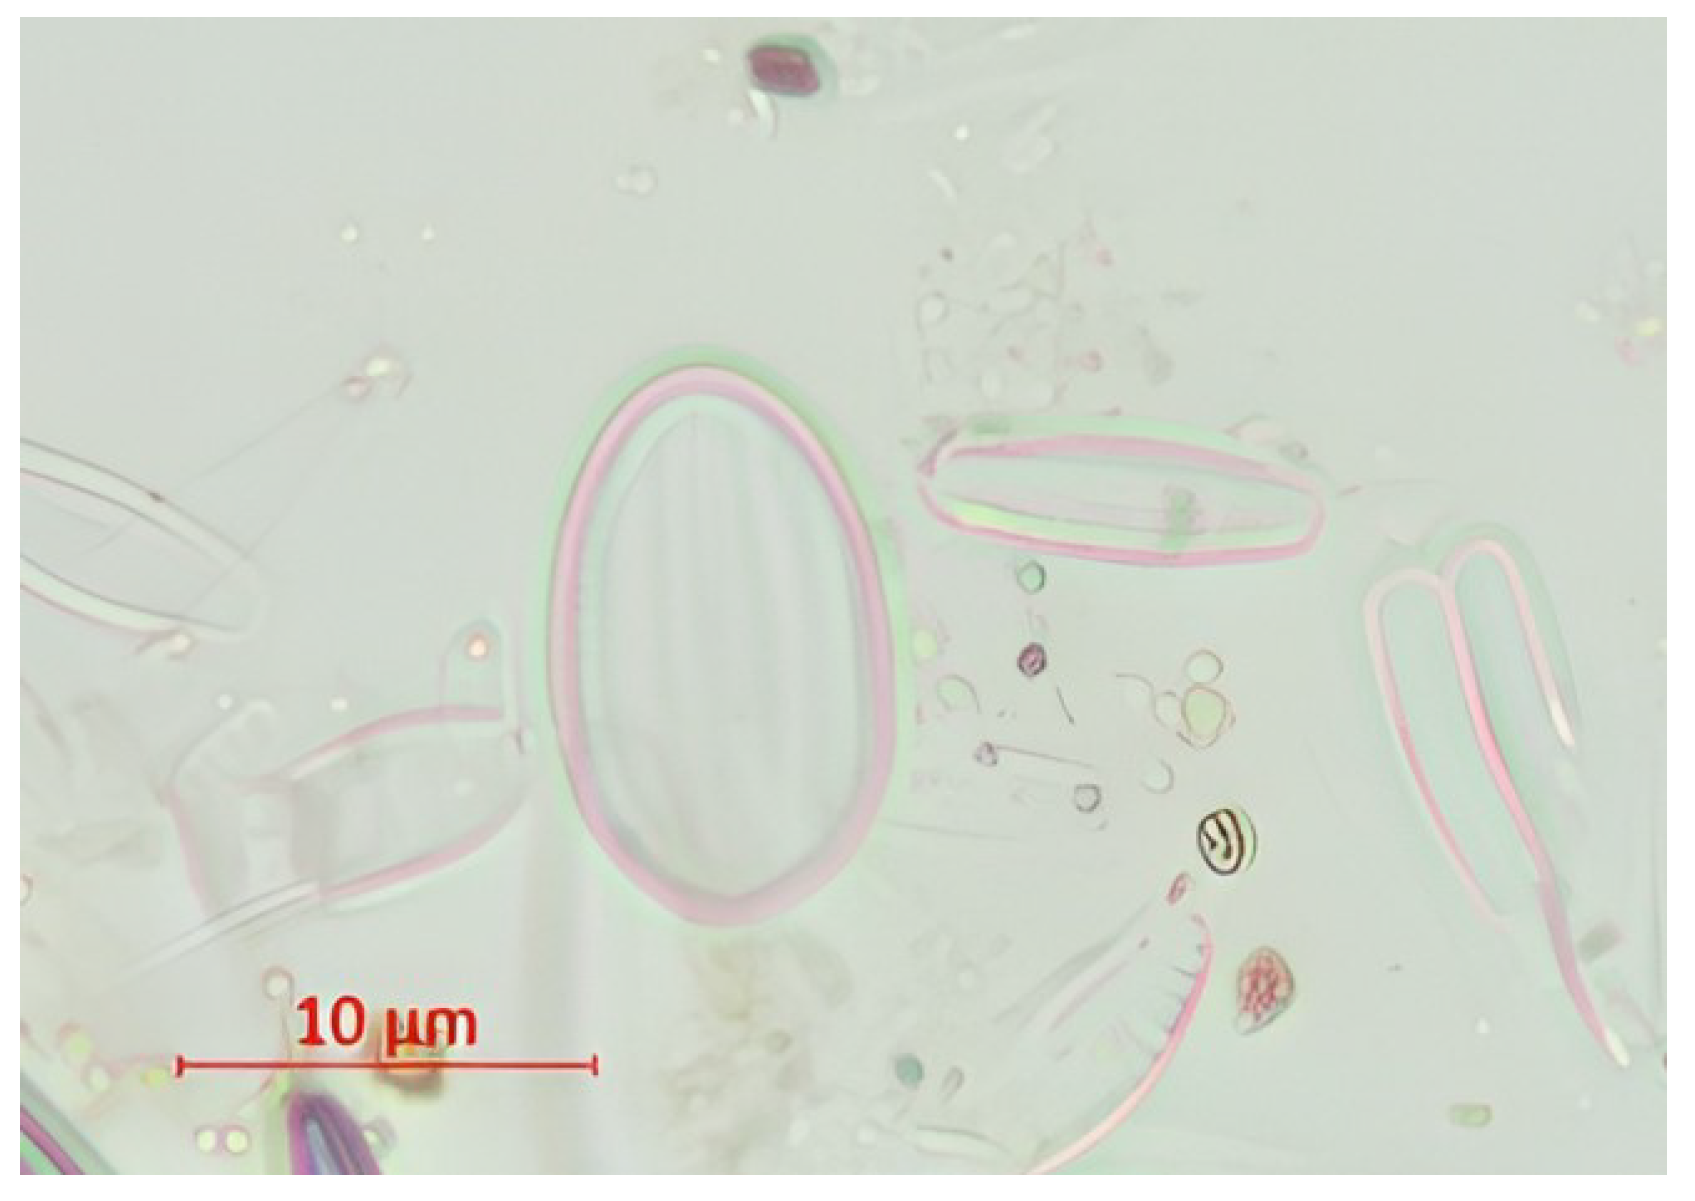
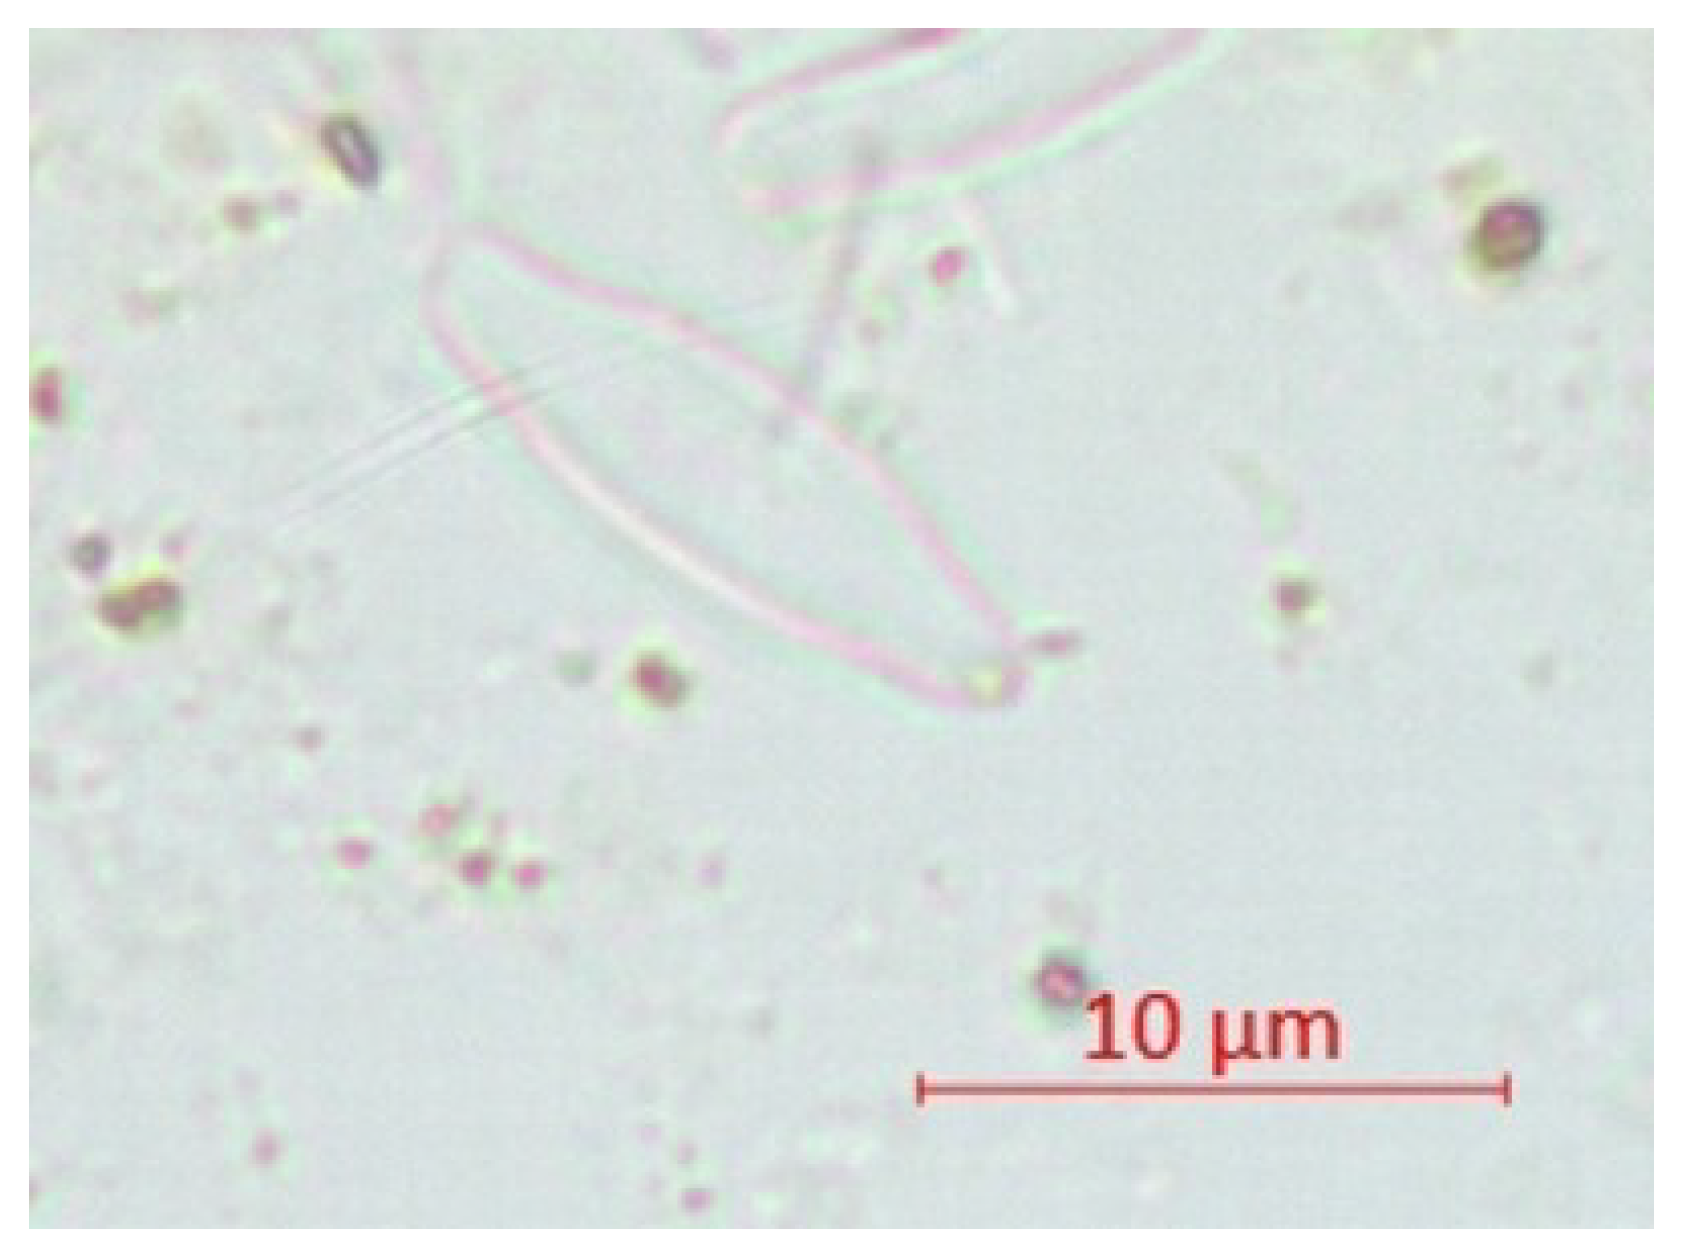
Figure 4 and Figure 5 compare normal and teratological diatom forms from tributary samples of the Aries River at site A2.
Comparison of sites A1 and A2 shows a clear impact of mine waters on the diatom community. At A1, near the source, diverse species from the β and o-β saprobic zones, including P. lanceolatum, A. minutissimum, and N. radiosa, indicate low organic pollution and stable conditions. Downstream at A2, diversity declines, with the community dominated by metal- and pollutant-tolerant species, especially A. minutissimum, and a reduction in sensitive α and β species, reflecting decreased ecological quality.
Table 9, Table 10 and Table 11 show the physico-chemical parameters of the Abrud River upstream of its confluence with the Aries River, at Câmpeni (A3).
Ammonium nitrogen exceeded 1 mg/L in autumn, while nitrite and nitrate showed variable nitrogen forms, with a nitrate peak of 1.11 mg/L in October 2022, suggesting diffuse or agricultural/urban pollution.
Salinity parameters of the Abrud River upstream of the Arieș confluence at Câmpeni exhibited clear seasonal variability. Conductivity reached 512 µS/cm in July 2024, while sulfates peaked at 201.5 mg/L in July 2023, suggesting inputs from erosion or mining. Overall, water quality was relatively good.
Peaks occurred in summer, with copper up to 157.14 μg/L, iron 2.48 mg/L, zinc 847.41 μg/L, cobalt 9.14 μg/L, and cadmium 8.12 μg/L in July 2022, reflecting increased mobilization of metals due to pollution, higher temperatures, and possible erosion. In autumn and winter, metal levels decreased significantly. Although toxic metals are below hazardous limits, high summer concentrations suggest a negative influence of natural processes and potentially anthropogenic activities, such as mine water infiltration.
Table 12 lists diatom species identified at Câmpeni (A3), their individual counts, saprobic zones, and saprobic values, supporting ecological quality assessment.
The saprobic index (1.79) indicates low organic pollution (Class I–II). The diatom community is dominated by β and o-β species, including A. minutissimum and C. ventricosa, with some sensitive α species, suggesting moderate ecological pressure.
Mining water impacts reduce diversity between A1 and A2, but at A3, upstream of the Aries confluence, diversity partially recovers due to dilution and less-polluted tributary inputs.
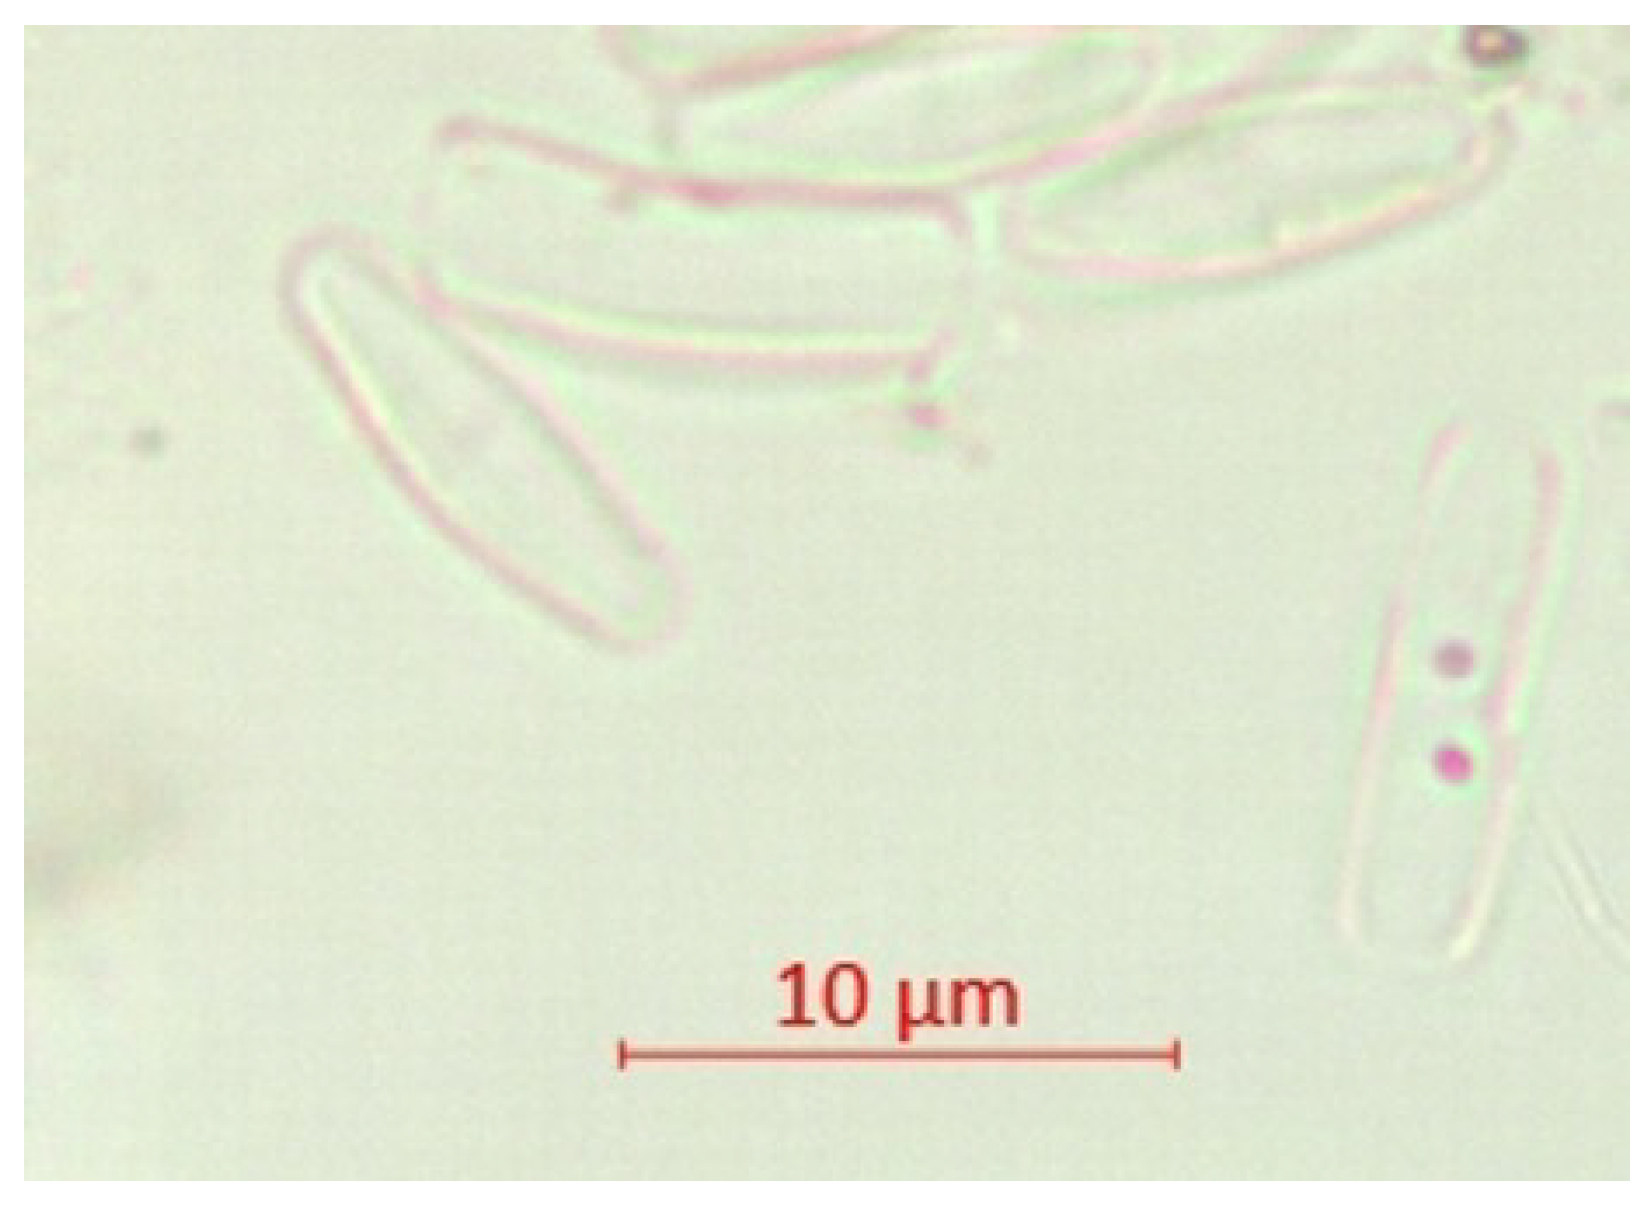
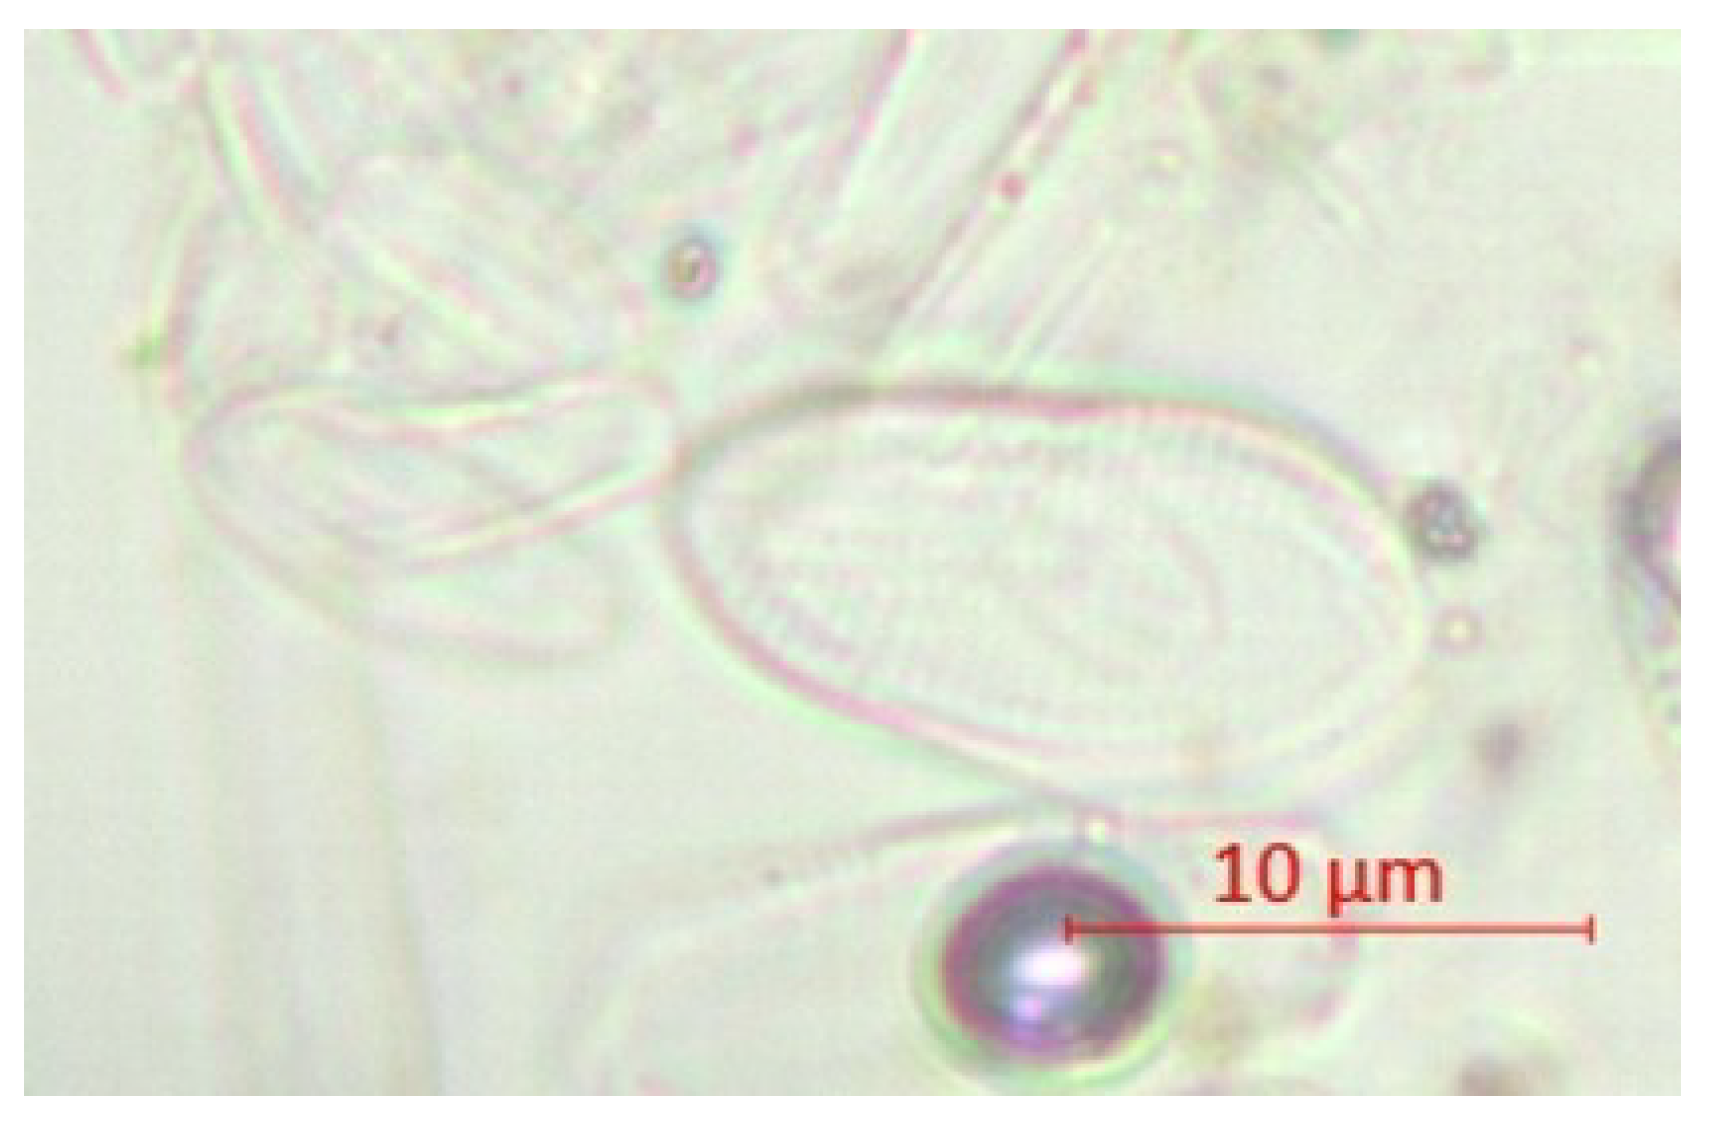
Figure 6 and Figure 7 compare normal and teratological diatom forms from tributary samples at site A3.
Table 13, Table 14 and Table 15 present the main physico-chemical parameters of the water in the Valea Ștefanca River, measured upstream of its confluence with the Arieș River.
BOD5 (0.48–1.86 mgO/L) and COD-Cr (4.39–8.69 mgO/L) values indicate moderate levels of biodegradable and organic matter, with higher concentrations in summer. Ammonium, nitrites, and nitrates remained low, showing balanced nitrification processes. Overall, the water quality falls within Class I–II, with seasonal fluctuations linked to increased organic load and suspended matter in summer, but without exceeding acceptable limits.
Electrical conductivity ranged between 189.47 and 420.18 μS/cm, with peak values in July. Filterable residue (112.39–241.36 mg/L) also peaked in July 2024, suggesting higher dissolved substances. Calcium, magnesium, and sodium showed significant increases in summer. Bicarbonates, chlorides, and sulfates indicate moderate salinity.
Copper showed significant values (56.47–164.2 μg/L), exceeding Class II–III limits, suggesting notable pollution. Iron (0.15–0.75 mg/L) and manganese (0.027–0.094 mg/L) indicated moderate levels. Water quality falls mainly into Class III–IV for trace elements, reflecting moderate to high contamination, especially from copper.
Table 16 presents the diatom species identified in the Valea Ștefanca River water, the number of individuals per species, the associated saprobic zone, and their saprobic values.
The saprobic index of 1.58 indicates low organic pollution, corresponding to ecological quality Class I–II. The diatom community is dominated by β and o-β species, such as P. lanceolatum and A. minutissimum, while also including sensitive α species (e.g., N. inconspicua), suggesting good conditions for a healthy aquatic ecosystem with low to moderate anthropogenic pressure.
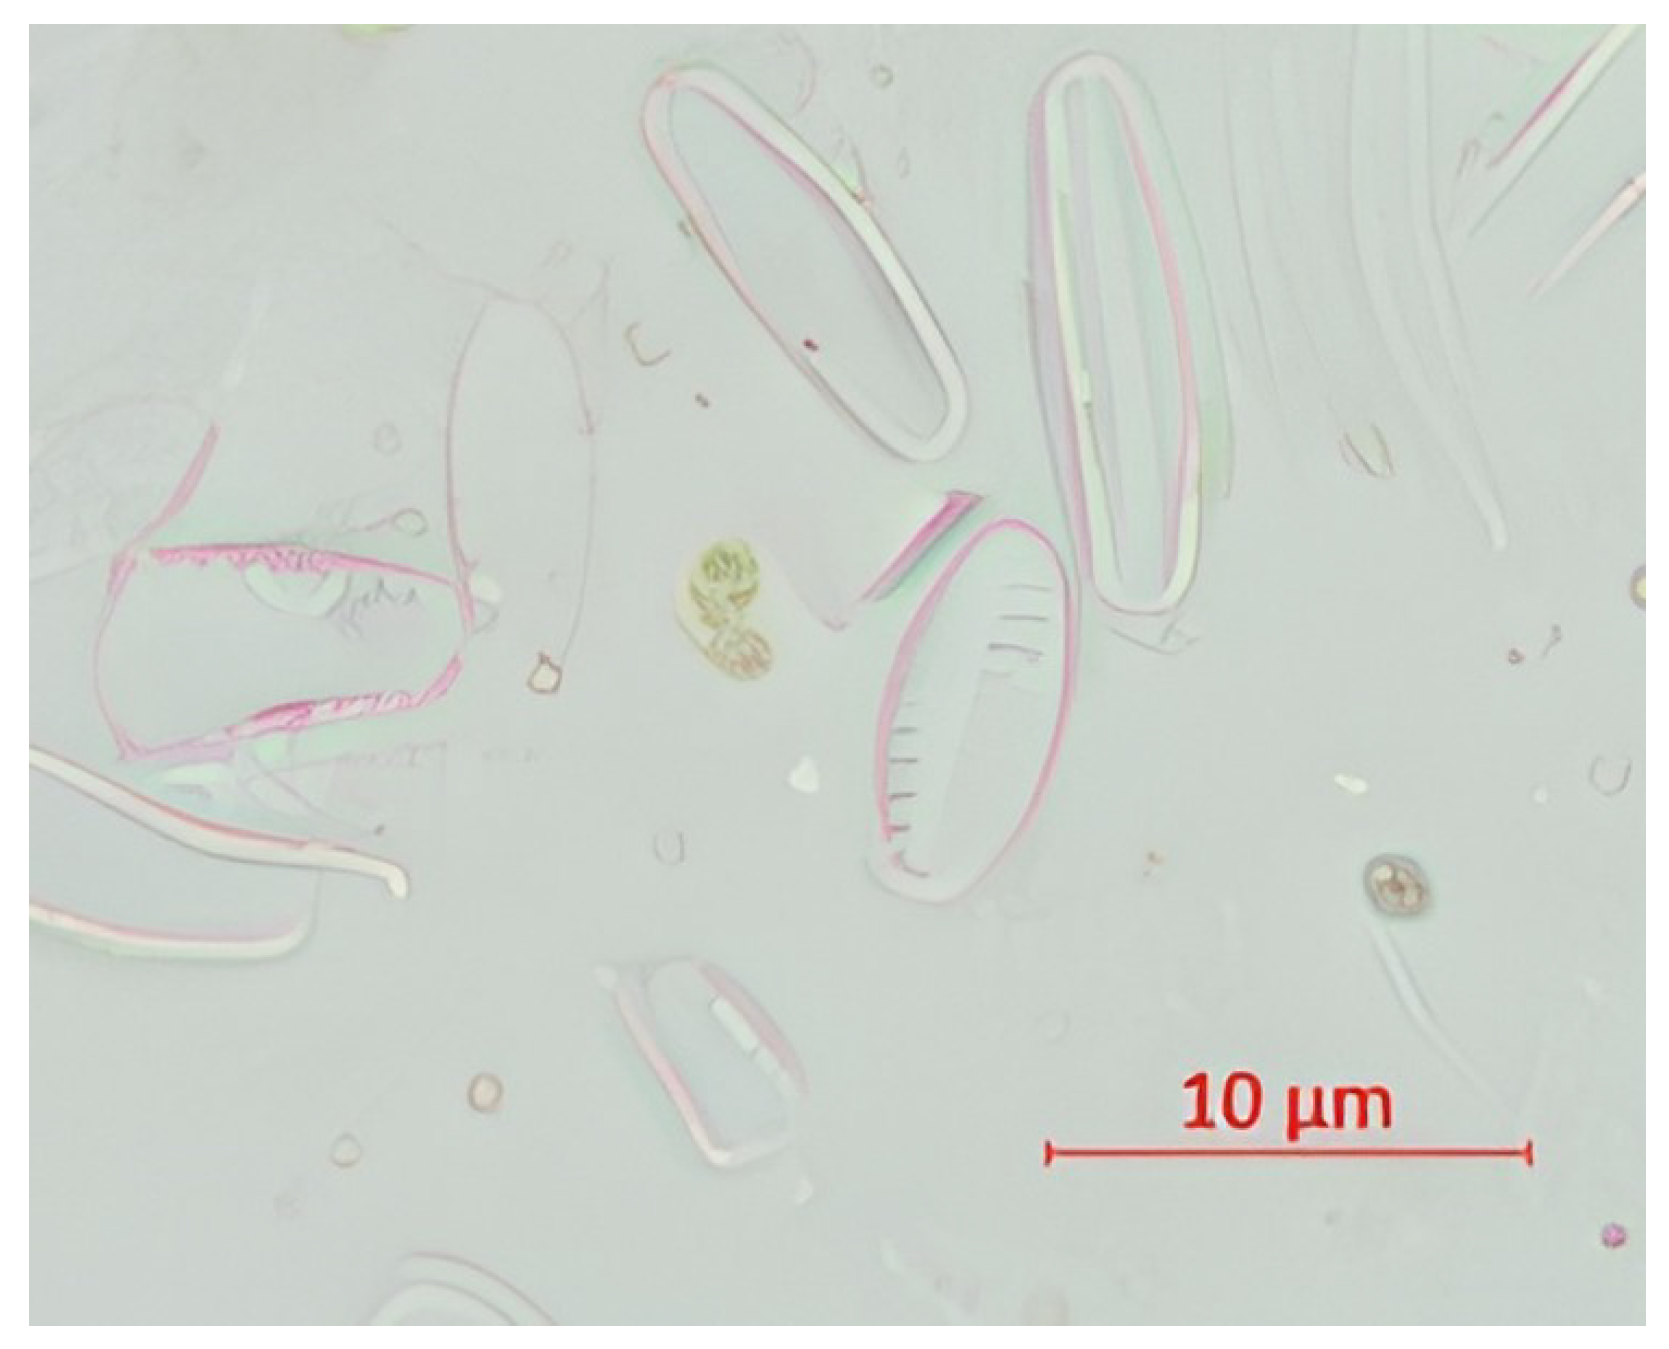
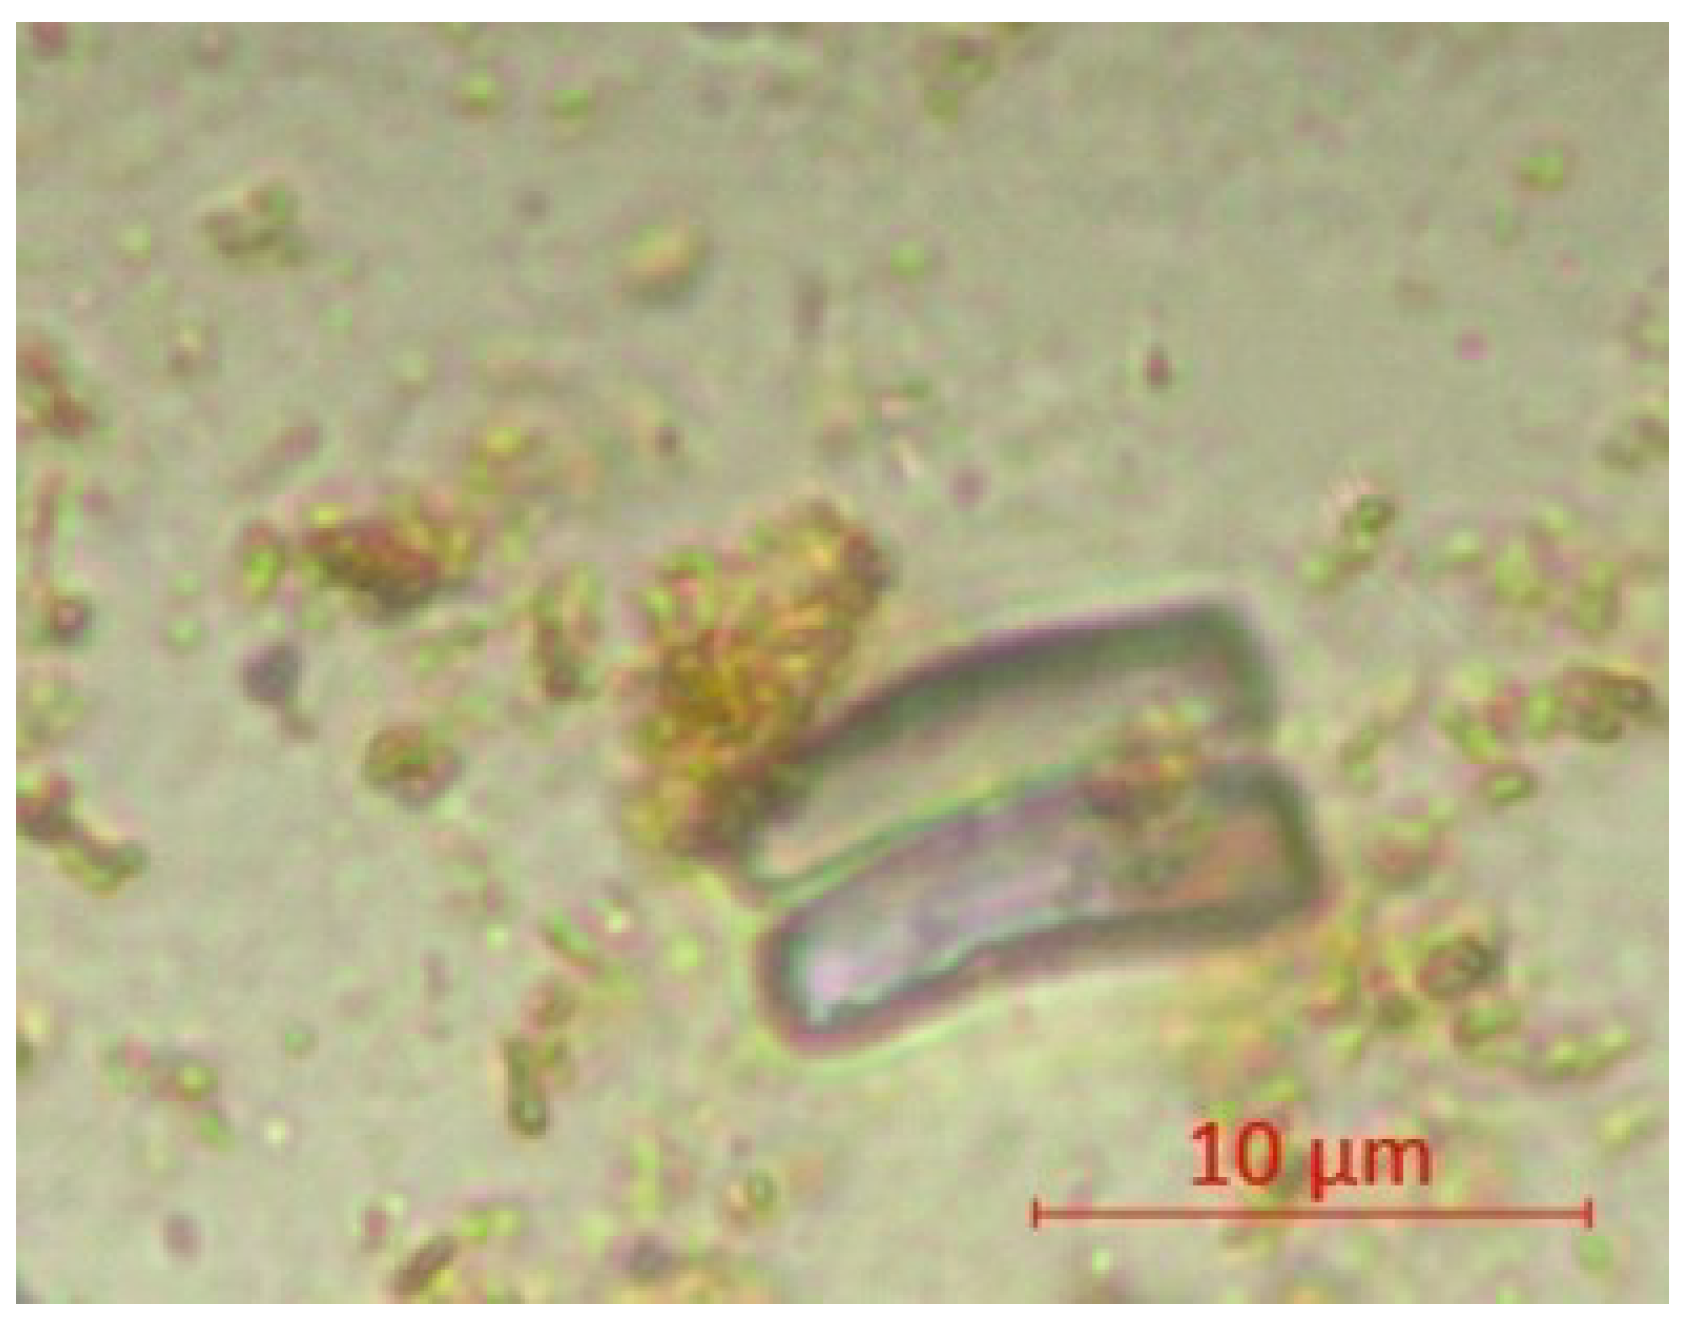
Figure 8, Figure 9, Figure 10, Figure 11, Figure 12 and Figure 13 show a comparison of normal and teratological diatom forms from samples collected in the tributaries of the Arieș River in site B.
Table 17, Table 18 and Table 19 present the physico-chemical parameters of the Valea Șesei River water (C). Valea Șesei may have a potential impact on the water quality of the Arieș River, as it is a tributary from an area affected by mining activities, which can significantly influence the physico-chemical characteristics of the water.
In general, the water pH ranged between 4.8 and 7.4, suggesting slightly acidic to neutral water, while concentrations of suspended solids fluctuated between 96 and 189 mg/L, indicating a moderate to high level of turbidity, except in January 2022 (113 mg/L). BOD5 and COD-Cr showed variable values, suggesting moderate chemical pollution. Ammonium nitrogen concentrations were relatively low, between 0.124 and 0.841 mgN/L, and nitrite and nitrate showed fairly low values, consistent with relatively limited nitrogen pollution. Compared to water quality classes, the obtained values generally indicate a water status of Class II or III, with a moderate pollution level, suggesting acceptable water quality for aquatic ecosystems.
Electrical conductivity ranged from 1237 to 2647 μS/cm, indicating significant fluctuations in salinity depending on the period, with medium to high salinity during the summer months. Calcium concentrations varied between 153.9 and 698.3 mg/L, peaking in July 2023. Sulfates had concentrations between 446 and 716 mg/L, with higher values in the summer months. Compared to water quality classes, the results suggest that, in general, the Valea Sesei River water falls into Class V, meaning water with salinity and dissolved substance concentrations higher than the limits for Class IV, indicating significant salinity, especially during the summer months.
In the water of the Valea Sesei River, upstream of the Arieș confluence, cadmium ranged between 21.41 and 51.34 μg/L, suggesting relatively high pollution during certain periods of the year, exceeding the recommended limits for water quality Classes I and II. Cobalt varied between 28.74 and 54.78 μg/L, showing consistently high pollution. Copper levels were quite high, ranging from 1567.41 to 4162.30 μg/L, indicating a high level of pollution exceeding the limits. Iron concentrations ranged from 2.89 to 7.61 mg/L, with higher values in summer, indicating moderate iron pollution. Manganese values were between 0.943 and 3.214 mg/L, showing constant manganese pollution but not exceeding Class IV limits. Nickel fluctuated between 24.09 and 49.37 μg/L, peaking in July 2023. Zinc concentrations ranged from 1587.24 to 3542.17 μg/L, indicating significant pollution, especially during the summer months.
Compared to water quality classes, the results suggest that the Valea Sesei River water falls into Class V for several of these trace elements, indicating high toxic metal pollution, particularly with copper and zinc, which exceed the limits for all water quality classes.
Table 20 presents the diatom species identified in the Valea Sesei River water, the number of individuals for each species, the associated saprobic zone, and the saprobic value.
A saprobic index of 1.21 indicates water with very low organic pollution, corresponding to ecological quality Class I. The community is dominated by species tolerant to variable conditions (e.g., A. minutissimum), with the presence of some sensitive α-species (N. palea), suggesting a healthy aquatic ecosystem with a minimal anthropogenic impact.
Figure 14 and Figure 15 present a comparison of normal and teratological forms of diatoms, based on samples collected from the Valea Șesei River in site C.
Table 21, Table 22 and Table 23 present the physico-chemical parameters of the Valea Sărtaș River water (D). The reason for choosing this surface water is that Valea Sărtaș is an important tributary of the Arieș River, and its water quality directly influences the ecological status of the Arieș in the Mihai Viteazu area. Monitoring this watercourse helps identify local sources of pollution and assess the impact of human and natural activities on water quality before the confluence with the main river.
The Valea Sărtaș River presents water with acceptable physico-chemical parameters; however, there is a potential risk of increased concentrations of organic matter and nutrients, especially during summer, which could affect water quality in the long term.
The salinity parameters of the Valea Sărtaș River indicate moderate salinity with seasonal fluctuations, particularly in summer.
In general, the levels of toxic trace elements in the water of the Valea Șartăș River are below the critical limits for Class I water quality. However, there are significant seasonal fluctuations, especially in the summer months.
Table 24 presents the diatom species identified in the water of the Șartăș River, the number of individuals for each species, the associated saprobic zone, and the saprobic value.
Figure 16 and Figure 17 illustrate the comparison between normal and teratological forms of diatoms, based on samples collected from the Șartăș River (D).

4. Discussion

4.1. Diatom Responses and Teratologies as Indicators of Trace Element Pollution in Mining-Affected Rivers

Following a study on the water quality of the tributaries of the Aries River in Romania, near the Roșia Montană mining area, relevant data were obtained, comparable to those of Halmagyi et al. [38], regarding trace element concentrations and diatom communities’ diversity in the area. The maximum observed values for trace elements were 2.35 mg/L for Fe, 1.04 mg/L for Pb, and 0.85 mg/L for Cu in the Corna River in May [17]. These concentrations significantly exceed the permissible limits for drinking water, indicating a substantial impact of mining activities on water quality [39].
Regarding diatom communities’ diversity, specific teratological forms were identified, such as deformities of the valvocopula in diatoms of the genus Achnanthidium, a feature associated with metal pollution [40]. In their studies [41,42,43,44,45,46], the dominant diatom taxa Achnanthidium minutissimum complex, Brachysira vitrea, Nitzschia microcephala, Nitzschia palea, Encyonema silesiacum, and Navicula veneta were associated with elevated metal concentrations and are frequently reported from metal-contaminated sites. Firstly, the presence of these teratological forms suggests a heightened sensitivity of diatom communities’ diversity to heavy metal contamination, making them a useful indicator for assessing the ecological status of the water. Furthermore, Tolotti et al. [47] found that in watercourses affected by acid mine drainage (AMD), benthic communities often shift from diverse assemblages to dominance by tolerant or opportunistic species (e.g., A. minutissimum, Fragilaria rumpens), accompanied by an increase in the proportion of teratological forms and a decrease in diversity. Moreover, their study on the Gromolo Torrent (Italy), impacted by an abandoned copper mine, clearly documents this pattern and its association with Cu and Zn mobilized from AMD.
At the population and cellular level, controlled experiments show that Zn and Cu, at concentrations found in contaminated European rivers, induce both biochemical/oxidative responses and valve teratologies, validating their use as biomarkers of metal pollution [48,49].
At the bioassessment level, the proportion of teratological forms can be integrated into water quality indices, but accuracy increases when deformities are weighted by type and severity and analyzed together with taxonomic composition and chemical measurements [50]. Certain taxa exhibit pronounced plasticity in response to metals; for example, deformities in A. minutissimum have been explicitly proposed as indicators of metal/metalloid enrichment in diverse and widely distributed habitats [51].
The Romanian context confirms the relevance of these signals: the Arieș River basin, historically affected by mining activities, shows impacts on algae (including diatoms) and aquatic plants, with implications for ecological monitoring of the affected river sections and their tributaries [38,47]. Compared to other studies conducted in the region, such as that of Butiuc-Keul et al. [12], which highlighted high trace element concentrations in the Arieș River, our results confirm the trends of persistent pollution in areas affected by mining activities. Additionally, our study aligns with previous research [13] on the use of diatoms as bioindicators of water quality, emphasizing the importance of monitoring them to assess the impact of metal pollution on aquatic ecosystems.
Recent studies emphasize the effectiveness of diatoms as bioindicators for assessing the ecological condition of water bodies affected by mining and other anthropogenic pressures. In the Abrud River catchment (Roșia Montană mining area, Romania), diatom community analyses revealed clear spatial and temporal variations related to acid mine drainage (AMD) and heavy metal contamination, with 274 taxa identified, including 35 species recorded for the first time in Romania [13]. Similarly, investigations in the Bega and Timiș rivers demonstrated that diatom-based indices, such as the Biological Diatom Index (BDI) and the Saprobity Index (SI), provide valuable information on both organic and inorganic pollution, complementing physico-chemical analyses [52]. Comparative research from the Zarafshan River in Uzbekistan further supports the robustness of diatom communities as indicators of water quality dynamics across diverse hydrological and pollution contexts, identifying 428 species and linking their distribution with salinity, metal contamination, and organic load [14]. Collectively, these studies confirm that diatoms respond sensitively to multiple stressors and serve as reliable tools for integrated water quality assessment and ecosystem management, especially in regions impacted by historical or ongoing mining activities.
In our datasets from the Abrud–Sartăș–Șefanca–Valea Șesei basin, we recorded the occurrence of teratological forms in several dominant taxa (especially from the A. minutissimum complex, but also Planothidium and Cocconeis), with visible frequencies downstream of mining sources. These observations are congruent with the literature showing that toxic stressors (especially metals) induce deformations of the valve, striation, and even cingulum elements, and the proportion of teratologies tends to increase with the intensity of exposure [53]. Various studies distinguish between valve contour, striation/areolar, and raphe teratologies, but also emphasize the limitations of using the “total percentage of teratologies” without differentiating between types and severity [54]. In particular, Lavoie et al. [50] propose weighting deformities by type and intensity, to reduce subjectivity and increase bioindicative value.
In the Abrud River and its tributaries, the geological and mining context explains both the dominance of the A. minutissimum complex downstream and the increased frequency of abnormal forms. Previous studies [17] in the same area (Roșia Montană/Abrud) have clearly shown that acid mine drainage (AMD) and associated metals induce morphometrically detectable deformations in diatom populations [55]. Relevant to our data, a subsequent study from the same region described a novel teratology in Achnanthidium affecting the cingulum (markedly undulated valvocopula), with prevalences of tens of percent under metal pollution conditions—a mechanism that may also explain our observations of the “teratological” forms of A. minutissimum and Planothidium [40].
To transition from qualitative observations to robust assessments of deformation severity, several research groups have employed geometric morphometrics (using landmarks on outlines, Procrustes alignment, and statistical analyses), revealing measurable differences between normal and deformed individuals, as well as correlations with metal gradients (e.g., Zn). This approach is particularly recommended when teratological forms are subtle or vary within the same species [56]. In systems with multiple stressors (metals, high conductivity, low pH), the frequency of teratologies increases even further, and communities become simplified, dominated by tolerant taxa (such as A. minutissimum s.l. and Nitzschia spp.), a phenomenon also observed at our sites most affected by mining waters [50,57,58].
Recent studies emphasize the importance of setting ecologically relevant thresholds for nutrients and physico-chemical parameters in assessing the ecological status of surface waters. Under the European Water Framework Directive (WFD), the integration of biological indicators, such as benthic algae, with chemical and hydromorphological elements has been shown to provide a more comprehensive picture of ecosystem health [59]. However, defining “Good Ecological Status” remains challenging due to variations in national criteria and the need for harmonized nutrient boundaries [60]. To address this, recent works have proposed refined physico-chemical criteria to better support WFD objectives across Europe [61], highlighting that current thresholds for salinity and other stressors may not sufficiently protect freshwater ecosystems [62]. Moreover, nutrient concentration limits consistent with good ecological condition often need to be more stringent, especially in sensitive or impacted catchments [63]. These findings reinforce the need for a critical evaluation of national classification systems and the adoption of more ecologically meaningful reference conditions for water quality assessment.
Overall, our results show elevated frequencies of teratological forms in mining-impacted sections, accompanied by the dominance of A. minutissimum and reduced diversity, aligning with the current consensus: teratologies are a sensitive biomarker of toxic stress, but their interpretation must be nuanced, taking into account the type and severity of the deformity, taxon identity, and the physico-chemical context. Recent reviews reinforce this perspective and recommend integrating teratologies into multi-indicator panels (community, chemistry, non-taxonomic metrics) rather than using them as a standalone metric [50,64].
The integration of chemical and biological data obtained from our study provides a comprehensive assessment of water quality in the tributaries of the Arieș River, highlighting areas with significant anthropogenic impact and emphasizing the need to implement sustainable water resource management measures in regions affected by mining activities.

4.2. Statistical Evaluation of Results

4.2.1. Pearson Correlation Between Trace Elements and Diatom Species Distribution [65]

Supplementary Table S2 presents the Pearson correlation coefficients between the concentrations of selected trace elements and the distribution of diatom species across the studied sites. The analysis aims to explore potential relationships between metal contamination and diatom community composition, providing insights into how different metal pollutants may influence the abundance and diversity of specific diatom taxa [66]. Positive or negative correlations indicate whether a particular species tends to increase or decrease in response to elevated levels of a given metal, thereby reflecting the ecological preferences and tolerances of diatoms in metal-impacted aquatic environments.
The Pearson correlation coefficients presented in Supplementary Table S2 reveal the relationships between trace element concentrations and the distribution of diatom species across the studied sites [67]. Several patterns emerge from the analysis. For instance, species such as G. olivacea, P. lanceolatum, N. dissipata, and C. pediculus show strong negative correlations with multiple metals, particularly Fe, Ni, and Co, indicating that these species are sensitive to higher levels of metal contamination and tend to decrease in abundance in more polluted environments. Conversely, species such as A. minutissimum and F. capucina exhibit positive correlations with certain metals, including Cr, Cu, and Mn, suggesting a tolerance or potential preference for moderately metal-enriched conditions.
Some species, including C. ventricosa and N. palea, display mixed correlations, with negative relationships with As and Cd but positive or weak correlations with other metals, highlighting species-specific responses to different contaminants. Overall, the data indicate that metal pollution acts as a selective pressure shaping diatom community composition, with sensitive species declining and tolerant species persisting or proliferating in contaminated waters. These correlations provide valuable ecological insights, helping to identify bioindicator species for monitoring heavy metal contamination in freshwater ecosystems.

4.2.2. Multivariate Analysis of Water Quality: PCA Insights into Metal and Physico-Chemical Gradients [68]

Principal Component Analysis (PCA) is a multivariate statistical tool widely used to assess environmental pollution, allowing the identification of major gradients and sources of heavy metals in water and other ecosystems [69].
Gergen and Harmanescu [70] demonstrated the utility of PCA in evaluating the accumulation of heavy metals in the vegetable food chain from old mining areas, highlighting the patterns of contamination and identifying the most critical pollutants. Resz et al. [71] used PCA to assess drinking water sources, combining chemical analyses and risk assessment to identify the main sources of pollution and the gradients of metal contamination across the study area.
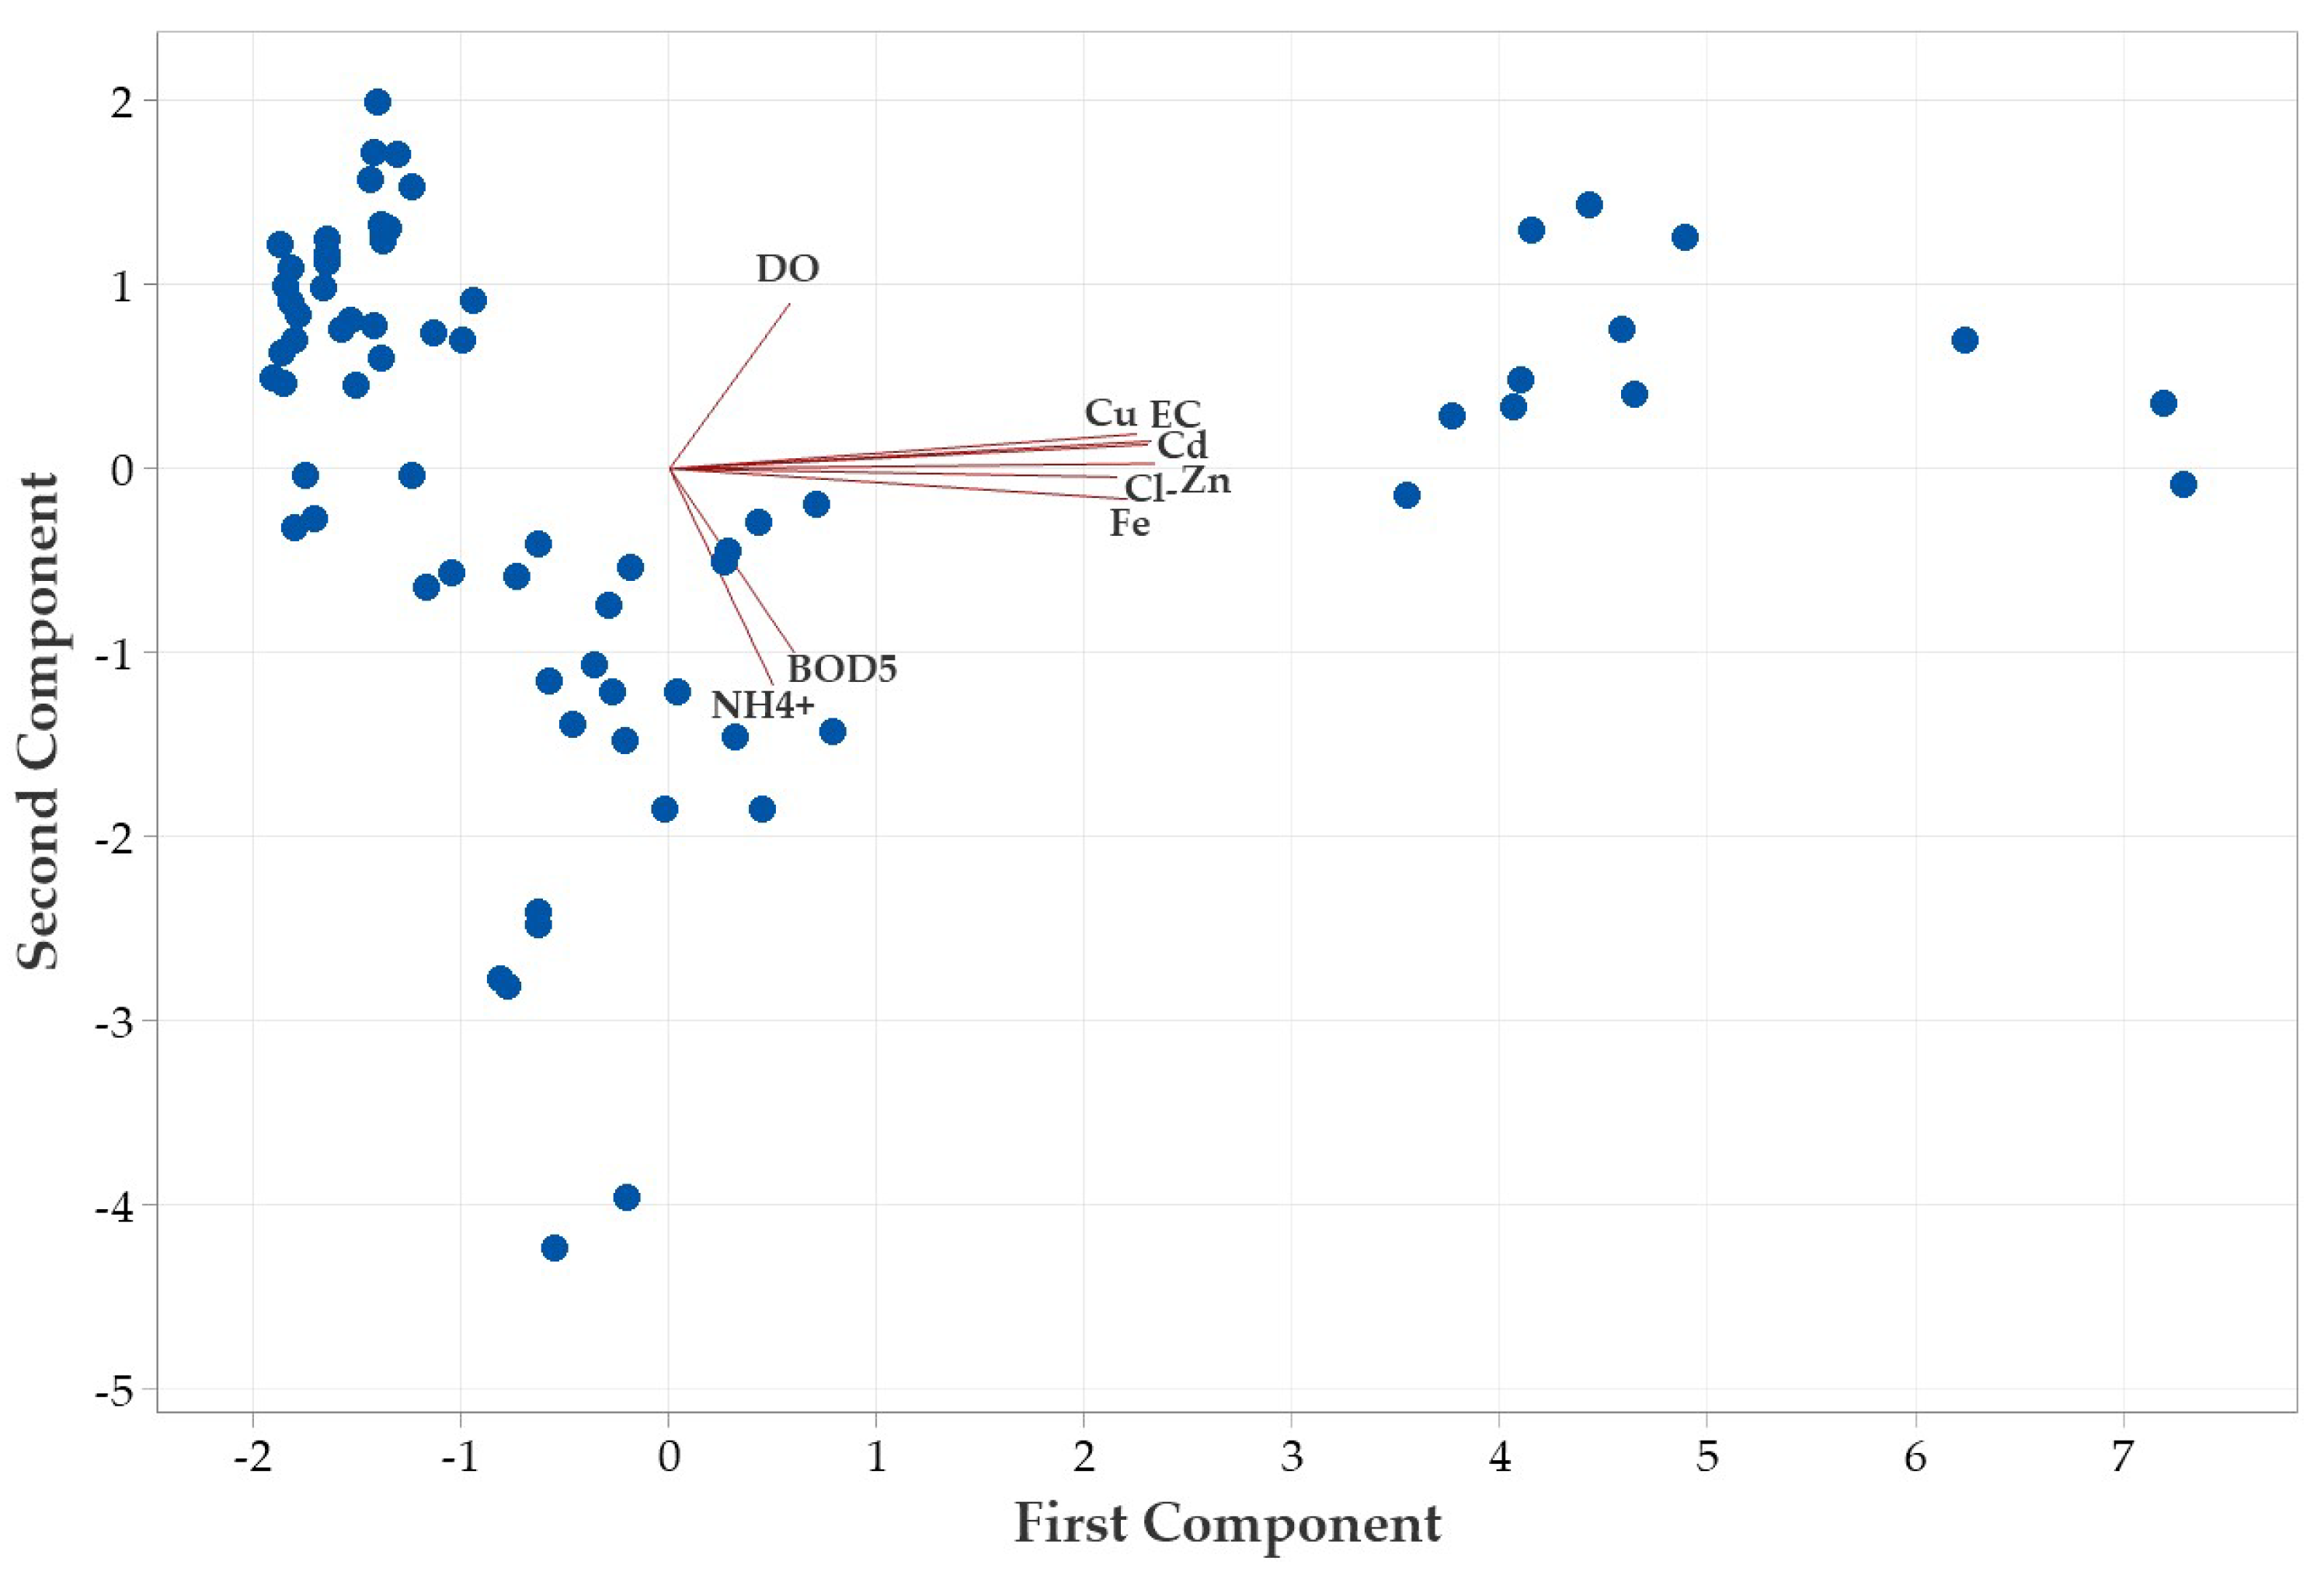
Based on these approaches, Figure 18 presents the PCA based on the parameters BOD5, NH4+, DO, EC, Cl, Fe, Cu, Zn, and Cd, illustrating their contribution to the variability of water quality in the study area.
The PCA on the correlation matrix revealed that the first two principal components (PCs) capture 82.6% of the total variance [49]—PC1: 62.5% and PC2: 20.1%—allowing effective two-dimensional interpretation.
PC1 is positively associated with EC, Cl, and metals (Fe, Cu, Zn, Cd), representing inorganic pollution and metal contamination.
PC2 reflects an ecological quality gradient, with negative loadings for NH4+ and BOD5 and a positive loading for DO, indicating a balance between organic/nutrient pollution and oxygen levels.
PC3 explains around 8.7% of the variance and shows strong interactions between DO and BOD5 but is less influential.
Overall, water quality variation is mainly driven by mineralization and metal contamination (PC1) and the organic pollution and oxygen balance (PC2). These findings provide a clear characterization of water quality and offer a solid basis for identifying pollution sources and differentiating sampling sites according to their contamination levels.

4.2.3. Canonical Correspondence Analysis (CCA): Linking Environmental Variables to Species Distribution [68]

CCA is a multivariate method used to highlight the relationships between biological communities and their environmental factors [72], including heavy metal concentrations [73]. This technique has been applied in diatom studies to understand how heavy metal pollution affects their structure and distribution.
A study by da Silva et al. [74] demonstrated the negative impact of metal pollution on diatom communities, using CCA to analyze ecological and chemical data. Similarly, another study applied CCA to evaluate the relationships between diatom composition and chemical and physical variables of water, highlighting the influence of factors such as BOD5, COD, TDS, NH4-N, NO2-N, and PO4-P on species distribution [75]. Both graphs mentioned in Lines 635 and 669 have been improved to enhance data visualization.
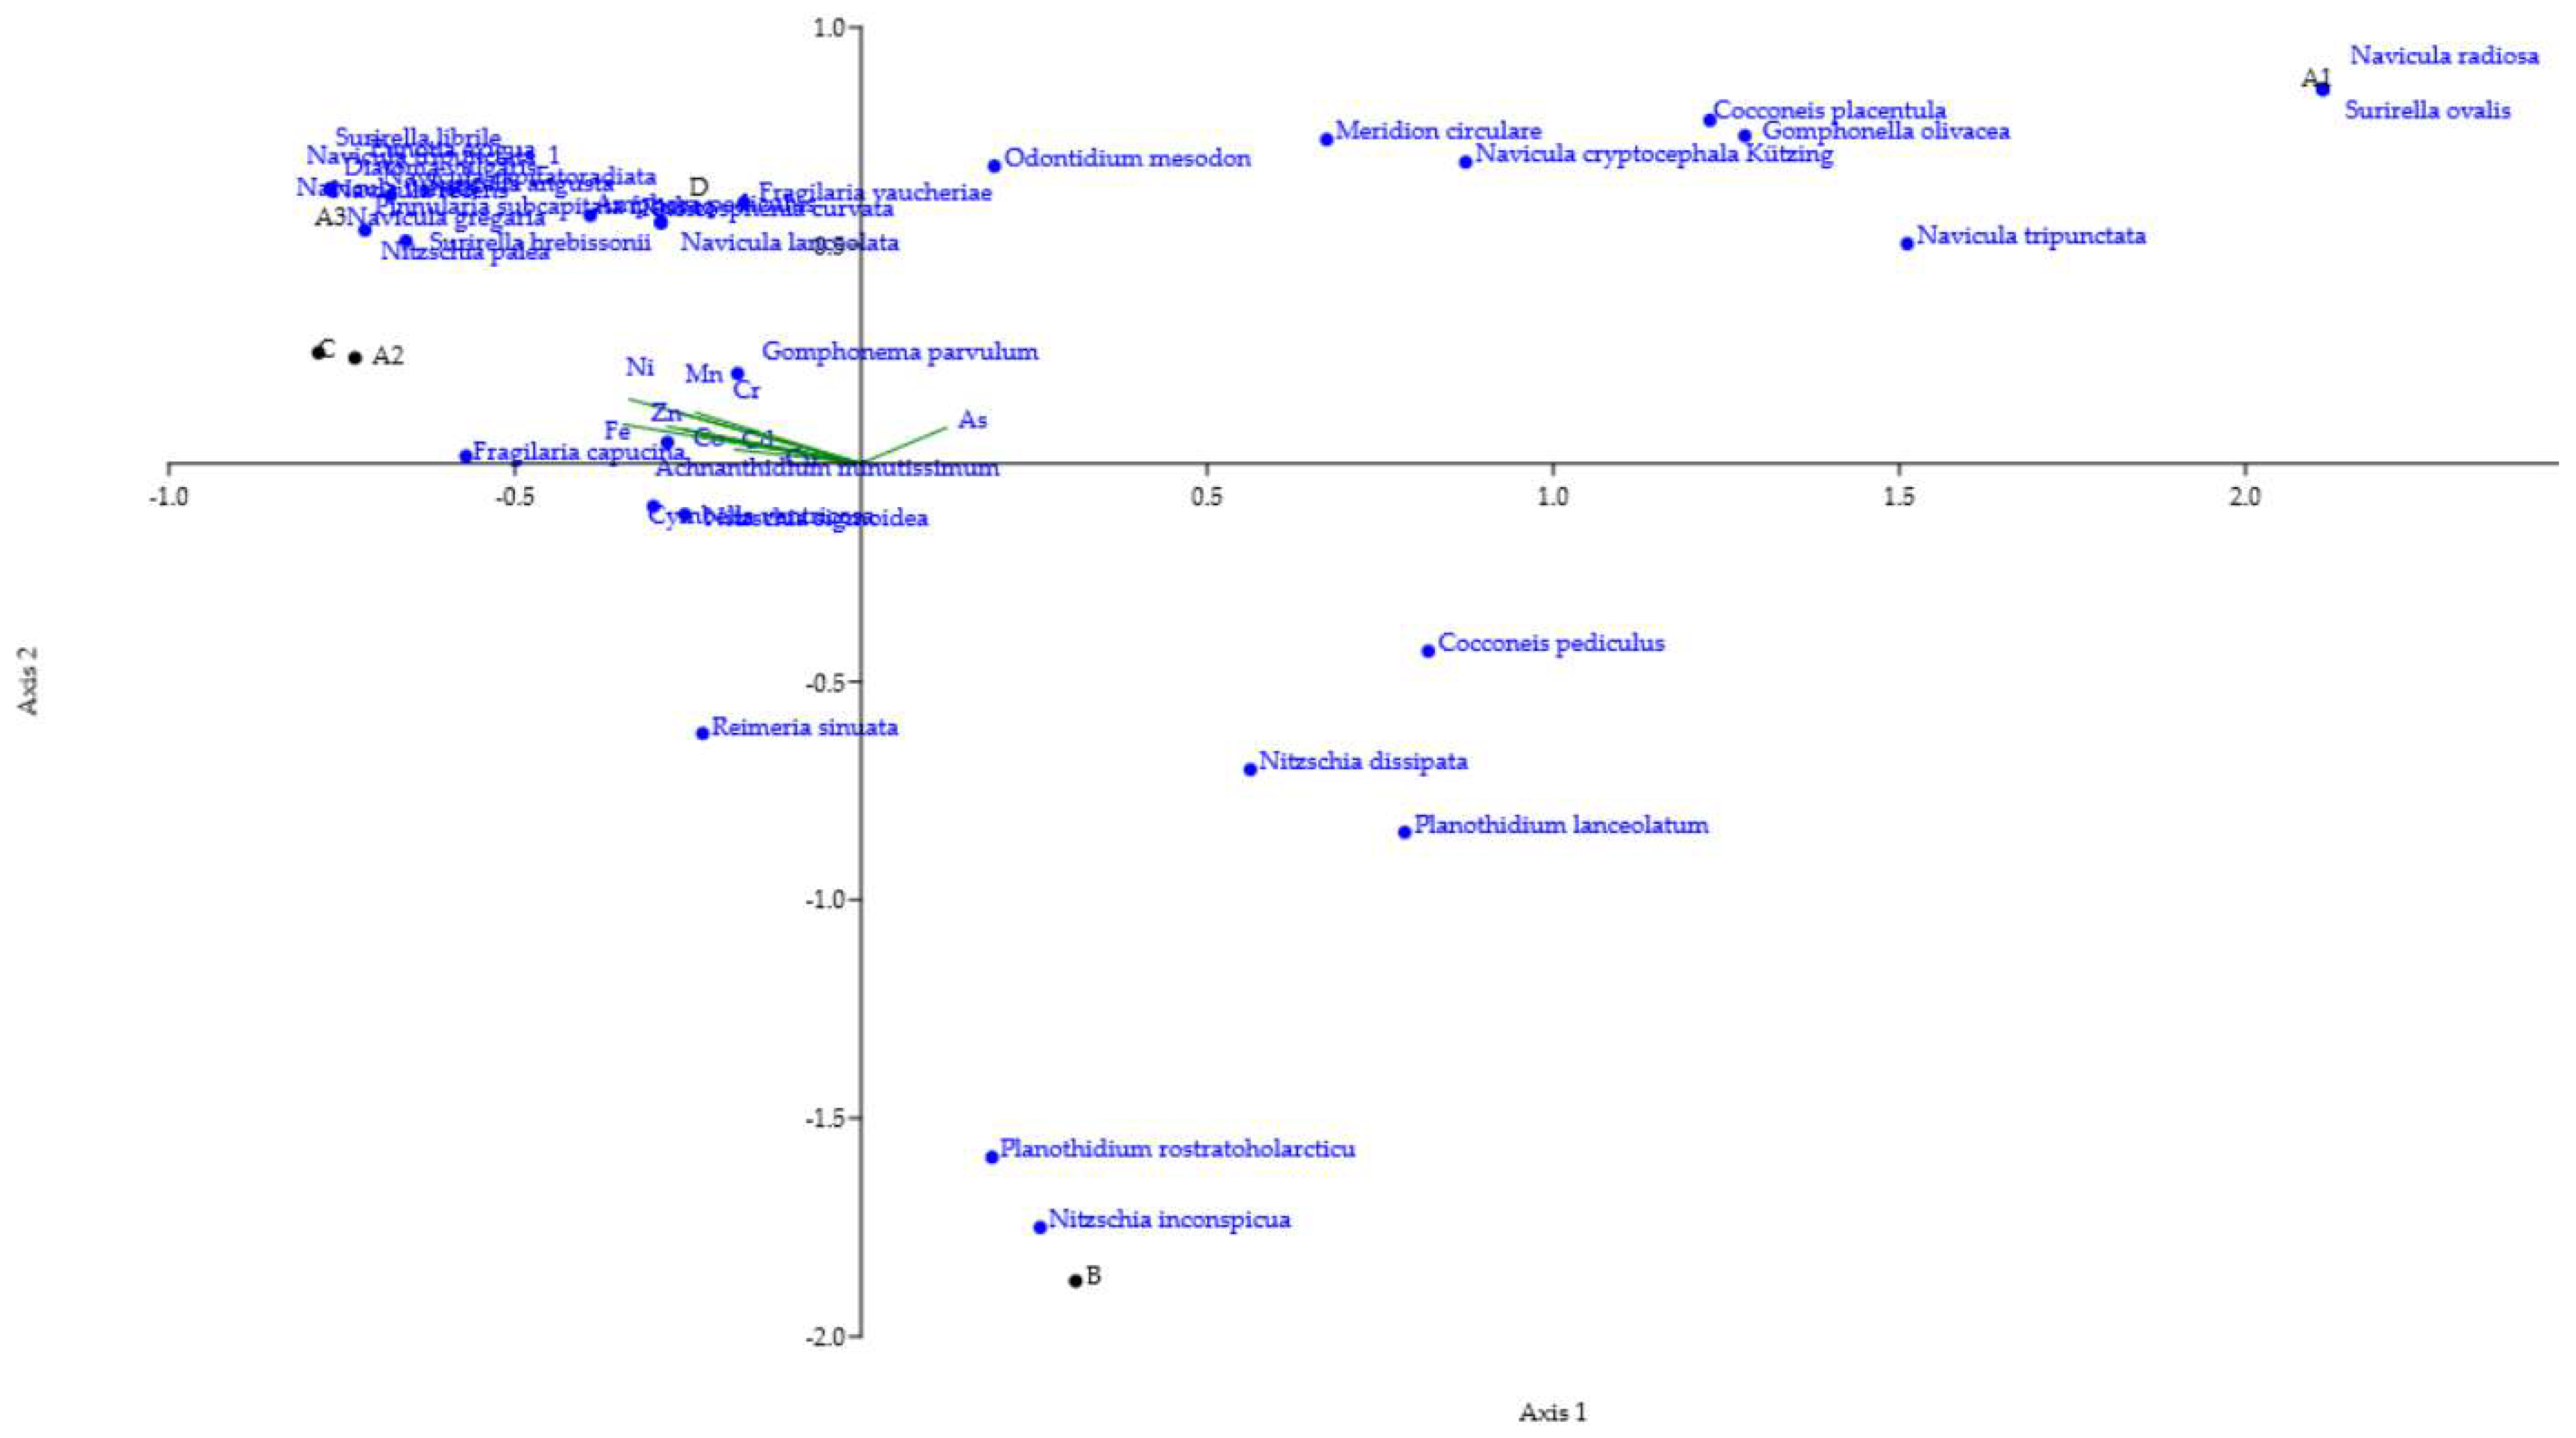
The CCA (Figure 19) was thus performed to further explore the relationships between diatom species and environmental variables, including trace elements.
The CCA shows how environmental variables influence diatom species distribution, with species position reflecting their response to environmental factors [75]. Species like Rhoicosphenia curvata and Navicula lanceolata are associated with Zn, Cu, Cd, and As, confirming tolerance to these trace elements, while Diatoma vulgaris, Navicula gregaria, and Surirella librile correlate with Fe, Mn, Ni, and Cr, suggesting links to natural metal loading or acidic waters.
Environmental vectors indicate the intensity and direction of influence on species. Zn, Cu, Cd, and As are associated with tolerant taxa, while Fe, Mn, Ni, and Cr define a distinct group of species. Axis 1 explains nearly 50% of the variation and represents the main ecological gradient. Axis 2 adds ~25% and differentiates metal types, together capturing ~72% of the ecological information. Axis 3 captures secondary variation, such as microhabitat differences, while remaining axes have low relevance.
Overall, two species groups emerge: bioindicator for Zn, Cu, Cd, and As, and species linked to Fe, Mn, Ni, and Cr. The first two axes capture the essence of ecological distribution, providing a solid framework for interpreting the relationship between diatoms and metals.
Statistical tests confirm that Axes 1 and 2 are ecologically important for understanding the major variation in the data, even if they do not meet the strict significance threshold.

5. Conclusions

The physico-chemical analysis indicates that water quality in the studied rivers is strongly influenced by seasonal dynamics and by discharges from mining-related enterprises. High metal concentrations and increased salinity, particularly in the Abrud and Sartăș Rivers, are primarily associated with the Roșia Poieni mining operations and their waste deposits, while the historical Roșia Montană site contributes only minimally. The saprobic index, combined with physico-chemical parameters (especially trace metals), suggests a mild to moderate influence of organic pollution but a strong impact from acid mine drainage.
The predominant diatom species highlight the differences in water quality: oligosaprobe species, such as N. cryptocephala and N. palea, are more common in the cleaner stations, such as Valea Șesei and Șefanca, while meso-β species, such as A. minutissimum and P. lanceolatum, predominate in sectors with a more pronounced anthropogenic impact. The observation of teratological forms suggests the presence of stress factors, probably related to organic or metal pollution. By correlating the physico-chemical data with the saprobic index, it is observed that sectors with higher concentrations of nutrients and organic matter correspond to diatom communities with greater diversity of pollution-tolerant species. This relationship confirms the usefulness of the saprobic index as a tool for assessing water quality and the impact of anthropogenic activities.
The general water quality in the studied rivers is moderate, with a clear pollution gradient: Valea Şesei presents the best quality, followed by Şefanca and Sartăș, and Abrud records the highest saprobic values. To maintain ecosystem health and prevent eutrophication, continuous monitoring of water quality is recommended, particularly during periods of high temperatures and intense precipitation, to detect early signs of deterioration. In addition, reducing nutrient inputs from agricultural runoff and urban wastewater through best management practices and efficient wastewater treatment is essential. Protecting and restoring riparian buffer zones can help limit the entry of nutrients and sediments into the rivers, while promoting public awareness and local management plans can further minimize anthropogenic impacts on water quality. These combined measures can help ensure sustainable water quality and preserve the ecological integrity of the studied rivers.

Supplementary Materials

The following supporting information can be downloaded at: https://www.mdpi.com/article/10.3390/environments12100389/s1; Table S1: River water sampling points in the Aries River Basin and their characteristics; Table S2: Correlation of Trace elements with Diatom Species Distribution (Pearson Coefficients).

Author Contributions

Conceptualization, M.T.C. and M.G.; methodology, M.T.C.; software, M.G.; validation, M.T.C., M.G., and D.M.P.; formal analysis, M.G.; investigation, M.T.C.; resources, D.M.P.; data curation, M.T.C.; writing—original draft preparation, M.G.; writing—review and editing, M.G.; visualization, D.M.P.; supervision, M.T.C.; project administration, M.G.; funding acquisition, M.T.C. All authors have read and agreed to the published version of the manuscript.

Funding

This research received no external funding.

Data Availability Statement

The original contributions presented in this study are included in the article/Supplementary Material. Further inquiries can be directed to the corresponding author.

Acknowledgments

The authors would like to thank the laboratory staff and field teams for their assistance in sample collection and analysis. We are grateful to “1 Decembrie 1918” University of Alba Iulia for providing access to analytical equipment and resources necessary for this study. We also acknowledge the constructive feedback from anonymous specialist reviewers, which greatly improved the quality of the manuscript.

Conflicts of Interest

The authors declare no conflicts of interest.

References

  1. Akhtar, N.; Syakir Ishak, M.I.; Bhawani, S.A.; Umar, K. Various Natural and Anthropogenic Factors Responsible for Water Quality Degradation: A Review. Water 2021, 13, 2660. [Google Scholar] [CrossRef]
  2. Bashir, I.; Lone, F.A.; Bhat, R.A.; Mir, S.A.; Dar, Z.A.; Dar, S.A. Concerns and Threats of Contamination on Aquatic Ecosystems. In Bioremediation and Biotechnology; Hakeem, K., Bhat, R., Qadri, H., Eds.; Springer: Cham, Switzerland, 2020; pp. 1–26. [Google Scholar] [CrossRef]
  3. Calmus, T.; Valencia-Moreno, M.; Del Río-Salas, R.; Ochoa-Landín, L.; Mendivil-Quijada, H. A multi-elemental study to establish the natural background and geochemical anomalies in rocks from the Sonora River upper basin, NW Mexico. Rev. Mex. Cienc. Geol. 2018, 35, 158–167. [Google Scholar] [CrossRef]
  4. Dumitrel, G.A.; Glevitzky, M.; Popa, M.; Vica, M.L. Studies Regarding the Heavy Metals Pollution of Streams and Rivers in Rosia Montana Area, Romania. J. Environ. Prot. Ecol. 2015, 16, 850–860. [Google Scholar]
  5. Johnson, D.B.; Hallberg, K.B. Acid mine drainage remediation options: A review. Sci. Total Environ. 2005, 338, 3–14. [Google Scholar] [CrossRef]
  6. Younger, P.L.; Banwart, S.A.; Hedin, R.S. Mine Water: Hydrology, Pollution, Remediation; Environmental Pollution Series; Springer: Dordrecht, The Netherlands, 2002; Volume 5. [Google Scholar]
  7. Lottermoser, B.G. Mine Wastes: Characterization, Treatment and Environmental Impacts, 3rd ed.; Springer: Berlin/Heidelberg, Germany, 2010. [Google Scholar]
  8. Skousen, J.G.; Ziemkiewicz, P.F.; McDonald, L.M. Acid mine drainage formation, control and treatment: Approaches and strategies. Extr. Ind. Soc. 2019, 6, 241–249. [Google Scholar] [CrossRef]
  9. Skousen, J.G.; Sexstone, A.; Ziemkiewicz, P.F. Acid mine drainage control and treatment. In Reclamation of Drastically Disturbed Lands; Barnhisel, R.I., Darmody, R.G., Daniels, W.L., Eds.; American Society of Agronomy: Madison, WI, USA, 2000; Volume 41, p. 154. [Google Scholar] [CrossRef]
  10. Battes, K.P.; Cîmpean, M.; Momeu, L.; Avram, A.; Battes, K.W.; Stoica, I.V. Multiple impact assessment and water quality based on diatom, benthic invertebrate and fish communities in the Arieș River catchment area (Transylvania, Romania). Stud. Univ. Babeș-Bolyai Biol. 2018, 63, 27–40. [Google Scholar] [CrossRef]
  11. Szekely-Andorko, J.; Peterfi, L.Ș.; Momeu, L. Benthic Diatoms Used as Bioindicators for Water Quality Evaluation in the Drainage Basin of the Arieș River (Transylvania, Romania). Contrib. Bot. 2011, 46, 107–115. [Google Scholar]
  12. Butiuc-Keul, A.; Momeu, L.; Craciunas, C.; Dobrota, C.; Cuna, S.; Balas, G. Physico-chemical and biological studies on water from Aries River (Romania). J. Environ. Manag. 2012, 95, S3–S8. [Google Scholar] [CrossRef]
  13. Olenici, A.; Blanco, S.; Jiménez-Gómez, F.; Borrego-Ramos, M.; Baciu, C. Effects of Water Pollution on Diatom Communities of Roșia Montană Mining Area, Romania. Sustainability 2025, 17, 4592. [Google Scholar] [CrossRef]
  14. Mamanazarova, K.; Alimjanova, K.; Barinova, S. Biodiversity of Diatoms as Indicators of Water Quality and Landscape Sustainable Dynamics in the Zarafshan River, Uzbekistan. Land 2024, 13, 1809. [Google Scholar] [CrossRef]
  15. Gloaguen, R.; Ali, S.H.; Herrington, R.; Ajjabou, L.; Downey, E.; Stewart, I.S. Mineral revolution for the wellbeing economy. Glob. Sustain. 2022, 5, e15. [Google Scholar] [CrossRef]
  16. Dumitrel, G.A.; Glevitzky, M.; Popa, M.; Chirila, D.; Palea, A. Monitoring of Lead, Copper and Cadmium Contamination Level of Soil from Zlatna Region Romania. J. Environ. Prot. Ecol. 2017, 18, 55–62. [Google Scholar]
  17. Glevitzky, M.; Bostan, R.; Varvara, S.; Corcheş, M.-T.; Dumitrel, G.-A.; Popa, M. Impact of Mining on River Water Quality in Roșia Montană Area, Romania, and the Use of Zeolites for Acid Mine Drainage Remediation. Clean. Technol. 2025, 7, 41. [Google Scholar] [CrossRef]
  18. Lobo, E.A.; Heinrich, C.G.; Schuch, M.; Wetzel, C.E.; Ector, L. Diatoms as Bioindicators in Rivers. In River Algae; Necchi, O., Jr., Ed.; Springer: Cham, Switzerland, 2016; pp. 245–272. [Google Scholar] [CrossRef]
  19. Shibabaw, T.; Beyene, A.; Awoke, A.; Tirfie, M.; Azage, M.; Triest, L. Diatom community structure in relation to environmental factors in human influenced rivers and streams in tropical Africa. PLoS ONE 2021, 2021 16, e0246043. [Google Scholar] [CrossRef]
  20. Hustedt, F. Kieselalgen (Diatomeen). Einführung in die Kleinlebwelt; Kosmos Verlag: Stuttgart, Germany, 1956; 70p. [Google Scholar]
  21. SR EN 872:2005; Water Quality—Determination of Suspended Solids—Method by Filtration through Glass Fibre Filters. ASRO: Bucharest, Romania, 2005.
  22. SR EN 25813:2000; Water Quality—Determination of Dissolved Oxygen. Iodometric Method. ASRO: Bucharest, Romania, 2000.
  23. SR EN 1899-2:2002; Water Quality—Determination of Biochemical Oxygen Demand after n Days (BODn)—Part 2: Method for Undiluted Samples (ISO 5815:1989, Modified). ASRO: Bucharest, Romania, 2002.
  24. SR ISO 15705:2022; Water Quality—Determination of the Chemical Oxygen Demand Index (ST-COD). ASRO: Bucharest, Romania, 2022.
  25. SR ISO 7150-1:2001; Water Quality—Determination of Ammonium Content—Part 1: Manual Spectrometric Method. ASRO: Bucharest, Romania, 2001.
  26. SR EN 26777:2002; Water Quality—Determination of Nitrite Content—Molecular Absorption Spectrometric Method. ASRO: Bucharest, Romania, 2002.
  27. BSI. SR ISO 7890-3:2000; Water Quality—Determination of Nitrate Content—Part 3: Spectrometric Method Using Sulfosalicylic Acid. BSI: London, UK, 2000.
  28. ASRO. STAS 9187:1984; Surface, Underground and Waste Waters—Residuum Determination. ASRO: Bucharest, Romania, 1984.
  29. STAS 6194/1-85; Water Quality—Determination of Bicarbonates (HCO3) in Water. ASRO: Bucharest, Romania, 1985.
  30. SR ISO 9297:2001; Water Quality—Determination of Chloride Content. Titration with Silver Nitrate Using Chromate as Indicator (Mohr Method). ASRO: Bucharest, Romania, 2001.
  31. APHA. Method 4500-SO42−; Standard Methods for the Examination of Water and Wastewater. Available online: https://law.resource.org/pub/us/cfr/ibr/002/apha.method.4500-so42.1992.pdf (accessed on 8 January 2022).
  32. Fernández-Turiel, J.L.; Llorens, J.F.; López-Vera, F.; Gómez-Artola, C.; Morell, I.; Gimeno, D. Strategy for Water Analysis Using ICP-MS. Fresenius J. Anal. Chem. 2000, 368, 601–606. [Google Scholar] [CrossRef]
  33. ASRO. SR EN 13946:2014; Water Quality—Guidance for the Routine Sampling and Pretreatment of Benthic Diatoms from Rivers and Lakes. ASRO: Bucharest, Romania, 2014.
  34. Pantle, E.; Buck, H. Die Biologische Überwachung der Gewässer und die Darstellung der Ergebnisse (Biological Monitoring of Waterbodies and the Presentation of Results). Gas Wasserfach 1955, 96, 604–618. [Google Scholar]
  35. Ministry of Environment and Water Management. Normative of 16 February 2006 on the Classification of Surface Water Quality for Establishing the Ecological Status of Water Bodies (in Romanian), Approved by Order No. 161/2006; Official Gazette of Romania: Bucharest, Romania, 2006; Available online: https://legislatie.just.ro/Public/DetaliiDocumentAfis/74255 (accessed on 14 April 2025).
  36. SR EN 14407:2014; Water Quality—Guidance for the Identification and Counting of Benthic Diatom Samples from Rivers and Lakes. ASRO: Bucharest, Romania, 2014.
  37. European Union. Directive 2000/60/EC of the European Parliament and of the Council of 23 October 2000 Establishing a Framework for Community Action in the Field of Water Policy (Water Framework Directive). Off. J. Eur. Communities 2000, L327, 1–72. [Google Scholar]
  38. Halmagyi, A.; Butiuc-Keul, A.; Keul, M.; Dobrotă, C.; Fodorpataki, L.; Pintea, A.; Mocan, A.; Pop, V.; Coste, A. Impact of Arieş River Contaminants on Algae and Plants. Toxics 2023, 11, 817. [Google Scholar] [CrossRef] [PubMed]
  39. Moldovan, A.; Török, A.I.; Kovacs, E.; Cadar, O.; Mirea, I.C.; Micle, V. Metal Contents and Pollution Indices Assessment of Surface Water, Soil, and Sediment from the Arieș River Basin Mining Area, Romania. Sustainability 2022, 14, 8024. [Google Scholar] [CrossRef]
  40. Olenici, A.; Blanco, S.; Borrego-Ramos, M.; Jiménez-Gómez, F.; Guerrero, F.; Momeu, L.; Baciu, C. A New Diatom Teratology Driven by Metal Pollution in a Temperate River (Roșia Montană, Romania). Ann. Di Bot. 2019, 9, 113–118. [Google Scholar] [CrossRef]
  41. Leguay, S.; Lavoie, I.; Levy, J.L.; Fortin, C. Using biofilms for monitoring metal contamination in lotic ecosystems: The protective effects of hardness and pH on metal bioaccumulation. Environ. Toxicol. Chem. 2016, 35, 1489–1501. [Google Scholar] [CrossRef]
  42. Morin, S.; Cordonier, A.; Lavoie, I.; Arini, A.; Blanco, S.; Duong, T.T.; Tornés, E.; Bonet, B.; Corcoll, N.; Faggiano, L.; et al. Consistency in diatom response to metal-contaminated environments. In Handbook of Environmental Chemistry; Guasch, H., Ginebreda, A., Geiszinger, A., Eds.; Springer: Heidelberg, Germany, 2012; Volume 19, pp. 117–146. [Google Scholar]
  43. Cattaneo, A.; Couillard, Y.; Wunsam, S.; Courcelles, M. Diatom taxonomic and morphological changes as indicators of metal pollution and recovery in Lac Dufault (Québec, Canada). J. Paleolimnol. 2004, 32, 163–175. [Google Scholar] [CrossRef]
  44. Cattaneo, A.; Couillard, Y.; Wunsam, S.; Fortin, C. Littoral diatoms as indicators of recent water and sediment contamination by metals in lakes. J. Environ. Monit. 2011, 13, 572–582. [Google Scholar] [CrossRef] [PubMed]
  45. Duong, T.T.; Morin, S.; Herlory, O.; Feurtet-Mazel, A.; Coste, M.; Boudou, A. Seasonal effects of cadmium accumulation in periphytic diatom communities of freshwater biofilms. Aquat. Toxicol. 2008, 90, 19–28. [Google Scholar] [CrossRef]
  46. Luís, A.T.; Teixeira, P.; Almeida, S.F.P.; Ector, L.; Matos, J.X.; Ferreira da Silva, E.A. Impact of acid mine drainage (AMD) on water quality, stream sediments and periphytic diatom communities in the surrounding streams of Aljustrel mining area (Portugal). Water Air Soil Pollut. 2009, 200, 147–167. [Google Scholar] [CrossRef]
  47. Tolotti, R.; Consani, S.; Carbone, C.; Vagge, G.; Capello, M.; Cutroneo, L. Benthic Diatom Community Response to Metal Contamination from an Abandoned Cu Mine: Case Study of the Gromolo Torrent (Italy). J. Environ. Sci. 2019, 75, 233–246. [Google Scholar] [CrossRef]
  48. Gonçalves, S.; Almeida, S.F.P.; Figueira, E.; Kahlert, M. Valve Teratologies and Chl c in the Freshwater Diatom Tabellaria flocculosa as Biomarkers for Metal Contamination. Ecol. Indic. 2019, 101, 476–485. [Google Scholar] [CrossRef]
  49. Gonçalves, S.; Kahlert, M.; Almeida, S.F.P.; Figueira, E. Assessing Cu Impacts on Freshwater Diatoms: Biochemical and Metabolomic Responses of Tabellaria flocculosa (Roth) Kützing. Sci. Total Environ. 2018, 625, 1234–1246. [Google Scholar] [CrossRef] [PubMed]
  50. Lavoie, I.; Hamilton, P.B.; Morin, S.; Kim Tiam, S.; Kahlert, M.; Gonçalves, S.; Falasco, E.; Fortin, C.; Gontero, B.; Heudre, D.; et al. Diatom Teratologies as Biomarkers of Contamination: Are All Deformities Ecologically Meaningful? Ecol. Indic. 2017, 82, 539–550. [Google Scholar] [CrossRef]
  51. Cantonati, M.; Angeli, N.; Virtanen, L.; Wojtal, A.Z.; Gabrieli, J.; Falasco, E.; Lavoie, I.; Morin, S.; Marchetto, A.; Fortin, C.; et al. Achnanthidium minutissimum (Bacillariophyta) Valve Deformities as Indicators of Metal Enrichment in Diverse Widely-Distributed Freshwater Habitats. Sci. Total Environ. 2014, 475, 201–215. [Google Scholar] [CrossRef]
  52. Neidoni, D.G.; Nicorescu, V.; Negrea, S.C.; Stoica, C.; Pahomi, A.; Niță-Lăzar, M. Diatoms: A Viable Tool for Quantifying Surface Water Pollution. Rom. J. Ecol. Environm. Chem. 2023, 5, 31–41. [Google Scholar] [CrossRef]
  53. Pandey, L.K.; Sharma, Y.C.; Park, J.; Choi, S.; Lee, H.; Lyu, J.; Han, T. Evaluating Features of Periphytic Diatom Communities as Biomonitoring Tools in Fresh, Brackish and Marine Waters. Aquat. Toxicol. 2018, 194, 67–77. [Google Scholar] [CrossRef] [PubMed]
  54. Falasco, E.; Ector, L.; Wetzel, C.E.; Badino, G.; Bona, F. Looking Back, Looking Forward: A Review of the New Literature on Diatom Teratological Forms (2010–2020). Hydrobiologia 2021, 848, 1675–1753. [Google Scholar] [CrossRef]
  55. Olenici, A.; Blanco, S.; Borrego-Ramos, M.; Momeu, L.; Baciu, C. Exploring the Effects of Acid Mine Drainage on Diatom Teratology Using Geometric Morphometry. Ecotoxicology 2017, 26, 1018–1030. [Google Scholar] [CrossRef] [PubMed]
  56. Cerisier, A.; Vedrenne, J.; Lavoie, I.; Morin, S. Assessing the Severity of Diatom Deformities Using Geometric Morphometry. Bot. Lett. 2018, 166, 32–40. [Google Scholar] [CrossRef]
  57. Morin, S.; Duong, T.T.; Dabrin, A.; Coynel, A.; Herlory, O.; Baudrimont, M.; Delmas, F.; Durrieu, G.; Schäfer, J.; Winterton, P.; et al. Long-Term Survey of Heavy-Metal Pollution, Biofilm Contamination and Diatom Community Structure in the Riou Mort Watershed, South-West France. Environ. Pollut. 2008, 151, 532–542. [Google Scholar] [CrossRef]
  58. Fernández, M.R.; Martín, G.; Corzo, J.; de la Linde, A.; García, E.; López, M.; Sousa, M. Design and Testing of a New Diatom-Based Index for Heavy Metal Pollution. Arch. Environ. Contam. Toxicol. 2018, 74, 170–192. [Google Scholar] [CrossRef]
  59. Poikane, S.; Kelly, M.; Cantonati, M. Benthic algal assessment of ecological status in European lakes and rivers: Challenges and opportunities. Sci. Total Environ. 2016, 568, 603–613. [Google Scholar] [CrossRef]
  60. Poikane, S.; Kelly, M.G.; Herrero, F.S.; Pitt, J.A.; Jarvie, H.P.; Claussen, U.; Leujak, W.; Solheim, A.L.; Teixeira, H.; Phillips, G. Nutrient criteria for surface waters under the European Water Framework Directive: Current state-of-the-art, challenges and future outlook. Sci. Total Environ. 2019, 695, 133888. [Google Scholar] [CrossRef]
  61. Kelly, M.; Teixeira, H.; Lyche Solheim, A.; Free, G.; Phillips, G.; Salas Herrero, M.F.; Kolada, A.; Varbiro, G.; Poikane, S. Physico-Chemical Criteria to Support Good Ecological Status in Europe; Publications Office of the European Union: Luxembourg, 2024. [Google Scholar]
  62. Kelly, M.G.; Free, G.; Kolada, A.; Phillips, G.; Warner, S.; Wolfram, G.; Poikane, S. Warding off freshwater salinization: Do current criteria measure up? Wiley Interdiscip. Rev. Water 2024, 11, e1694. [Google Scholar] [CrossRef]
  63. Poikane, S.; Várbíró, G.; Kelly, M.G.; Birk, S.; Phillips, G. Estimating river nutrient concentrations consistent with good ecological condition: More stringent nutrient thresholds needed. Ecol. Indic. 2021, 121, 107017. [Google Scholar] [CrossRef]
  64. Gordon, N.; García-Rodríguez, F.; Adams, J.B. Paleolimnology of a Coastal Lake on the Southern Cape Coast of South Africa: Sediment Geochemistry and Diatom Distribution. J. Afr. Earth Sci. 2012, 75, 14–24. [Google Scholar] [CrossRef]
  65. Titu, M.; Oprean, C.; Cicala, E. Technical Statistics and Statistical Process Control; Lucian Blaga University Publishing House: Sibiu, Romania, 2001. (In Romanian) [Google Scholar]
  66. Martín, G.; Toja, J.; Sala, S.E.; de los Reyes Fernández, M.; Reyes, I.; Casco, M.A. Application of Diatom Biotic Indices in the Guadalquivir River Basin, a Mediterranean Basin: Which One Is the Most Appropriate? Environ. Monit. Assess. 2010, 170, 519–534. [Google Scholar] [CrossRef]
  67. Mijbas, Y.A.; Fayidh, M.A.; Nasif, R.M. Evaluation of Heavy Metals Pollution in the Sediments of Diyala River Lower Reaches, Eastern Iraq. Iraqi Geol. J. 2024, 57, 32–45. [Google Scholar] [CrossRef]
  68. Tănăsescu, N. Mathematical Modeling and Numerical Simulation of Technological Processes in the Food Industry; Matrix Rom Publishing House: Bucharest, Romania, 2000. (In Romanian) [Google Scholar]
  69. Liu, J.; Kang, H.; Tao, W.; Li, H.; He, D.; Ma, L.; Tang, H.; Wu, S.; Yang, K.; Li, X. A spatial distribution–Principal component analysis (SD-PCA) model to assess pollution of heavy metals in soil. Sci. Total Environ. 2023, 859, 160112. [Google Scholar] [CrossRef] [PubMed]
  70. Gergen, I.; Harmanescu, M. Application of principal component analysis in the pollution assessment with heavy metals of vegetable food chain in the old mining areas. Chem. Cent. J. 2012, 6, 156. [Google Scholar] [CrossRef]
  71. Resz, M.-A.; Roman, C.; Senila, M.; Török, A.I.; Kovacs, E. A Comprehensive Approach to the Chemistry, Pollution Impact and Risk Assessment of Drinking Water Sources in a Former Industrialized Area of Romania. Water 2023, 15, 1180. [Google Scholar] [CrossRef]
  72. Willems, W.; Rees, H.L.; Vincx, M.; Goethals, P.; Degraer, S. Relations and Interactions Between Environmental Factors and Biotic Properties; ICES Cooperative Research Report No. 288; ICES: Copenhagen, Denmark, 2004; p. 69. [Google Scholar]
  73. Marella, T.K.; Saxena, A.; Tiwari, A. Diatom mediated heavy metal remediation: A review. Bioresour. Technol. 2020, 305, 123068. [Google Scholar] [CrossRef] [PubMed]
  74. da Silva, E.F.; Almeida, S.F.P.; Nunes, M.L.; Luís, A.T.; Borg, F.; Hedlund, M.; Marques de Sá, C.; Patinha, C.; Teixeira, P. Heavy metal pollution downstream the abandoned Coval da Mó mine (Portugal) and associated effects on epilithic diatom communities. Sci. Total Environ. 2009, 407, 5620–5636. [Google Scholar] [CrossRef] [PubMed]
  75. Kargıoğlu, M.; Serteser, A.; Kıvrak, E.; İçağa, Y.; Konuk, M. Relationships between Epipelic Diatoms, Aquatic Macrophytes, and Water Quality in Akarçay Stream, Afyonkarahisar, Turkey. Oceanol. Hydrobiol. Stud. 2012, 41, 74–84. [Google Scholar] [CrossRef]
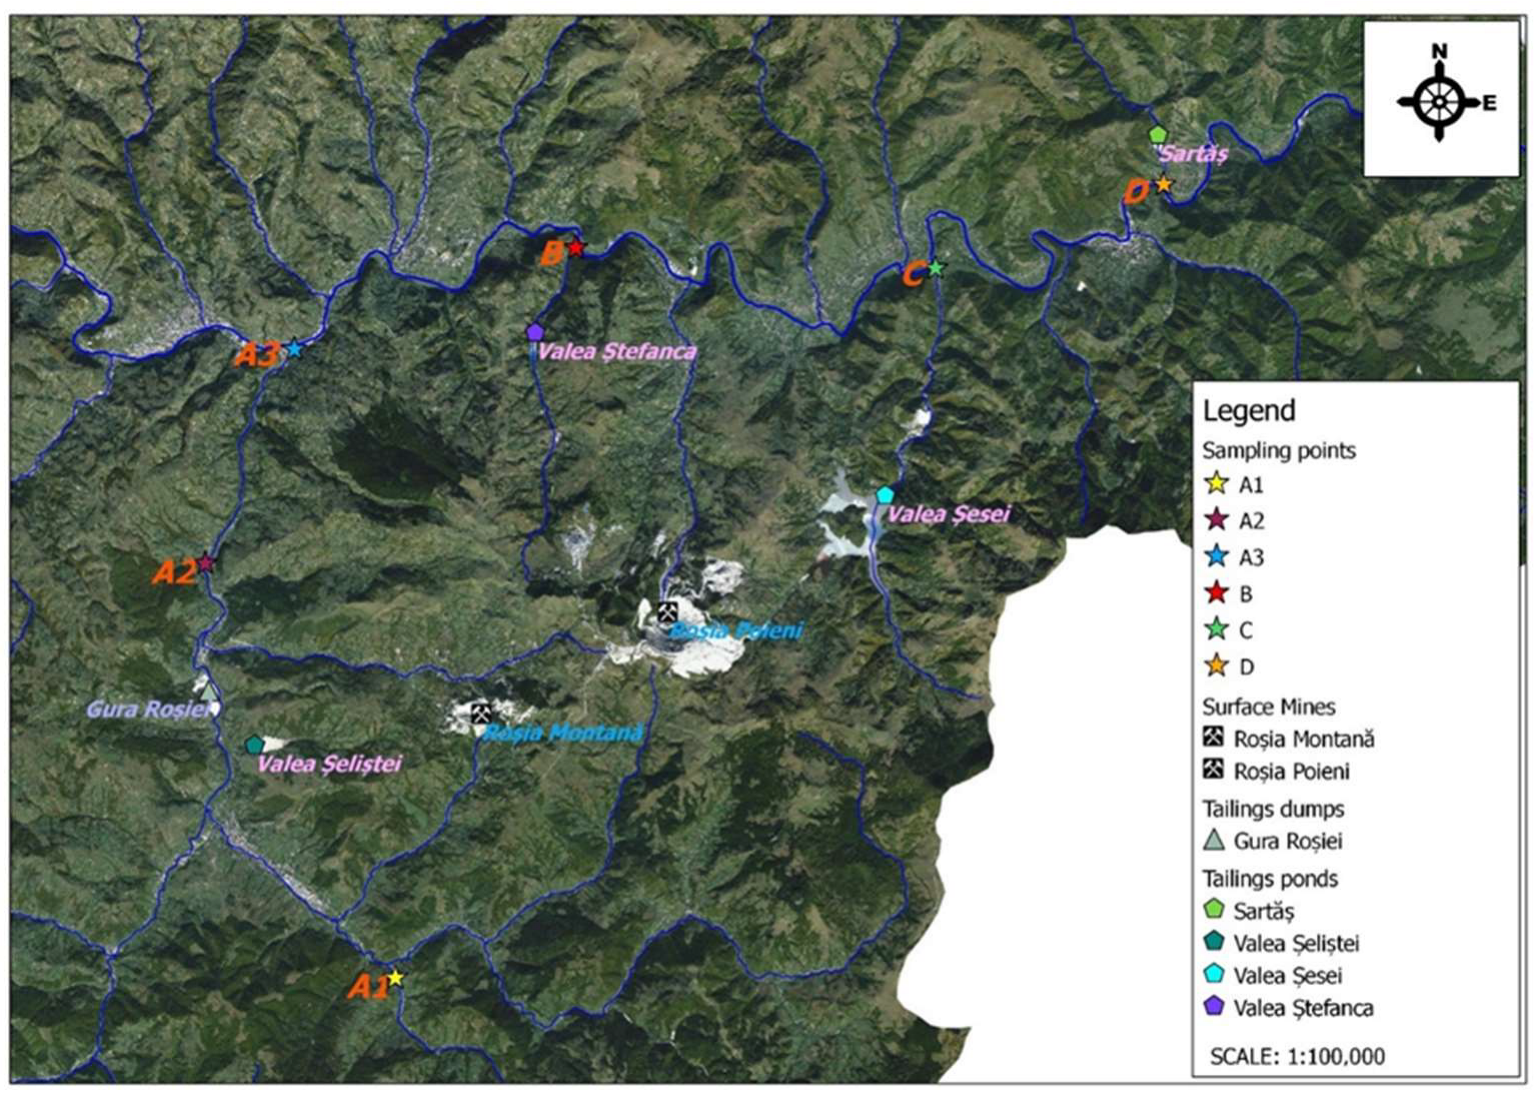
Figure 1. River water sampling points from the tributaries of the Arieș River with major impact on its pollution, along with the map of tailings deposits and settling ponds.
Environments 12 00389 g001
Figure 2. Normal form of A. minutissimum at site A1.
Environments 12 00389 g002
Figure 3. Teratological form of A. minutissimum at site A1.
Environments 12 00389 g003
Figure 4. Normal form of A. minutissimum at site A2.
Environments 12 00389 g004
Figure 5. Teratological form of A. minutissimum at site A2.
Environments 12 00389 g005
Figure 6. Normal form of A. minutissimum at site A3.
Environments 12 00389 g006
Figure 7. Teratological form of A. minutissimum at site A3.
Environments 12 00389 g007
Figure 8. Normal form of A. minutissimum at site B.
Environments 12 00389 g008
Figure 9. Teratological form of A. minutissimum at site B.
Environments 12 00389 g009
Figure 10. Normal form of P. lanceolatum at site B.
Environments 12 00389 g010
Figure 11. Teratological form of P. lanceolatum at site B.
Environments 12 00389 g011
Figure 12. Normal form of C. pediculus at site B.
Environments 12 00389 g012
Figure 13. Teratological form of C. pediculus Ehrenberg at site B.
Environments 12 00389 g013
Figure 14. Normal form of A. minutissimum at site C.
Environments 12 00389 g014
Figure 15. Teratological form of A. minutissimum at site C.
Environments 12 00389 g015
Figure 16. Normal form of A. minutissimum at site D.
Environments 12 00389 g016
Figure 17. Teratological form of A. minutissimum at site D.
Environments 12 00389 g017
Figure 18. PCA scores plot based on BOD5, NH4+, DO, EC, Cl, Fe, Cu, Zn, and Cd, showing the distribution of sampling sites along gradients of organic load, nutrients, salinity, and trace element contamination.
Environments 12 00389 g018
Figure 19. CCA plot illustrating the influence of trace elements on the distribution of diatom species.
Environments 12 00389 g019
Table 1. Physico-chemical parameters of the Abrud River water in the locality of Bucium Sat (A1).
ParameterpHTSS [mg/L]DO
[mgO/L]
BOD5 [mgO/L]COD-Cr [mgO/L]N-NH4 [mgN/L]N-NO2 [mgN/L]N-NO3 [mgN/L]
Time
[year/month]
2022Jan.7.924.39.120.762.160.0150.0010.025
Apr.8.231.28.460.911.730.0230.0020.031
Jul.8.114.17.731.072.250.0480.0050.052
Oct.7.719.78.370.851.960.0310.0040.019
2023Jan.7.522.38.920.811.870.0190.0020.018
Apr.8.031.48.811.011.340.0280.0030.027
Jul.7.924.27.941.232.360.0340.0060.046
Oct.7.632.48.350.671.240.0270.0010.029
2024Jan.7.827.19.040.831.330.0110.0040.022
Apr.7.732.68.840.891.570.0220.0030.038
Jul.7.528.08.011.042.670.0380.0090.044
Oct.8.732.88.760.771.560.0130.0020.033
Quality class [35]I6.5–8.5-6.2, not less than 80% oxygen saturation6100.40.011
II250.80.033
III501.20.065.6
IV1253.20.311.2
V>125>3.2>0.3>11.2
Table 2. Salinity parameters of the Abrud River in the locality of Bucium Sat (A1).
ParameterEC
[μS/cm]
FR
[mg/L]
Ca2+
[mg/L]
Mg2+
[mg/L]
Na+
[mg/L]
HCO3
[mg/L]
Cl
[mg/L]
SO42−
[mg/L]
Time
[year/month]
2022Jan.136153382.134.178.70.89.8
Apr.167169423.393.883.51.38.1
Jul.251234663.854.589,43.712.4
Oct.196206591.893.473.22.411.1
2023Jan.194174411.663.772.71.17.6
Apr.184182572.474.286.71.59.3
Jul.279213612.984.0102.44.114.6
Oct.213168462.093.484.62.98.4
2024Jan.164158482.173.987.41.510.2
Apr.183184433.144.384.32.39.7
Jul.267227554.164.8111.53.814.5
Oct.173173402.173.591.02.510.3
Quality class [35]I-500501225-2560
II750100505050120
III1000200100100250250
IV1300300200200300300
V>1300>300>200>200>300>300
Table 3. The content of toxic trace elements in the water of the Abrud River in the locality of Bucium Sat (A1).
ParameterAs2+
[μg/L]
Cd2+
[μg/L]
Cototal
(Co2+ + Co3+)
[μg/L]
Crtotal (Cr3+ + Cr6+)
[μg/L]
Cu2+
[μg/L]
Fetotal
[mg/L]
Mntotal
[mg/L]
Ni2+
[μg/L]
Zn2+
[μg/L]
Time
[year/month]
2022Jan.0.320.310.911.472.540.020.0541.647.69
Apr.0.410.451.132.803.170.040.0472.379.14
Jul.0.770.633.475.789.760.090.1244.4610.54
Oct.0.280.432.342.343.150.060.0672.488.42
2023Jan.0.350.280.242.013.090.010.0491.876.43
Apr.0.460.510.693.174.170.030.0612.279.84
Jul.0.690.572.646.1510.460.070.1153.9413.47
Oct.0.250.391.862.363.180.040.0553.047.62
2024Jan.0.390.410.362.174.640.010.0492.076.64
Apr.0.510.370.622.485.200.050.0622.417.30
Jul.0.590.583.426.378.120.080.0973.9714.52
Oct.0.330.341.843.144.380.020.0431.9511.34
Quality class [35]I100.51025200.30.0510100
II2012050300.50.125200
III50250100501.00.350500
IV1005100250100211001000
V>100>5>100>250>100>2>1>100>1000
Table 4. Diatom composition and saprobic index of the Abrud River at Bucium Sat (A1).
Scientific Name of a DiatomPopulation SizeDegree of SaprobitySaprobic Indicator Value
NormalTeratological
Planothidium lanceolatum (Brébisson ex Kützing) Lange-Bertalot 620β2
Achnanthidium minutissimum Kützing) Czarnecki1298o-β1.5
Cocconeis pediculus Ehrenberg240β2
Cocconeis placentula Ehrenberg 90β2
Cymbella ventricosa Agardh10o-β1.5
Odontidium mesodon (Ehrenberg) Kützing30o1
Fragilaria vaucheriae (Kützing) J.B.Petersen 50β2
Gomphonella olivacea (Hornemann) Rabenhorst150β2
Gomphonema parvulum Kützing30β2
Meridion circulare (Greville) C.Agardh30o1
Navicula cryptocephala Kützing270α3
Navicula radiosa Kützing590β2
Navicula tripunctata (O.F.Müller) Bory 130β-α2.5
Nitzschia dissipata (Kützing) Rabenhorst130o-β1.5
Surirella ovalis Brébisson400α3
Total414
Saprobic index value1.91
Table 5. Physico-chemical parameters of the Abrud River water downstream of the confluence with the Roșia Montană River (A2).
ParameterpHTSS [mg/L]DO
[mgO/L]
BOD5 [mgO/L]COD-Cr [mgO/L]N-NH4 [mgN/L]N-NO2 [mgN/L]N-NO3 [mgN/L]
Time
[year/month]
2022Jan.7.128.58.431.271.410.3570.0060.246
Apr.6.935.18.671.531.870.4130.0090.740
Jul.5.118.28.040.890.950.2810.0040.204
Oct.7.341.08.272.312.160.9810.0131.012
2023Jan.7.736.78.791.462.040.6520.0080.314
Apr.7.247.98.681.901.980.6070.0120.681
Jul.5.539.48.371.140.680.1940.0070.181
Oct.7.065.38.071.822.431.1470.0150.998
2024Jan.7.632.08.621.511.740.8420.0120.372
Apr.6.947.28.481.821.370.7010.0080.593
Jul.4.526.18.180.971.181.0270.0060.167
Oct.7.574.78.352.592.351.8420.0110.847
Table 6. Salinity parameters of Abrud River at site A2 (downstream of the Roșia Montană confluence).
ParameterEC
[μS/cm]
FR
[mg/L]
Ca2+
[mg/L]
Mg2+
[mg/L]
Na+
[mg/L]
HCO3
[mg/L]
Cl
[mg/L]
SO42−
[mg/L]
Time
[year/month]
2022Jan.2942334310.37.663.410.4102.1
Apr.3742618612.79.174.311.6132.5
Jul.51431310216.311.396.016.1194.3
Oct.263179434.75.561.29.277.2
2023Jan.332231527.97.868.312.6116.4
Apr.3472467417.39.289.111.3126.8
Jul.41137413722.210.7109.815.0214.1
Oct.363262638.86.355.68.251.7
2024Jan.3842637410.07.774.110.9113.0
Apr.4733249417.89.874.311.7141.2
Jul.5623649327.410.179.713.5183.4
Oct.3181894611.18.441.09.852.3
Table 7. Toxic trace element content in the Abrud River at site A2 (downstream of the Roșia Montană confluence).
ParameterAs2+
[μg/L]
Cd2+
[μg/L]
Cototal
(Co2+ + Co3+)
[μg/L]
Crtotal (Cr3+ + Cr6+)
[μg/L]
Cu2+
[μg/L]
Fe total
[mg/L]
Mn total
[mg/L]
Ni2+
[μg/L]
Zn2+
[μg/L]
Time
[year/month]
2022Jan.0.353.686.8423.41127.311.2810.4321.68412.35
Apr.0.424.878.1425.12135.071.6715.1732.17617.22
Jul.0.478.649.6328.86187.353.0718.8448.47896.74
Oct.0.361.373.6111.58104.281.088.6718.09233.17
2023Jan.0.383.027.4517.6194.361.6912.2025.34387.19
Apr.0.413.778.7422.27125.072.4114.6439.41697.23
Jul.0.379.1411.0828.94154.084.4424.0448.30967.74
Oct.0.332.355.1215.6112.321.3212.7117.40214.78
2024Jan.0.313.627.3817.0889.701.8711.7421.77386.42
Apr.0.386.428.4228.17131.223.2414.3223.48612.37
Jul.0.477.8412.2861.74166.744.7421.7442.07814.37
Oct.0.392.473.1816.3799.711.3913.6219.42274.62
Table 8. Diatom composition and saprobic index at site A2 (Abrud River, Cărpeniș).
Scientific Name of a DiatomPopulation SizeDegree of SaprobitySaprobic Indicator Value
NormalTeratological
Planothidium lanceolatum (Brébisson ex Kützing) Lange-Bertalot 10β2
Achnanthidium minutissimum (Kützing) Czarnecki35399o-β1.5
Fragilaria vaucheriae (Kützing) J.B.Petersen 20β2
Navicula cryptocephala Kützing 20α3
Nitzschia dissipata (Kützing) Rabenhorst20o-β1.5
Total459
Saprobic index value1.22
Table 9. Physico-chemical parameters of Abrud River at site A3 (upstream of the Aries River confluence, Câmpeni).
ParameterpHTSS [mg/L]DO
[mgO/L]
BOD5 [mgO/L]COD-Cr [mgO/L]N-NH4 [mgN/L]N-NO2 [mgN/L]N-NO3 [mgN/L]
Time
[year/month]
2022Jan.7.224.48.351.371.510.3680.0070.254
Apr.7.431.38.271.681.630.4430.0110.769
Jul.5.517.98.081.121.120.3120.0070.274
Oct.7.738.38.152.342.271.1130.0161.117
2023Jan.7.931.38.531.642.210.6740.0110.427
Apr.7.645.78.441.972.170.6170.0140.719
Jul.5.832.08.241.270.840.2430.0090.227
Oct.7.358.48.041.942.671.2970.0171.098
2024Jan.7.828.88.571.631.930.8630.0140.432
Apr.7.443.18.241.921.400.7840.0110.613
Jul.5.626.28.071.271.311.0840.0090.218
Oct.7.269.58.172.622.481.9270.0140.917
Table 10. Salinity parameters of Abrud River at site A3 (upstream of the Aries River confluence, Câmpeni).
ParameterEC
[μS/cm]
FR
[mg/L]
Ca2+
[mg/L]
Mg2+
[mg/L]
Na+
[mg/L]
HCO3
[mg/L]
Cl
[mg/L]
SO42−
[mg/L]
Time
[year/month]
2022Jan.279201389.37.652.19.998.7
Apr.3562497410.28.767.911.2124.4
Jul.4872899814.110.284.415.4189.1
Oct.237156343.44.748.38.734.1
2023Jan.302197417.16.856.410.1101.5
Apr.3182126214.47.374.210.4117.9
Jul.39232810318.49.196.413.7201.5
Oct.321187495.95.941.77.942.5
2024Jan.342231598.66.961.210.1108.7
Apr.4082818111.48.167.110.7134.9
Jul.5123018721.58.773.811.8174.8
Oct.298141286.76.433.49.341.4
Table 11. Toxic trace element content in the Abrud River at site A3 (upstream of the Aries River confluence, Câmpeni).
ParameterAs2+
[μg/L]
Cd2+
[μg/L]
Cototal
(Co2+ + Co3+)
[μg/L]
Crtotal (Cr3+ + Cr6+)
[μg/L]
Cu2+
[μg/L]
Fetotal
[mg/L]
Mntotal
[mg/L]
Ni2+
[μg/L]
Zn2+
[μg/L]
Time
[year/month]
2022Jan.0.263.276.4717.8394.701.099.8719.72384.17
Apr.0.314.467.6819.71114.611.4713.4027.81547.70
Jul.0.388.129.1424.52157.142.4816.4142.71847.41
Oct.0.261.073.244.5645.780.871.248.41147.79
2023Jan.0.292.797.0416.3784.871.2710.3720.17327.18
Apr.0.323.298.1418.19104.731.8611.7132.18647.08
Jul.0.277.1410.2423.74137.373.0714.6241.83941.73
Oct.0.251.184.185.1465.170.762.387.53178.14
2024Jan.0.263.146.8715.7479.091.378.8217.86357.14
Apr.0.285.077.6320.16117.492.3410.0821.18593.41
Jul.0.396.8711.4221.31146.913.6513.4839.07796.01
Oct.0.331.322.786.3739.700.393.146.07207.78
Table 12. Diatom composition and saprobic index at site A3 (Abrud River, Câmpeni).
Scientific Name of a DiatomPopulation SizeDegree of SaprobitySaprobic Indicator Value
NormalTeratological
Achnanthidium minutissimum Kützing) Czarnecki21471o-β1.5
Planothidium lanceolatum (Brébisson ex Kützing) Lange-Bertalot 30β2
Planothidium rostratoholarcticum Lange-Bertalot & Bak10β2
Amphora pediculus (Kützing) Grunow30β2
Cocconeis pediculus Ehrenberg50β2
Cocconeis placentula Ehrenberg 40β2
Surirella librile (Ehrenberg) Ehrenberg10β-α2.5
Cymbella ventricosa Agardh170o-β1.5
Odontidium mesodon (Ehrenberg) Kützing50o1
Diatoma vulgaris Bory10β-α2.5
Eunotia exigua (Brébisson ex Kützing) Rabenhorst10β2
Fragilaria capucina Desmazières70β2
Fragilaria vaucheriae (Kützing) J.B.Petersen 130β2
Gomphonema parvulum Kützing150β2
Meridion circulare (Greville) C.Agardh30o1
Navicula capitatoradiata H.Germain ex Gasse100o-β1.5
Navicula gregaria Donkin50β2
Navicula recens (H.Lange-Bertalot) H.Lange-Bertalot10α3
Navicula tripunctata (O.F.Müller) Bory 10β-α2.5
Navicula veneta Kützing 30α3
Nitzschia dissipata (Kützing) Rabenhorst30o-β1.5
Nitzschia inconspicua Grunow20α3
Nitzschia palea (Kützing) W.Smith 60α3
Nitzschia sigmoidea (Nitzsch) W.Smith20β2
Pinnularia subcapitata f. subconstricta A.Cleve10o1
Reimeria sinuata (W.Gregory) Kociolek & Stoermer20β2
Surirella angusta Kützing 90β2
Surirella brebissonii Krammer & Lange-Bertalot190β-α2.5
Total428
Saprobic index value1.79
Table 13. Physico-chemical parameters of Valea Ștefanca River water upstream of the Arieș confluence (B).
ParameterpHTSS [mg/L]DO
[mgO/L]
BOD5 [mgO/L]COD-Cr [mgO/L]N-NH4 [mgN/L]N-NO2 [mgN/L]N-NO3 [mgN/L]
Time
[year/month]
2022Jan.7.115.49.010.694.480.0320.0070.142
Apr.7.416.88.941.185.690.0560.0090.147
Jul.7.521.88.411.868.690.0840.0110.201
Oct.7.220.48.820.894.390.0390.0050.114
2023Jan.7.324.29.170.865.210.0410.0040.118
Apr.7.625.49.041.076.280.0610.0060.214
Jul.7.932.48.221.787.960.0760.0090.368
Oct.7.227.48.690.586.240.0390.0050.120
2024Jan.7.021.48.890.486.170.0410.0060.134
Apr.7.218.98.680.796.320.0480.0080.157
Jul.7.726.88.341.288.420.0690.0100.197
Oct.7.525.68.791.185.680.0540.0.50.127
Table 14. Salinity parameters of Valea Ștefanca, upstream of the Arieș confluence (B).
ParameterEC
[μS/cm]
FR
[mg/L]
Ca2+
[mg/L]
Mg2+
[mg/L]
Na+
[mg/L]
HCO3
[mg/L]
Cl
[mg/L]
SO42−
[mg/L]
Time
[year/month]
2022Jan.267.36136.4721.429.681.2047.263.2522.1
Apr.302.14157.4832.0615.622.1465.345.2426.3
Jul.420.18215.3245.6325.643.6489.467.3635.4
Oct.324.12169.4135.2418.962.3643.803.1818.9
2023Jan.189.47126.8419.8114.391.8935.692.3929.4
Apr.294.62174.2423.6819.372.3961.144.3624.8
Jul.352.41189.7639.5731.284.9777.826.2841.5
Oct.264.20124.6228.4122.363.3136.842.8436.9
2024Jan.221.13112.3926.3716.542.1735.484.1531.2
Apr.284.63154.6336.4119.372.3652.143.9841.6
Jul.362.14241.3656.1836.244.1677.695.7954.6
Oct.203.48163.4138.2424.513.1439.613.1435.6
Table 15. Content of toxic trace elements in the water of the Valea Ștefanca River (B).
ParameterAs2+
[μg/L]
Cd2+
[μg/L]
Cototal
(Co2+ + Co3+)
[μg/L]
Crtotal (Cr3+ + Cr6+)
[μg/L]
Cu2+
[μg/L]
Fetotal
[mg/L]
Mntotal
[mg/L]
Ni2+
[μg/L]
Zn2+
[μg/L]
Time
[year/month]
2022Jan.0.280.120.610.9856.470.150.0270.5618.67
Apr.0.620.360.581.1469.470.290.0310.7532.41
Jul.1.310.840.792.46114.30.670.0561.1245.61
Oct.0.570.610.671.6977.910.340.0360.7624.87
2023Jan.0.380.340.521.4263.700.240.0240.4124.39
Apr.0.490.270.681.2574.510.370.0380.6935.69
Jul.1.640.630.873.18154.910.750.0680.8448.69
Oct.0.610.440.452.1879.190.420.0540.4734.12
2024Jan.0.410.270.611.3973.410.280.0330.3819.47
Apr.0.390.360.541.5468.490.340.0470.5732.45
Jul.0.670.740.942.94164.20.760.0940.7165.42
Oct.0.520.460.491.3989.430.610.0610.5132.14
Table 16. Diatom composition and saprobic index–Valea Șefanca (B).
Scientific Name of a DiatomPopulation SizeDegree of SaprobitySaprobic Indicator Value
NormalTeratological
Achnanthidium minutissimum (Kützing) Czarnecki23770o-β1.5
Planothidium lanceolatum (Brébisson ex Kützing) Lange-Bertalot 11612β2
Planothidium rostratoholarcticum Lange-Bertalot & Bak80β2
Cocconeis pediculus Ehrenberg273β2
Cymbella ventricosa Agardh90o-β1.5
Fragilaria capucina Desmazières30β2
Gomphonema parvulum Kützing40β2
Navicula tripunctata (O.F.Müller) Bory 20β-α2.5
Nitzschia dissipata (Kützing) Rabenhorst300o-β1.5
Nitzschia inconspicua Grunow410α3
Nitzschia sigmoidea (Nitzsch) W.Smith20β2
Reimeria sinuata (W.Gregory) Kociolek & Stoermer20β2
Surirella brebissonii Krammer & Lange-Bertalot10β-α2.5
Total567
Saprobic index value1.58
Table 17. Physico-chemical parameters of the Valea Sesei River water, upstream of the Arieș confluence (C).
ParameterpHTSS [mg/L]DO
[mgO/L]
BOD5 [mgO/L]COD-Cr [mgO/L]N-NH4 [mgN/L]N-NO2 [mgN/L]N-NO3 [mgN/L]
Time
[year/month]
2022Jan.4.811310.53.1242.70.1520.0210.072
Apr.6.81499.11.5123.80.1840.0040.401
Jul.7.11278.30.9835.70.7660.0461.354
Oct.7.415410.20.8529.40.8410.0060.304
2023Jan.5.4969.82.4135.70.1870.0140.068
Apr.7.11249.21.8728.10.1240.0080.425
Jul.6.91398.41.0542.10.3540.0350.847
Oct.6.81509.70.9838.40.3470.0140.405
2024Jan.5.51248.92.1423.50.1270.0340.061
Apr.6.11899.41.7429.40.3670.0080.352
Jul.6.61438.70.7642.10.4240.0570.874
Oct.7.21069.70.9638.70.2040.0250.632
Table 18. Salinity parameters of the Valea Sesei River, upstream of the Arieș confluence (C).
ParameterEC
[μS/cm]
FR
[mg/L]
Ca2+
[mg/L]
Mg2+
[mg/L]
Na+
[mg/L]
HCO3
[mg/L]
Cl
[mg/L]
SO42−
[mg/L]
Time
[year/month]
2022Jan.1544569221.44.115.6224.017.32642
Apr.1478657175.25.644.5832.415.78547
Jul.2541847552.15.848.6442.722.34614
Oct.1875724153.92.327.3224.823.72487
2023Jan.1237473178.23.574.1227.424.7514
Apr.1289541201.75.386.1441.518.7624
Jul.2647947698.36.237.4848.129.4704
Oct.1672842234.13.043.8135.221.7618
2024Jan.1617652245.14.013.3918.722.3446
Apr.1784784204.74.494.3234.827.2524
Jul.2631961618.26.015.2747.831.2716
Oct.1327637235.44.084.3831.431.1527
Table 19. The content of toxic trace elements in the water of the Valea Sesei River (C).
ParameterAs2+
[μg/L]
Cd2+
[μg/L]
Cototal
(Co2+ + Co3+)
[μg/L]
Crtotal (Cr3+ + Cr6+)
[μg/L]
Cu2+
[μg/L]
Fetotal
[mg/L]
Mntotal
[mg/L]
Ni2+
[μg/L]
Zn2+
[μg/L]
Time
[year/month]
2022Jan.0.7434.0142.172.372147.143.571.07424.091587.24
Apr.0.4941.6938.743.603241.364.691.23026.842145.21
Jul.1.0251.3454.785.424162.306.722.41742.873542.17
Oct.0.7438.7142.584.381897.414.291.68736.012476.27
2023Jan.0.4528.4739.411.891874.352.891.33931.742017.31
Apr.0.5838.4449.522.382267.093.671.87641.582417.39
Jul.0.7948.7151.075.073124.217.612.47249.373247.07
Oct.0.6832.4735.143.171567.415.141.96128.632107.28
2024Jan.0.5721.4128.742.092146.383.690.94324.181637.28
Apr.0.6128.9729.673.192643.784.181.57829.471897.34
Jul.0.7435.6444.264.622894.206.813.21437.192463.18
Oct.0.6129.3735.263.471897.355.742.10524.091894.28
Table 20. Diatom composition and saprobic index at site C (Valea Șesei River).
Scientific Name of a DiatomPopulation SizeDegree of SaprobitySaprobic Indicator Value
NormalTeratological
Achnanthidium minutissimum (Kützing) Czarnecki23688o-β1.5
Fragilaria capucina Desmazières60β2
Nitzschia palea (Kützing) W. Smith20α3
Total332
Saprobic index value1.21
Table 21. Physico-chemical parameters of the Valea Sărtaș River water, upstream of the Arieș confluence (D).
ParameterpHTSS [mg/L]DO
[mgO/L]
BOD5 [mgO/L]COD-Cr [mgO/L]N-NH4 [mgN/L]N-NO2 [mgN/L]N-NO3 [mgN/L]
Time
[year/month]
2022Jan.7.413.39.640.874.640.0030.0010.093
Apr.7.619.49.420.946.570.0070.0030.128
Jul.7.135.68.941.089.820.0160.0090.232
Oct.7.321.49.140.746.330.0110.0050.186
2023Jan.7.616.39.610.695.630.0060.0040.105
Apr.7.521.29.230.817.760.0090.0020.134
Jul.7.241.59.011.1710.220.0130.0110.327
Oct.7.532.19.340.847.510.0080.0060.214
2024Jan.7.517.39.770.545.100.0040.0020.131
Apr.7.621.79.610.696.610.0060.0060.164
Jul.7.038.99.040.978.640.0190.0140.245
Oct.7.331.49.340.625.340.0050.0080.171
Table 22. Salinity parameters of the Valea Sărtaș River, upstream of the Arieș confluence (D).
ParameterEC
[μS/cm]
FR
[mg/L]
Ca2+
[mg/L]
Mg2+
[mg/L]
Na+
[mg/L]
HCO3
[mg/L]
Cl
[mg/L]
SO42−
[mg/L]
Time
[year/month]
2022Jan.214.31134.716.15.13.581.26.128.6
Apr.236.87231.021.36.24.594.17.636.7
Jul.297.06324.236.514.88.7135.711.649.2
Oct.187.01142.628.78.96.289.79.424.3
2023Jan.196.30156.319.47.44.191.66.831.5
Apr.212.42189.427.66.85.688.68.742.9
Jul.234.58268.245.89.89.4143.814.657.8
Oct.204.13163.921.67.13.877.37.933.4
2024Jan.223.30162.518.36.34.479.67.231.7
Apr.247.98198.122.58.16.3102.38.641.6
Jul.256.43284.441.411.78.4144.615.756.1
Oct.228.96202.333.29.65.774.311.228.3
Table 23. The content of toxic trace elements in the water of the Valea Sărtaș River (D).
ParameterAs2+
[μg/L]
Cd2+
[μg/L]
Cototal
(Co2+ + Co3+)
[μg/L]
Crtotal (Cr3+ + Cr6+)
[μg/L]
Cu2+
[μg/L]
Fetotal
[mg/L]
Mntotal
[mg/L]
Ni2+
[μg/L]
Zn2+
[μg/L]
Time
[year/month]
2022Jan.0.350.120.180.2412.410.0210.0250.4921.47
Apr.0.410.240.360.3118.630.0340.0370.6834.65
Jul.0.740.550.840.8435.100.0580.0441.1354.64
Oct.0.440.410.520.4222.420.0250.0320.7428.30
2023Jan.0.431.180.230.3313.470.0190.0190.5618.94
Apr.0.480.270.440.4721.460.0270.0280.7724.68
Jul.0.570.661.121.1339.420.0440.0331.3446.37
Oct.0.390.320.670.6531.220.0260.0240.7128.71
2024Jan.0.530.180.330.3618.430.0170.0210.6223.42
Apr.0.460.270.420.5824.690.0280.0330.8633.44
Jul.0.780.780.841.3438.440.0630.0461.4561.42
Oct.0.470.410.500.6124.810.0300.0220.6042.13
Table 24. Diatom composition and saprobic index of the Șartăș River (D).
Scientific Name of a DiatomPopulation SizeDegree of SaprobitySaprobic Indicator Value
NormalTeratological
Achnanthidium minutissimum Kützing) Czarnecki25661o-β1.5
Navicula cryptocephala Kützing 260α3
Fragilaria vaucheriae (Kützing) J.B.Petersen 210β2
Planothidium lanceolatum (Brébisson ex Kützing) Lange-Bertalot 140β2
Amphora pediculus (Kützing) Grunow110β2
Gomphonella olivacea (Hornemann) Rabenhorst 80β2
Cocconeis pediculus Ehrenberg70β2
Nitzschia dissipata (Kützing) Rabenhorst70o-β1.5
Nitzschia inconspicua Grunow60α3
Navicula lanceolata Ehrenberg50α3
Cymbella ventricosa Agardh 40o-β1.5
Navicula tripunctata (O.F.Müller) Bory 30β-α2.5
Nitzschia sigmoidea (Nitzsch) W.Smith30β2
Rhoicosphenia curvata (Kützing) Grunow 30β2
Surirella brebissonii Krammer & Lange-Bertalot30β-α2.5
Odontidium mesodon (Ehrenberg) Kützing20o1
Surirella angusta Kützing20β2
Nitzschia palea (Kützing) W.Smith 10α3
Total443
Saprobic index value1.86
Disclaimer/Publisher’s Note: The statements, opinions and data contained in all publications are solely those of the individual author(s) and contributor(s) and not of MDPI and/or the editor(s). MDPI and/or the editor(s) disclaim responsibility for any injury to people or property resulting from any ideas, methods, instructions or products referred to in the content.