Article

Hydrothermal Versus Physical Mixing: Superior Photocatalytic Activity of TiO2/WO3 Nanocomposites for Water Treatment Applications

by
Mabrouka Ghiloufi
1,2,
Tobias Schnabel
3,*,
Christian Springer
4,
Simon Mehling
3,
Axel Wolfram
3,
Fathi Touati
2 and
Salah Kouass
1,2
1
Faculty of Sciences of Bizerte, Carthage University, Tunis 1054, Tunisia
2
Laboratory of Materials: Treatment and Analysis (LMTA), National Institute of Research and Analysis Physicochemical (INRAP), Ariana 2020, Tunisia
3
Research Group “Photonics and Water”, Institute for Sustainable Water Systems, Hof University of Applied Sciences, 95028 Hof, Germany
4
Urban Water Management and Environmental Technology, Erfurt University of Applied Science, 99085 Erfurt, Germany
*
Author to whom correspondence should be addressed.
Environments 2025, 12(10), 359; https://doi.org/10.3390/environments12100359
Submission received: 5 September 2025 / Revised: 1 October 2025 / Accepted: 2 October 2025 / Published: 5 October 2025
(This article belongs to the Special Issue Research Progress in Groundwater Contamination and Treatment)

Abstract

The photocatalytic efficiency of TiO2 was significantly enhanced by coupling with WO3 to form a TiO2/WO3 heterostructure, designed to operate effectively under UV-LED irradiation. The nanocomposites were synthesized via a hydrothermal route, and their activity was evaluated through the degradation of the pharmaceutical pollutant venlafaxine. Contaminants are rarely addressed in photocatalytic studies. Unlike a simple physical mixture of commercial TiO2 and WO3 powders, the hydrothermally synthesized TiO2/WO3 photocatalyst exhibited superior efficiency, attributable to its nanoscale dimensions achieved via the hydrothermal route, which promoted improved charge carrier separation, enhanced surface homogeneity, and the formation of an effective heterojunction interface. An optimization study varying the WO3 content (5, 10, 20, and 30 wt.%) within the TiO2 revealed that the 10 wt.% WO3 composition achieved the highest performance, with ~52% venlafaxine degradation within 60 min. SEM, TEM, FTIR, Raman spectroscopy, XRD, and UV-Vis DRS revealed the successful incorporation of WO3 into the TiO2 matrix, confirming phase purity and composition-dependent structural evolution of the nanocomposite, and evidencing extended light absorption and superior charge-transfer properties. Importantly, the optimized photocatalyst thin film retained excellent stability and reusability, maintaining high degradation efficiency over three consecutive cycles with negligible activity loss, which avoids slurry separation. These findings establish hydrothermally synthesized TiO2/10%WO3 thin film heterostructures as effective and sustainable photocatalytic platforms for the removal of pharmaceutical pollutants in wastewater under UV-LED irradiation.

1. Introduction

Water pollution has emerged as one of the most serious environmental challenges of the 21st century, largely driven by rapid urbanization, industrialization, and the overutilization of synthetic organic chemicals. Among the different classes of pollutants, pharmaceutical residues are of increasing concern owing to their continuous release into the environment via domestic, hospital, and industrial effluents. Classified as emerging pollutants, they are capable of exerting long-term ecological and health effects, even at low concentrations, and are not effectively eliminated by conventional groundwater purification methods [1,2,3]. Pharmaceuticals, such as anti-inflammatories, antibiotics, and antidepressants, are designed to be biologically active and stable, which makes them resistant to the natural degradation processes. Their presence in aquatic environments has been widely documented. One such compound is venlafaxine (Venla), a serotonin-norepinephrine reuptake inhibitor (SNRI) used extensively for the treatment of depression and anxiety disorders. Due to its widespread use, high water solubility, and poor biodegradability, Venla is frequently detected in surface waters, groundwater, and even drinking water supplies [3,4,5]. Researchers have reported its presence at different concentrations ranging from ng/L to several µg/L, raising serious concerns about its long-term ecotoxicological impacts, including behavioral and reproductive disorders in aquatic organisms [6].
The inefficiency of conventional groundwater purification in removing Venla and other micropollutants necessitates the use of more effective and advanced treatment methods [7,8]. Among these, heterogeneous photocatalysis has generated significant attention as a green and sustainable process capable of degrading a wide spectrum of organic pollutants into non-toxic end products (CO2 and H2O) [9,10,11]. Upon light irradiation, the semiconductor photocatalyst is photoexcited, generating electron–hole pairs. The photogenerated electrons can react with dissolved oxygen to produce reactive species such as superoxide radicals (O2·), while holes in the valence band can directly oxidize organic molecules or react with surface-adsorbed water to form hydroxyl radicals (HO·). These reactive species, together with direct hole oxidation, act synergistically to attack and degrade the organic pollutants. Titanium dioxide (TiO2) is widely recognized as a highly active photocatalyst and is frequently employed as a benchmark for evaluating the performance of emerging photocatalysts due to its chemical stability, reduced cost, non-toxicity, and strong oxidative power. TiO2 has two major disadvantages: its wide band gap (3.2 eV), which restricts activation to UV light, and the high electron–hole recombination rate, thus limiting its quantum efficiency [12,13,14]. To overcome these limitations, heterojunction engineering has been proposed as an improved method for boosting photocatalytic activity. Associating TiO2 with a suitable narrow band gap semiconductor, such as tungsten trioxide (WO3), has shown promising results. WO3, with a band gap of 2.6–2.8 eV, is photoactive under UV and near visible light (440–480 nm), and can act as an effective electron acceptor co-coupled with TiO2. The formation of TiO2/WO3 heterojunction facilitates spatial separation of charge carriers, prolongs their lifetime, and enhances the generation of reactive species [15,16]. Furthermore, WO3 possesses high chemical stability and good compatibility with TiO2, making the nanocomposite a promising candidate for photocatalytic applications.
In addition to material optimization, the choice of the light source plays a crucial role in the efficiency and sustainability of the photocatalytic process. Traditional UV mercury lamps are energy-intensive and environmentally hazardous due to mercury content. In contrast, UV-A light-emitting diodes (LEDs) offer several advantages, including low energy consumption, long operational life, low heat generation, and wavelength specificity, with a narrow spectral band near 365 nm. These features make LEDs more suitable for practical, scalable photocatalytic systems for water purification applications [17,18].
Given this context, the present study focuses on the photocatalytic degradation of Venla using TiO2/WO3 thin film under LED365 irradiation, with a particular emphasis on ecological applications. It explores how the preparation method of the photocatalyst, specifically hydrothermal synthesis versus physical mixing, significantly influences its photocatalytic efficiency. Furthermore, the systematic variation of WO3 loading provides new insights into the optimal composition required for enhanced activity. To strengthen this understanding, a comprehensive set of characterization techniques (Raman spectroscopy, FTIR, SEM, and UV-Vis spectroscopy) was employed to establish a clear correlation between the structural features, morphological properties, and photocatalytic performance.

2. Materials and Methods

2.1. Materials

The precursors employed in this study were titanium dioxide (TiO2 Aeroxide® P25, Evonik industries AG, Essen, Germany), tungsten (VI) oxide (WO3, Sigma Aldrich, St. Louis, MO, USA), sodium tungstate dihydrate (Na2WO4·2H2O, Loba Chemie, Mumbai, India, 99, hydrochloric acid (HCl, Carl Roth, Karlsruhe, Germany), deionized water, isopropanol (C3H8O, Chem solute, Renningen, Germany), acetylacetone (C5H8O2, Carl Roth, Karlsruhe, Germany), nitric acid (HNO3, Carl Roth, Karlsruhe, Germany), titanium isopropoxide (Ti(O-iPr)4, Sigma Aldrich, St. Louis, MO, USA), and polyethylene glycol (PEG, Sigma Aldrich, Overijse, Belgium).

2.2. Synthesis of Nanocomposites

In this study, two sorts of nanocomposites will be treated as photocatalysts and will be compared with an unmodified sample of nano-TiO2. Nano-TiO2 P25 was used as the reference photocatalyst. P25 consists of 70–80% anatase and 20–30% rutile, and its mixed-phase composition provides higher photocatalytic activity compared to pure anatase, owing to the synergistic interaction between the two crystalline phases [19]. The first type of nanocomposite was achieved by mixing two commercial oxides (C.O), TiO2 and WO3, through simple physical mixture. The oxides were ground using a clean mortar and a pestle for 30 min. The second sort of nanocomposite preparation will be based on synthesized oxides (S.O) by the hydrothermal method. The TiO2/WO3 nanocomposites with different WO3 loading (5, 10, 20, and 30%) values were synthesized using 0.3 g of TiO2 as the base and Na2WO4·2H2O as the tungsten source. In a typical preparation, the required stoichiometric amount of Na2WO4·2H2O corresponding to the desired WO3 percentages was dissolved in 20 mL of deionized water under continuous magnetic stirring (300 rpm) for 30 min. The pH of the solution was carefully adjusted by the dropwise addition of a concentrated HCl (1 M) until the pH reached 2, thereby promoting the formation of WO3 species. Subsequently, the predetermined amount of P25 TiO2 powder was dispersed into the mixture under vigorous stirring (500 rpm) for one hour to ensure homogeneous mixing and intimate contact between TiO2 and WO3 precursors. The resulting suspension was transferred into a 45 mL Teflon-lined stainless-steel autoclave and subjected to hydrothermal treatment at 150 °C and autogenous pressure for 12 h. After cooling to room temperature, the solid products were washed with deionized water and ethanol to remove residual ions, and then dried at 100 °C for 3 h. The as-prepared nanocomposites, denoted as TiO2/x%WO3 (x = 5, 10, 20, and 30%), were subsequently stored for further physicochemical and photocatalytic characterization.

2.3. Preparation of Thin Film

All the thin films were deposited onto square fluorine-doped tin oxide (FTO) glass substrates with the same thickness (5 cm × 5 cm, 3 mm thick, Sigma Aldrich). As a first step, a base solution was prepared via the sol–gel route. Initially, the deionized water was placed in a beaker under magnetic stirring (300 rpm) and mixed with isopropanol. Subsequently, acetylacetone was introduced and stirred for 5 min, followed by acidification with nitric acid. The mixture was stirred further before increasing the speed to 500 rpm, at which point titanium isopropoxide was added dropwise. The resulting solution was stirred for 2 h at ambient temperature until it had a transparent yellow appearance. The precise sequence of addition was essential to ensure controlled hydrolysis and to avoid premature precipitation.
As a second step, for each sample, 1 mL of the base sol–gel solution was mixed with 0.1 g of the prepared nanocomposites in a reactor under magnetic stirring for 1 h/300 rpm. Afterwards, the mixture was placed in an ultrasonic bath. Then, 0.25 mL of polyethylene glycol, 0.5 mL of 2-propanol, and 0.2 mL of acetylacetone were added sequentially to the reactor, ensuring that the components were added in the correct order. The coagulated mixture was coated on the surface of FTO glass to enable heating in an oven at 300 °C for 2 h.

2.4. Experimental Setup and Procedure

The experimental reactor was specifically designed to enable measurements of pollutant degradation. The unit consists of a 145 mL reactor vessel, in which the photocatalyst coated onto FTO glass was mounted on one side, oriented towards the interior. A magnetic stirrer was integrated at the base of the vessel to ensure effective turbulence. Illumination is provided by an LED array comprising nine UV-A diodes (365 nm, 1 W, Seoul, Republic of Korea, CUN66A1B). The array is positioned parallel to the catalyst at a distance of 5.8 cm, allowing the radiation to pass through the FTO substrate and reach the photocatalyst surface.
For the investigation of the photocatalytic performance of the nanocomposites, Venla was chosen as a pharmaceutical pollutant. The UV-Vis measurements were performed with Mettler Toledo UV5 Bio (Gießen, Germany) at 365 nm. The photocatalytic degradation generates reactive species that break down organic pollutants into less harmful substances like CO2 and H2O.
Photocatalyst (HO·/O2·) + pollutant → CO2 + H2O
This reaction involves the excitation of electrons, formation of electron–hole pairs, and subsequent redox reactions with the pollutant. The degradation efficiency is calculated using the equation:
Degradation   ( % )   = ( C 0 C t C 0 ) × 100
where C 0 is the initial concentration, C t   is the concentration at time t.
Assuming that the photocatalytic degradation of Venla follows a first-order kinetic model, the reaction can be described by the following equation:
r = d C d t   and   ln C c 0 = K t
In the expression, r represents the reaction rate, C is the concentration of contaminant at a given irradiation time t (min), C0 is the initial concentration (mg/L), K is the rate constant (min−1), and t is the irradiation duration.
The structural, morphological, and optical properties of the synthesized samples were characterized using Fourier-transform infrared spectroscopy (FTIR) (PerkinElmer FT-IR spectrometer, Castries, France, L 160000A Spectrum Two, 2.5 µm to 25 µm, LiTaO3 detector), Raman spectroscopy (Thunder Optics Gurzil Raman Microscope TO-RM-S-785 nm, Montpellier, France), Energy-Dispersive X-Ray Spectroscopy (EDX) (QUANTAX Brucker, Berlin, Germany), Scanning Electron Microscopy (SEM) (Coxem Tabletop EM-30N, Daejeon, Republic of Korea, Tungsten filament (W), detector SE and BSE), Transmission Electron Microscopy (TEM/HRTEM) and Selected Area Electron Diffraction (SAED) were performed using the same instrument (Tecnai G2 20, FEI Company, Hillsboro, OR, USA, LaB6 filament, 200 kV), The crystal structure was examined by the powder X-ray diffraction (XRD)(Bruker AXS GmbH, Karlsruhe, Germany, CuK radiation (k1/4 1.54056Å) and a graphitic monochromator), and Diffuse reflectance spectroscopy (DRS) (PerkinElmer UV-Vis spectrometer (OPDI.MA, ODM98) Castries, France, 250–1100 nm, BaSO4).

2.5. Analytical Method

The calibration curve of Venla is presented in Figure 1. It exhibits a characteristic absorption band in the UV region, with maximum absorbance around 225–230 nm. Venla was established over a concentration range of 1–30 mg/L, showing a strong linear relationship between absorbance and concentration. The correlation coefficient (R2) confirmed excellent linearity, ensuring the accuracy and reliability of quantitative analysis.

3. Results and Discussion

3.1. Characterization of Nanocomposites

3.1.1. Fourier Transform Infrared Spectroscopy (FTIR)

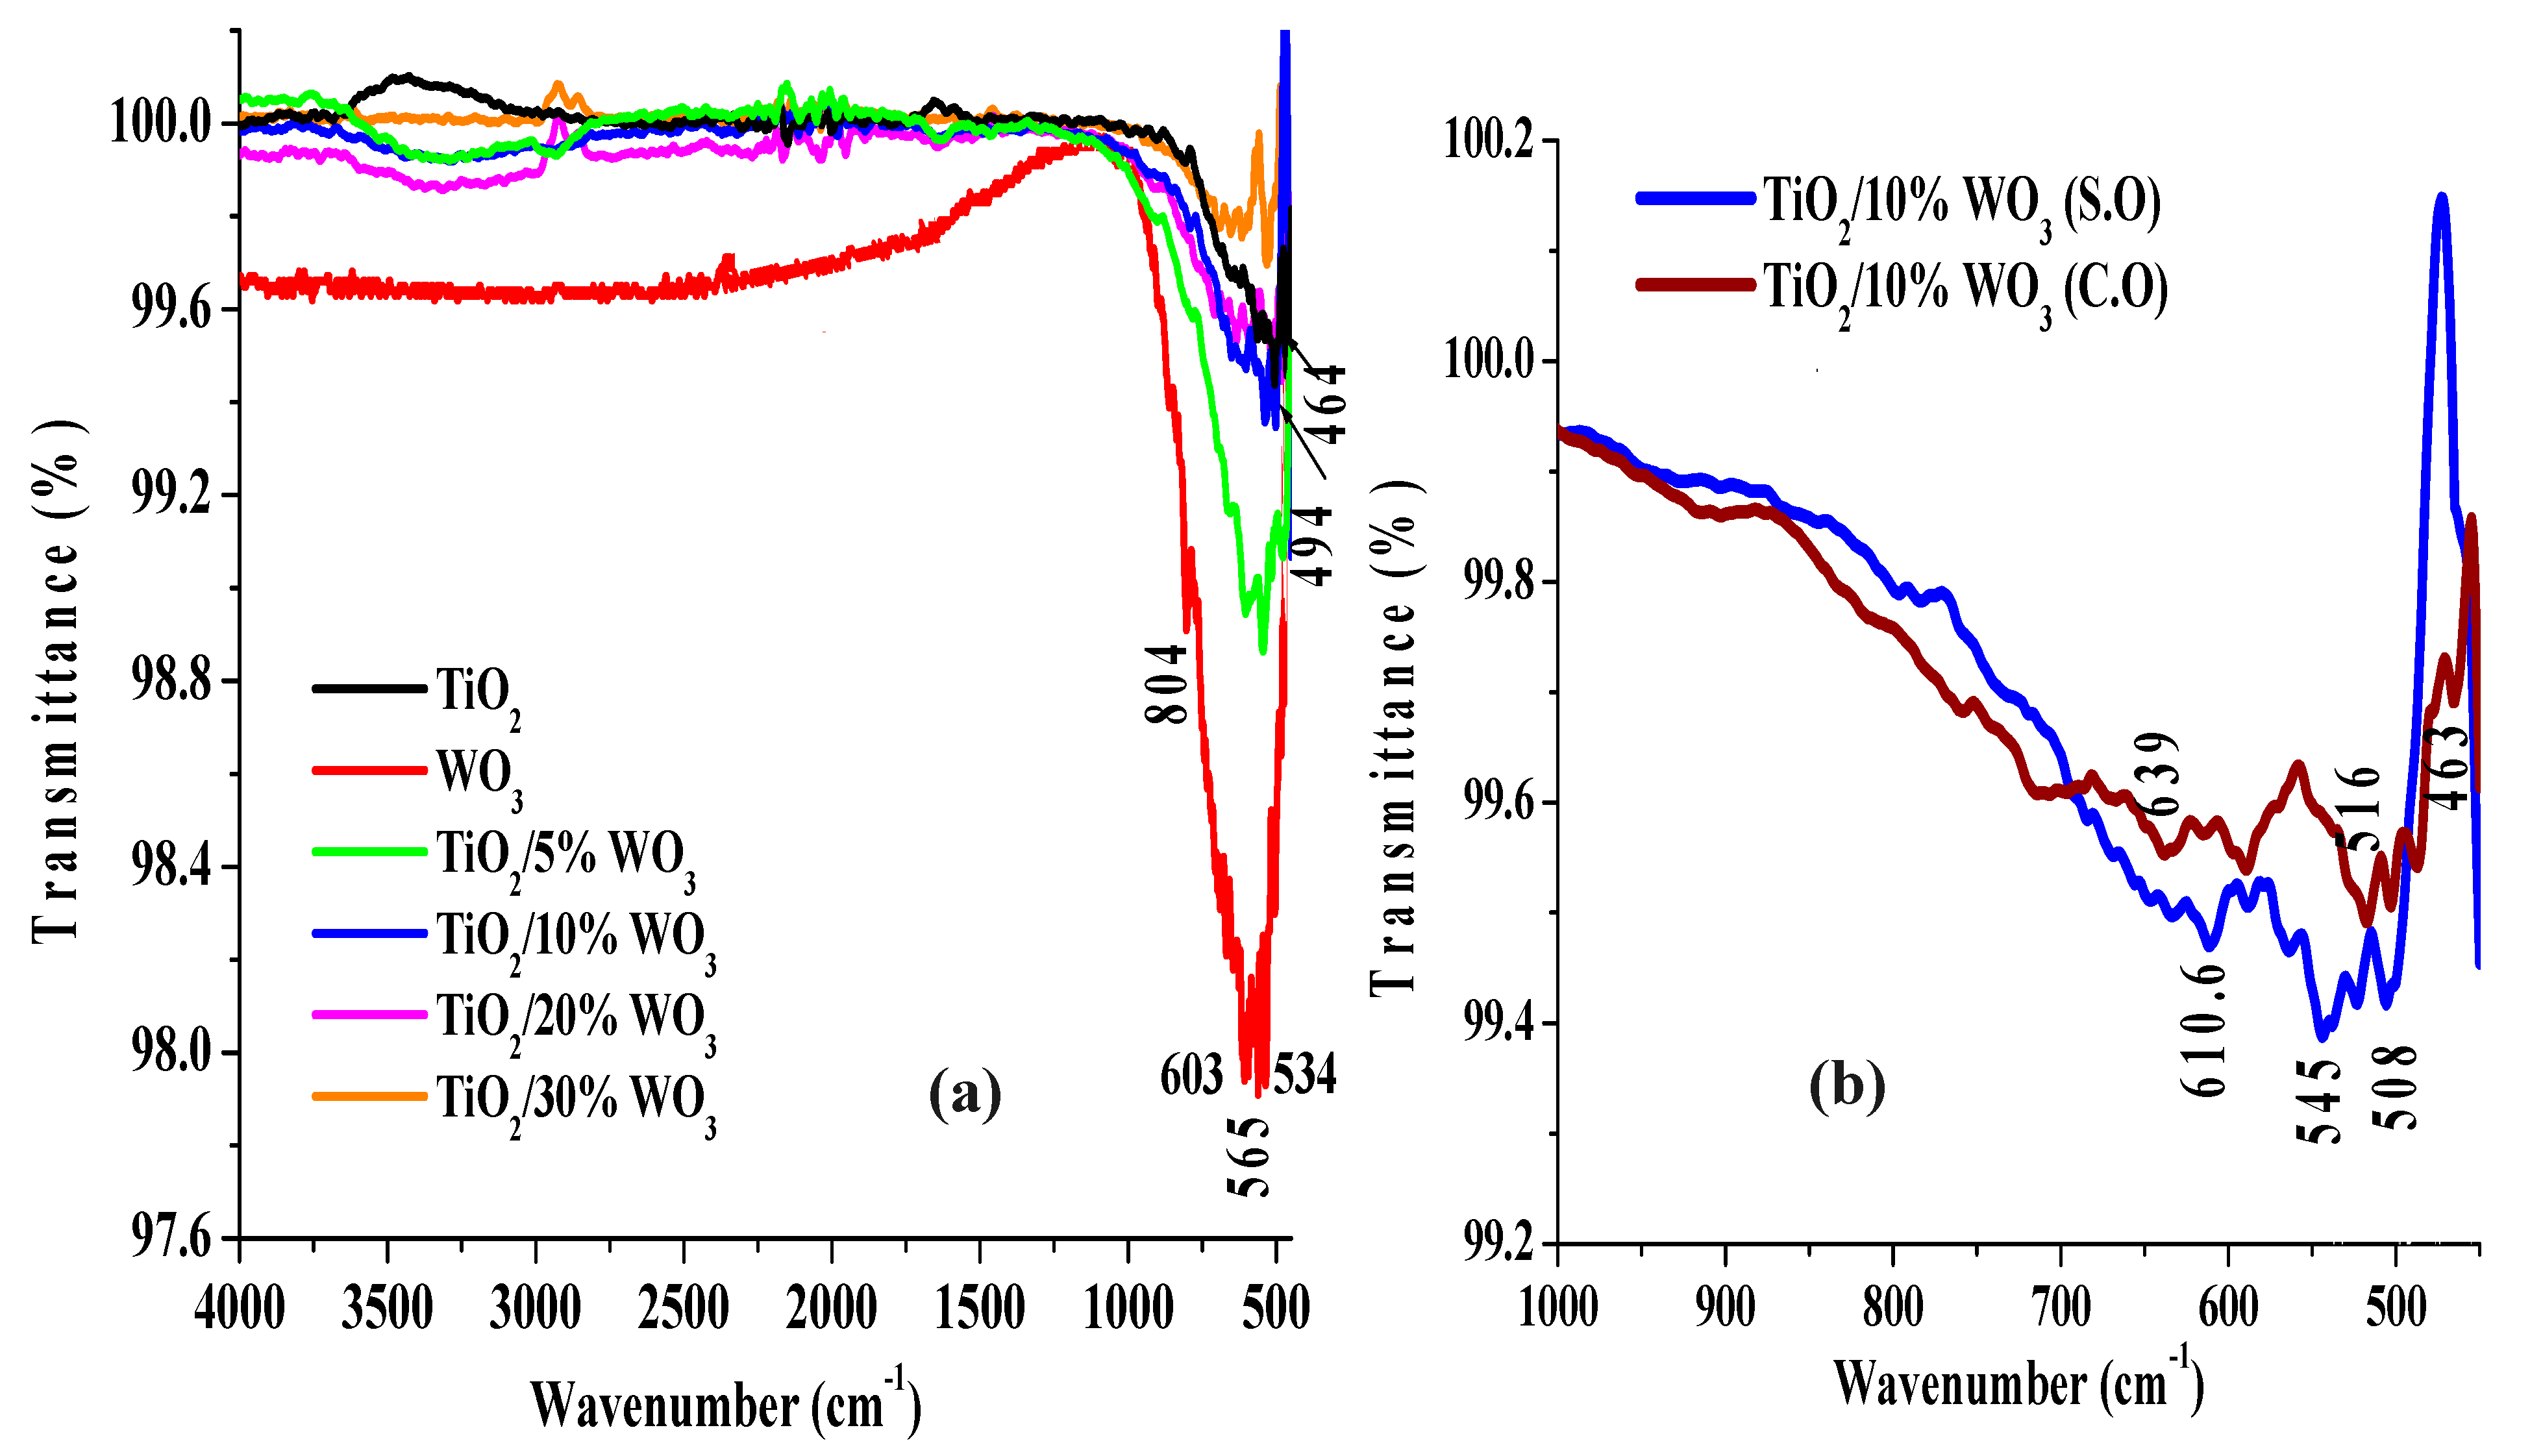
FTIR spectroscopy (Figure 2a) was employed to investigate the structural and vibrational features of the synthesized TiO2/WO3 nanocomposites with varying WO3 loadings (5, 10, 20, and 30 wt.%). Spectra of commercial TiO2 and WO3 were used as reference materials. The TiO2 spectrum displays a prominent absorption band between 450 and 700 cm−1, attributed to Ti-O stretching vibrations. This feature was also present in the nanocomposites, though progressively shifted and reduced in intensity with increasing WO3 content, suggesting modifications to the Ti-O bonding environment. Pure WO3 showed characteristic bands at 507–610 cm−1, corresponding to W-O bending vibrations, and at 804 cm−1 assigned to W-O-W bridging vibrations within WO6 octahedra. These peaks also appeared in nanocomposites, albeit slightly displaced, which may indicate partial structural interaction or distortion of WO3 within the TiO2 matrix. Additional weak bands observed in the 1800–2200 cm−1 region were assigned to C=O stretching, most likely arising from adventitious carbonates or atmospheric CO2 incorporated during synthesis or measurement. A broad absorption band between 3000 and 3600 cm−1, characteristic of O-H stretching, was detected in all samples and is commonly associated with surface hydroxyl groups or absorbed water, particularly in nanocomposites prepared by hydrothermal routes [20].
To assess the influence of the synthesis route, the FTIR spectrum of the TiO2/10%WO3 (S.O) nanocomposite was compared with TiO2/10%WO3 (C.O) in Figure 2b. The hydrothermal sample exhibited subtle shifts in the Ti-O (450–700 cm−1) and W-O (507–610 cm−1) vibrational bands, together with sharper and more intense absorption features. The spectral changes suggest a stronger interaction between TiO2 and WO3, most likely through the formation of Ti-O-W linkages. Such structural modifications are indicative of improved incorporation of WO3 within the TiO2 and WO3 framework and may account for the enhanced photocatalytic performance observed in hydrothermally prepared samples.

3.1.2. X-Ray Diffraction of Synthesized TiO2/WO3 Nanocomposites

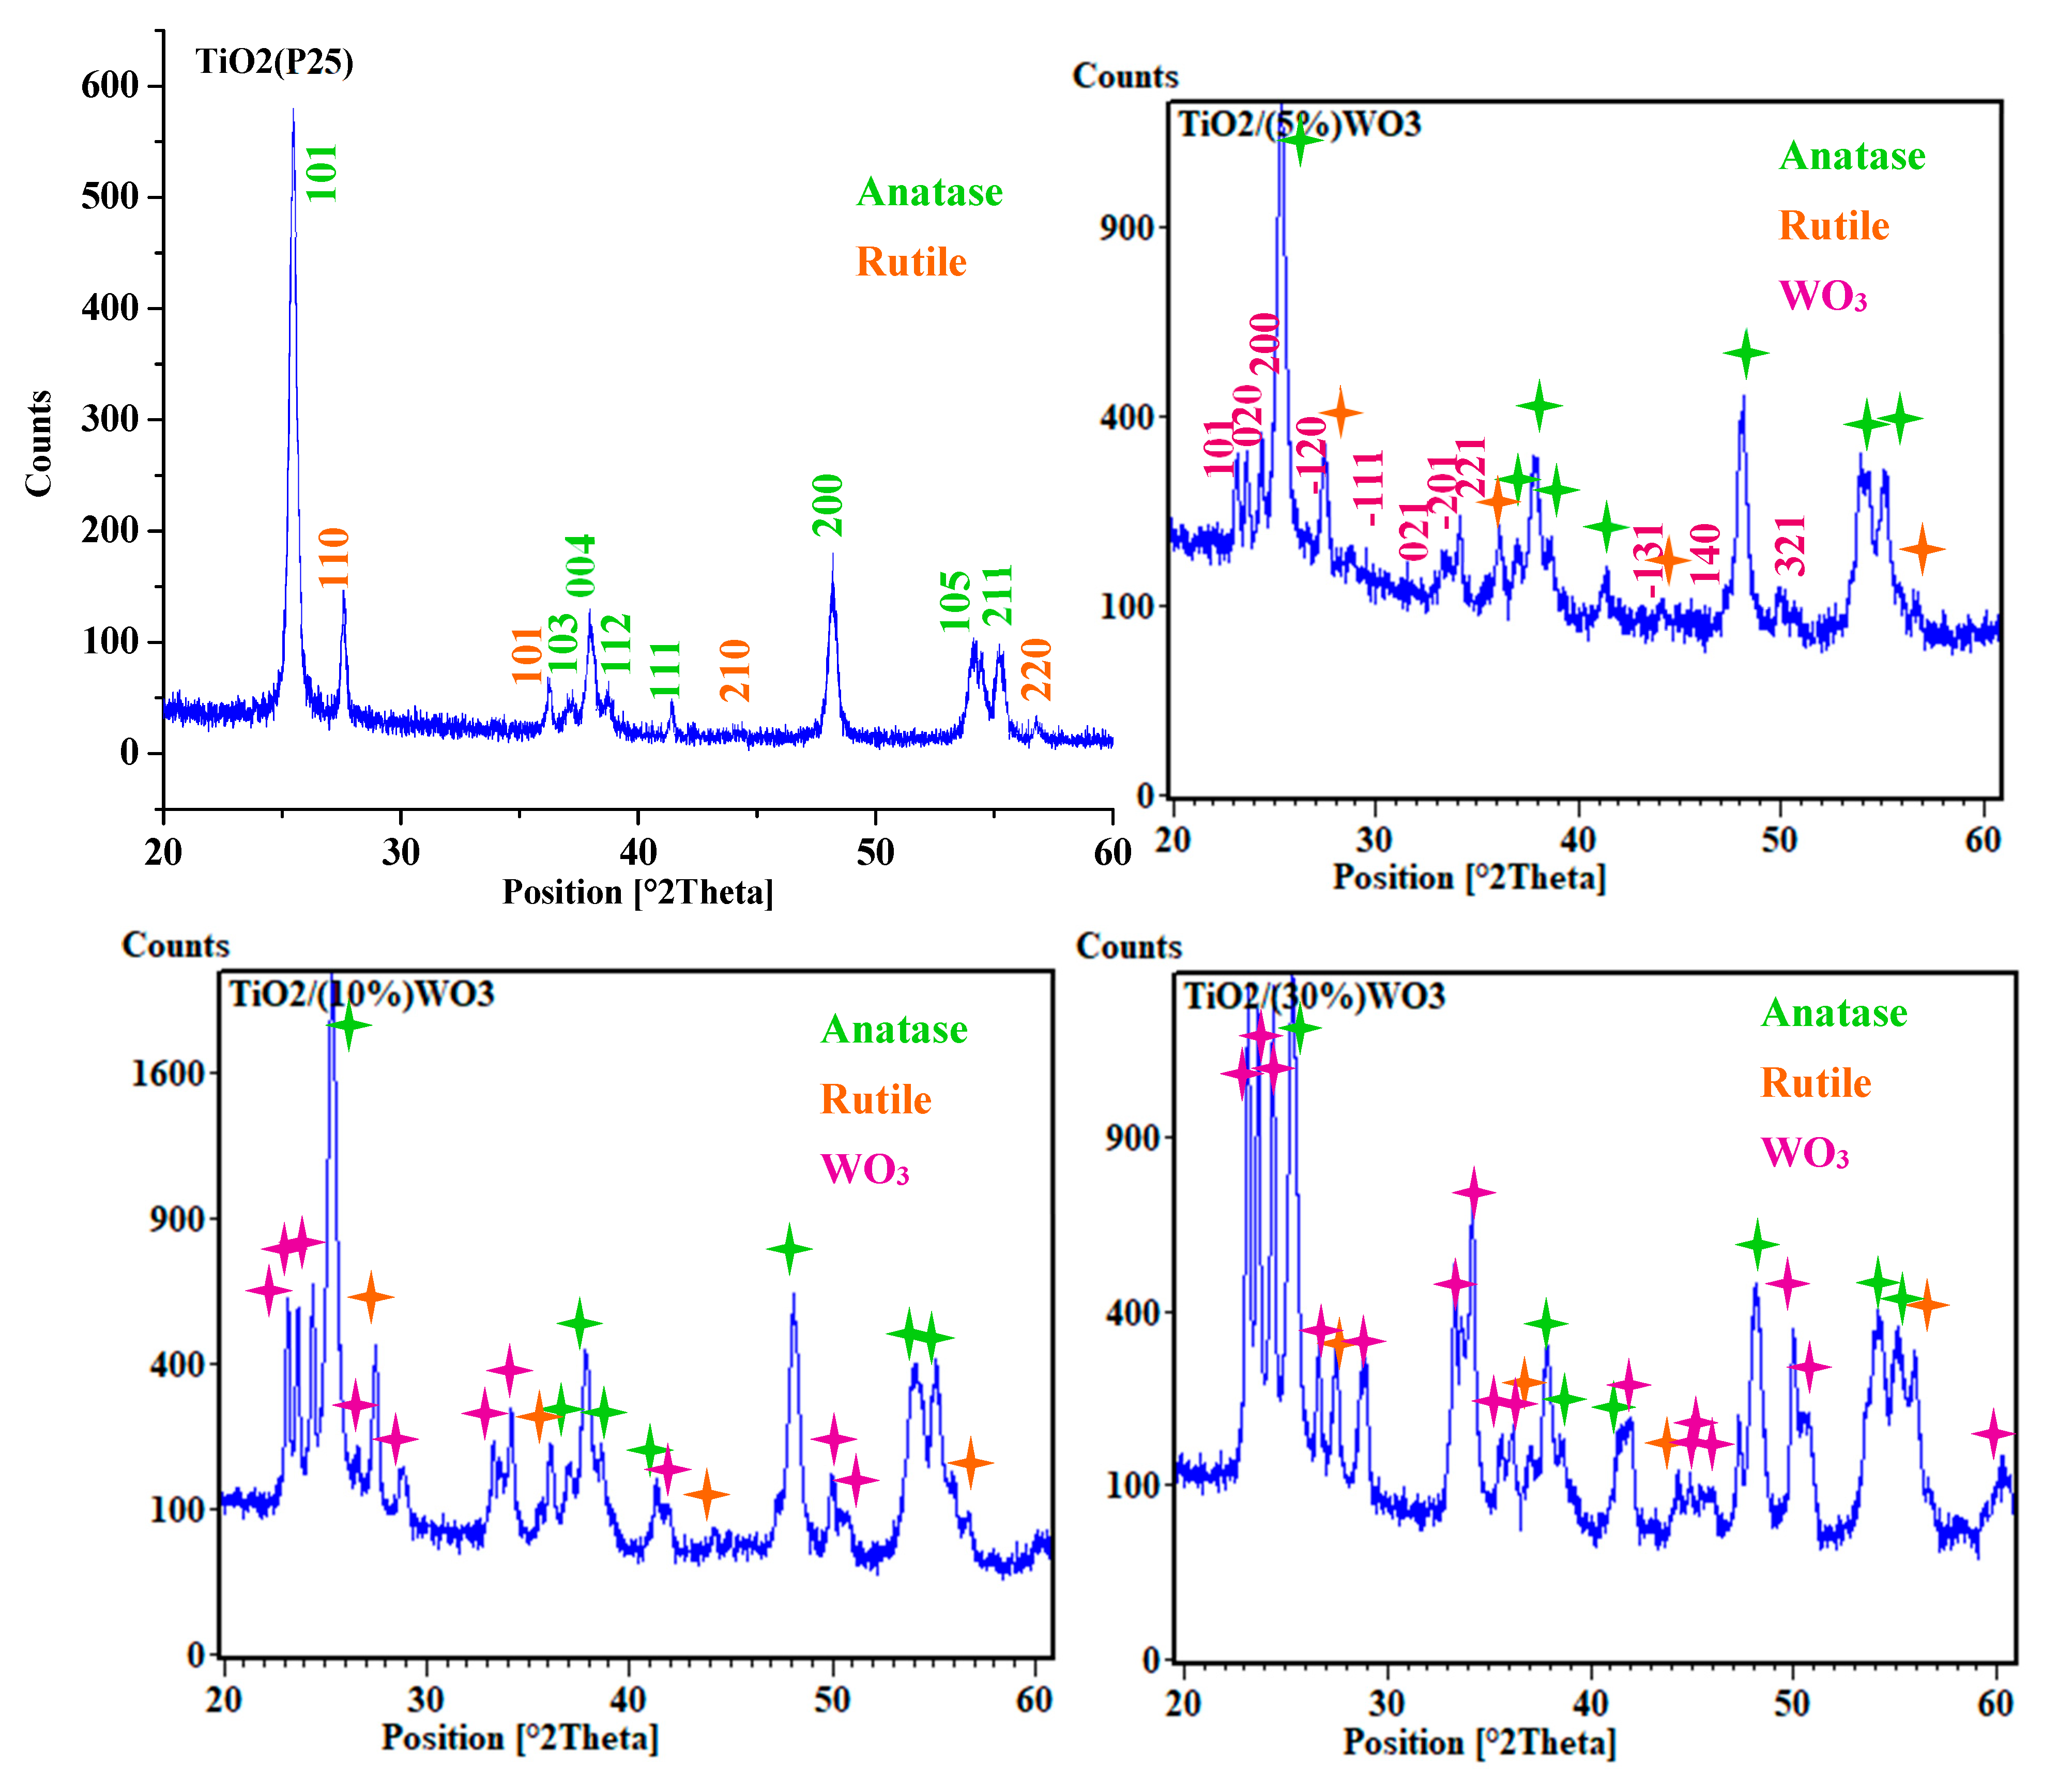
XRD analyses were conducted to examine the crystalline phases present in the prepared nanocomposites with varying WO3 loadings. The diffraction pattern of pure TiO2 confirms predominant crystallization in the anatase phase, with characteristic reflections at 2θ = 26.4°, 38.4°, and 48°, corresponding to the (101), (004), and (200) planes, respectively, in agreement with JCPDS card No. 88–1175. Additional peaks attributable to the rutile phase of TiO2 (space group P42/mmm) were also detected, assigned to the (110), (101), (111), (210), and (220) planes (Figure 3). For WO3, diffraction peaks characteristic for the monoclinic crystalline phase were identified, corresponding to the (001), (020), and (200) planes. The XRD diffractograms of the TiO2/WO3 nanocomposites reveal the coexistence of TiO2 and WO3 phases, with no evidence of secondary phases or impurities, confirming the high purity of the synthesized nanomaterials. Moreover, the progressive increase in WO3 content from 5% to 30% leads to a corresponding intensification of the WO3 diffraction peaks, demonstrating the successful incorporation of WO3 and its compositional influence on the crystallographic features of the nanocomposites.

3.1.3. Raman Spectroscopy

Raman spectroscopy was used in this study to probe the structural properties and interfacial interactions within TiO2/10%WO3 thin film. The Raman-active modes characteristic of anatase are well-defined in the spectra of Figure 4, including a symmetric bending vibration at 399 cm−1 (B1g), and an antisymmetric bending mode around 516 cm−1 (A1g). In addition, a distinct peak at 635 cm−1 (Eg), corresponding to the antisymmetric stretching vibration of the rutile phase, was also observed. An intense band confirms the presence of WO3 at 807 cm−1, attributed to W-O stretching vibrations, together with additional features at 717, 272 cm−1, as well as a lower-frequency band at 325 cm−1, all of which can be assigned to W-O-W bending and stretching modes [21,22]. Notably, a slight shift in the vibrational modes of TiO2/10%WO3 film was detected when compared with the reference spectra of TiO2 and WO3. This shift is indicative of strong interfacial interactions between the oxides, suggesting possible Ti-O-W bond formation or local structural distortions at the heterojunction.

3.1.4. Energy Dispersive X-Ray Spectroscopy (EDX)

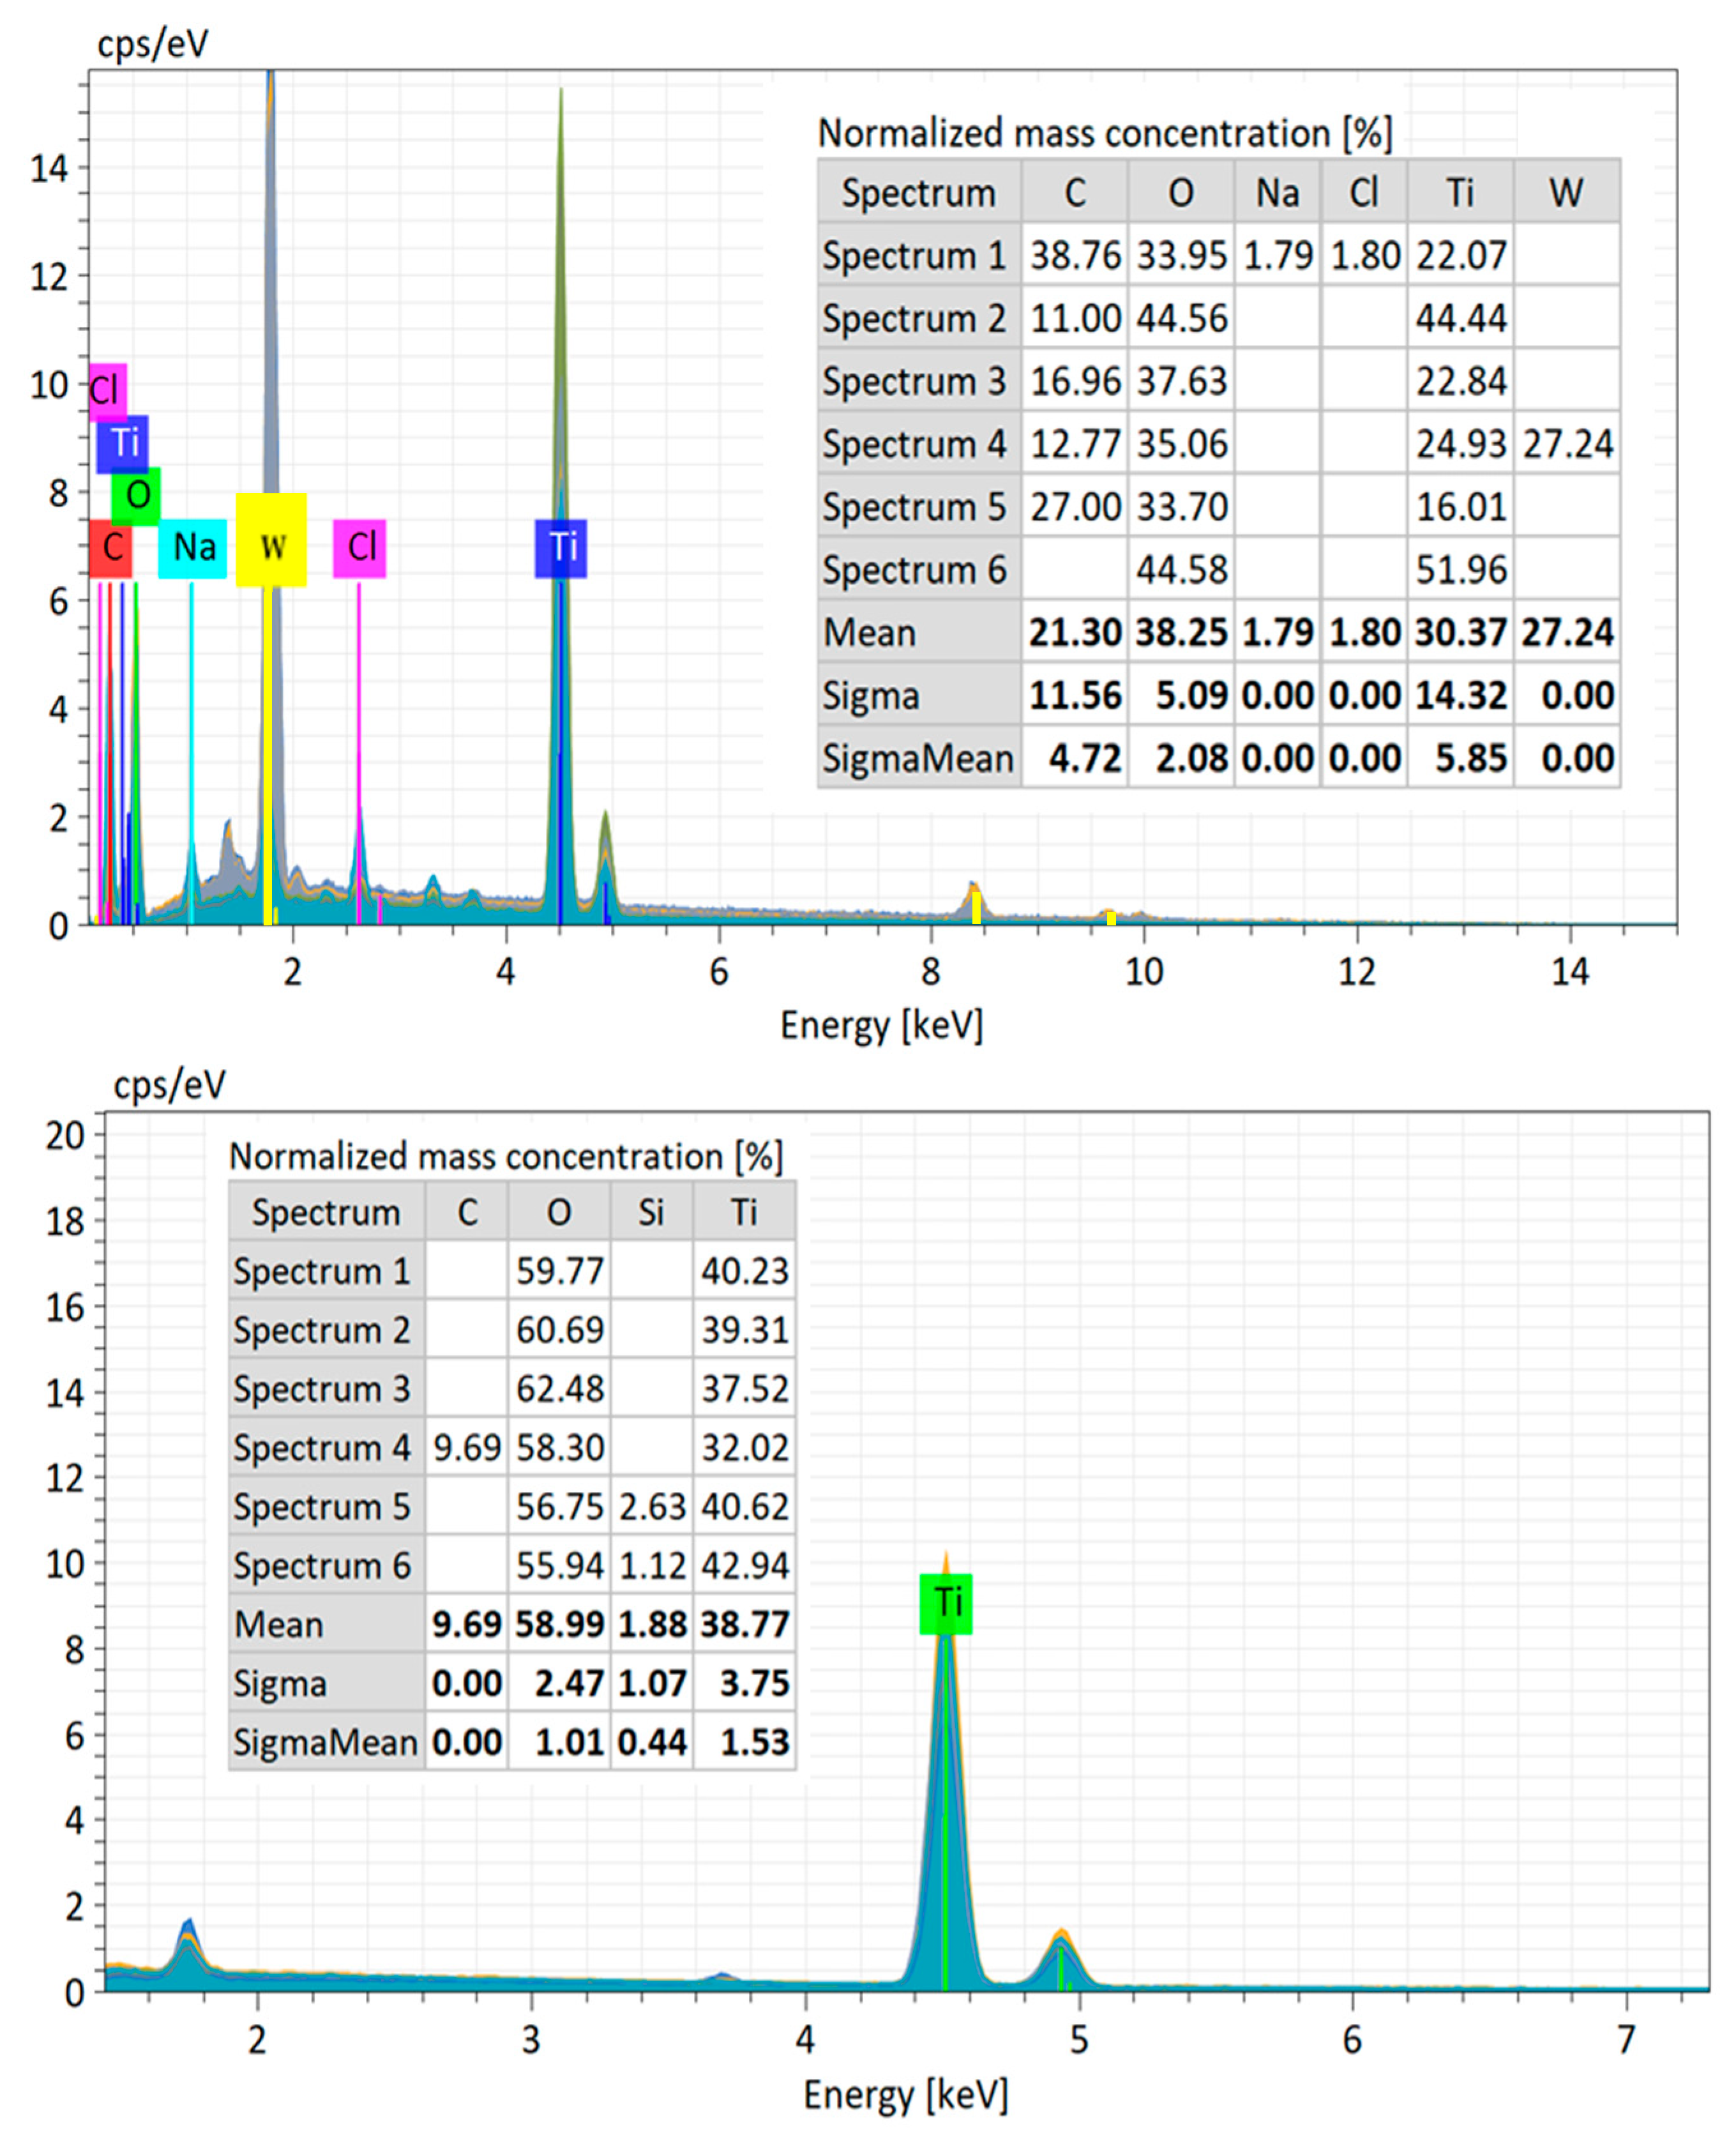
The EDX spectrum presented in Figure 5 for the pure TiO2 thin film deposited on a standard glass slide as a substrate indicates titanium (Ti) and oxygen (O) as the principal elements. Distinct Ti peaks were observed at Kα (4.52 keV) and Kβ (4.93 keV). Although the characteristic O Kα peak at 0.52 keV was not detected in the spectrum, oxygen was nevertheless quantified in the elemental composition table, with a normalized mass concentration at 58.99%. This value is consistent with the theoretical stoichiometry of TiO2, and the apparent absence of the oxygen peak is attributed to the well-recognized limitation of EDX in detecting light elements, which emit low-energy X-rays that are often absorbed before reaching the detector. In contrast, the EDX spectrum of the TiO2/10%WO3 nanocomposite thin film revealed, in addition to Ti, distinct peaks associated with tungsten: Mα at 1.75 keV, Lα at 8.4 keV, and a weaker peak of Lβ at 9.65 keV. The corresponding normalized mass concentration for W is 27.24%, confirming the presence of WO3. In this case, the O Kα peak remained discernible, reflecting contributions from both oxides. Minor signals corresponding to Na, C, and Cl were also detected, most likely arising from trace impurities introduced during the precursor chemistry or film preparation process. Collectively, the EDX results substantiate the successful synthesis of the TiO2/10%WO3 composite while preserving the compositional integrity of the thin film.

3.1.5. Scanning Electron Microscopy (SEM) of TiO2/WO3 Composites

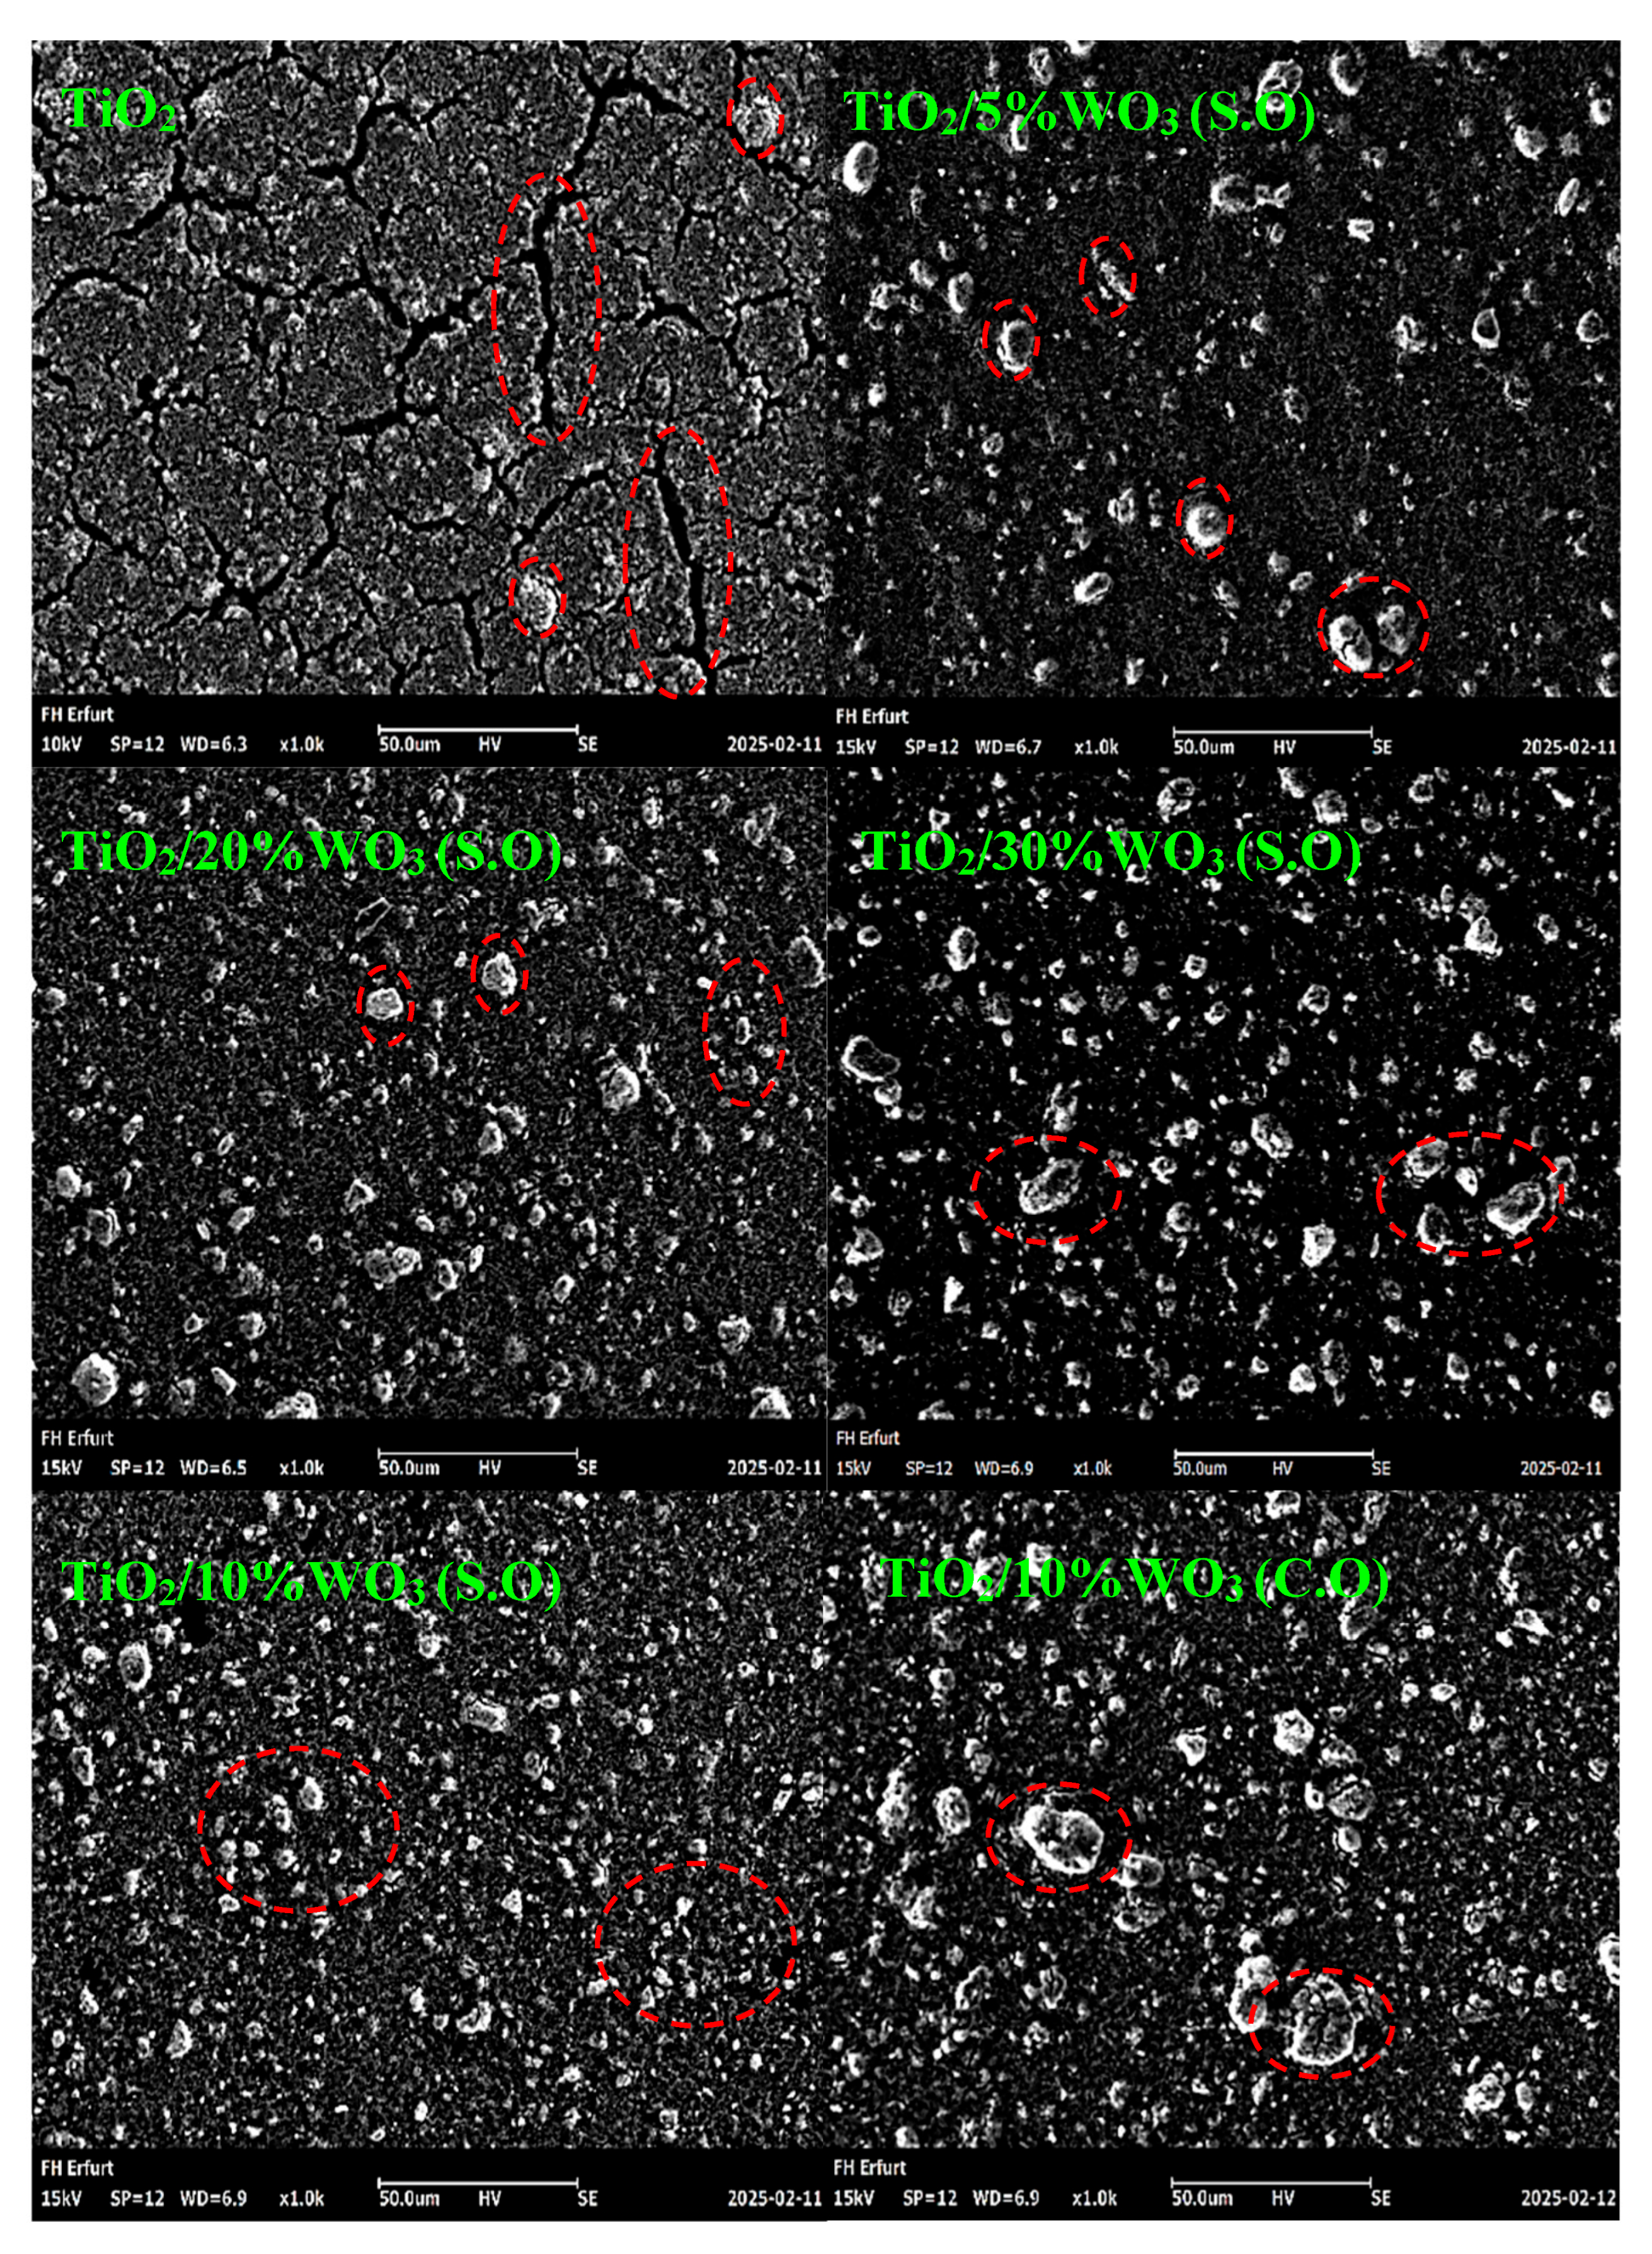
The surface morphology of TiO2/WO3 thin films with varying WO3 loadings (0, 5, 10, 20, 30 wt.%) was investigated by SEM imaging to evaluate the homogeneity, particle distribution, and structural integrity of the deposits. As shown in Figure 6, the pure TiO2 thin film exhibited a relatively uniform coverage but was characterized by the presence of cracks, discernible grain boundaries, and occasional agglomerates. With the incorporation of 5% WO3, the thin film displayed enhanced particle dispersion and elimination of surface cracks, indicating a positive effect of WO3 even at a low ratio. The TiO2/10%WO3 (S.O) film demonstrated the most compact and homogeneous morphology, consisting of a continuous and smooth layer with uniformly dispersed particles of the smallest dimension, suggesting a strong interaction between the TiO2 and WO3 phases and improved interfacial contact [23]. In contrast, the nanocomposite TiO2/10%WO3 (C.O) exhibited large agglomerates, poor uniformity, and less homogeneous structures, highlighting the advantage of using synthesized oxides to achieve finer particle distribution and enhanced interfacial interactions. Increasing the WO3 content to 20% led to some surface irregularities and moderate agglomeration. Whereas at 30% thin film exhibited markedly larger agglomerates and rougher textures. These observations indicate that, although higher WO3 loading (30%) induces progressively irregular surfaces, larger agglomerates, and rougher textures, the 10 wt.% WO3 nanocomposite maintains a more uniform morphology with reduced agglomeration, thereby possessing the most favorable structural characteristics and emerging as the most promising candidate for photocatalytic applications.

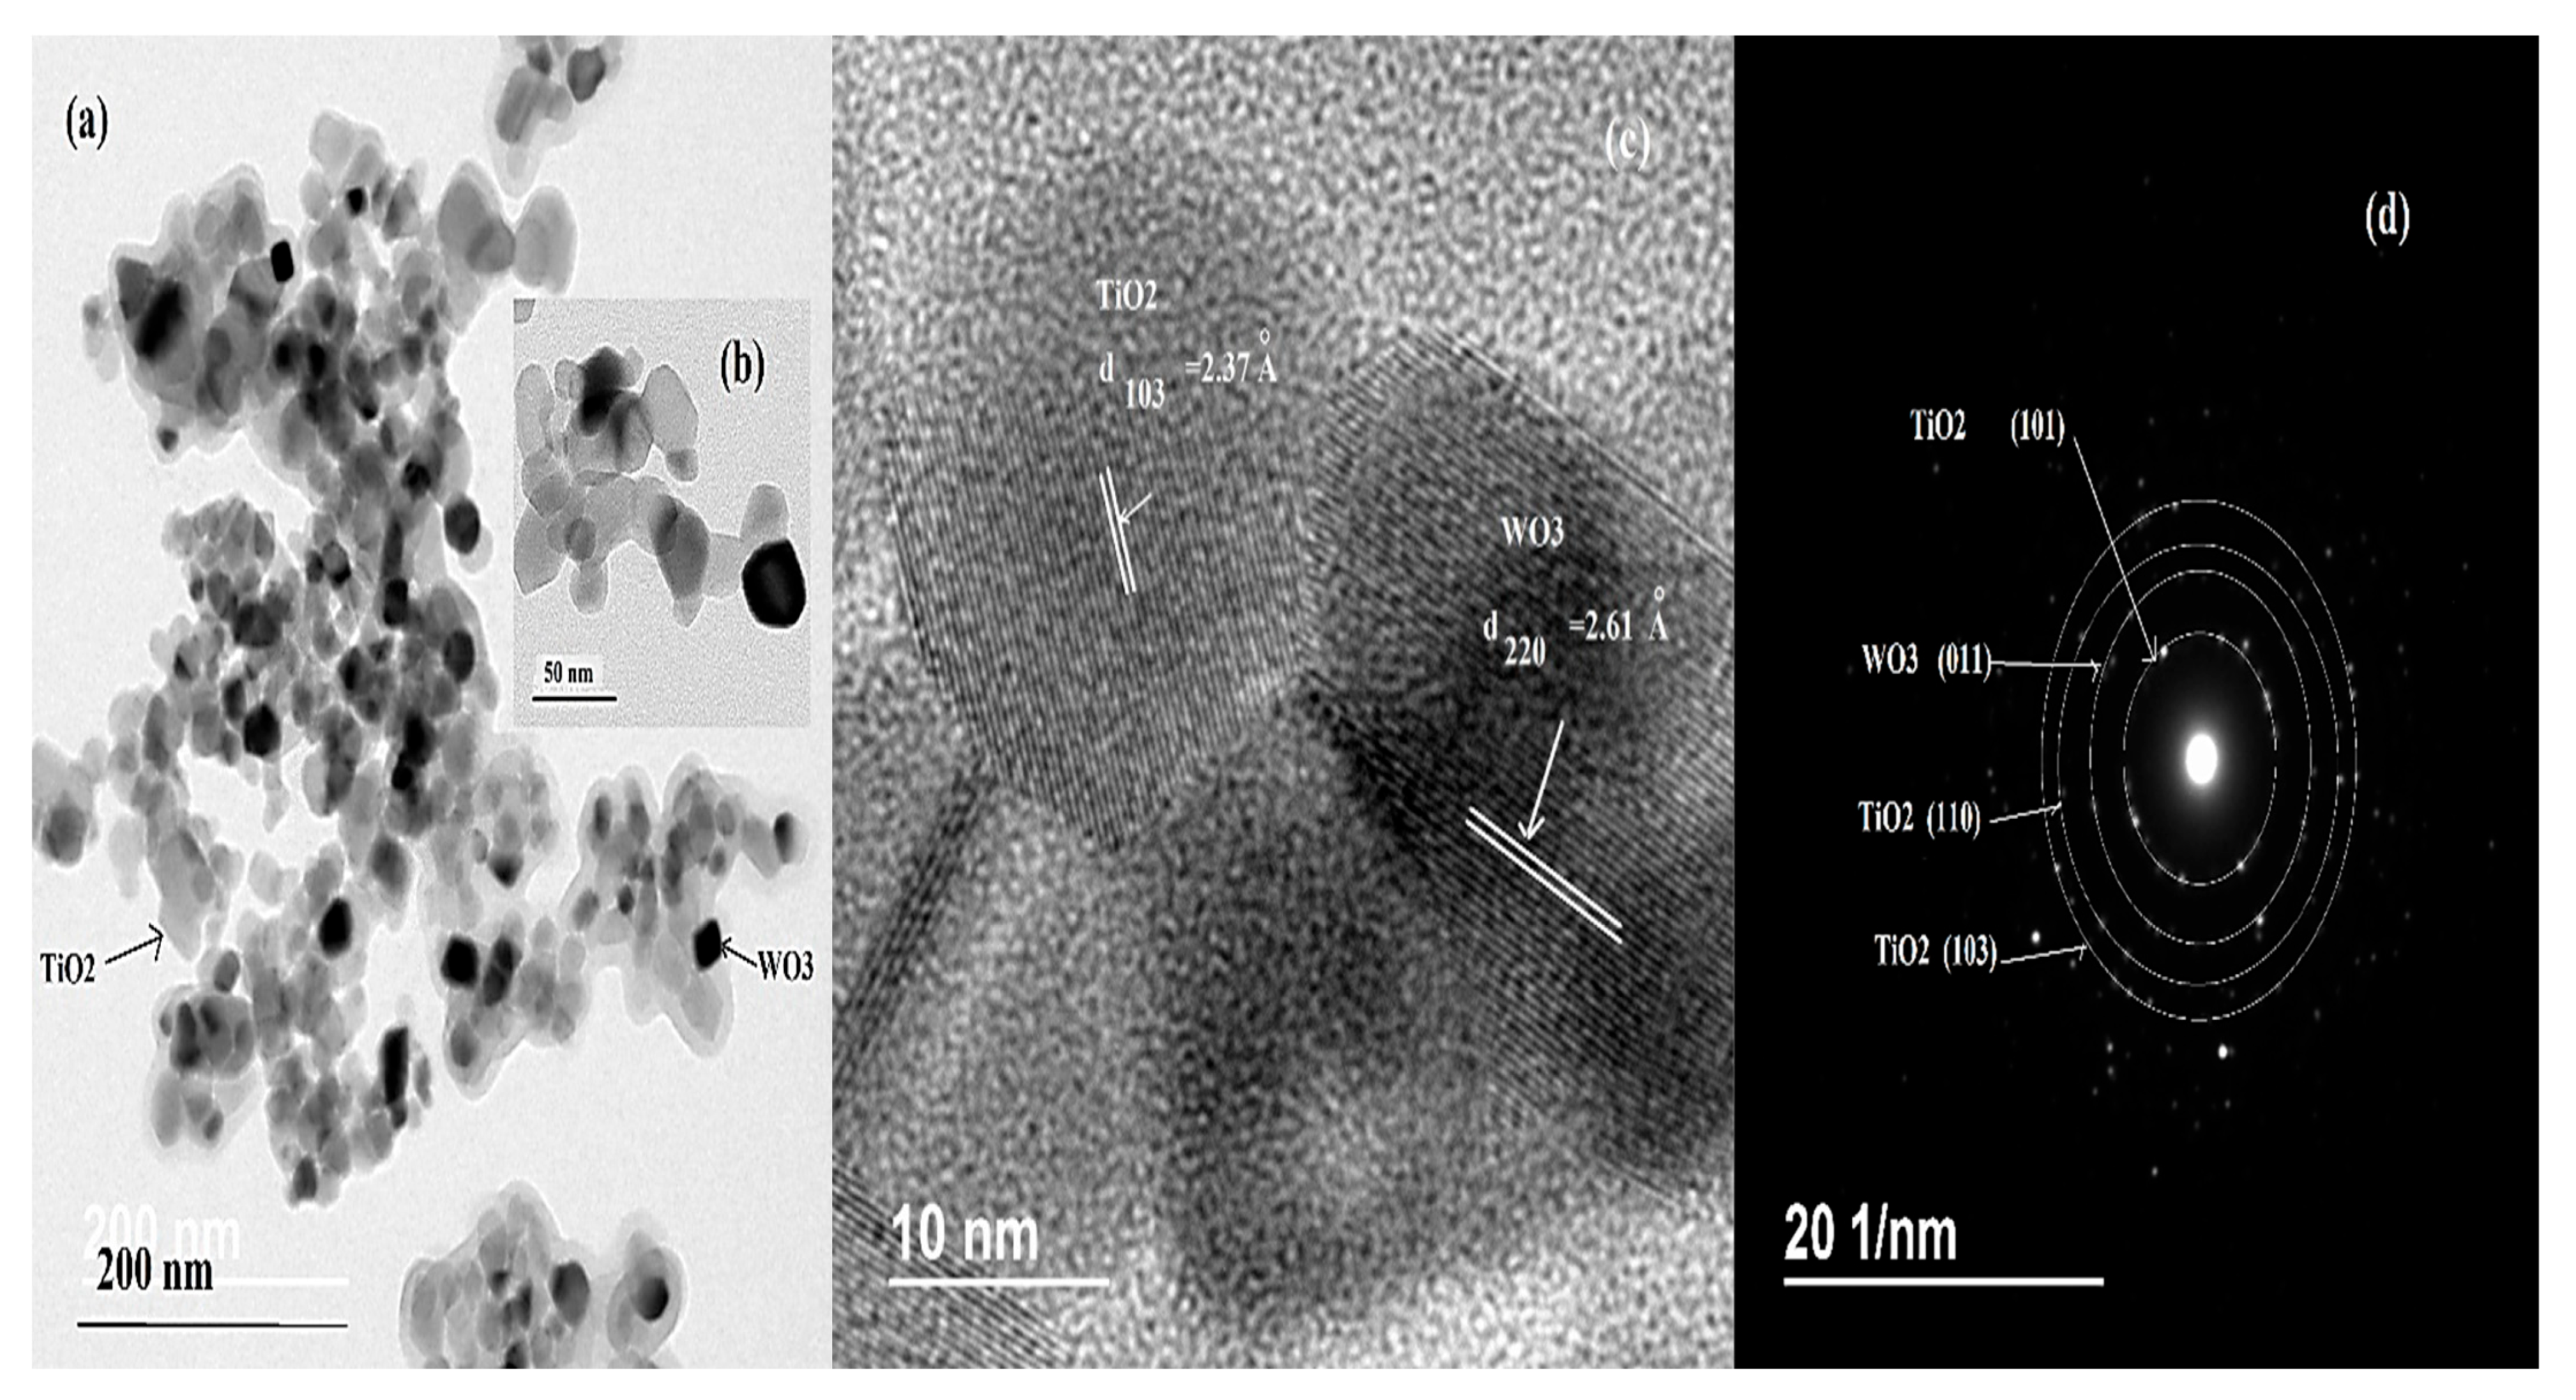
3.1.6. Transmittance Electronic Microscopy (TEM) of TiO2/WO3 Composite

The TEM images of TiO2/WO3 nanocomposite are presented in Figure 7a,b. They reveal two distinct morphologies: nanoplatelets and a hexagonal structure. TiO2 crystallizes predominantly as nanoplatelets, whereas the secondary WO3 phase adopts a hexagonal form. The average size of the nanoplatelets ranges from 12 to 30 nm, while the hexagonal structures exhibit a characteristic thickness of approximately 7 nm.
High-resolution TEM (HRTEM) analysis of the TiO2/WO3 nanocomposites (Figure 7c) displays alternating bright and dark fringes. The interplanar spacing of d = 2.38 Å is attributed to the (103) plane of TiO2, whereas the spacing of d = 2.60 Å corresponds to the (220) plane of WO3. The selected area electron diffraction (SAED) pattern (Figure 7d) further shows concentric diffraction rings, which can be indexed to the (101), (110), and (103) planes of TiO2, along with the (011) plane of WO3, thereby confirming the successful formation of TiO2/WO3 nanocomposites.

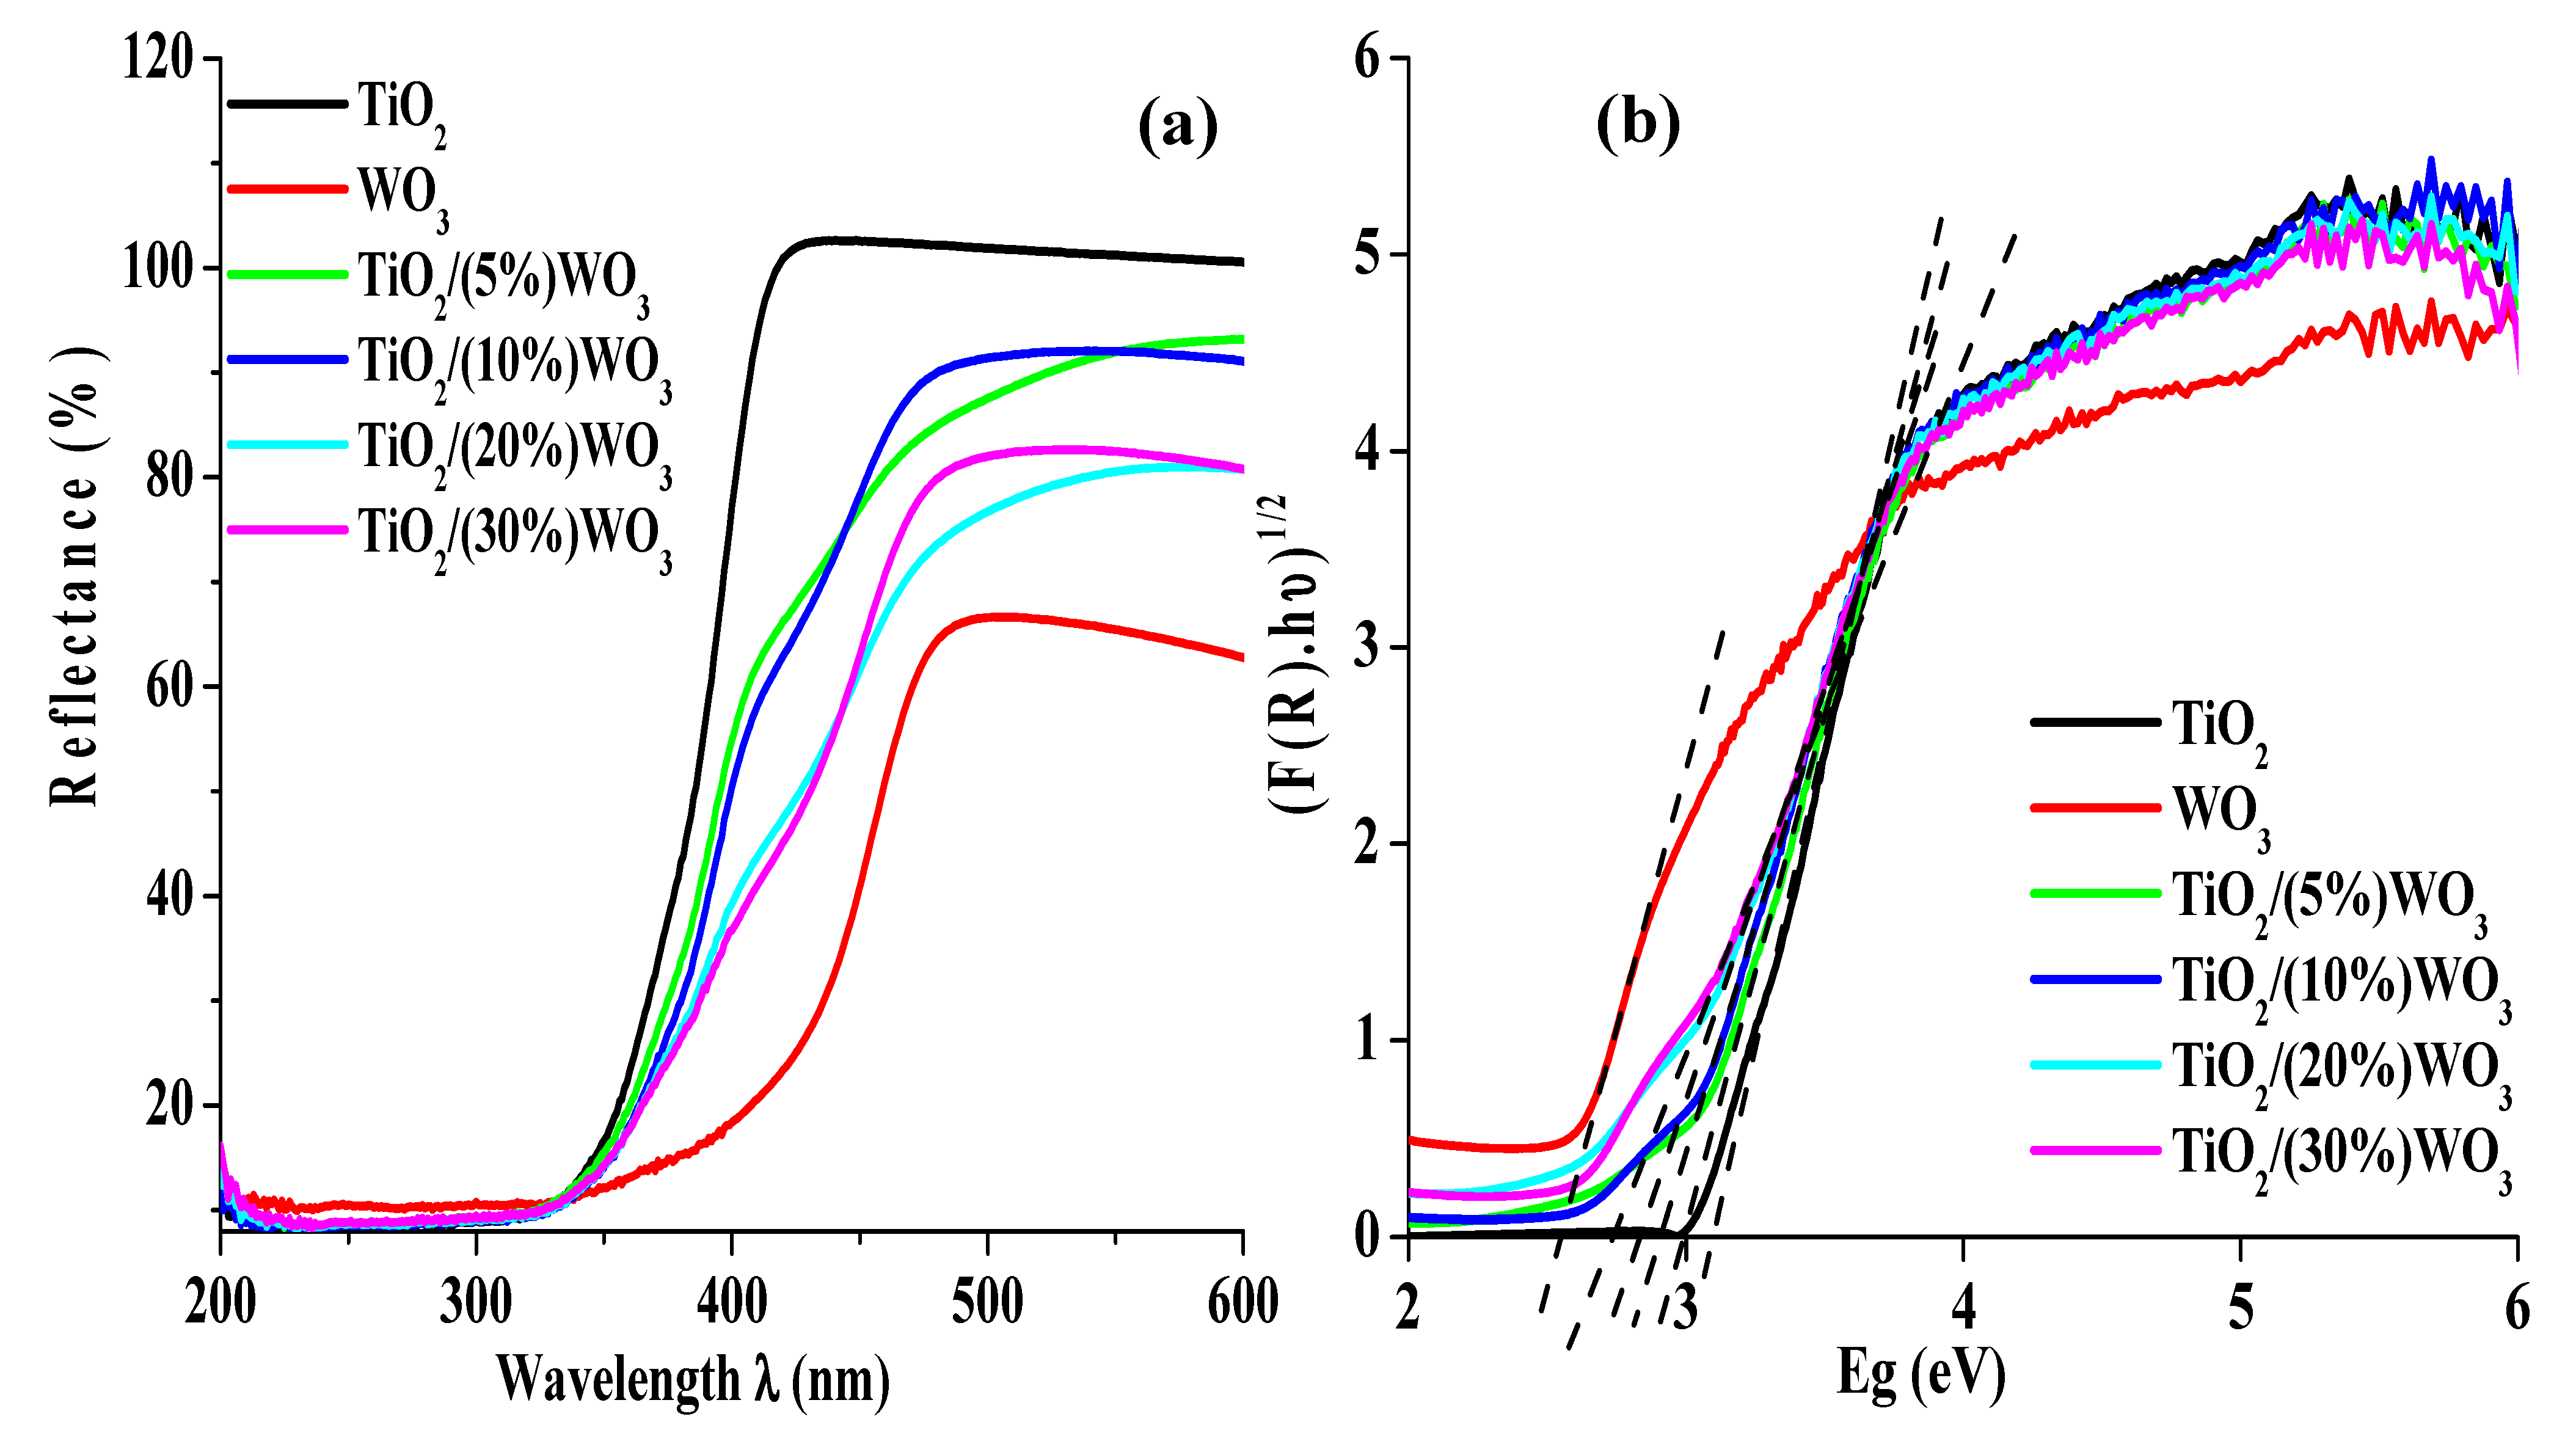
3.1.7. Optical Band Gap (Eg) Estimation via Kubelka-Munk Analysis

The Kubelka-Munk function, F(R) = (1 − R)2/(2R), was applied to the reflectance data of TiO2, WO3, and TiO2/WO3 (S.O) thin films (Figure 8a), and the optical band gap (Eg) was estimated from the Tauc plots (F(R). hν)n versus hν. Although TiO2 and WO3 are generally reported as indirect band gap semiconductors, the indirect transition model (F(R). hν)1/2 versus hν was adopted in this work. Pure TiO2 presented a band gap of 3.12 eV, corresponding to an absorption edge at ~400 nm, which confines its photoresponse mainly to the ultraviolet region. While pure WO3 exhibited a narrower band gap of 2.60 eV, extending absorption well into the visible range and enabling stronger utilization of solar light. The incorporation of WO3 into TiO2 progressively narrowed the band gap and red-shifted the absorption edge: 2.99 eV (~415 nm) at 5 wt.% WO3, 2.91 eV (~426 nm) at 10 wt.% WO3, 2.83 eV (~438 nm) at 20 wt.% WO3, 2.75 eV (~451 nm) at 30% wt.% as it was showed in Figure 8b. These shifts, although modest and within the experimental uncertainty (0.01–0.03 eV), clearly demonstrate a systematic trend. These results indicate that low WO3 contents retain predominantly UV absorption similar to TiO2, whereas higher WO3 loading significantly extends absorption further into the visible range. Notably, composites containing 20 and 30 wt.% WO3 exhibit band gaps of 2.83 eV and 2.75 eV, with absorption edges near 438 nm and 451 nm, respectively, indicating their potential to harvest a larger fraction of sunlight compared to other samples. The observed gradual band gap narrowing is attributed to interfacial electronic interactions between TiO2 and WO3. While excessive WO3 loading may lead to particle agglomeration, as confirmed by SEM analysis, it potentially compromises heterojunction quality. Overall, moderate WO3 contents (5–10 wt.%) appear optimal for balancing UV and visible absorption, whereas higher loading (20–30 wt.%) may further enhance solar light utilization at the expense of charge separation efficiency [24,25].

3.2. Photocatalytic Activity

3.2.1. Evaluating Photocatalytic Activity Against Controls

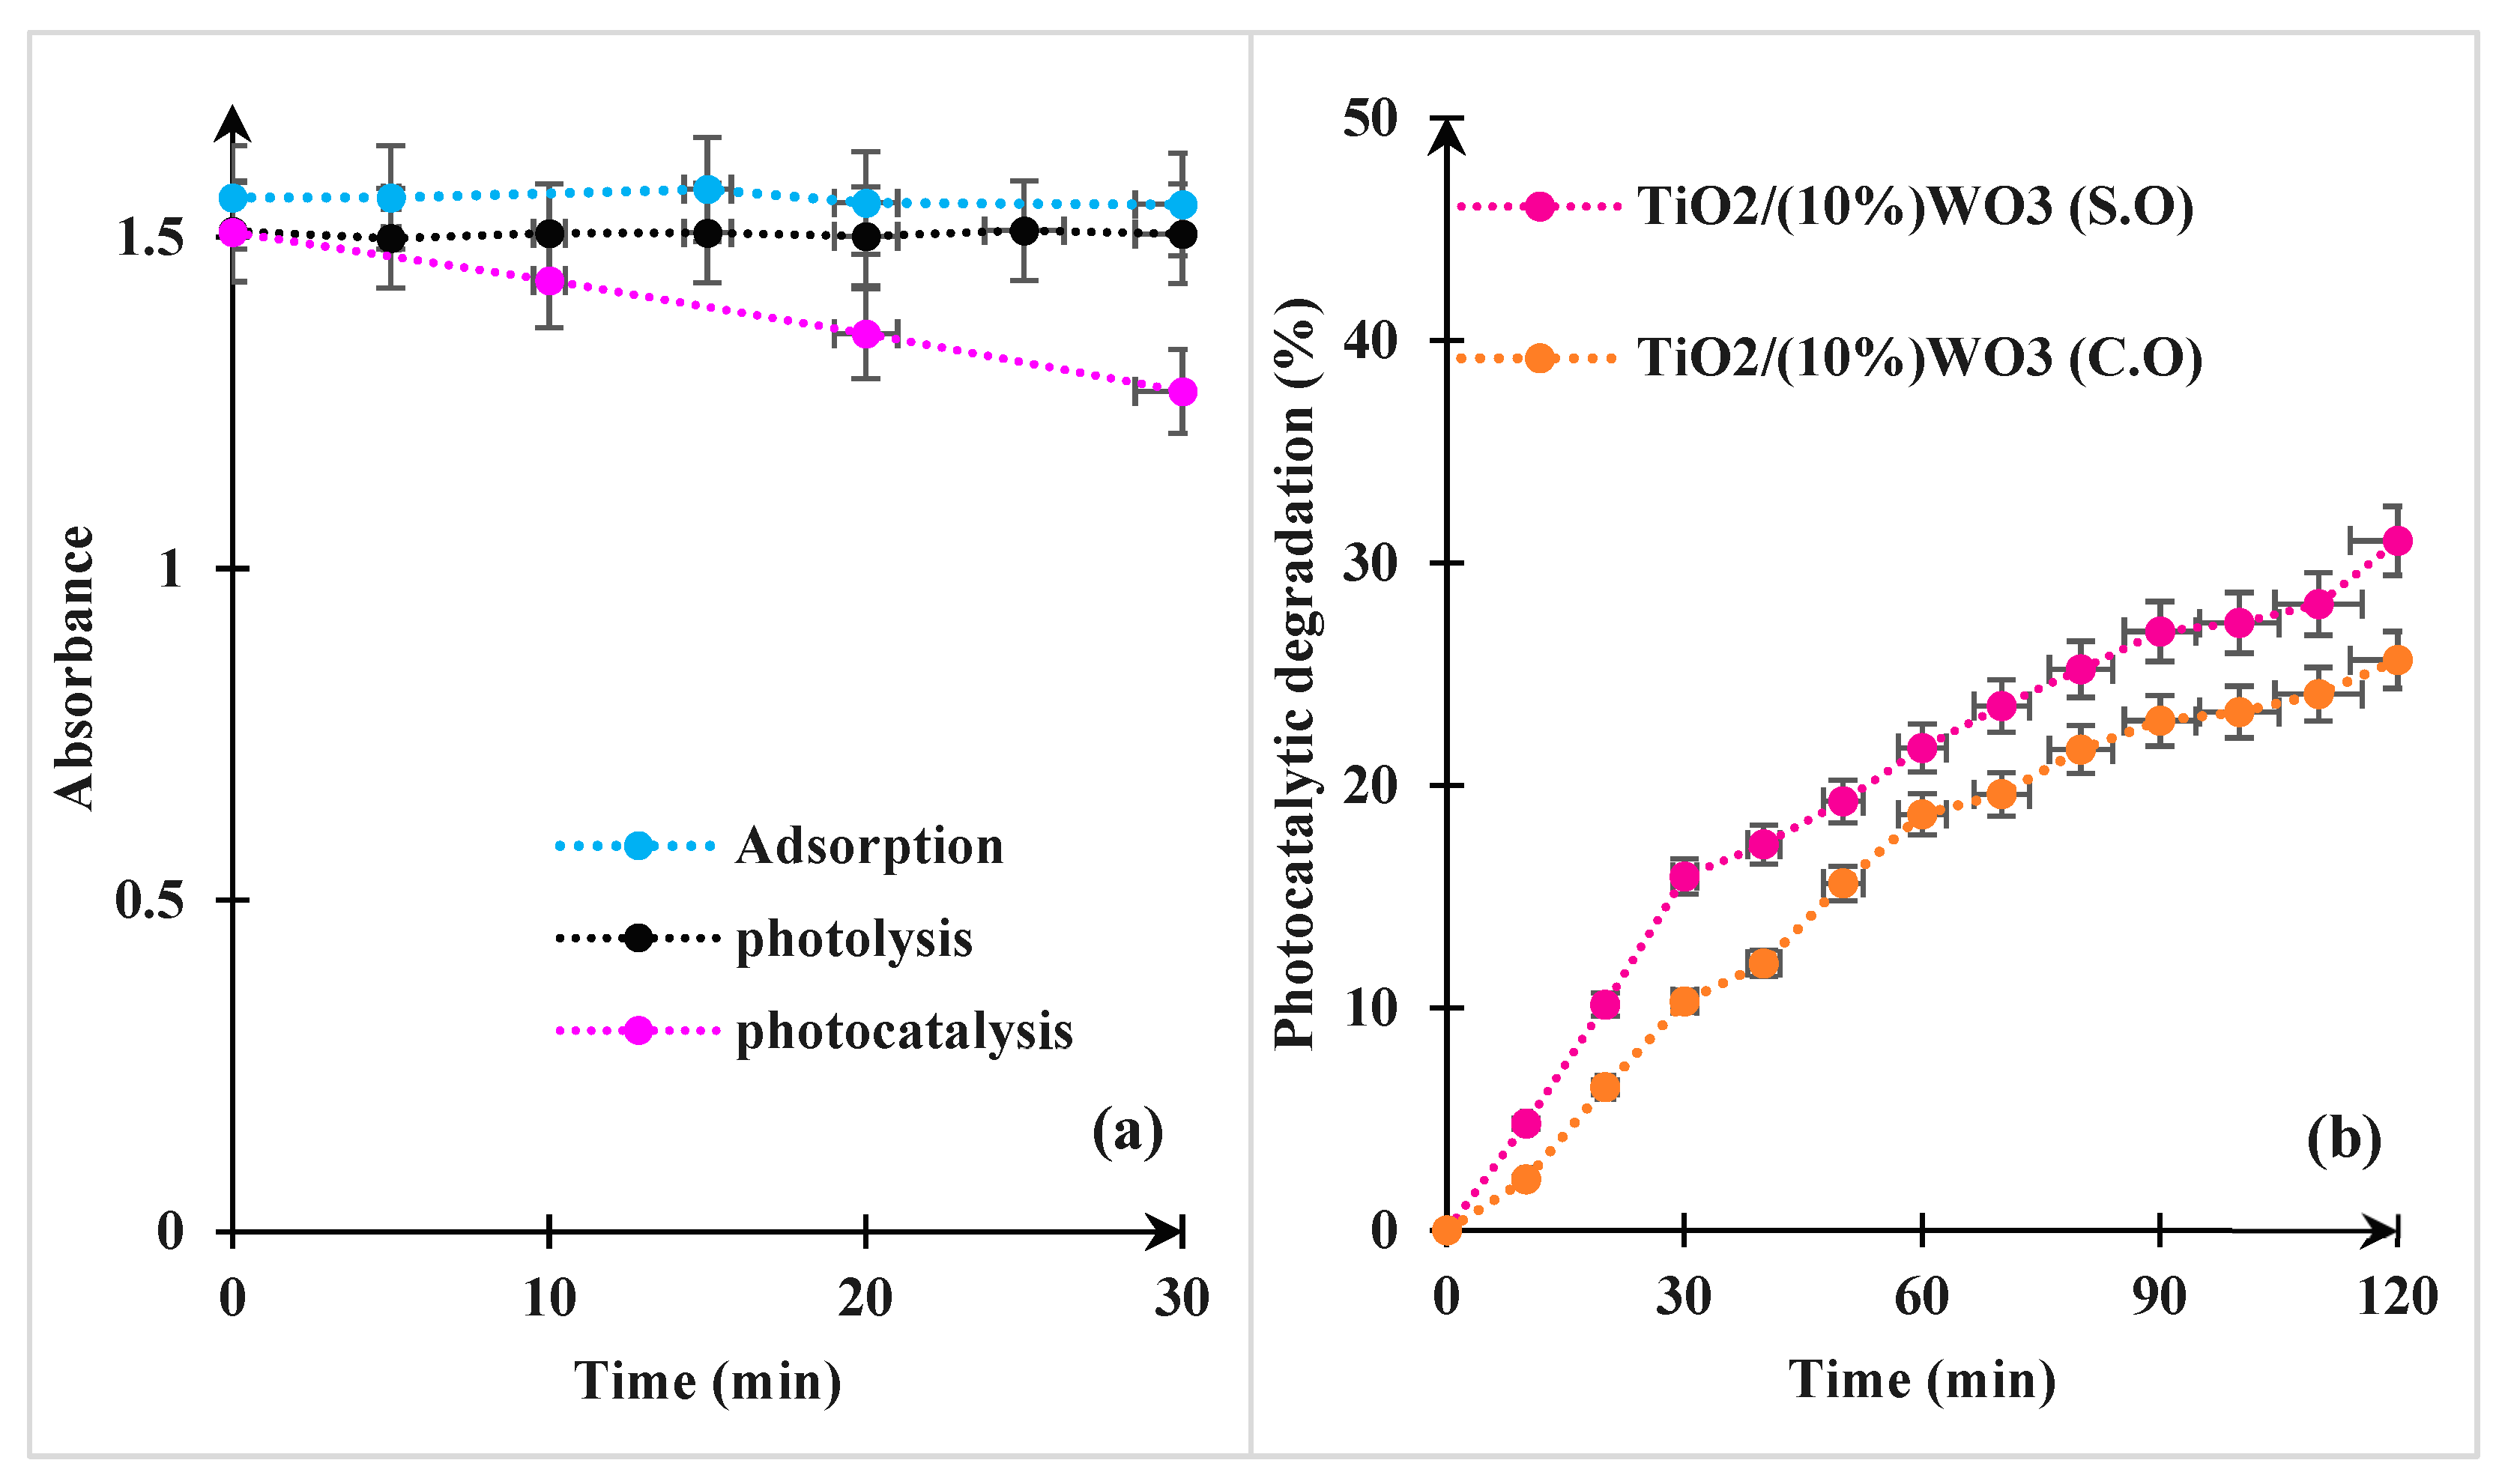
A comparative analysis was carried out to assess photolysis, adsorption, and photocatalysis of the nanocomposite TiO2/10%WO3 (S.O) over 30 min. The Venla was selected as a pharmaceutical pollutant in this study, with a concentration of 30 mg/L, and the source light was UV-LEDs. It should be noted that the Venla concentration used in our experiments (30 mg/L) is substantially higher than the levels typically detected in the environment, which generally range from ng/L to low µg/L. This elevated concentration was chosen to ensure accurate and reproducible spectrophotometric measurements, facilitate reliable kinetic analysis, and allow meaningful comparison of photocatalyst performance under controlled laboratory conditions. While the absolute degradation efficiencies reported here may not directly reflect those achievable in natural waters, the observed trends in photocatalytic activity, interfacial charge separation, and material stability are expected to remain relevant at environmentally realistic concentrations. Moreover, the mechanistic insights obtained at higher pollutant loads can inform the design of scaled-up systems, where factors such as longer residence times, enhanced light penetration, or pre-concentration strategies may be employed to achieve effective Venla removal in real-world purification applications. Under identical conditions, as shown in Figure 9a, photolysis (irradiation in the absence of a photocatalyst) and adsorption (dark experiment with a photocatalyst) produced negligible substrate removal, confirming that neither direct irradiation nor physical adsorption plays a significant role. By contrast, the photocatalytic experiment (irradiation in the presence of nanocomposite) led to a pronounced reduction in substrate concentration within 30 min, thereby demonstrating that the degradation originates predominantly from photocatalytic activity rather than from adsorption or photolysis

3.2.2. Comparison of the Photocatalytic Performance Between the Synthesized Nanocomposite and That Prepared from Commercial Oxides

An assessment of photocatalytic activity was conducted to evaluate the efficiency of TiO2/10%WO3 thin film nanocomposite synthesized Via a controlled method versus a nanocomposite prepared from commercial TiO2 and WO3 powders during 120 min. Under identical experimental conditions as the previous test. The thin film TiO2/10%WO3 (S.O) achieved a photocatalytic degradation of 31%, as shown in Figure 9b, while the thin film TiO2/10%WO3 (C.O) exhibited a photocatalytic efficiency of 25%. The superior performance of the synthesized binary system was attributed to its nanoscale dimensions, markedly smaller than those of commercial oxides, together with its enhanced structural homogeneity, confirmed by SEM and TEM imaging, improved interfacial contact between TiO2 and WO3, and more efficient charge separation, which collectively promote higher photocatalytic activity [26,27]. The result highlights the significance of the synthesis method and composite quality in ameliorating the performance of photocatalytic materials.

3.2.3. The Effect of WO3 Amount on the Photocatalytic Behavior of TiO2

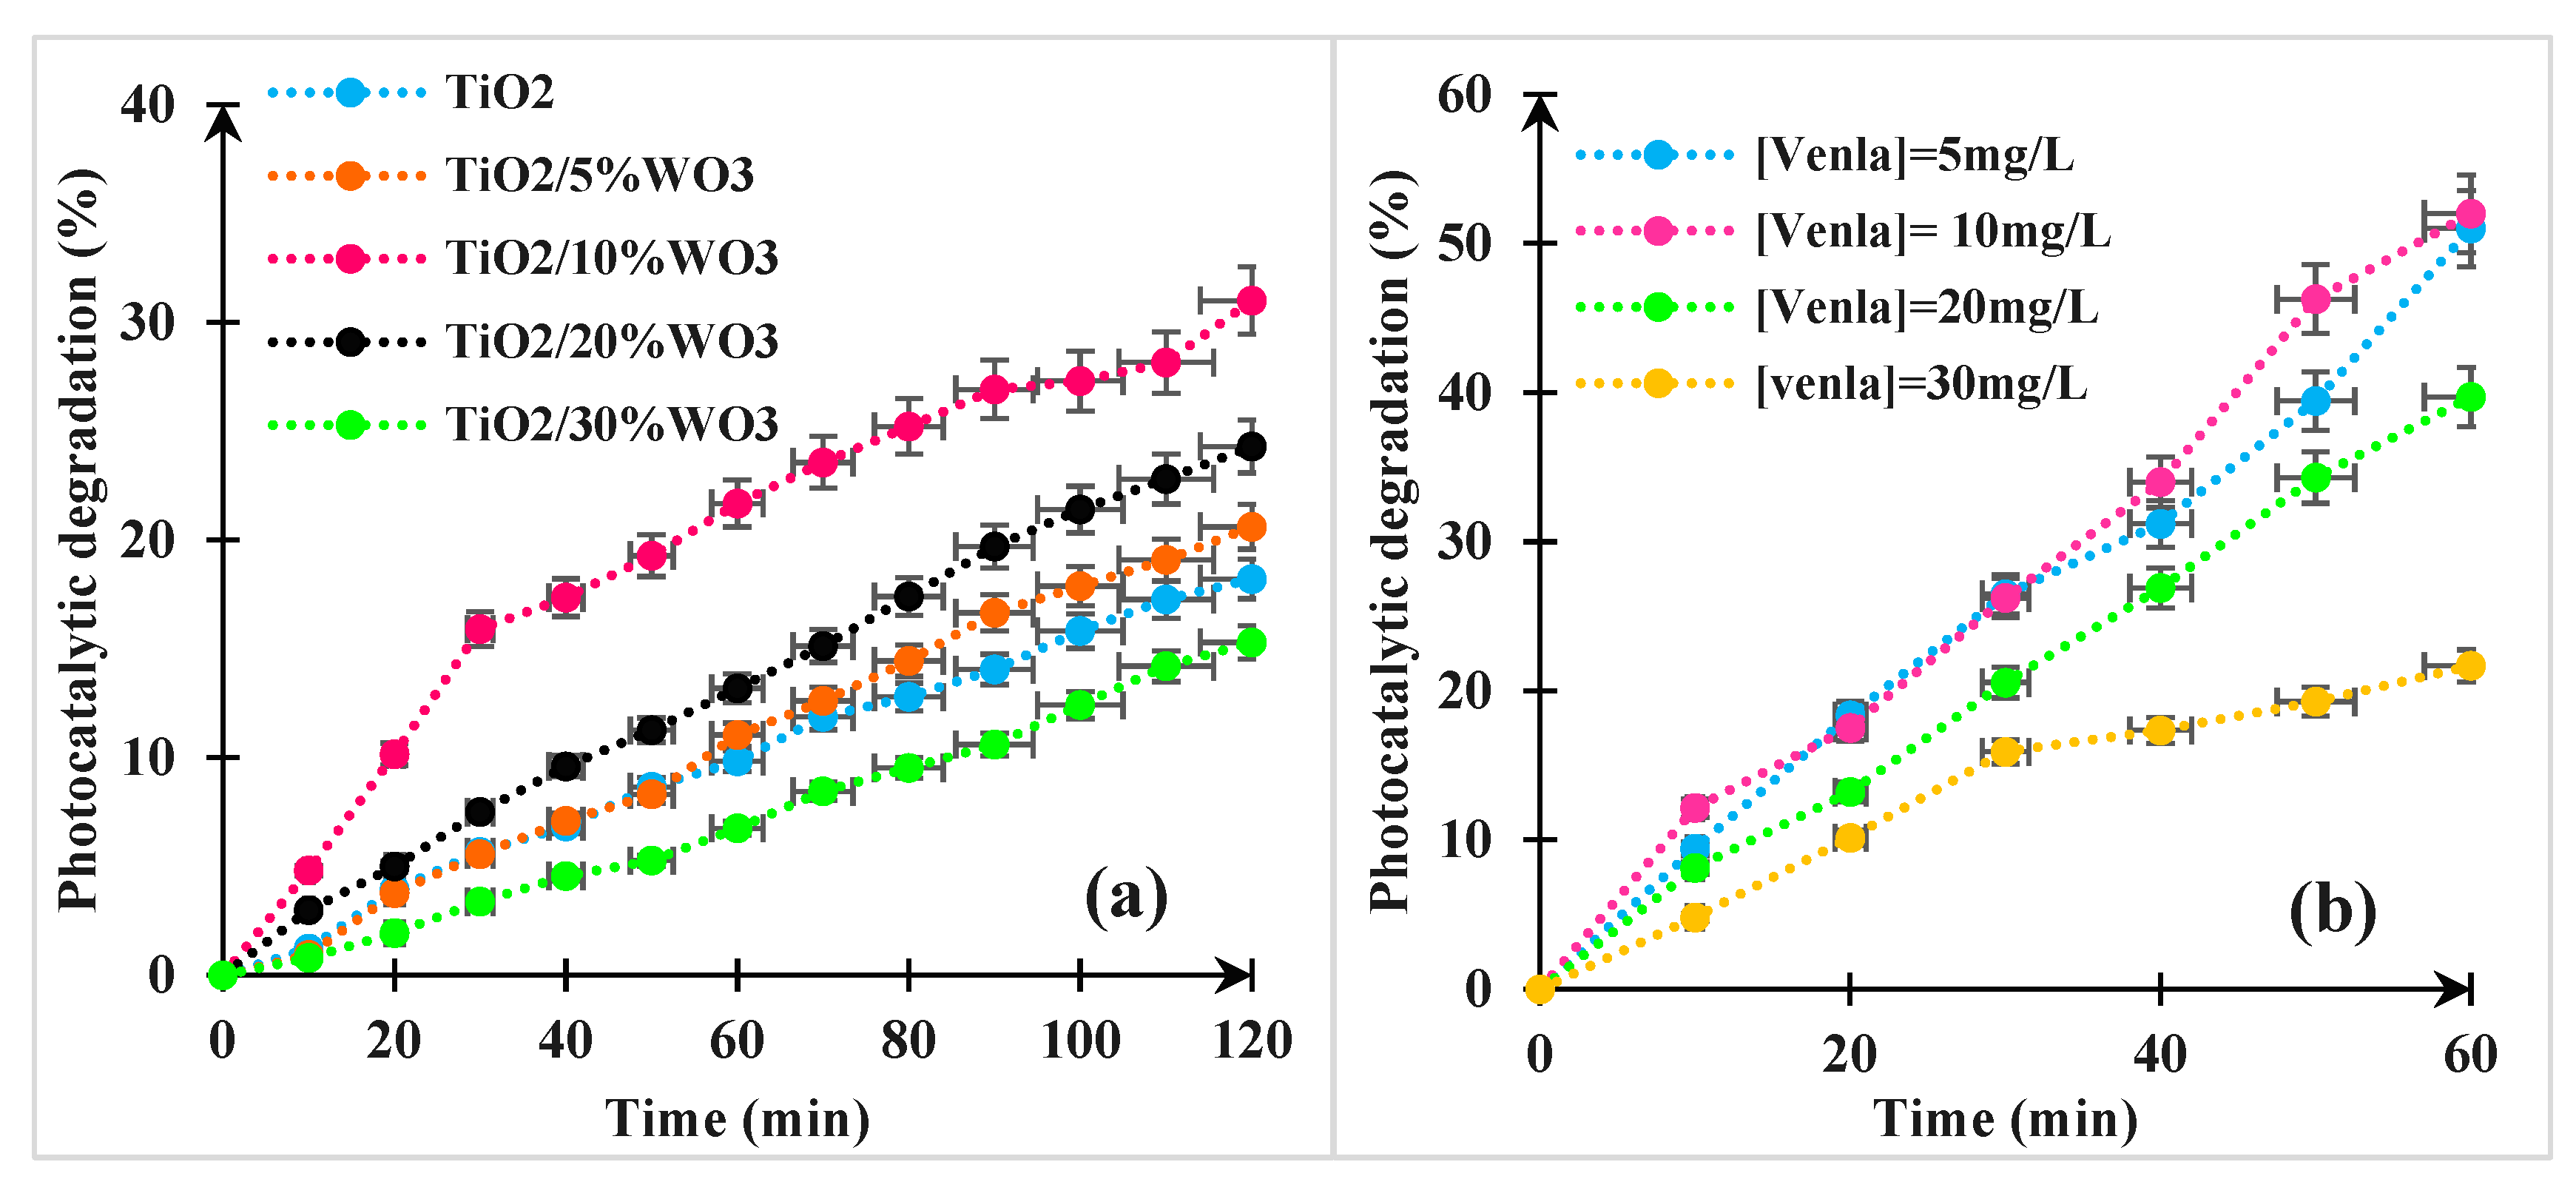
The photocatalytic degradation of Venla (30 mg/L) under UV-LEDs irradiation was evaluated using pure TiO2 and TiO2/WO3 synthesized nanocomposites with varying WO3 content (5, 10, 20, 30 wt.%). The results showed in Figure 10a a clear dependence of the photocatalytic efficiency on the WO3 loading. Pure TiO2 reached 18% of degradation during 120 min. A slight enhancement to 20% was observed with 5% WO3, suggesting improved charge separation due to heterojunction formation between TiO2 and WO3. The highest photocatalytic activity, 31% was achieved with TiO2/10%WO3, indicating that this photocatalyst provides an optimal balance between charge separation and UV-light absorption. However, further increases in WO3 amount led to a decline in efficiency, 24% for 20 wt.% WO3 and 15% for 30% wt.% WO3. This decrease is likely due to the excessive presence of WO3, which can act as a recombination center and diminish the effective surface area available for light penetration, thereby limiting the potential for enhanced visible-light absorption, as discussed in the band gap analysis. These findings highlight that while the addition of WO3 can enhance TiO2 performance under UV light, optimal loading is crucial to avoid detrimental effects on photocatalytic activity [28].

3.2.4. Effect of Initial Concentration of the Pollutant

The effect of the initial concentration of Venla on its photocatalytic degradation was investigated using TiO2/10%WO3, identified as the most efficient photocatalyst in this study, under UV LEDs irradiation for 60 min. The results in Figure 10b showed a clear inverse relationship between the initial concentration of Venla and the degradation efficiency. At lower concentrations, 5 and 10 mg/L, the photocatalyst achieved a high degradation efficiency of 52%, indicating that a greater proportion of the pollutant molecules could interact with the available active sites on the catalyst surface, and the generation of reactive oxygen species was sufficient for effective degradation. However, as the initial concentration increased to 20 mg/L, the degradation efficiency decreased to 39%, and further dropped to 21% at 30 mg/L. This decline can be attributed to several factors. The higher concentration of the pollutant increases the number of molecules competing for the same active sites, potentially leading to their saturation. Higher concentrations can limit light penetration due to increased solution turbidity, reducing photon absorption by the photocatalyst. Moreover, the fixed amount of generated reactive species may become insufficient to degrade a larger number of pollutant molecules [29,30]. These observations confirm that lower concentrations of pollutants favor more efficient photocatalytic degradation and prove the importance of optimizing operational parameters for real-world wastewater treatment applications.

3.2.5. Kinetic Study

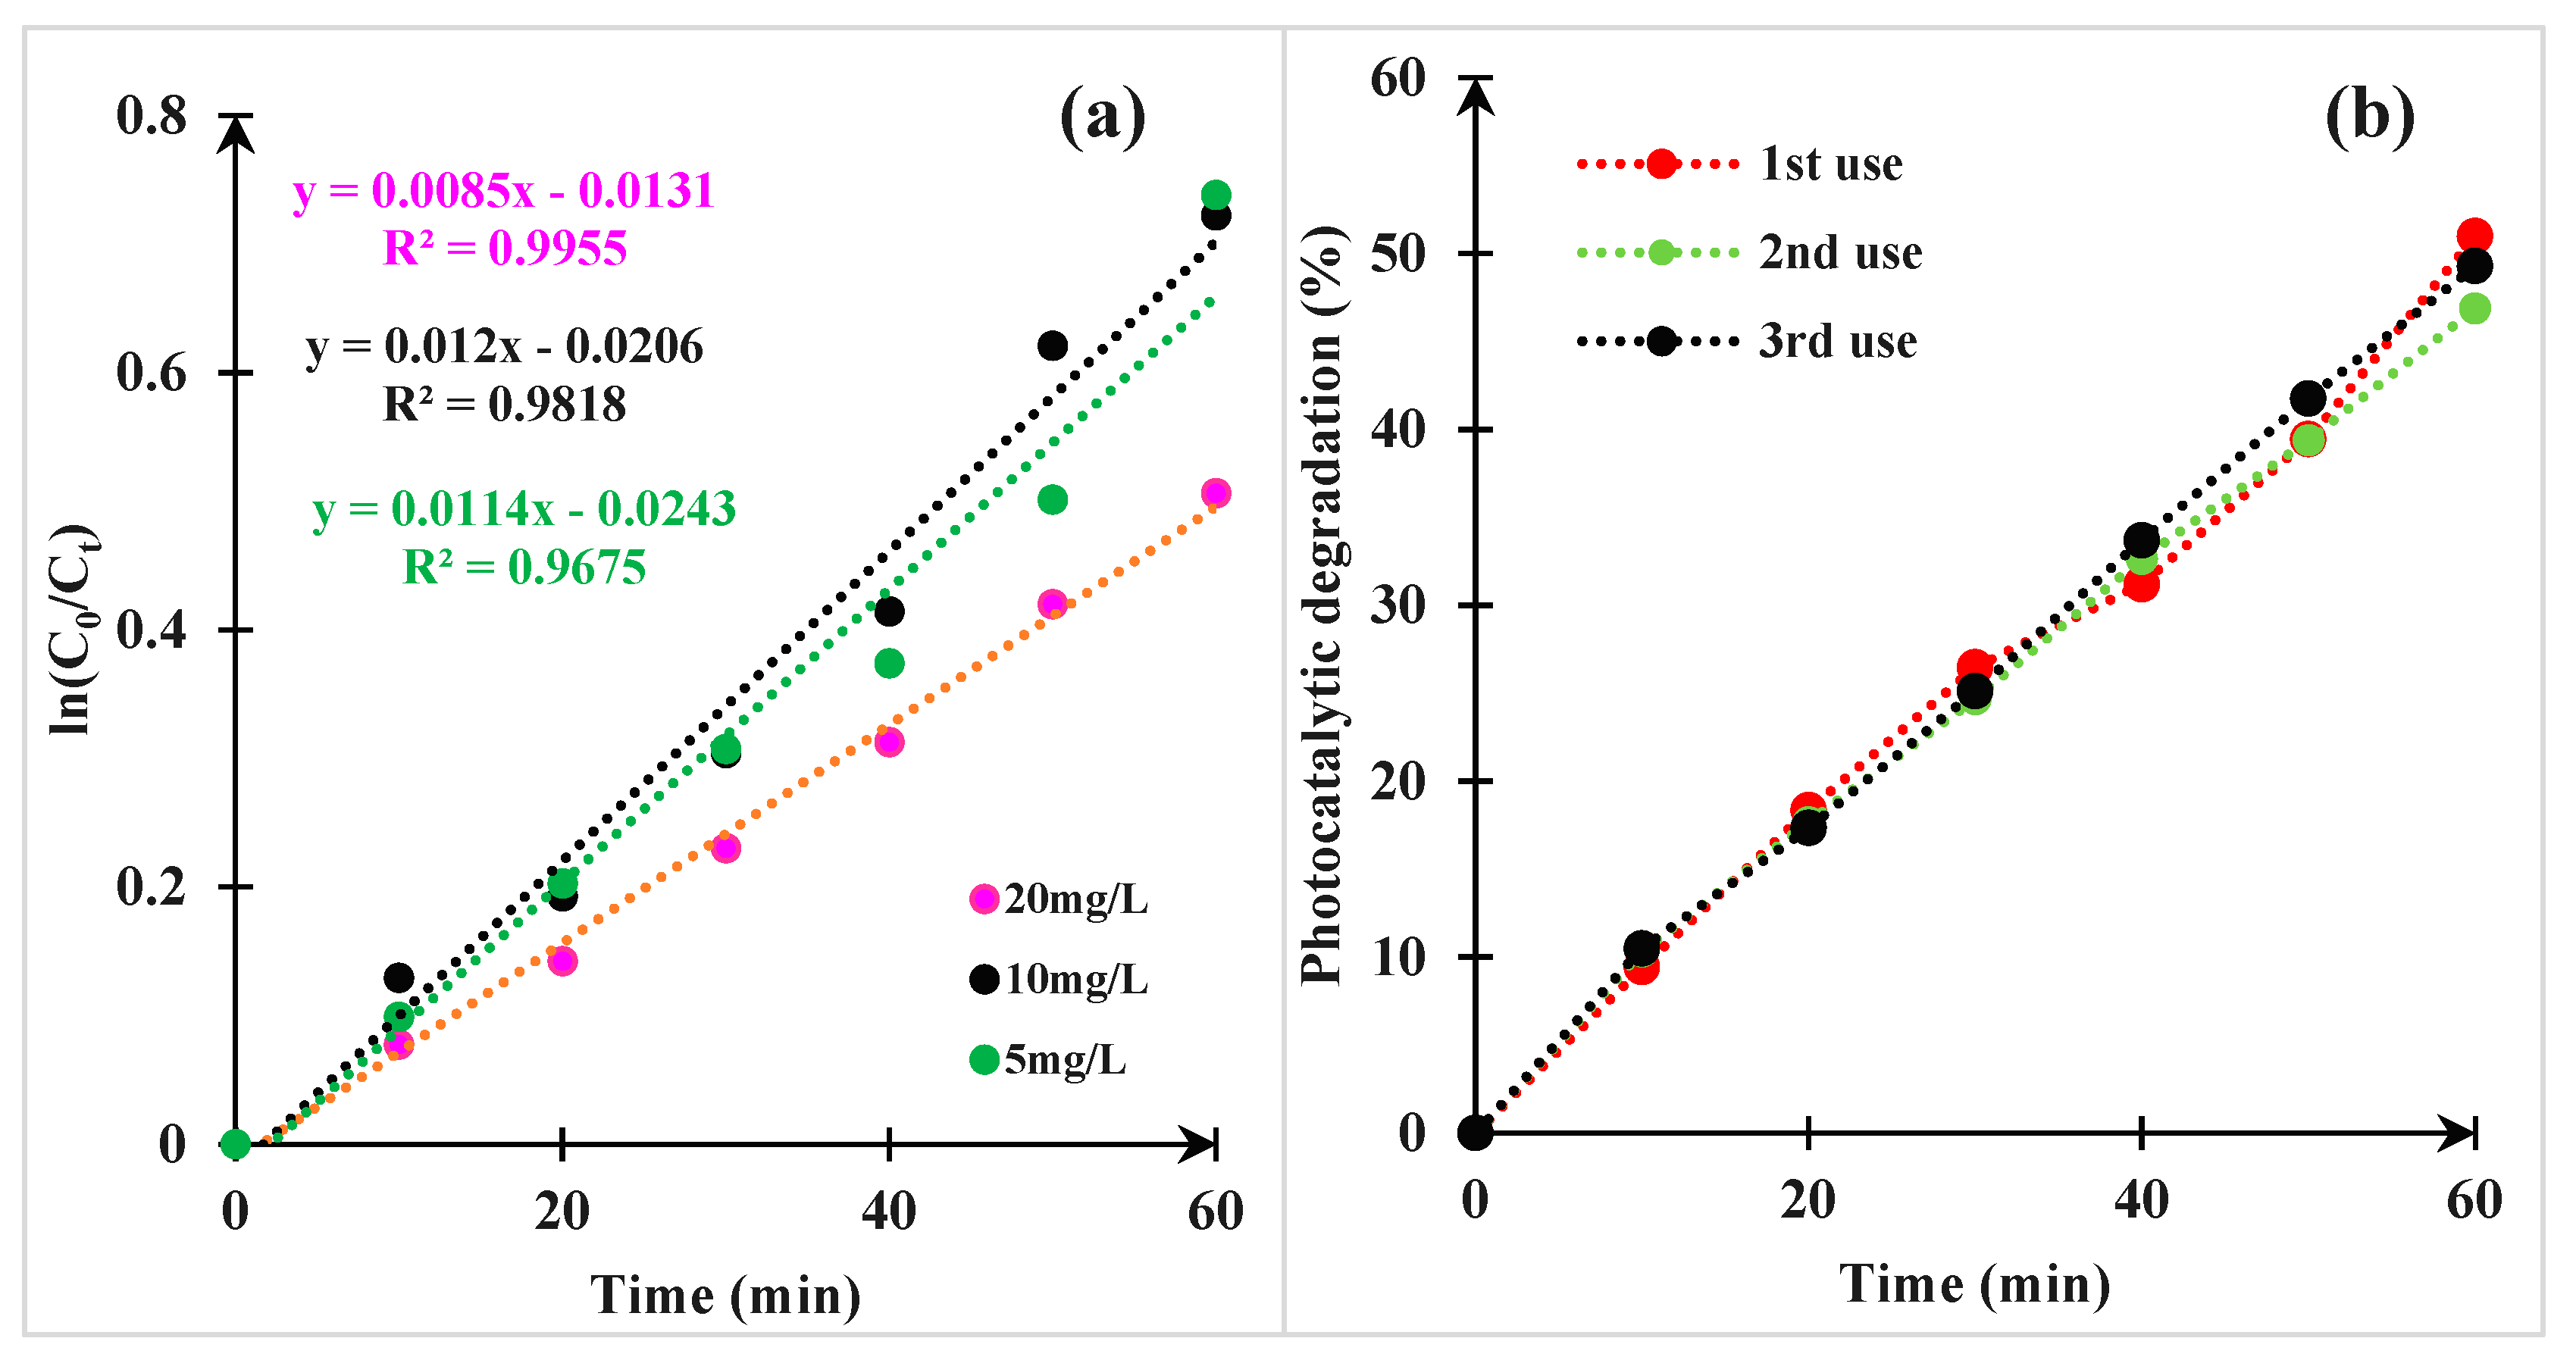
The kinetics of Venla degradation by TiO2/10%WO3 under UV-LEDs irradiation were examined at different concentrations (5, 10, 20 mg/L) over one hour. The applicability of pseudo-first-order kinetics was validated by the linear relationship obtained from ln(C0/C) versus time plots, with good correlation coefficients. The apparent rate constant (kapp) and half-life time (t1/2) were calculated for each concentration as presented in Figure 11a. At 5 mg/L, the reaction presented a kapp of 0.0114 min−1 with a correlation coefficient R2 of 0.9675, and a t1/2 of 57.76 min. For 10 mg/L, kapp increased slightly to 0.012 min−1, with a higher R2 of 0.9818, and t1/2 was 60.8 min, indicating a good fit to the pseudo-first-order model and efficient degradation at lower concentrations. However, when the initial concentration was increased to 20 mg/L, kapp decreased to 0.0085 min−1, despite a higher R2 of 0.9955, and the t1/2 extended to 81.54 min. This decline in reaction rate at higher concentrations may be attributed to the saturation of active sites on the catalyst surface, reduced availability of hydroxyl radicals per pollutant molecule, and increased light attenuation. These results confirm that the degradation rate is strongly influenced by the initial concentration of Venla, with lower concentrations favoring faster and more efficient photocatalytic reactions.

3.2.6. Stability of Photocatalyst

The stability and reusability of the TiO2/10%WO3 thin film photocatalyst were assessed over 3 consecutive cycles of Venla degradation (5 mg/L) under UV LEDs irradiation (Figure 11b). The results demonstrated good photocatalytic durability. In the first cycle, the degradation efficiency reached 52%, confirming the high initial activity of the photocatalyst. In the second cycle, a slight decrease was observed, with 46% degradation, likely due to partial surface fouling, minor loss of active sites, or accumulation of intermediate byproducts. However, in the third cycle, the efficiency slightly improved to 49%, suggesting that the photocatalyst retained most of its activity and that any deactivation observed was not progressive or irreversible. This recovery may also indicate the partial desorption or degradation of surface-bound intermediates during the cycle. Overall, the TiO2/10%WO3 thin film exhibits good stability and reusability, maintaining consistent performance over multiple uses, which is essential for practical and sustainable wastewater treatment applications.

3.2.7. Photocatalytic Charge Transfer Pathways in TiO2/10%WO3 Nanocomposite

The band alignment of the TiO2/10%WO3 heterostructure plays a crucial role in its enhanced photocatalytic performance. For a semiconductor, the CB and VB potentials vs. normal hydrogen electrode (NHE) can be estimated using these equations:
E C B = χ E e 0.5 E g
E V B = E C B + E g
where ECB is the conduction band edge potential (V vs. NHE), EVB is the valence band edge potential (V vs. NHE), χ is the absolute electronegativity of the semiconductor (eV), Eg is the band gap energy (eV), and Ee is the energy of free electrons on the hydrogen scale (4.5 eV).
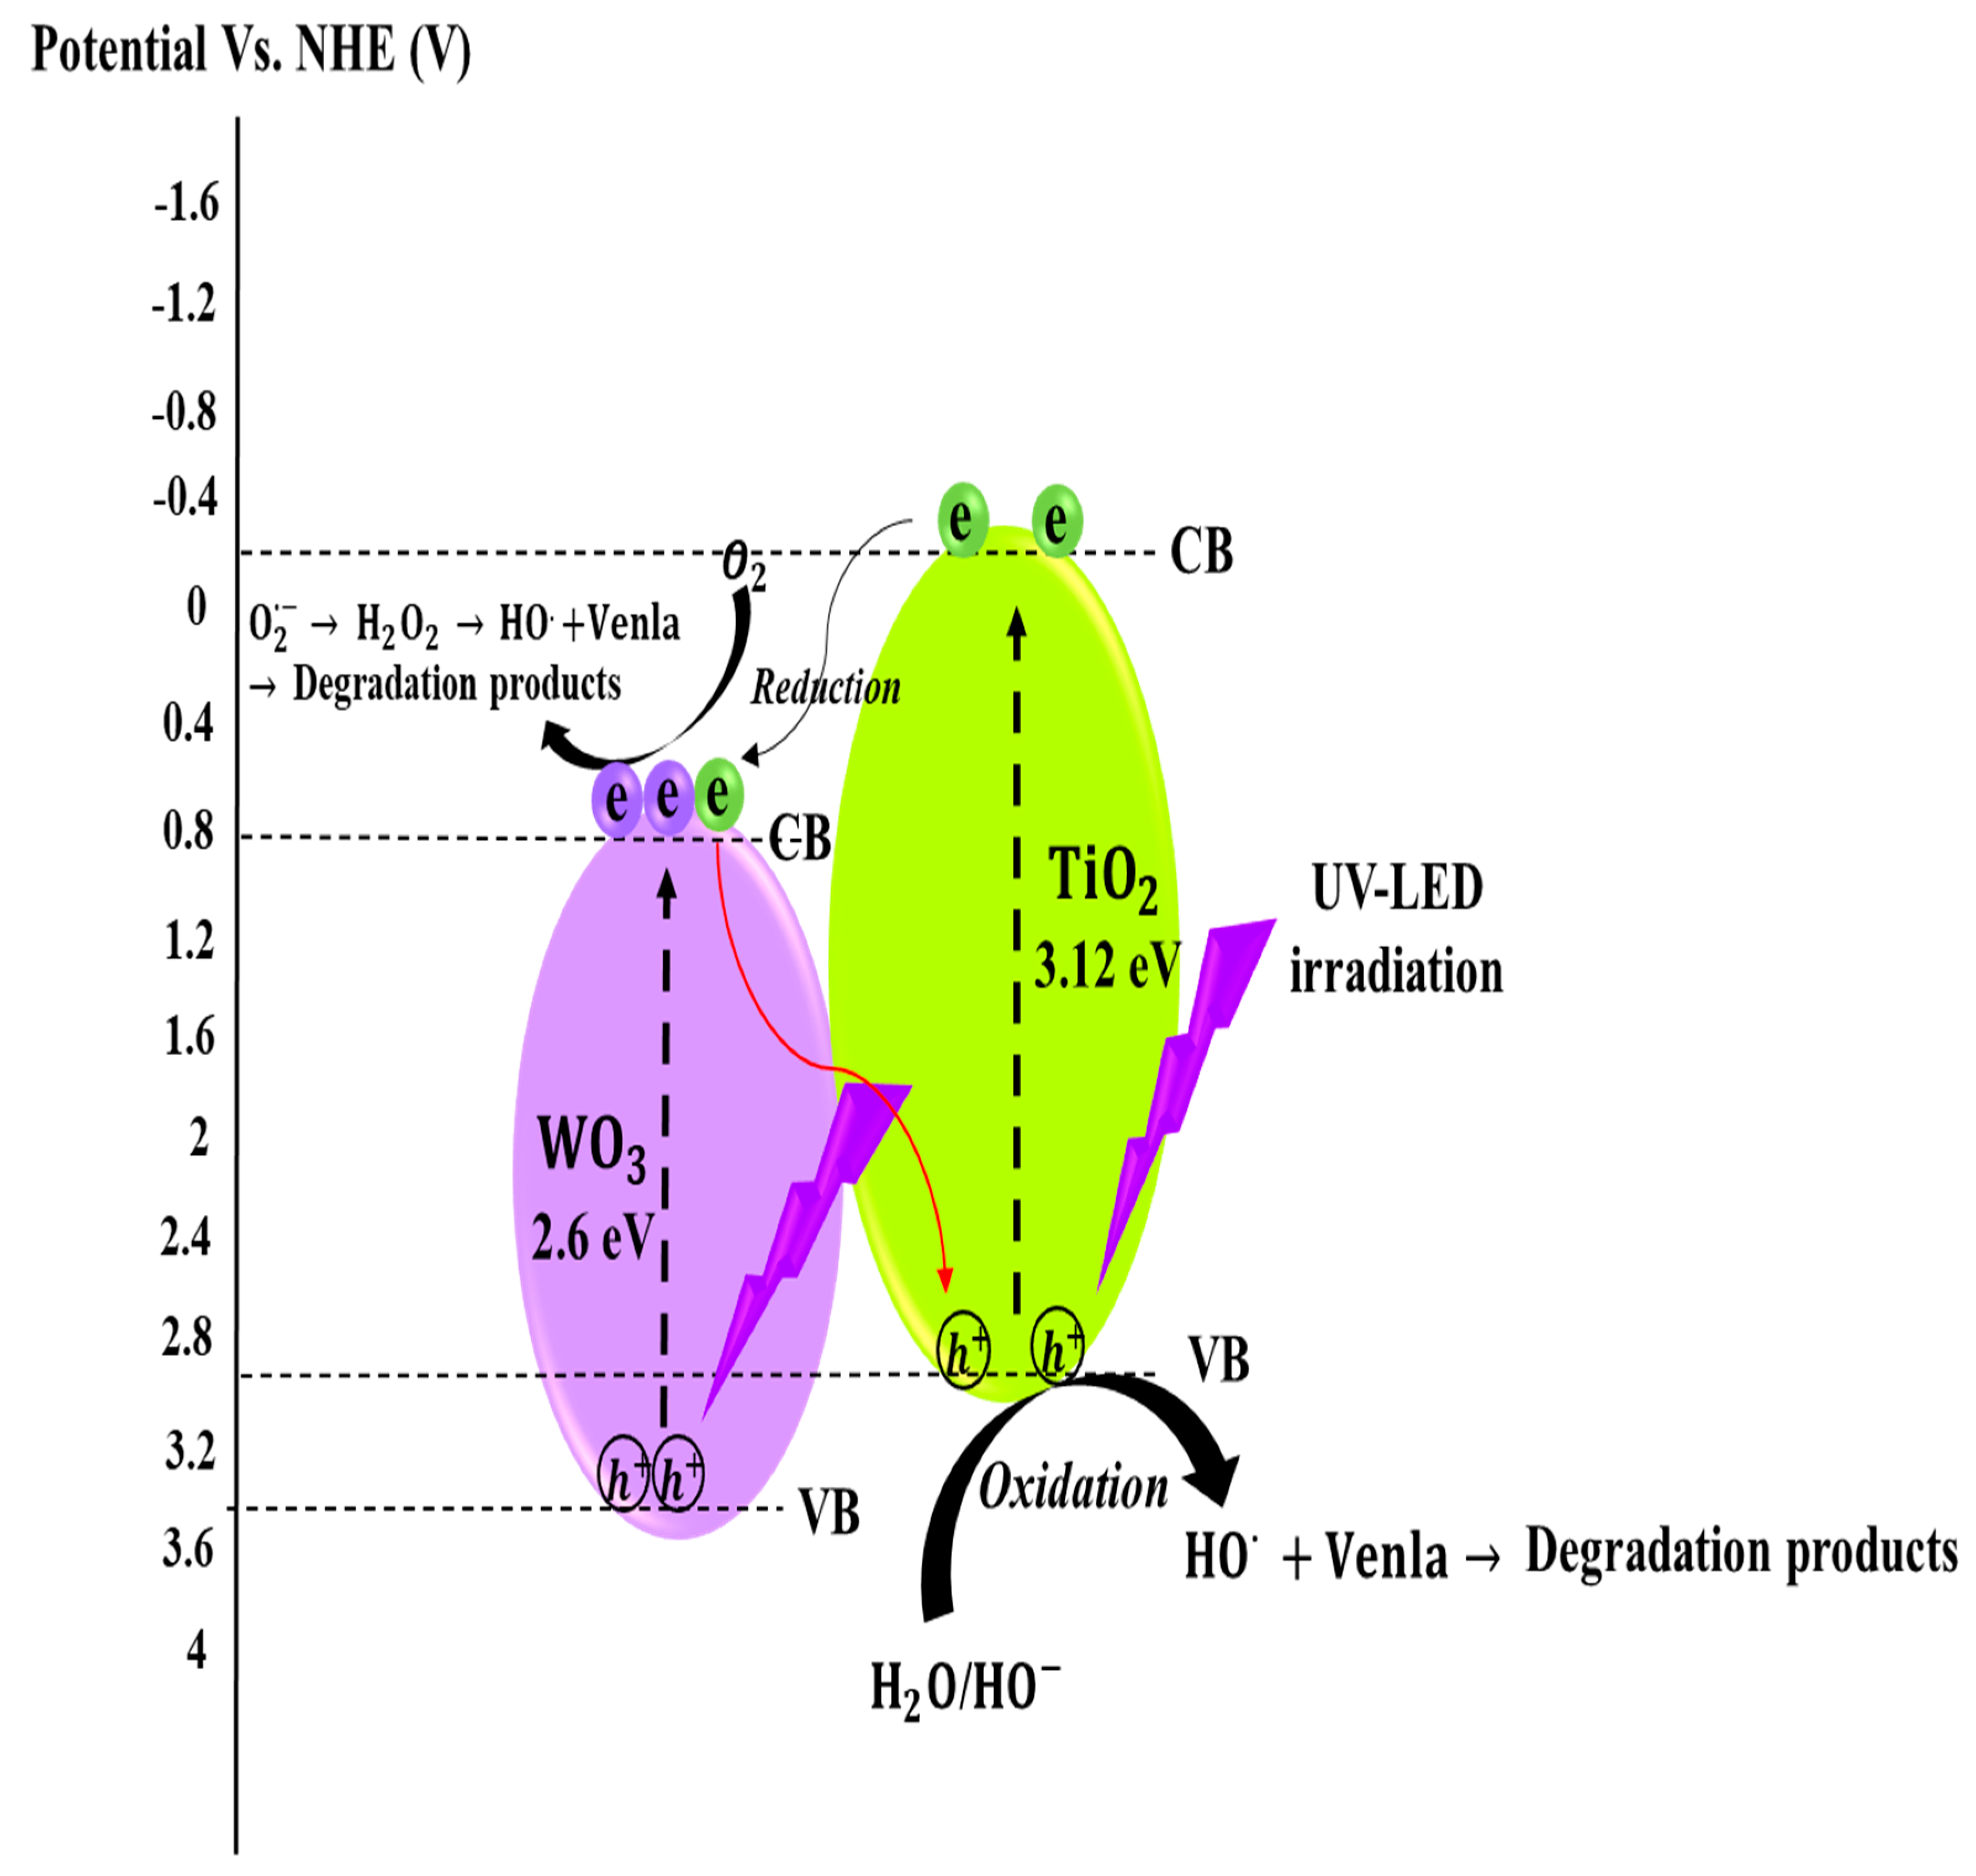
TiO2 exhibits a conduction band (CB) potential of −0.25 V and a valence band (VB) potential of +2.87 V (vs. NHE). In comparison, WO3 shows a CB at +0.79 V and a VB at +3.39 V. Upon illumination, as presented in Figure 12, electrons excited into TiO2 CB readily transfer to the lower-energy CB of WO3, leading to electron accumulation in WO3. In contrast, the corresponding holes remain in the VB of TiO2. This spatial separation effectively suppresses electron–hole recombination. Owing to its positive potential, the TiO2 VB (+2.87 V) possesses sufficient power to generate hydroxyl radicals (HO·) from water or hydroxide ions, and can also directly oxidize adsorbed Venla molecules. In contrast, electrons accumulated in the WO3 CB (+0.79 V) are not thermodynamically capable of reducing O2 to superoxide radicals (O2·), rendering this pathway negligible. Consequently, the degradation of Venla is primarily driven by direct hole oxidation and HO· attack, with the TiO2/WO3 heterojunction ensuring more efficient charge separation and sustained photocatalytic activity.

4. Conclusions

This study demonstrated that the addition of WO3 to TiO2 markedly enhances the photocatalytic degradation of Venlafaxine under UV-LEDs irradiation as a safe, energy-efficient, and compact alternative for water purification. Among the synthesized materials, the hydrothermally prepared TiO2/10%WO3 nanocomposite achieved the highest degradation efficiency, outperforming both the pure TiO2 and the nanocomposite obtained from commercial oxides. The superior activity is attributed to the formation of a heterojunction, which promotes efficient charge separation and suppresses electron–hole recombination. In contrast, higher WO3 loadings (20-30 wt.%) led to reduced performance, likely due to surface coverage effects and the introduction of recombination sites. Characterization analyses reinforced these findings: Raman and FTIR spectra confirmed the successful formation of TiO2/WO3 heterostructure, XRD analysis confirmed the coexistence of TiO2 phases together with monoclinic WO3, with no evidence of secondary phases, thereby verifying the structural purity of the synthesized nanocomposites. SEM and TEM micrographs revealed homogeneous thin films with favorable morphology at the nanoscale, as confirmed by TEM, thereby indicating enhanced UV-light absorption. Photocatalytic efficiency decreased with increasing initial pollutant concentration, particularly at 30 mg/L Venla, due to limited active sites and reduced light penetration. Importantly, the TiO2/10%WO3 thin film also demonstrated excellent reusability over three consecutive cycles with the same efficiency (~50%/1 h), highlighting practical advantages such as immobilized thin-film configuration, reusability, and avoidance of slurry separation. which underlines its potential as a promising photocatalyst for groundwater purification.

Author Contributions

Investigation, M.G.; Writing original draft, M.G.; Data Curation, M.G.; Conceptualisation, T.S. and S.K.; writing-review and editing, C.S., S.K., S.M. and A.W.; Data Curation, F.T. All authors have read and agreed to the published version of the manuscript.

Funding

This research received no external funding.

Data Availability Statement

The raw data supporting the conclusions of this article will be made available by the authors on request.

Conflicts of Interest

The authors declare no conflict of interest.

References

  1. Bergmann, T.A.D.; Witte, F.-A.; Buser, A.; Heberer, S.; Eberlein, I.; Hildebrandt, A.; Küster, A. Pharmaceuticals in the Environment-Global Occurrences and Perspectives. Environ. Toxicol. Chem. 2016, 35, 823–835. [Google Scholar] [CrossRef]
  2. Corcoran, J.; Jacobs, M.; Winter, M.J.; Tyler, C.R. Pharmaceuticals in the Aquatic Environment: A Critical Review of the Evidence for Health Effects in Fish. Criti. Rev. Toxicol. 2010, 40, 287–304. [Google Scholar] [CrossRef] [PubMed]
  3. Schlich, K.; Hund-Rinke, K. Influence of Soil Properties on the Effect of Silver Nanomaterials on Microbial Activity in Five Soils. Environ. Pollut. 2015, 196, 321–330. [Google Scholar] [CrossRef]
  4. Chen, Y.; Wang, J.; Xu, P.; Xiang, J.; Xu, D.; Cheng, P.; Wang, X.; Wu, L.; Zhang, N.; Chen, Z. Antidepressants as Emerging Contaminants: Occurrence in Wastewater Treatment Plants and Surface Waters in Hangzhou, China. Front. Public Health 2022, 10, 963257. [Google Scholar] [CrossRef] [PubMed]
  5. Ferreiro, C.; Gómez-Motos, I.; Lombraña, J.I.; de Luis, A.; Villota, N.; Ros, O.; Etxebarria, N. Contaminants of Emerging Concern Removal in an Effluent of Wastewater Treatment Plant under Biological and Continuous Mode Ultrafiltration Treatment. Sustainability 2020, 12, 725. [Google Scholar] [CrossRef]
  6. Hernández-Zamora, M.; Cruz-Castillo, L.M.; Martínez-Jerónimo, L.; Martínez-Jerónimo, F. Diclofenac Produces Diverse Toxic Effects on Aquatic Organisms of Different Trophic Levels, Including Microalgae, Cladocerans, and Fish. Water 2025, 17, 1489. [Google Scholar] [CrossRef]
  7. Fu, L.A.; McCarthy, R.A.; Hawkins, I.J.; West, C.; Koenig, W.; Smith, H.I.; Martin, A.E.; Adams, D.S. Assessing Pharmaceutical Removal and Reduction in Toxicity Provided by Advanced Wastewater Treatment Systems. Environ. Sci.: Water Res. Technol. 2020, 6, 62–77. [Google Scholar] [CrossRef]
  8. Elskens, C.J.; Van de Meulebroeck, T.V.; Lübberding, T.; Van den Meersche, P.F.; Kraak, M.H.S. Removal of Psychopharmaceuticals from WWTP Effluent by an Algae–Mussel Trophic Cascade: A Potential Nature-Based Solution? Environ. Sci. Water Res. Technol. 2025, 11, 1643–1656. [Google Scholar] [CrossRef]
  9. Balasubramanian, S.; Gnanasekar, D.; Anandan, S.; Arulraj, R.; Sankaran, A.K.S. Advanced Photocatalytic Materials-Based Degradation of Micropollutants and Their Use in Hydrogen Production—A Review. RSC Adv. 2024, 14, 14392–14424. [Google Scholar] [CrossRef]
  10. Antonopoulou, M. Homogeneous and Heterogeneous Photocatalysis for the Treatment of Pharmaceutical Industry Wastewaters: A Review. Toxics 2022, 10, 539. [Google Scholar] [CrossRef]
  11. Friedmann, D. A General Overview of Heterogeneous Photocatalysis as a Remediation Technology for Wastewaters Containing Pharmaceutical Compounds. Water 2022, 14, 3588. [Google Scholar] [CrossRef]
  12. Basavarajappa, P.S.; Patil, S.B.; Ganganagappa, N.; Reddy, K.R.; Raghu, A.V.; Reddy, C.V. Recent Progress in Metal-Doped TiO2, Non-Metal Doped/Co-Doped TiO2 and TiO2 Nanostructured Hybrids for Enhanced Photocatalysis. Int. J. Hydrogen Energy 2020, 45, 7764–7778. [Google Scholar] [CrossRef]
  13. Huang Kong, E.D.; Lai, C.W.; Juan, J.C.; Pang, Y.L.; Khe, C.S.; Badruddin, I.A.; Gapsari, F.; Anam, K. Recent Advances in Titanium Dioxide Bio-Derived Carbon Photocatalysts for Organic Pollutant Degradation in Wastewater. iScience 2025, 28, 112368. [Google Scholar] [CrossRef]
  14. Tanos, F.; Razzouk, A.; Lesage, G.; Cretin, M.; Bechelany, M. A Comprehensive Review on Modification of Titanium Dioxide-Based Catalysts in Advanced Oxidation Processes for Water Treatment. Chem. Sus. Chem. 2024, 17, e202301139. [Google Scholar] [CrossRef]
  15. He, X.; Gong, Y.; Niu, L.; Li, C. Development of Defect-Rich WO3-x/TiO2 Heterojunction Toward Dual-Functional Enhancement: Boosting SERS and Photocatalytic Performance. Nanomaterials 2025, 15, 521. [Google Scholar] [CrossRef]
  16. Levinas, R.; Podlaha, E.; Tsyntsaru, N.; Cesiulis, H. Composites Based on Electrodeposited WO3 and TiO2 Nanoparticles for Photoelectrochemical Water Splitting. Materials 2024, 17, 4914. [Google Scholar] [CrossRef]
  17. Palma, F.; Baldelli, G.; Schiavano, G.F.; Amagliani, G.; Aliano, M.P.; Brandi, G. Use of Eco-Friendly UV-C LEDs for Indoor Environment Sanitization: A Narrative Review. Atmosphere 2022, 13, 1411. [Google Scholar] [CrossRef]
  18. Mach, V.; Dvorak, L.; Dvorakova, H.; Mikulikova, L.; Kolarova, K.; Černy, L. Role of Lamp Type in Conventional Batch and Micro-Photoreactor for Photocatalytic Hydrogen Production. Front. Chem. Sec. Photocatal. Photochem. 2023, 11, 1271410. [Google Scholar] [CrossRef]
  19. Shephered, M.T.; Newman, J.P.; Kubheka, O. Effect of TiO2 Phase on the Photocatalytic Degradation of Methylene Blue Dye. Phys. Chem. Earth Parts A/B/C 2020, 118–119, 102900. [Google Scholar] [CrossRef]
  20. Dhanalekshmi, K.I.; Umapathy, M.J.; Magesan, P.; Zhang, X. Biomaterial (Garlic and Chitosan)-Doped WO3-TiO2 Hybrid Nanocomposites: Their Solar Light Photocatalytic and Antibacterial Activities. ACS Omega 2020, 5, 31673–31683. [Google Scholar] [CrossRef]
  21. Odhiambo, V.O.; Ongarbayeva, A.; Kéri, O.; Simon, L.; Szilágyi, I.M. Synthesis of TiO2/WO3 Composite Nanofibers by a Water-Based Electrospinning Process and Their Application in Photocatalysis. Nanomaterials 2020, 10, 882. [Google Scholar] [CrossRef]
  22. Dávidné, N.; Tamás, F.; Eszter, D.; Ágnes, S.; Krisztina, L.; Imre, M.S. Photocatalytic WO3/TiO2 Nanowires: WO3 Polymorphs Influencing the Atomic Layer Deposition of TiO2. RSC Adv. 2016, 6, 95369–95377. [Google Scholar] [CrossRef]
  23. Suvarna, R.; Bathe, P.S.P. Electrochemical Behavior of TiO2 Nanoparticle Doped WO3 Thin Films. Materials 2014, 5, 642069. [Google Scholar] [CrossRef]
  24. Yang, Y.; Ma, G.; Hu, X.; Wang, W.; Du, Z.; Wang, Y.; Gong, X.Z.; Tan, H.; Guo, F.; Tang, J. Hollow Flower-Like WO3@TiO2 Heterojunction Microspheres for the Photocatalytic Degradation of Rhodamine B and Tetracycline. RSC Adv. 2025, 15, 12629–12644. [Google Scholar] [CrossRef] [PubMed]
  25. Boga, B.; Székely, I.; Pap, Z.; Baia, L.; Baia, M. Detailed Spectroscopic and Structural Analysis of TiO2/WO3 Composite Semiconductors. J. Spectrosc. 2018, 1–7, 6260458. [Google Scholar] [CrossRef]
  26. Tsay, C.-Y.; Hsu, T.-Y.; Lee, G.-J.; Chen, C.-Y.; Chang, Y.-C.; Chen, J.-H.; Wu, J.J. Hydrothermal Synthesis of Nanocomposites Combining Tungsten Trioxide and Zinc Oxide Nanosheet Arrays for Improved Photocatalytic Degradation of Organic Dye. Nanomaterials 2025, 15, 772. [Google Scholar] [CrossRef] [PubMed]
  27. Li, W.; Chen, C.; Yang, R.; Cheng, S.; Sang, X.; Zhang, M.; Zhang, J.; Wang, Z.; Li, Z. Efficient and Stable Degradation of Triazophos Pesticide by TiO2/WO3 Nanocomposites with S-Scheme Heterojunctions and Oxygen Defects. Catalysts 2023, 13, 1136. [Google Scholar] [CrossRef]
  28. Lee, W.H.; Lai, C.W.; Hamid, S.B.A. One-Step Formation of WO3-Loaded TiO2 Nanotubes Composite Film for High Photocatalytic Performance. Materials 2015, 8, 2139–2153. [Google Scholar] [CrossRef]
  29. Paiu, M.; Lutic, D.; Favier, L.; Gavrilescu, M. Heterogeneous Photocatalysis for Advanced Water Treatment: Materials, Mechanisms, Reactor Configurations, and Emerging Applications. Appl. Sci. 2025, 15, 5681. [Google Scholar] [CrossRef]
  30. Sharma, M.; Mishra, M.K.; Patel, S.; Kumar, R.; Dubey, K. Visible-Light-Driven Photocatalytic Degradation of Tetracycline Using Heterostructured Cu2O–TiO2 Nanotubes, Kinetics, and Toxicity Evaluation of Degraded Products on Cell Lines. ACS Omega 2022, 7, 33572–33586. [Google Scholar] [CrossRef]
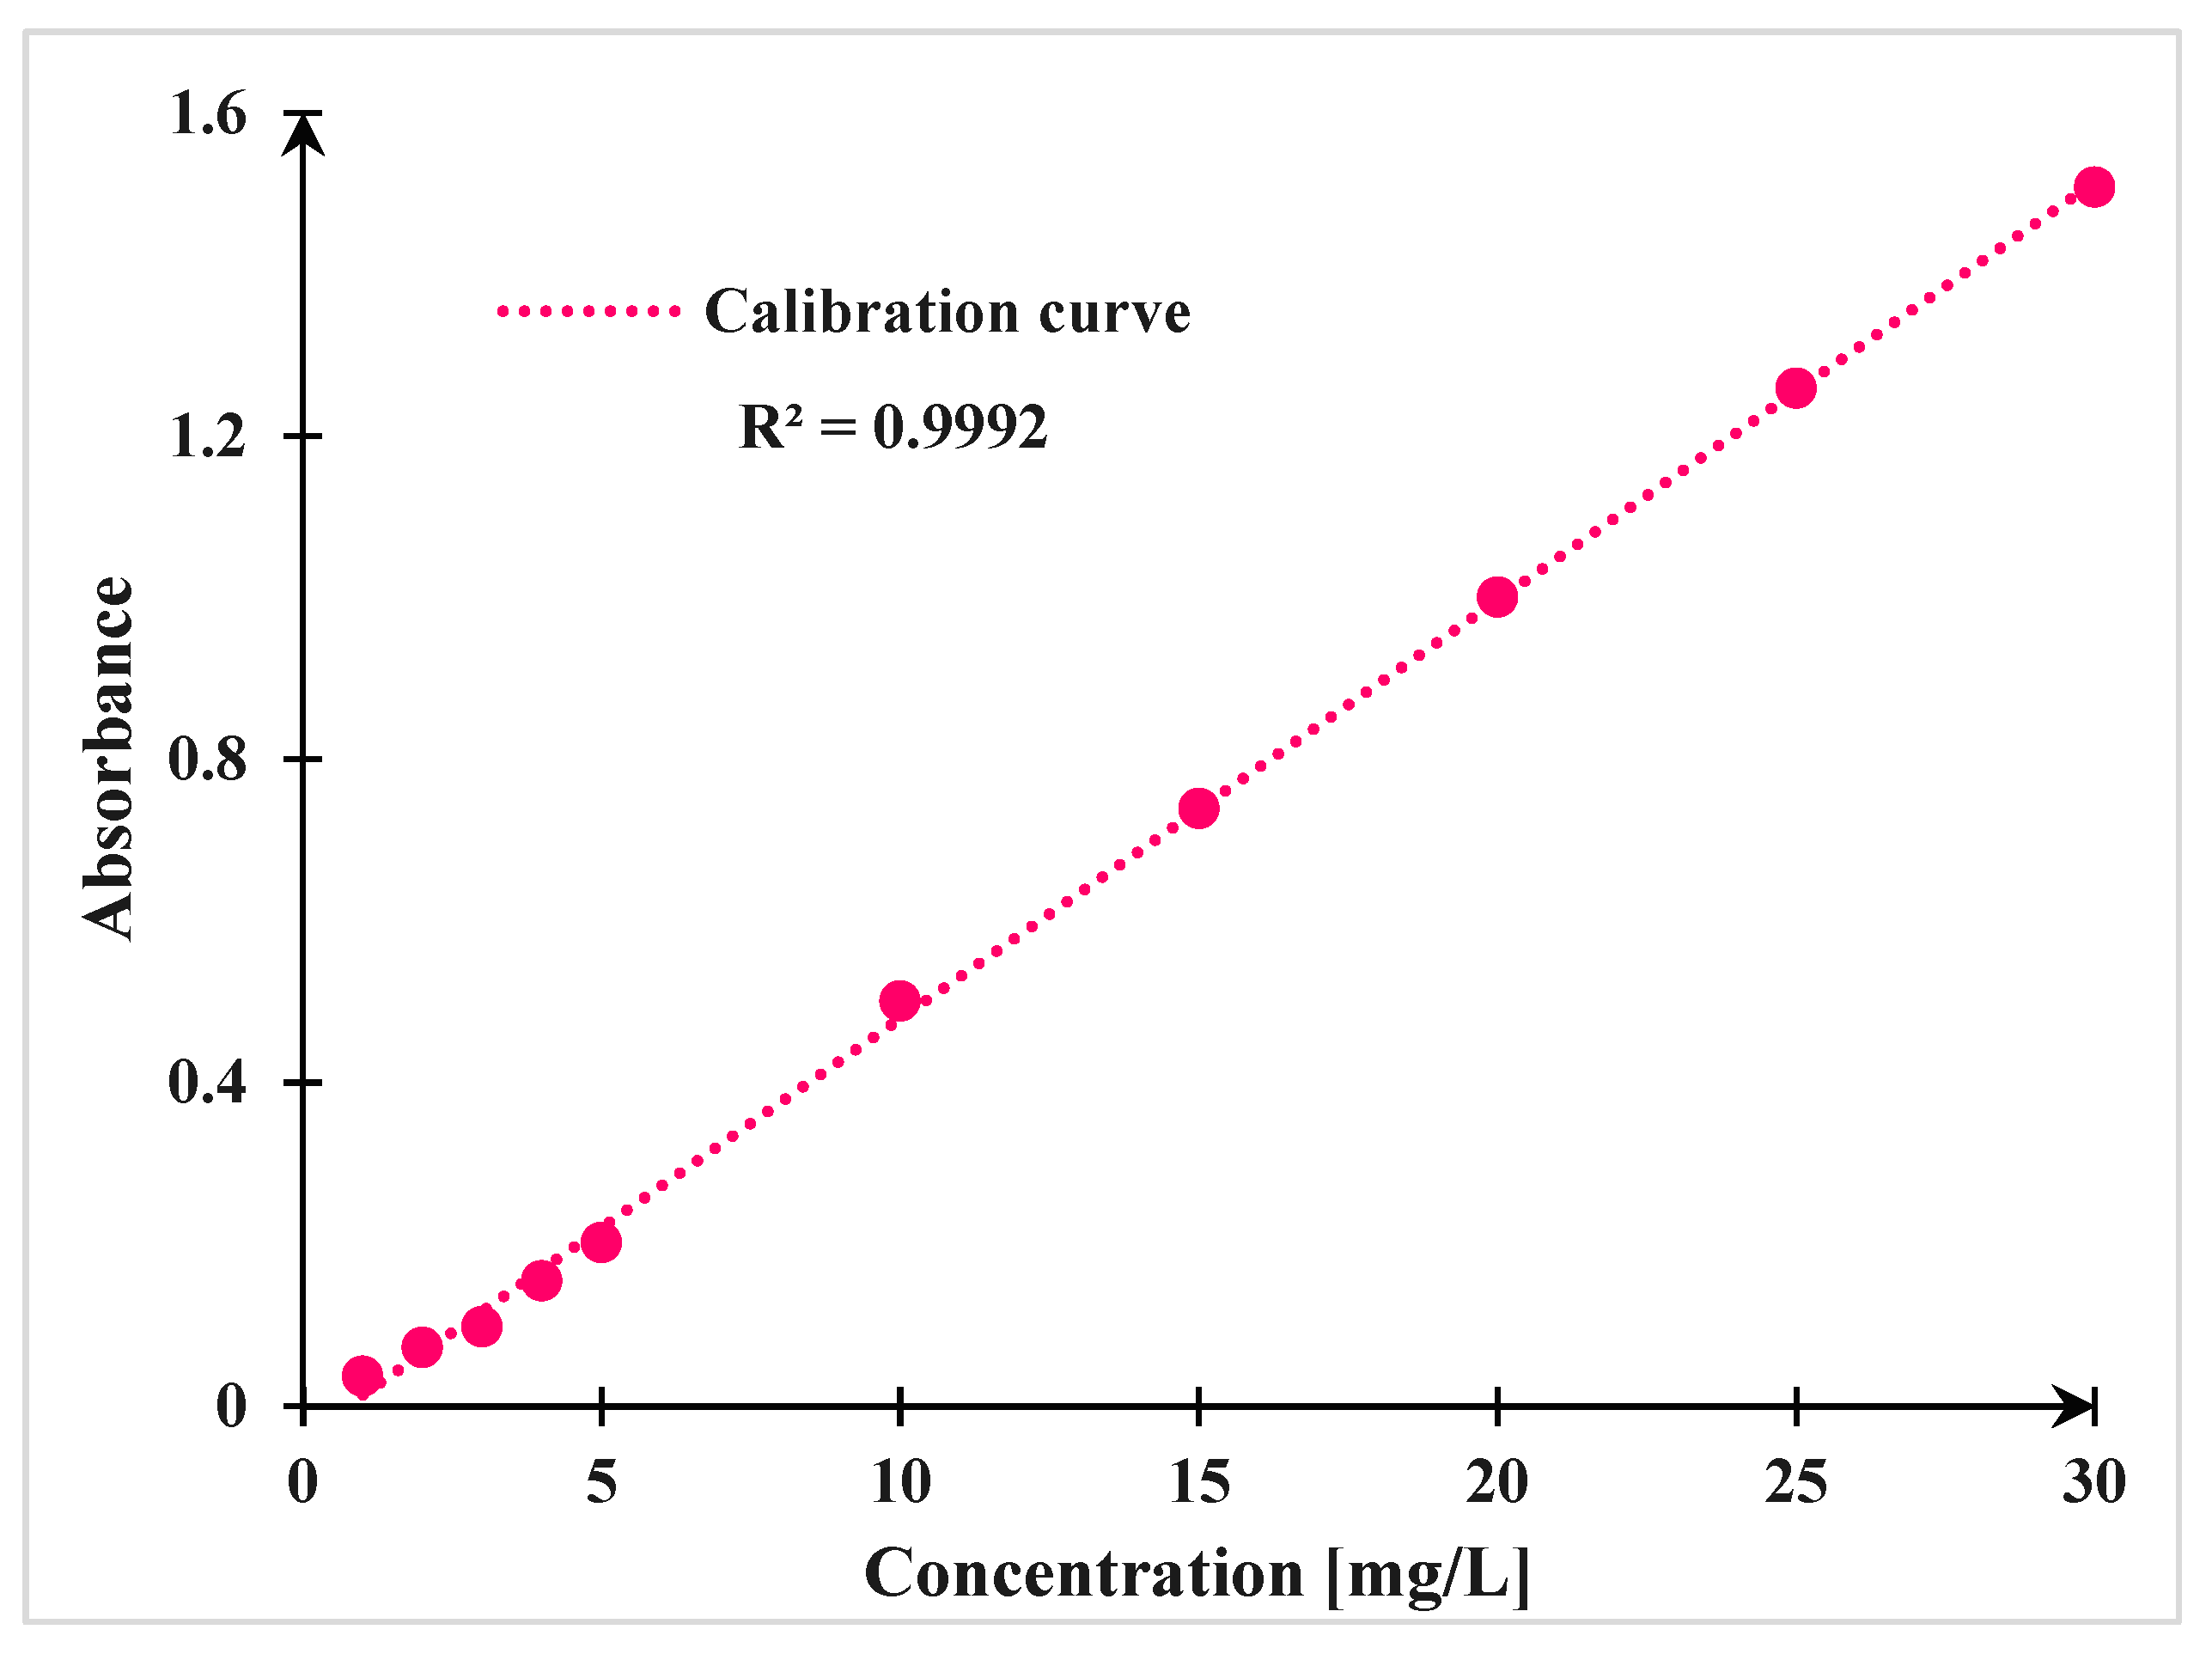
Figure 1. Calibration curve of Venlafaxine.
Environments 12 00359 g001
Figure 2. (a) FTIR spectra of nanocomposite TiO2/WO3 (0, 5, 10, 20, 30, and 100 wt.% WO3) and (b) comparison between TiO2/10%WO3 (S.O) and TiO2/10%WO3 (C.O).
Environments 12 00359 g002
Figure 3. XRD diffractogrammes of TiO2 and TiO2/WO3 nanocomposites. Green stars represent anatase, orange stars represent rutile and purple stars represent WO3.
Environments 12 00359 g003
Figure 4. Raman spectra of: TiO2, WO3, TiO2/10%WO3 (C.O), TiO2/10%WO3 (S.O).
Environments 12 00359 g004
Figure 5. The EDX spectra of hydrothermally synthesized TiO2/10%WO3 TiO2 and pure TiO2.
Environments 12 00359 g005
Figure 6. SEM micrographs of TiO2/WO3 films, with red circles indicating cracks and agglomerates of different dimensions on the surface.
Environments 12 00359 g006
Figure 7. (a,b) TEM micrograph of TiO2/WO3 nanocomposite, (c) HRTEM micrograph of TiO2/WO3 nanocomposite, and (d) SAED of TiO2/WO3 nanocomposite.
Environments 12 00359 g007
Figure 8. (a) UV-Vis diffuse reflectance spectra of TiO2, WO3, and TiO2/WO3 composites; (b) Tauc plots used to estimate the optical band gaps from the Kubelka-Munk-transformed reflectance data, where the dashed lines represent the extrapolation of the linear region to the (F(R). hν)1/2 gives the optical band gap energy.
Environments 12 00359 g008
Figure 9. (a) Comparison study of adsorption, photolysis, and photocatalysis, and (b) The effect of the method of nanocomposite preparation on the photocatalysis activity.
Environments 12 00359 g009
Figure 10. (a) The effect of the WO3 amount on the photocatalytic activity of TiO2, and (b) the effect of the Venlafaxine initial concentration.
Environments 12 00359 g010
Figure 11. (a) Kinetic degradation of Venlafaxine by TiO2/10%WO3, (b) testing of TiO2/10%WO3 stability.
Environments 12 00359 g011
Figure 12. Band alignment and charge transfer in TiO2/10%WO3 heterojunction.
Environments 12 00359 g012
Disclaimer/Publisher’s Note: The statements, opinions and data contained in all publications are solely those of the individual author(s) and contributor(s) and not of MDPI and/or the editor(s). MDPI and/or the editor(s) disclaim responsibility for any injury to people or property resulting from any ideas, methods, instructions or products referred to in the content.