1. Introduction
Over the past decade, China’s air pollution problem has been significantly improved under the vigorous efforts of the Chinese government [
1,
2]. However, fine particulate matter (PM
2.5) remains the primary air pollutant in major cities across western China [
3]. Extensive research has demonstrated that both long-term chronic and short-term acute exposure to PM
2.5 can result in a wide range of adverse health effects [
4,
5,
6]. Across various research populations, children and adolescents are more vulnerable to the harmful effects of air pollution than adults, as their bodies are still in the developmental stage [
7,
8]. Therefore, the PM
2.5 exposures in the daily lives of such groups should receive more attention.
Recent studies on children and adolescents’ exposure to air pollution in various micro-environments show that while commuting accounts for only a small portion of daily life, the exposure during this time contributes disproportionately to their total daily exposure [
8,
9,
10,
11]. This highlights the importance of gaining a deeper understanding of their exposure to PM
2.5 specifically during commuting. As governments increasingly promote active transportation, such as walking and cycling, emphasizing their considerable benefits for public health and the environment [
12], it becomes even more critical to examine the exposure risks associated with children and adolescents’ daily active commuting between home and school. Research in this area can assist the government in promoting active transportation while also maximizing the health and environmental benefits brought by such initiatives.
Recent studies have begun to examine children and adolescents’ exposure to air pollution during various modes of active commuting (e.g., walk, bike, inline skates, and scooter) between home and school [
8,
13,
14]. Walking and cycling are the most common modes of active commuting among such groups. Gilliland et al. investigated PM
2.5 exposure levels among 36 students over 101 routes from home to school. Their findings revealed that students who walked to school experienced lower average PM
2.5 concentrations than those who commuted by car or school bus [
13]. Gao et al. measured six schoolchildren’s exposure to PM and black carbon (BC) during daily school commutes, revealing that walking posed the lowest exposure levels, while e-bike rides led to higher PM
1 and BC exposure due to proximity to vehicle emissions [
15]. These two studies both employed personal monitoring, where students carried portable devices, offering a direct method to measure individual exposure across various commute modes. However, a notable limitation of this approach is the small sample size, constrained by the substantial costs and time required for such fieldwork, making it challenging to scale for larger studies. To facilitate large-scale population exposure assessment, modeling methods were introduced and have since been extensively applied in related research. Wolfe et al. used the AERMOD dispersion model to estimate NO
X concentrations in Detroit, analyzing NO
X exposure during home–school commutes under different modes (walking, automobile, and school bus) in two neighborhoods with contrasting air quality environments—one with heavy diesel and high traffic and the other with low diesel and low traffic [
16]. Air dispersion models offer a feasible approach to simulating ambient air pollutant concentrations when assessing schoolchildren’s exposure. However, implementing this method demands extensive parameters and input data, which can be challenging to obtain. On the other hand, the spatial resolution of dispersion models is also a significant concern [
17]. More recently, Ma et al. used a cost-effective and approachable land use regression (LUR) method to generate the distribution map of annual mean nitrogen dioxide (NO
2) concentrations for Auckland, assessing students’ dosage of NO
2 (using a terrain-based modeling approach) during their home–school walking commutes along (1) the shortest-distance route and (2) an alternative route with the lowest dosage [
18]. Boniardi et al. demonstrated that LUR models can predict black carbon (BC) exposure during home-to-school commutes, though the model tended to underestimate absolute concentrations by an average of 29% [
19]. Most previous LUR models are built primarily on stationary sites, with many of these sites located away from roads or sidewalks. Consequently, while these models can effectively estimate air pollutant concentrations in residential areas, directly using these estimations to assess exposure during commuting may introduce some bias. Therefore, the existing studies based on either personal monitoring or modeling approaches have certain limitations when it comes to large-scale estimation of students’ exposure to air pollution during their home–school active commuting.
More recently, large-scale taxi fleets equipped with air quality monitoring systems have been deployed across major cities in China [
17,
20,
21]. These fleets enable the collection of high-resolution spatiotemporal air quality data across the majority of urban road networks, offering valuable new opportunities for studying air pollution exposure during students’ active home–school commuting at the population scale. This study addresses the limitations of previous research [
22,
23] by utilizing on-road PM
2.5 measurements collected through a massive mobile monitoring network consisting of around 200 continuously operating taxis, combined with a GIS-terrain-based PM
2.5 dosage modeling approach. The aims of our study are to (1) assess students’ PM
2.5 dosages during morning (7:00 am–8:00 am) home–school active commuting (e.g., walking) along the shortest-distance route; (2) examine the feasibility of identifying a route for each student that minimizes PM
2.5 dosages during commuting, as an alternative to the shortest-distance route; (3) investigate the trade-off between the relative reduction in PM
2.5 dosage and the relative increase in route length when opting for the alternative lowest-dosage route; and (4) examine whether exposure inequalities exist among students of different family socioeconomic statuses (SES) during their walking home–school commutes. To the best of our knowledge, this is the first study to model students’ PM
2.5 doses during active home–school commuting at a population scale using such a large-scale on-road mobile monitoring PM
2.5 data, rather than relying on simulated PM
2.5 concentrations derived from models based on spatially sparse fixed monitoring stations. Thus, the findings in our study could offer valuable insights into commuter exposure and inspire future research.
2. Materials and Methods
2.1. Study Area
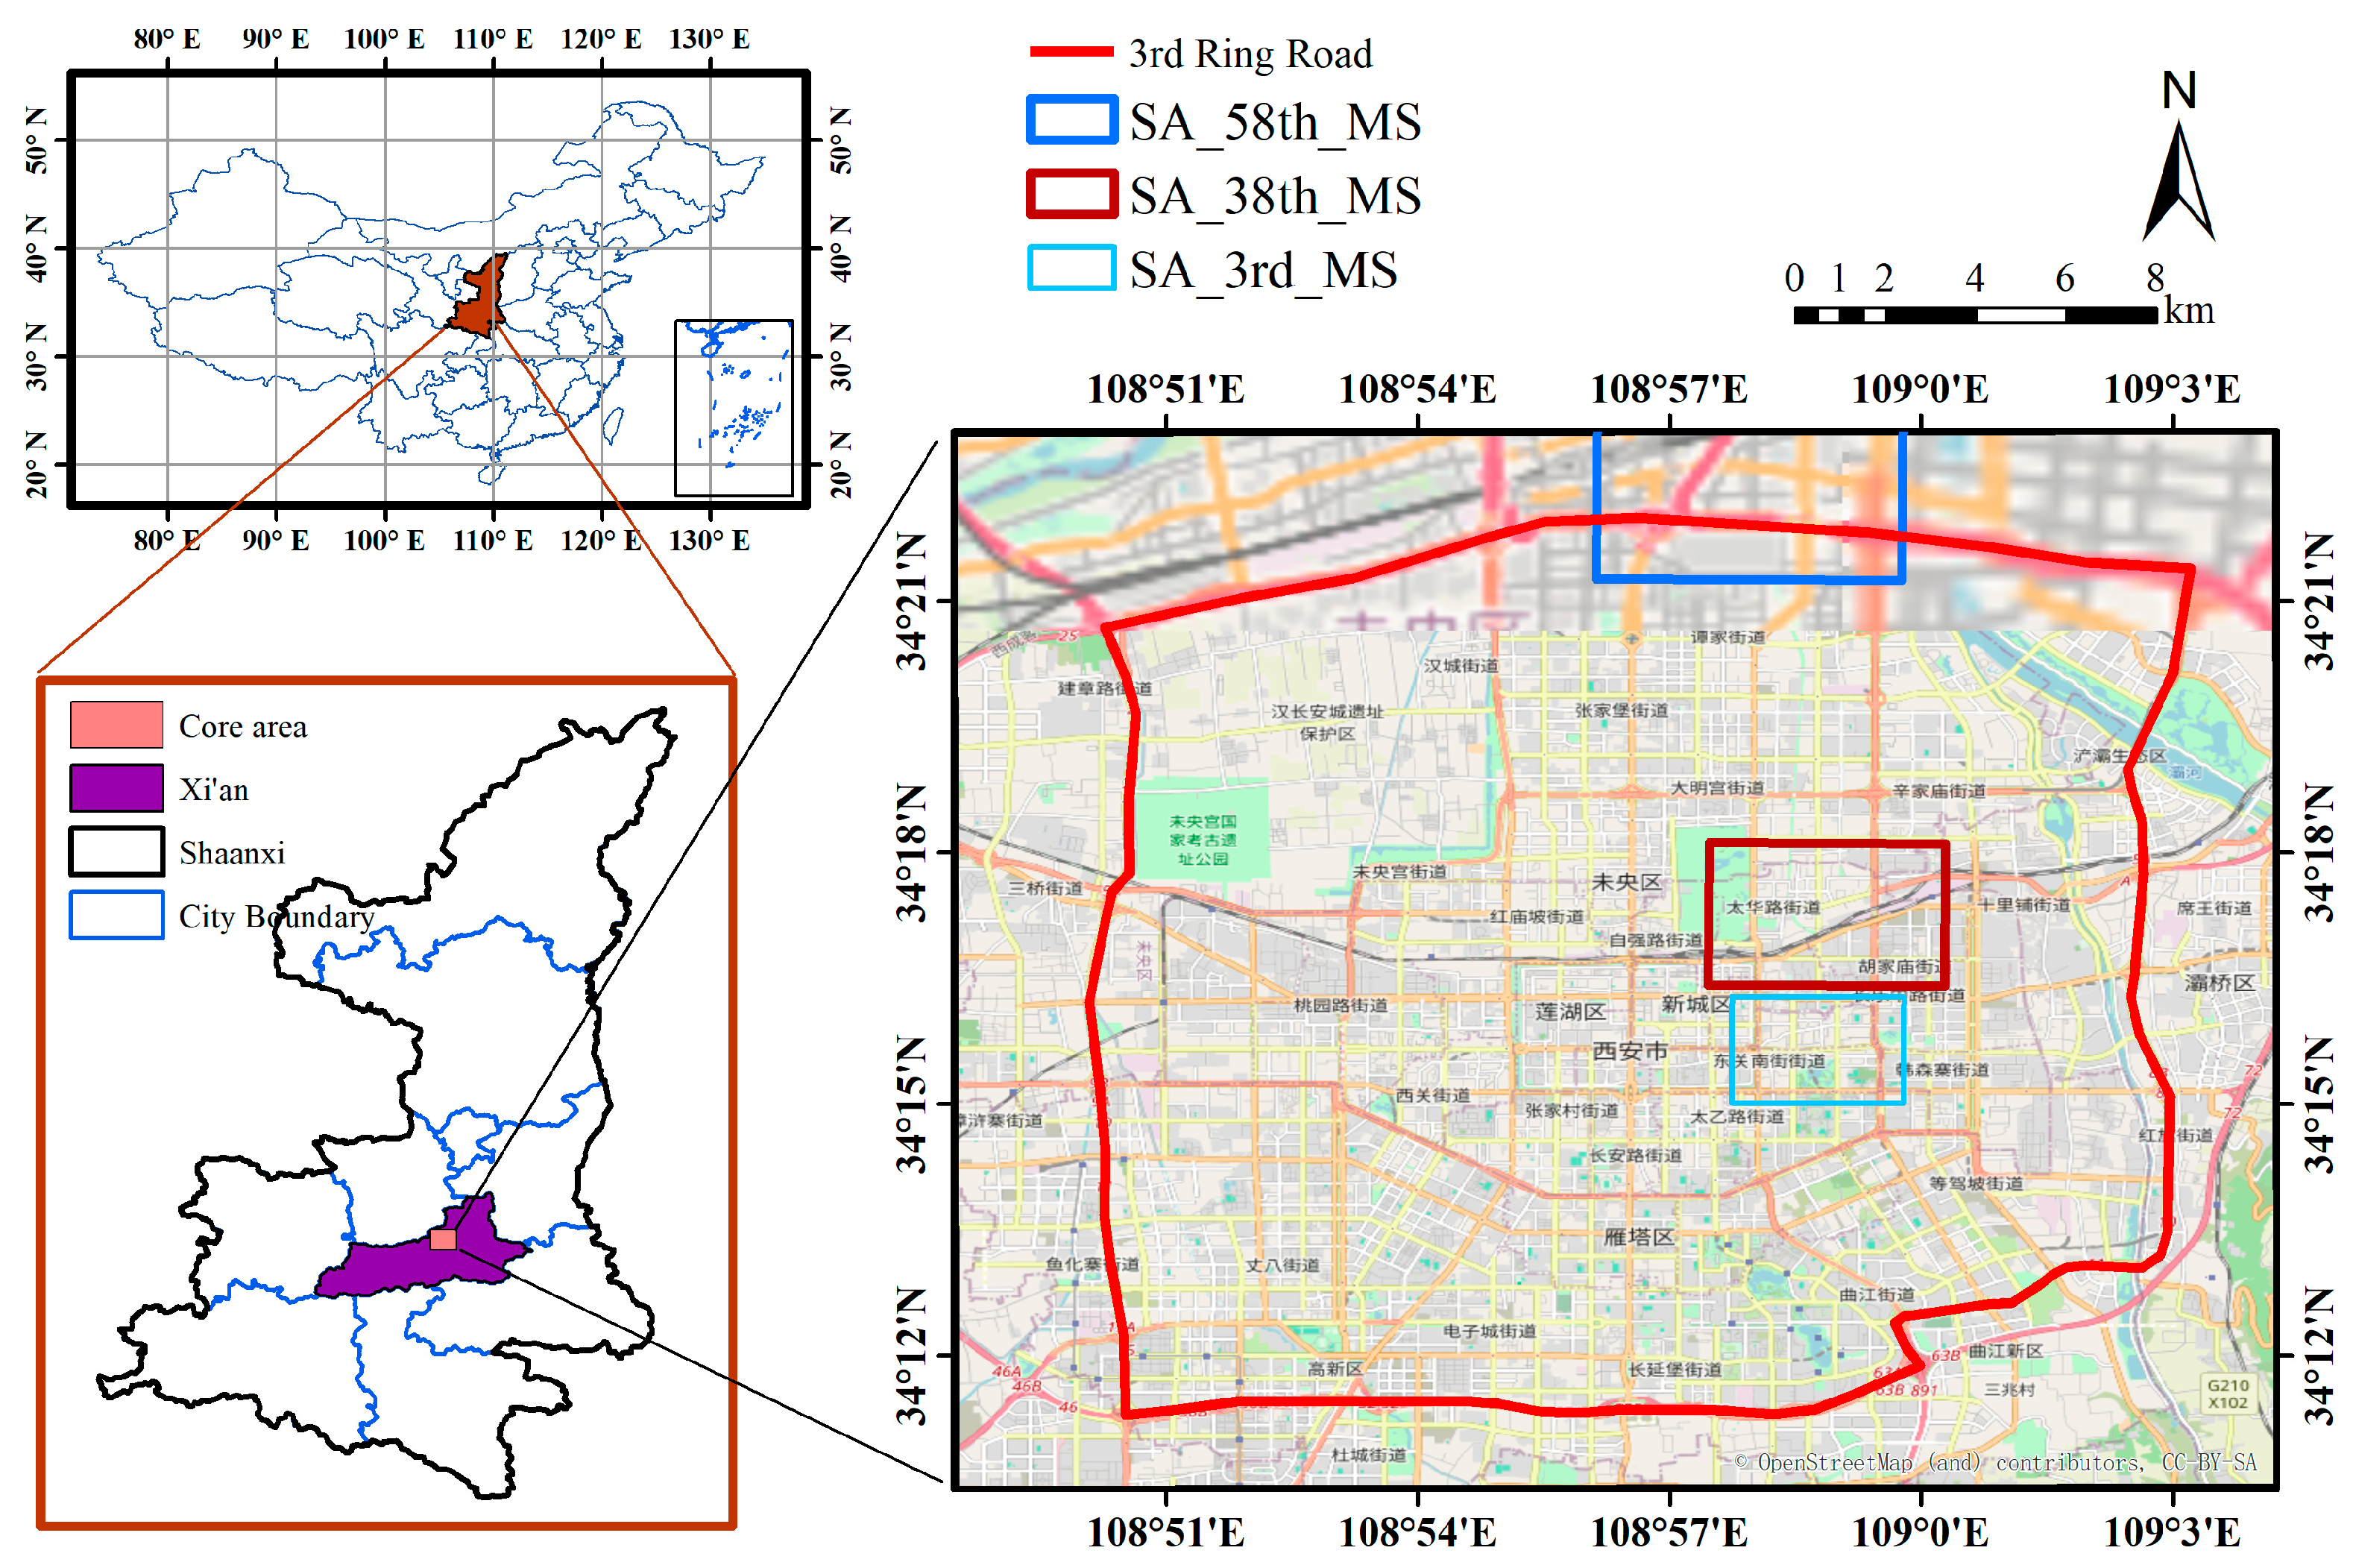
The study area for this research is Xi’an City, one of China’s national central megacities with a population of approximately 13.17 million, and we focus on the core area (approximately 400 km
2) within the Third Ring Road of Xi’an (
Figure 1). Xi’an occasionally experiences severe air pollution, with PM
2.5 being the primary air pollutant. The study area is characterized by a dense population, complex urban configuration, and numerous potential air pollution sources [
24,
25]. Such an environment is well-suited for studying PM
2.5 dose/exposure during active commuting among the student population.
2.2. Schools and School Districts
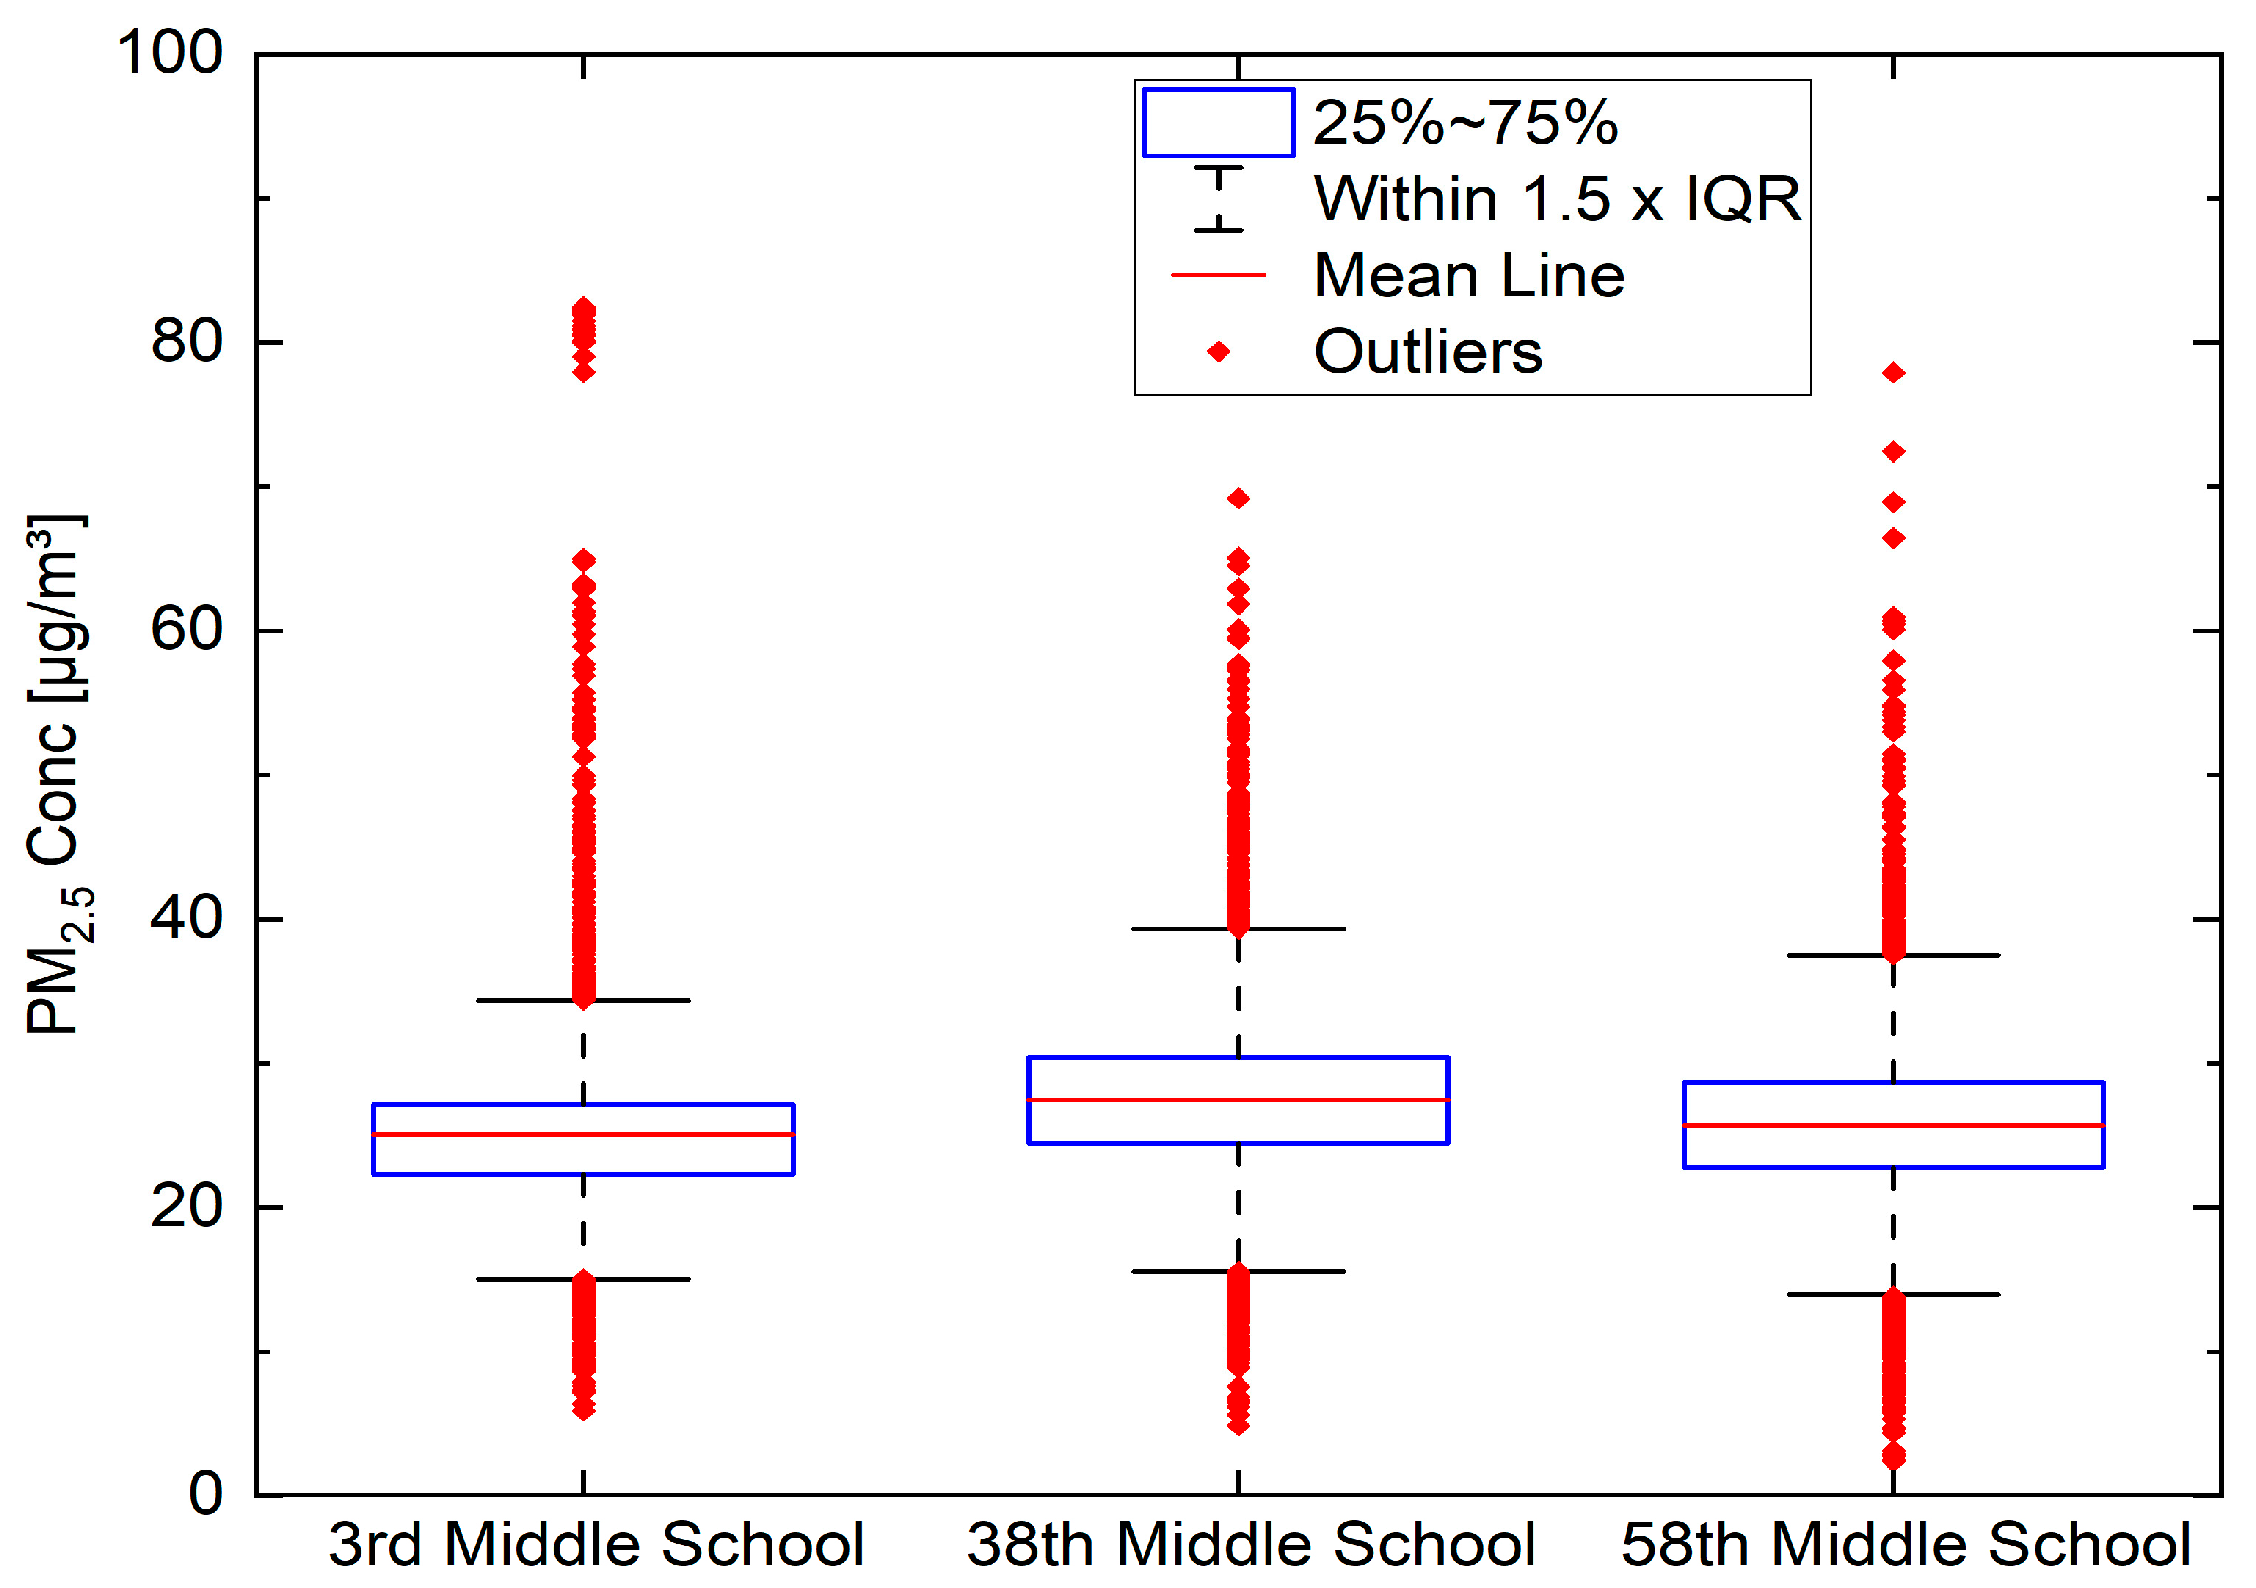
To evaluate students’ dose of ambient PM2.5 while walking home–school commuting, we selected three highly representative middle schools located in different districts in Xi’an. They are Xi’an 3rd middle school, 38th middle school, and 58th middle school. Our study focused exclusively on middle schools, as the majority of their students live within their corresponding school district boundaries (easier to simulate the home–school commute routes) and are more likely than primary school students to adopt active transportation.
Figure 2 illustrates the geographical locations and surrounding environments of the three selected middle schools.
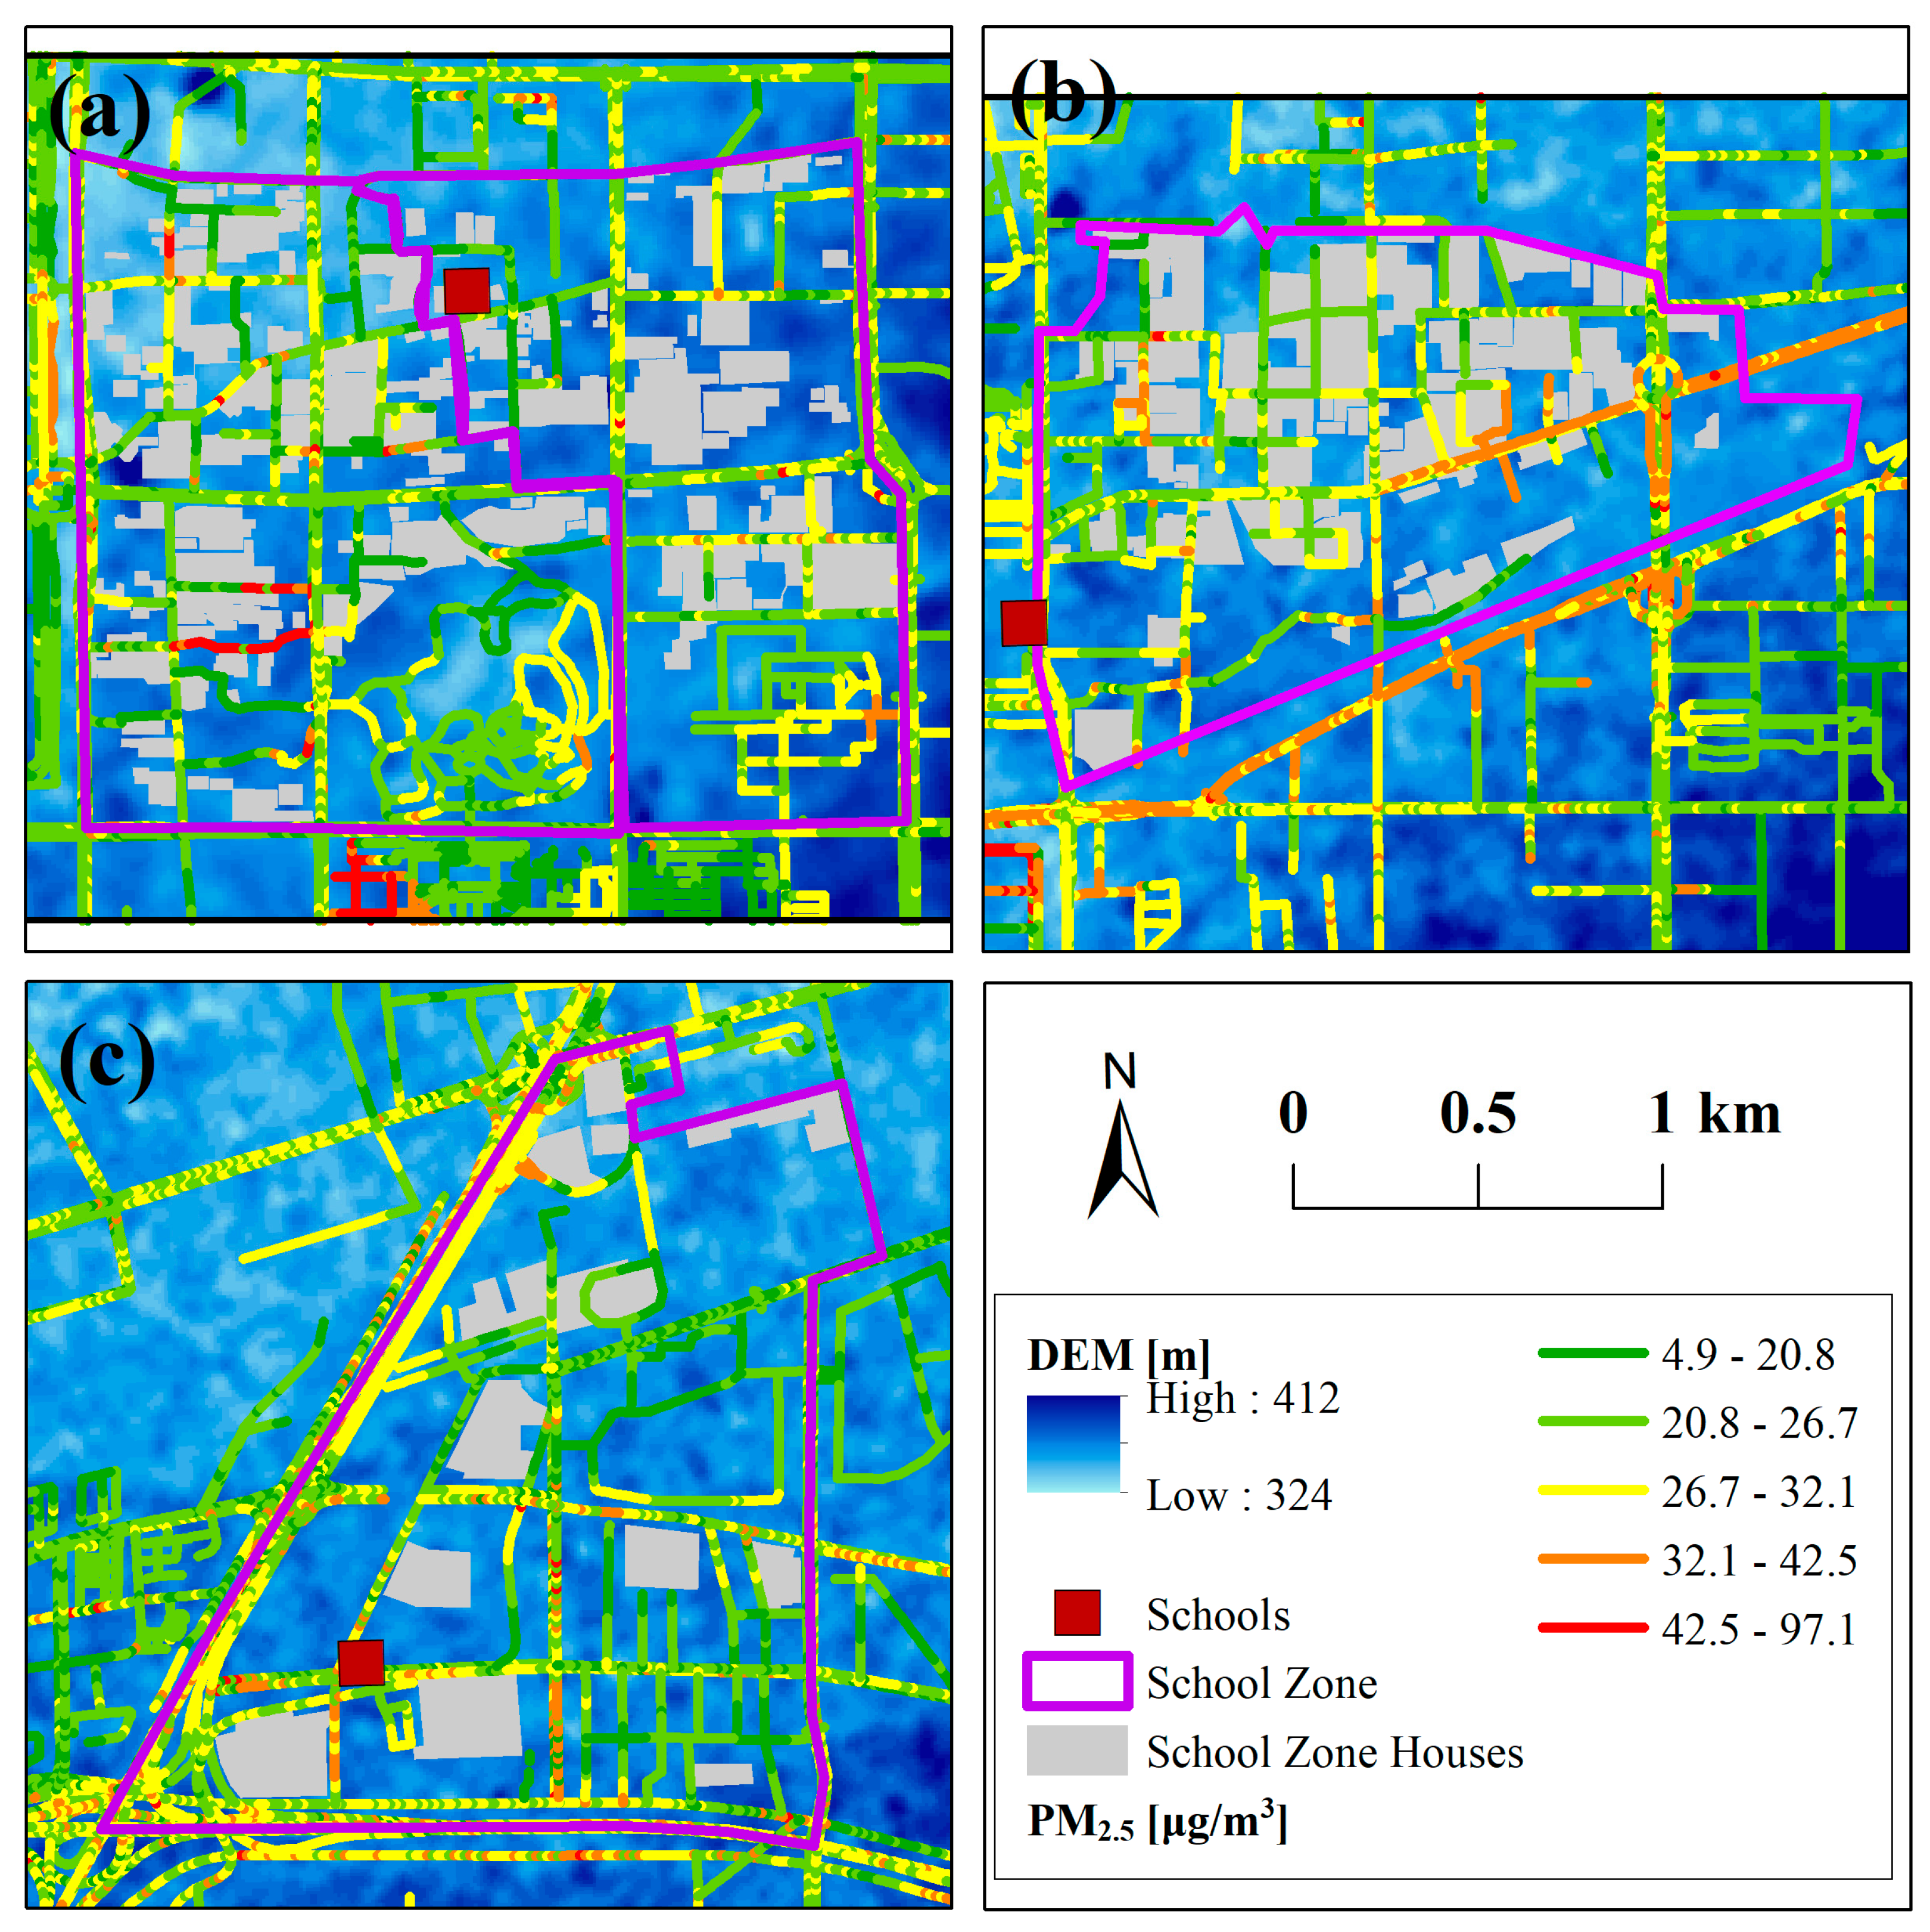
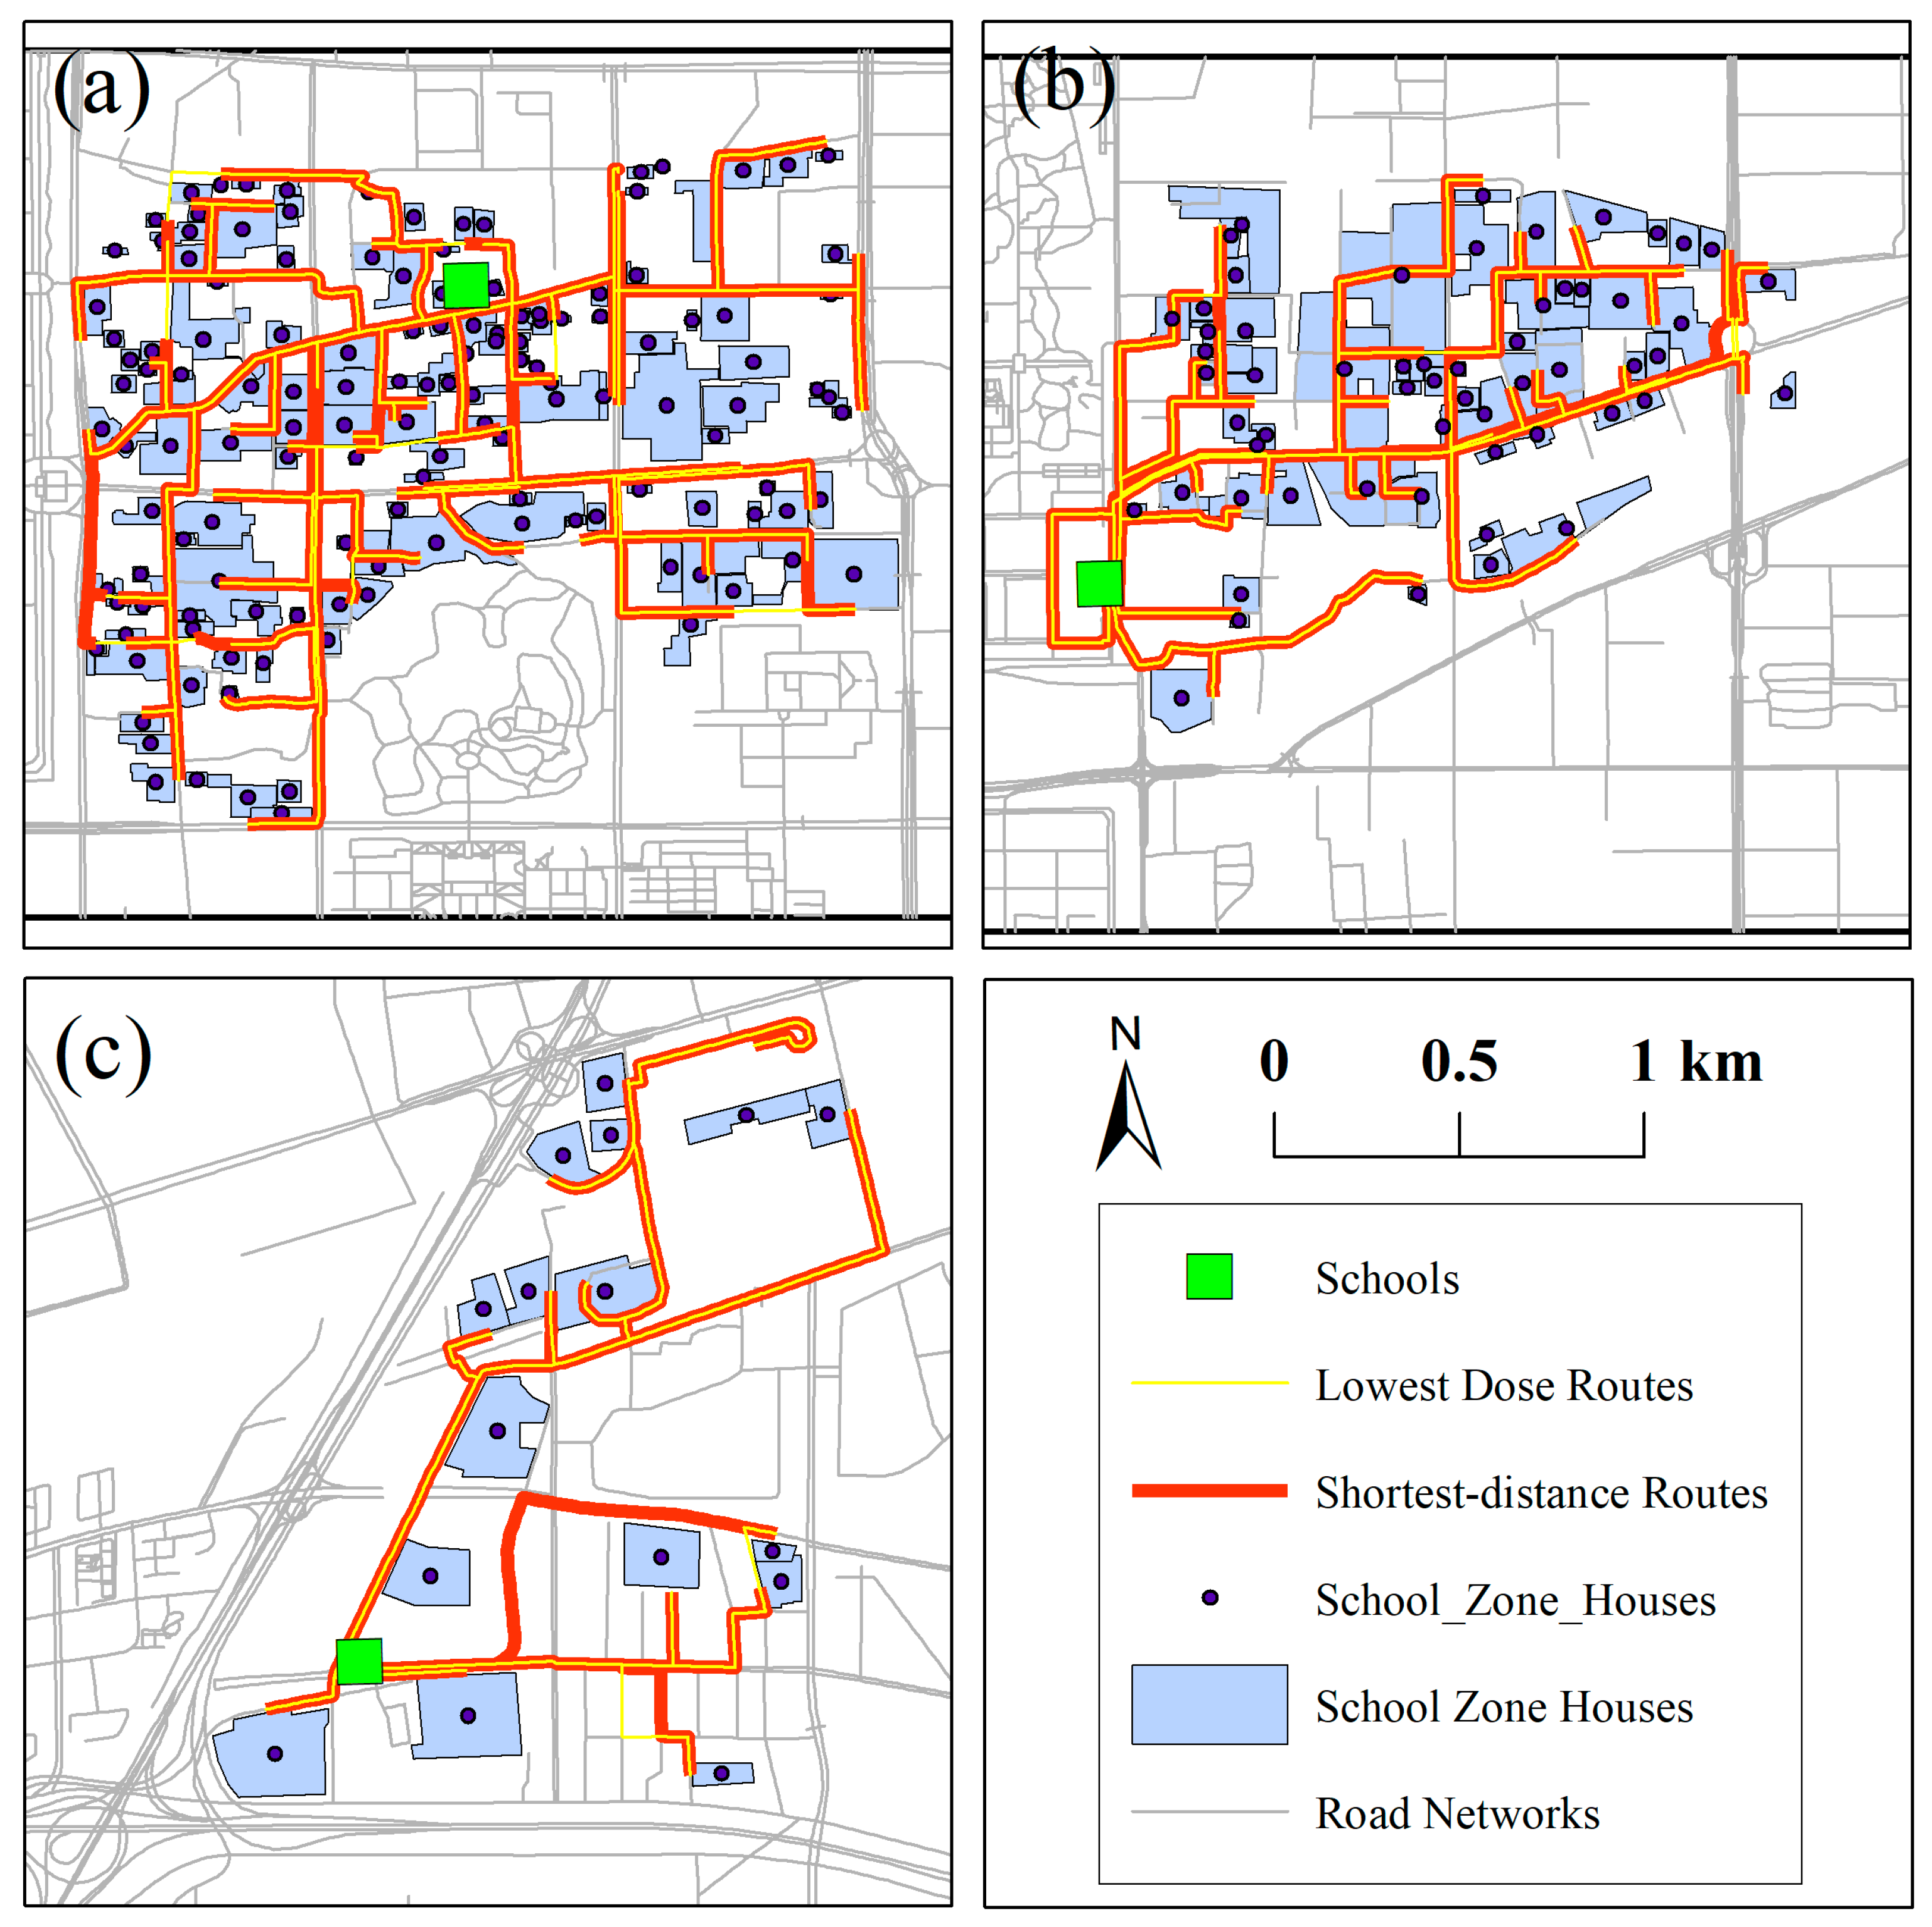
Figure 3 shows the locations of the schools, school catchments, and corresponding residential communities in each school catchment.
Table 1 depicts general information of these schools. The 3rd middle school is located in the city center, within a high-density residential district of the school catchment area, which comprises 139 corresponding residential communities. The 38th middle school is located in the Xincheng district, within a medium- to high-density residential district of the school catchment area, which comprises 59 corresponding residential communities. Meanwhile, the 58th middle school is located in Weiyang district, on the northern outskirts of the city. Compared with the areas surrounding the previous two schools, it is part of a later-developed urban district with a relatively low population density. The school catchment area comprises only 16 corresponding residential communities.
2.3. On-Road PM2.5 Mobile Monitoring
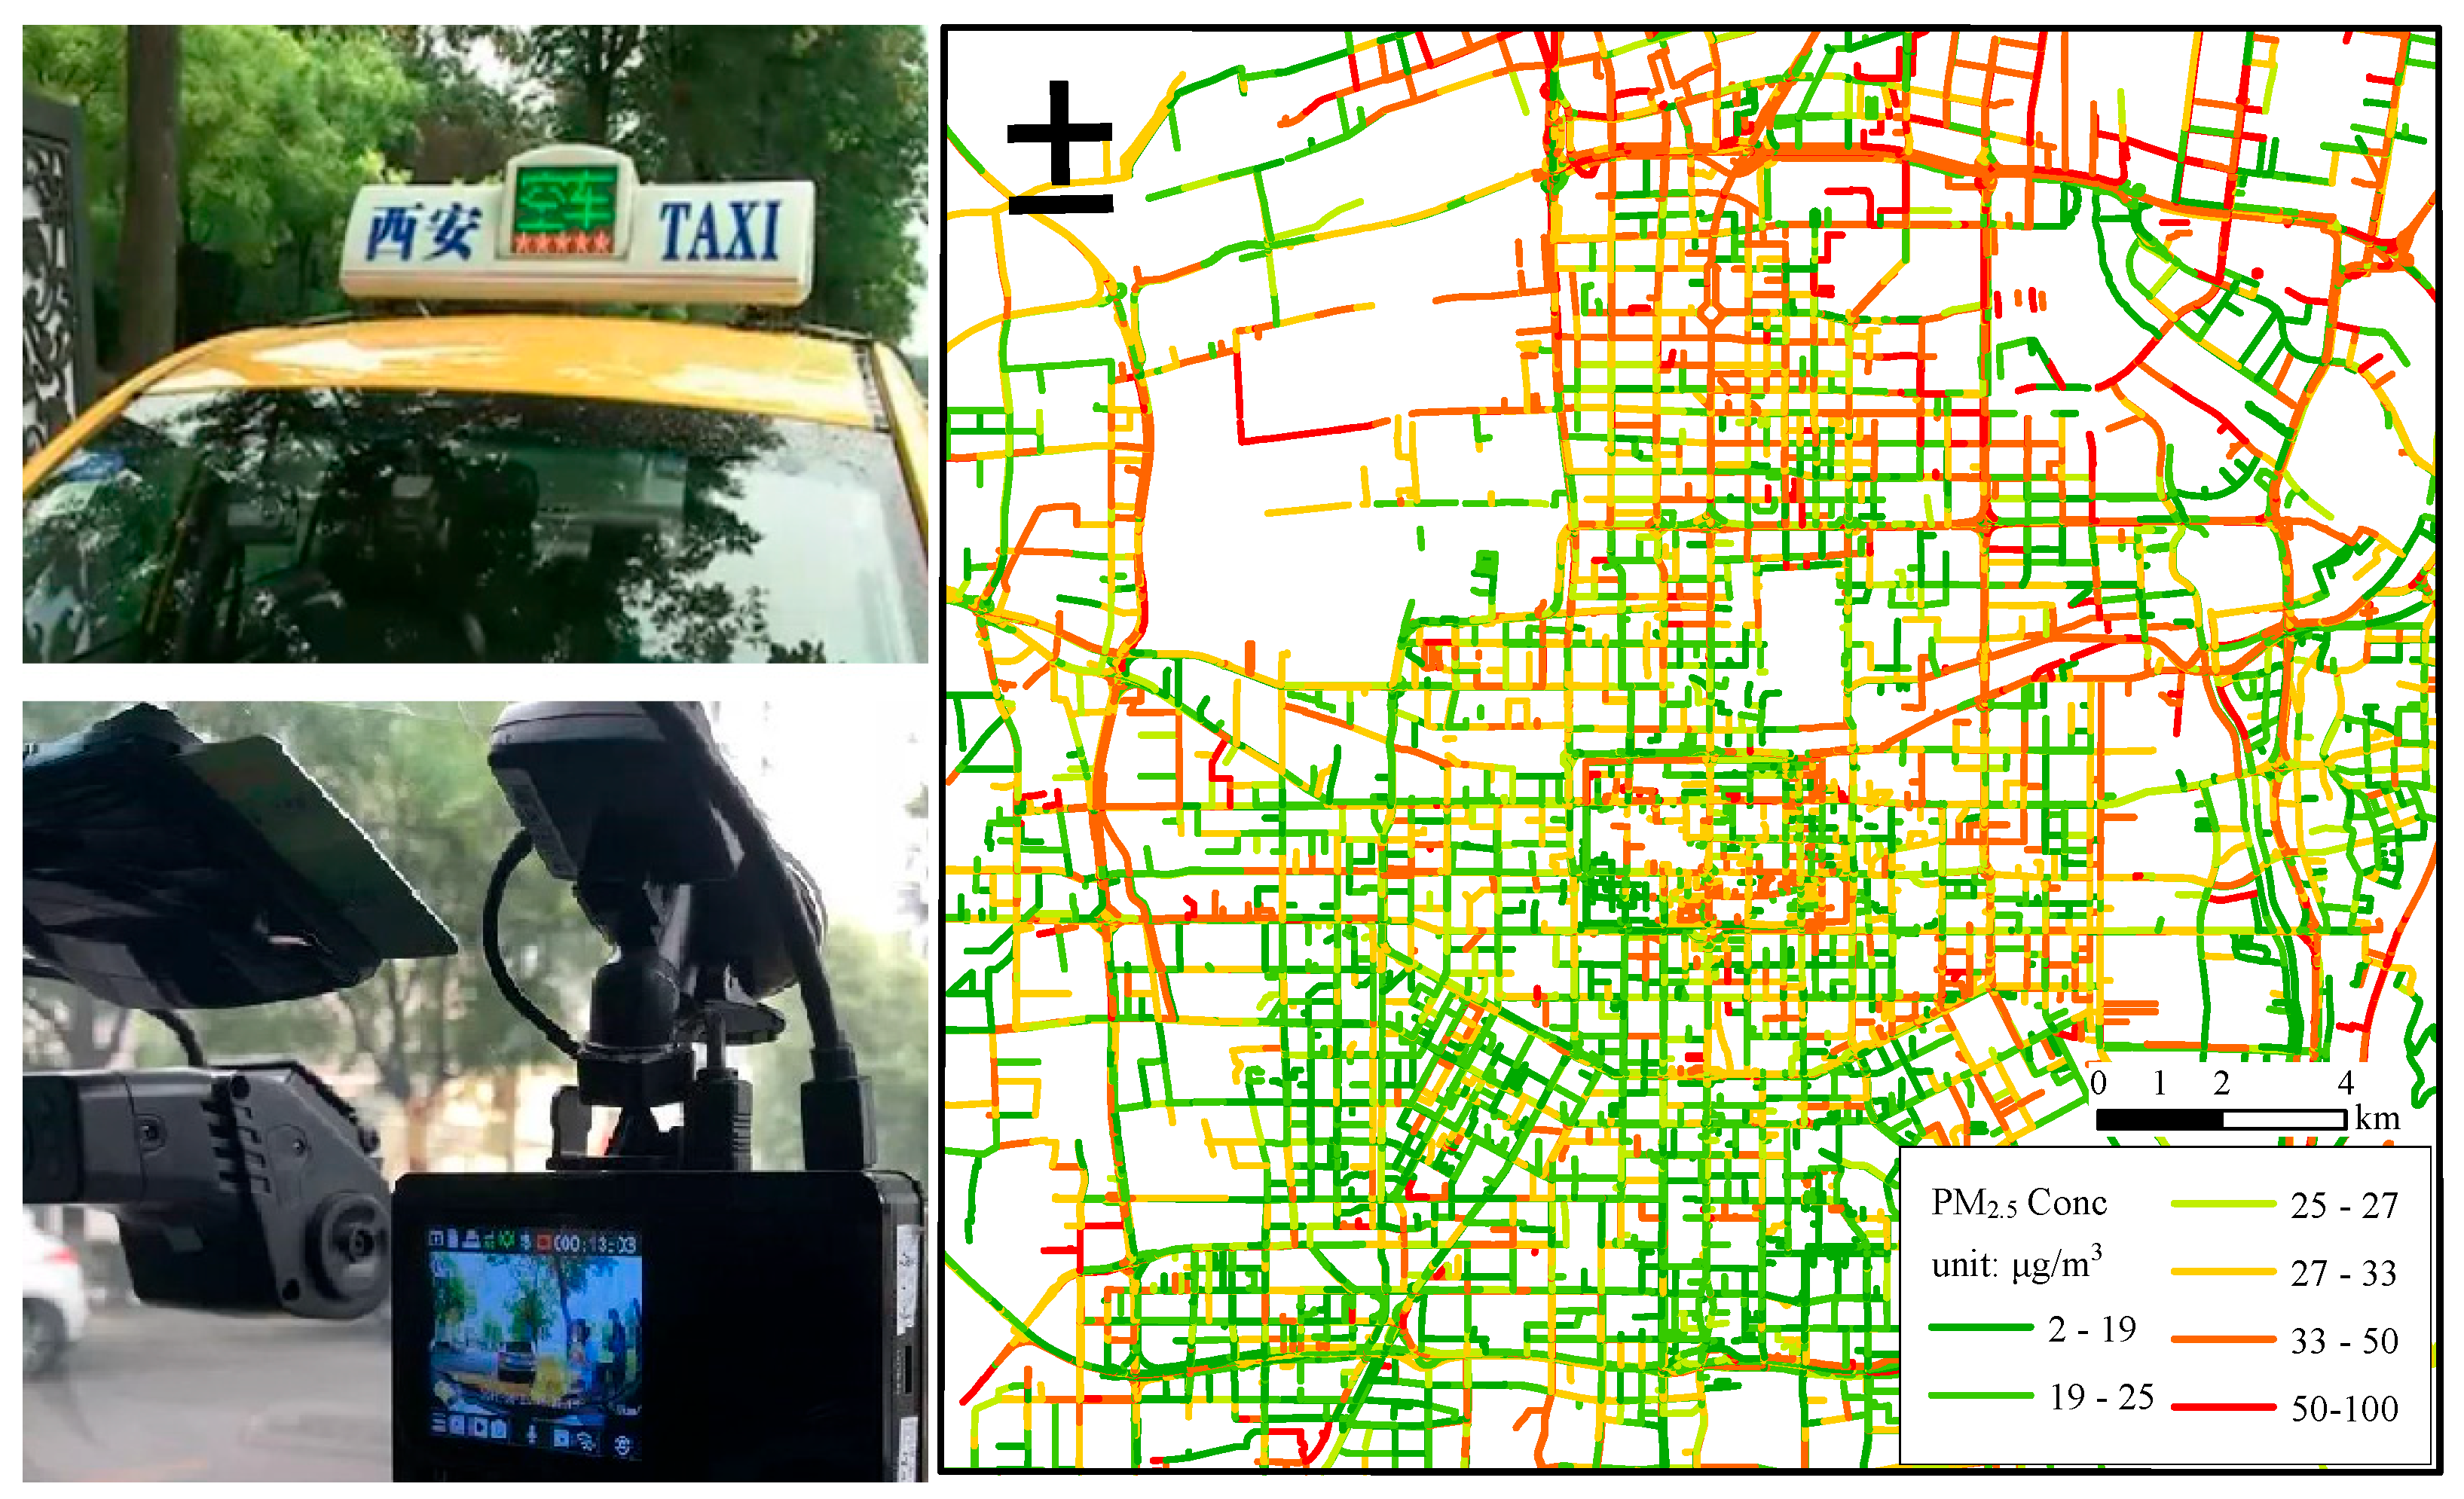
This study uses on-road PM2.5 concentration data collected by the Xi’an Atmospheric Mobile Monitoring Platform. The platform employs more than 200 operational taxis as mobile sampling vehicles. Each taxi is fitted with an integrated onboard air quality monitoring system installed within the rooftop lightbox, enabling real-time monitoring of the outdoor ambient PM2.5 concentrations on the roads they traverse. The monitor employed to collect air quality data was the Novafitness-SDS019 (unit cost approximately USD 6000). To enhance data quality and reliability, four identical sensors were installed in each monitor, and the final PM2.5 concentrations were obtained by integrating their outputs through a designed algorithm. The monitoring platform was managed by a professional maintenance company, ensuring continuous and stable operation. In addition, the monitor on each taxi was periodically calibrated against regular fixed-site stations, which further guaranteed the accuracy and consistency of the measurements. The sampling interval is once every three seconds for each monitor.
In our study, mobile PM
2.5 data collected over a two-week period from 2 August to 15 August 2021 were used. The three-times median absolute deviation (MAD) method was used as the threshold to remove outliers in the raw observations. Each PM
2.5 observation was assigned to its corresponding road segment based on the recorded GPS coordinates using the Hidden Markov Model (HMM)-based map matching algorithm. To ensure the quality of the data used in this study, only road segments with at least 14 repeated visits within the same week were retained in the subsequent data aggregation. To assess students’ PM
2.5 dosages during morning (7:00 am–8:00 am) home–school active commuting, the PM
2.5 concentration for each road segment was calculated as the mean value observed between 07:00 and 08:00 AM (it corresponds to the morning peak commuting time for students) during the two-week period from 2 August to 15 August 2021.
Figure 4 illustrates the taxi-based monitoring equipment and the spatial distribution map of temporally aggregated PM
2.5 concentrations for the hours of 7:00 to 8:00 AM over the period from 2 August to 15 August 2021. The platform’s data coverage encompasses over 95% of motor vehicle roads.
2.4. Determine the Active Commuting Road Network
In this study, an active commuting road network was developed using a road network layer obtained from the OpenStreetMap (OSM) website. The shapefile for the study area contains over 34,000 line features, which are classified into 20 distinct categories, including motorways, primary roads, cycle ways, footways, etc. To focus solely on active transportation, features such as motorways, motorway links, and train tracks were excluded from the network. Conversely, local paths and footways in free-entry parks and open spaces were incorporated, as students are typically permitted to traverse these areas. The road network was refined and adapted for analysis using ArcGIS 10.5. The refinement process involved two key steps: (1) Each road feature was segmented at intersections to create multiple smaller line segments, and (2) any segment exceeding 20 m in length was further subdivided into 20 m sub-segments (considering model spatial resolution, GPS positioning errors in mobile monitoring, and computational efficiency). This approach facilitated a more precise and detailed representation of the active transportation network, supporting subsequent modeling of students’ PM2.5 dosages while active home–school commuting.
2.5. Modeling PM2.5 Dosages While Walking
A terrain-based dose modeling approach, as introduced in previous studies, was employed to estimate PM
2.5 dosages during students’ home–school walking commutes [
18,
22]. It accounts for variable walking velocities and ventilation rates influenced by the topography of the road network. The modeling workflow is briefly illustrated below while traversing one road segment (this applied calculation method also accounts for students’ unique respiratory characteristics compared to adults).
Step 1: Calculate slope-related walking velocity (
v, km/h):
where
S is the directional-related slope of the road segment (expressed in +/−%).
Step 2: Calculate energy expenditure (
E, VO
2 in ml/s) of the walking student:
where
M is the body mass. For simplicity, an average body mass of 48 kg for primary school students in grades 7 to 9 was employed in the calculation.
Step 3: Calculate the ventilation rate
Ve (unit: L/min) of the walking student.
where
A is the student’s age, and an average age of 13 was employed in the calculation. Since the sex (X) of each sample was unknown, the mean ventilation rate was calculated by averaging the results from a male and a female student.
Step 4: Calculate the dosage (
Ds) inhaled along the road segment:
where
L is the road segment length.
is the PM
2.5 concentration at the road segment.
The total dose for the entire route is obtained by summing the PM2.5 dosages from all road segments along the commute route.
2.6. GIS-Based Road Network Analysis and Route Generation
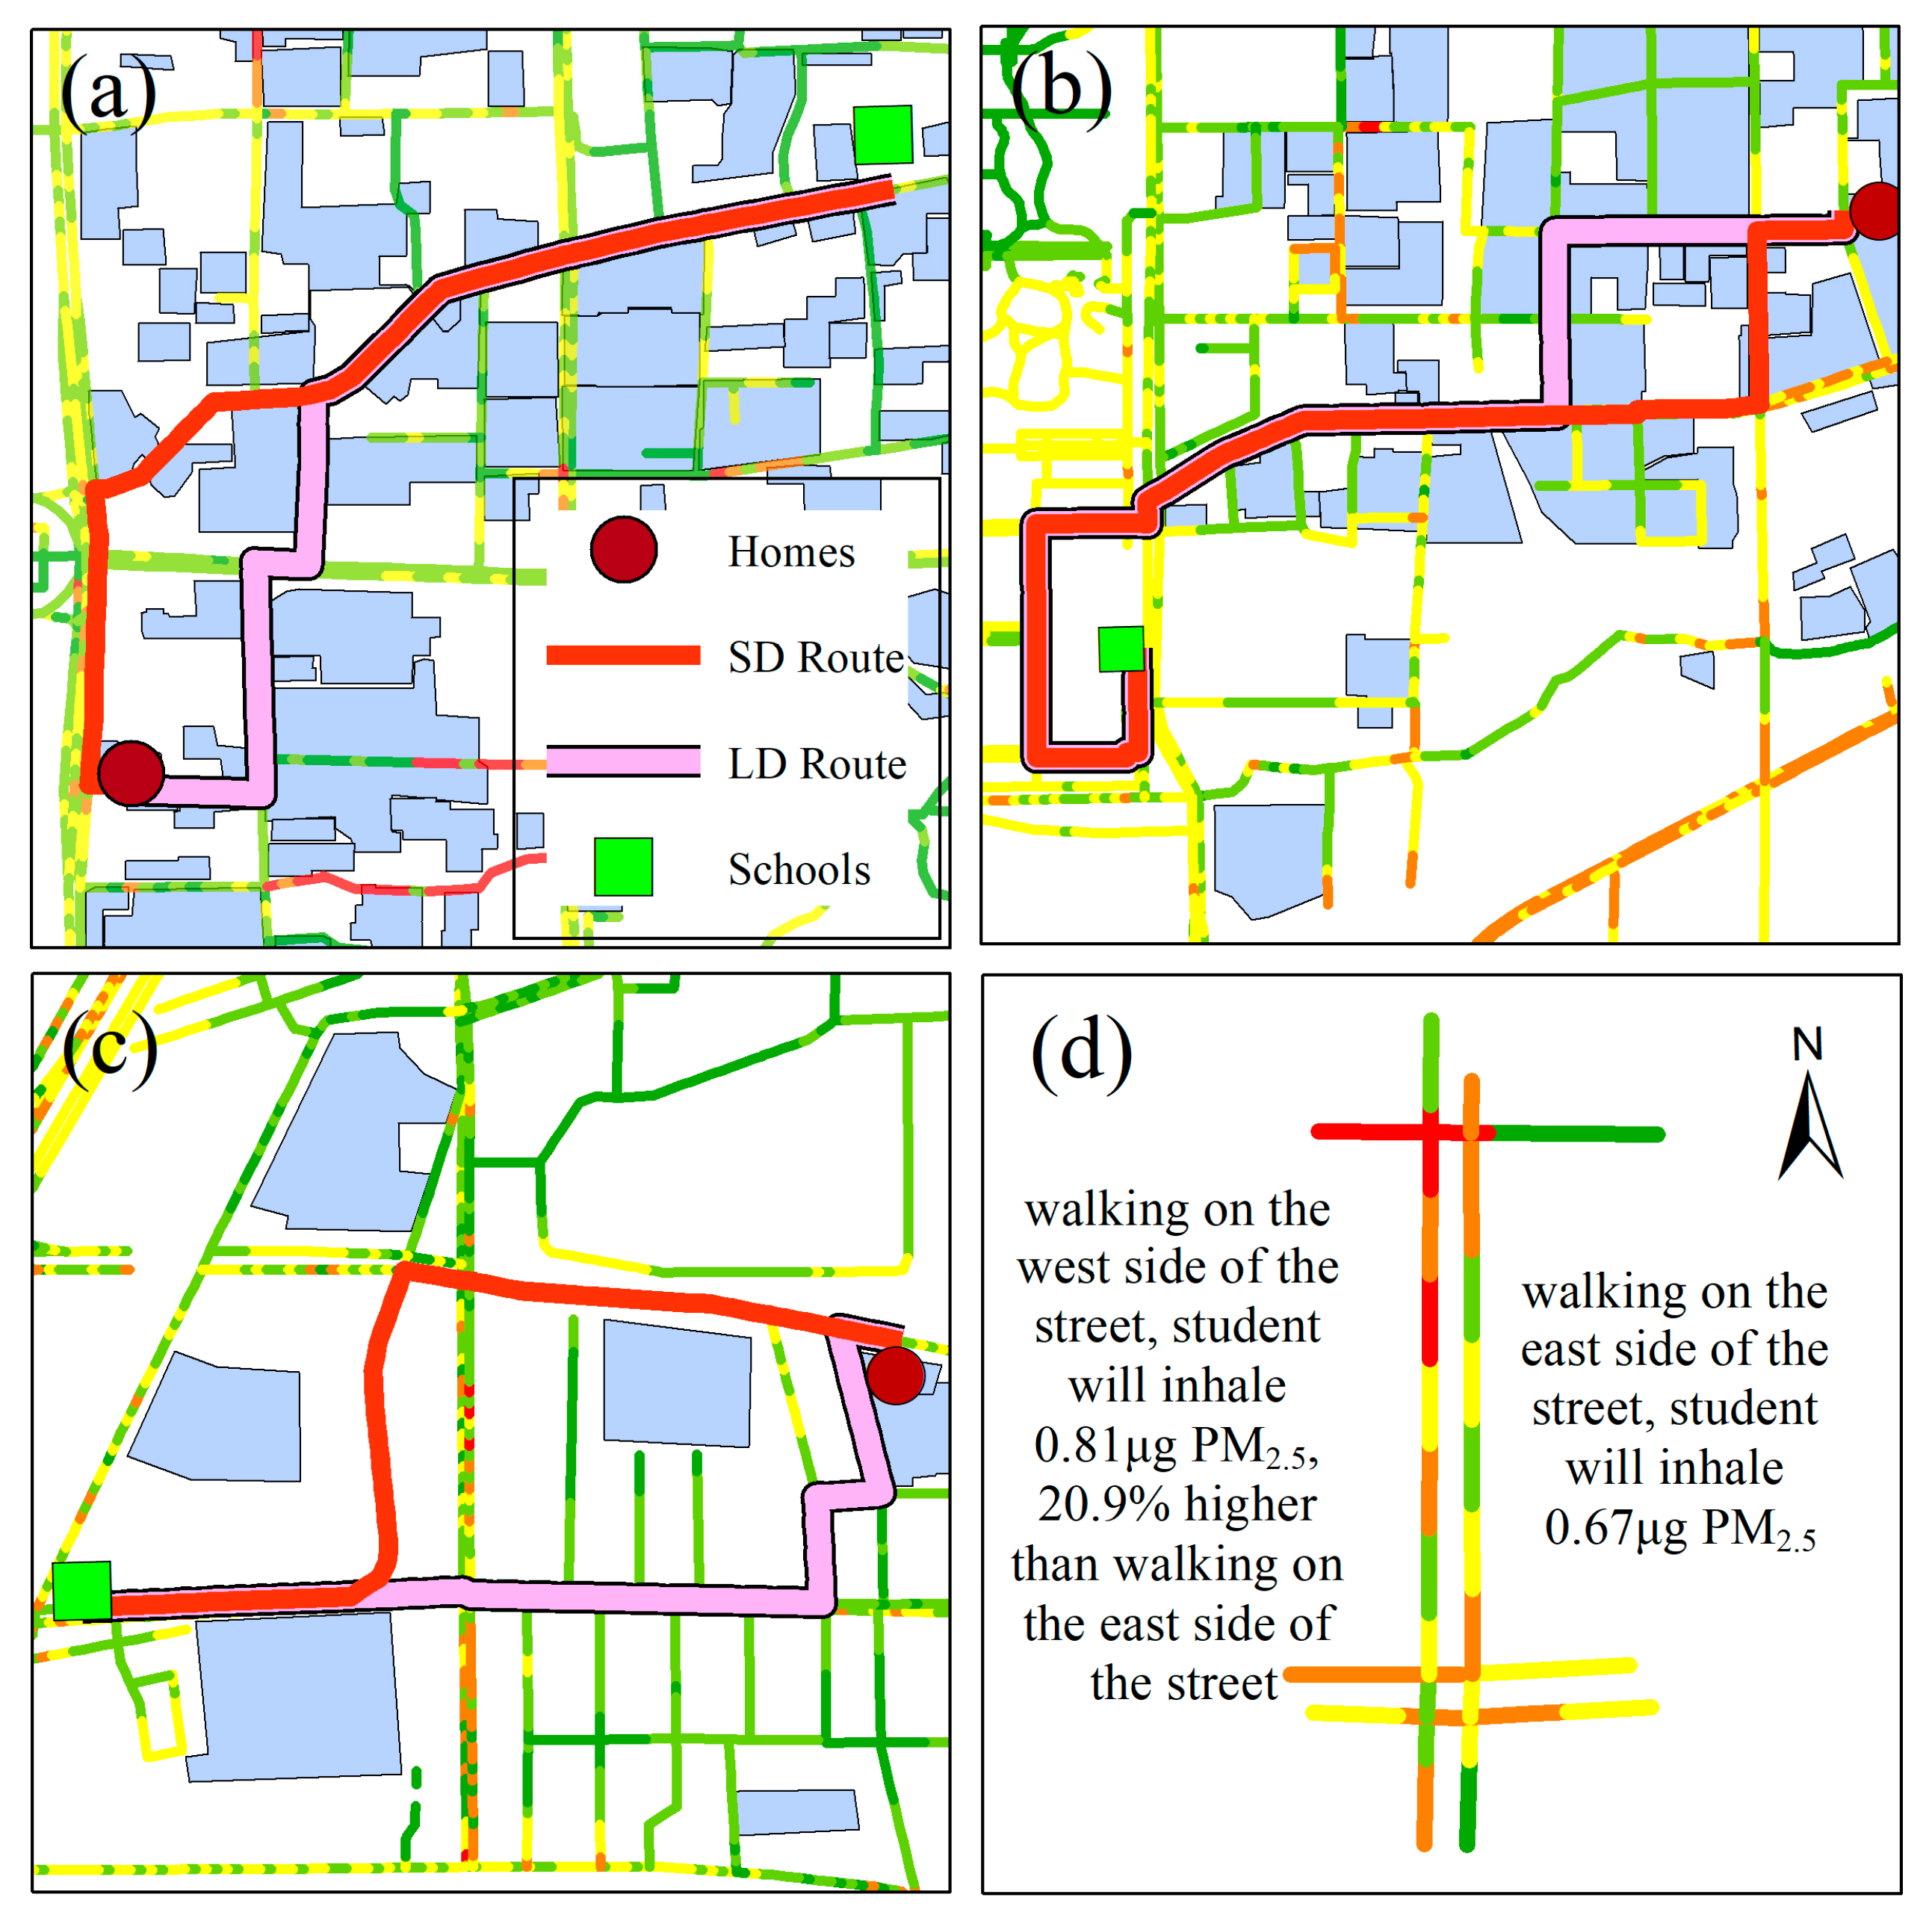
To examine students’ dose of ambient PM2.5 walking along different home–school route choices, we generated two routes for each home–school pair: (1) the shortest distance route, which is the preferred choice for most students, and (2) the lowest-dose route (with the least cumulative dosage), designed to minimize pollution inhalations and reduce exposure risk along the way. This analysis was performed using the road network analysis module in ArcGIS 10.5. It was set as follows: (1) Any vertex connectivity (an edge endpoint can connect to any vertex (including endpoints or intermediate vertices) of another edge in the network) was enabled; (2) turning and one-way restrictions were not imposed; (3) cost barrier functions were set to account for the scenario of waiting at traffic signals, to be more specific, we assumed a 60 s wait at a major crossing and 30 s at a minor crossing, both at a resting ventilation rate of 6 L•min−1 to calculate the PM2.5 dosages during the wait; (4) route length and dosage were set as impedances, respectively; and (5) they were also set as accumulation attributes. The results of the analysis were the origin, destination, total route length, and total PM2.5 dosages for each home–school route under different impedance setting (the shortest distance route vs. the lowest-dose route). Considering that students may be unwilling to use the alternative lowest-dose route if it were excessively longer, a restriction was applied, permitting an additional distance of up to 500 m.
2.7. Exposure Justice During Commuting
This study also investigated exposure justice (EJ) during commuting to test the following hypotheses: (1) Students with higher SES are associated with lower PM
2.5 exposure risks during home–school commutes, and (2) students with lower SES are associated with higher PM
2.5 exposure risks during home–school commutes. In our study, middle school students’ SES was represented by average housing price in the residential community [
26]. In brief, the average housing price for each residential community within the school districts of the selected schools was sourced from the online real estate website xa.lianjia.com. To ensure a fair comparison of students’ PM
2.5 dosage levels across different routes, the Unit Dosage Index (UDI), introduced in a previous study [
18], was employed. This index represents the dosage of PM
2.5 a student inhaled per kilometer traveled, calculated by dividing the total PM
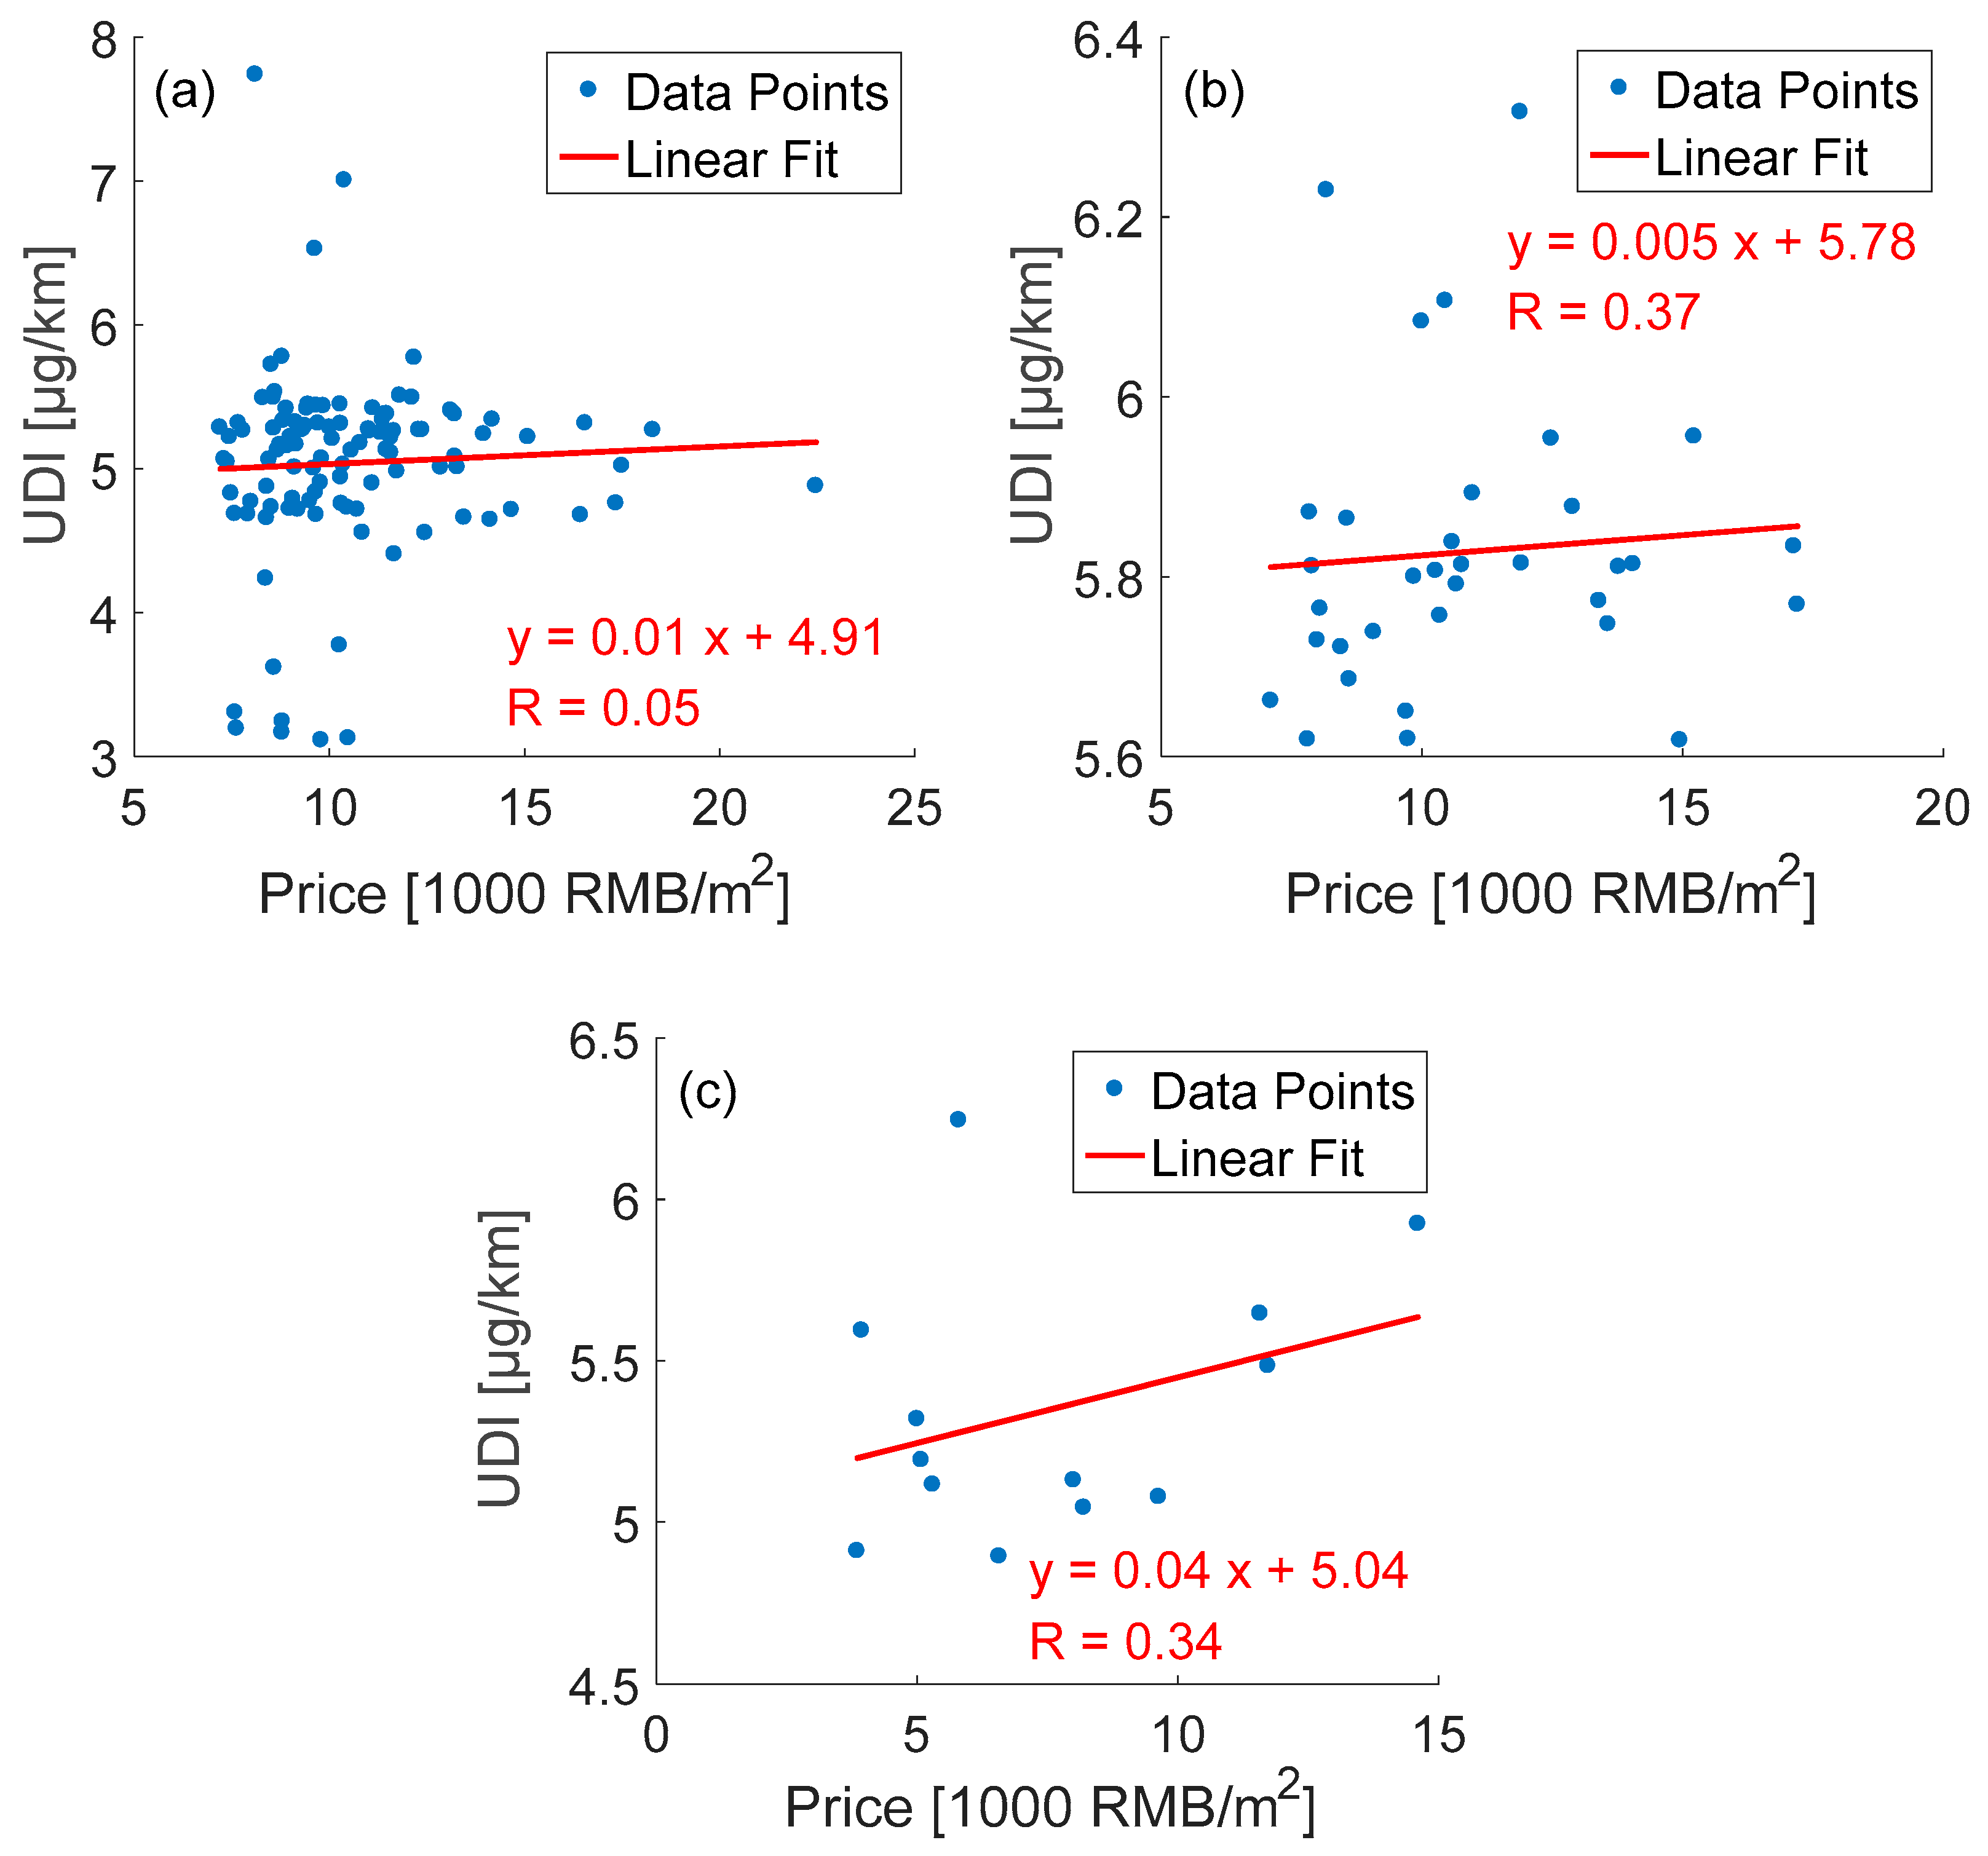
2.5 dosages by the length of the route. Numerous studies have shown that students tend to choose the shortest-distance route for their home–school commutes. Consequently, UDIs were calculated for each home–school pair, using the shortest-distance route between home and school. We test the proposed hypothesis by examining the regression relationship between the housing prices of students’ residential communities (a proxy for students’ SES) and the UDI of their home–school routes.
4. Discussion
This study employed a large-scale, taxi-based mobile monitoring fleet to obtain spatiotemporally dense on-road PM2.5 measurements and applied a terrain-based dosage modeling approach to estimate middle school students’ inhaled doses of PM2.5 during morning (07:00 am–08:00 am) home–school walking commutes. We evaluated both the shortest-distance routes and alternative lowest-dose routes, quantified the trade-off between reduced PM2.5 dose and increased travel distance, and assessed exposure disparities across students from different SES groups. By integrating high-resolution mobile monitoring with GIS-based dosage modeling for commuter route optimization, our approach bridges the gap between small-scale personal monitoring studies and large-scale but less spatially resolved modeling approaches.
Our results highlight the potential of large-scale taxi-based mobile monitoring as a powerful tool for population-scale commuter exposure assessment. Unlike traditional portable monitoring—where participants carry personal air quality sensors—mobile monitoring can continuously collect high-resolution spatiotemporal data across the majority of an urban road network without the need for extensive recruitment or participant compliance. While personal monitoring remains the gold standard for measuring individual exposure [
23], its high costs, logistical complexity, and limited sample sizes have constrained most studies to a handful of participants or routes [
27]. In contrast, air quality data obtained from citywide mobile monitoring fleets enable systematic exposure analysis for population-scale commuters, making it feasible to investigate students’ commuting route optimization, exposure inequalities, and the impact of infrastructure or policy interventions at a population scale.
Mobile monitoring is particularly well-suited for commuter exposure studies because it measures air pollutant concentrations directly along or parallel the roadways where walking occurs. Previous studies often relied on modeling approaches—such as LUR or dispersion models—built and validated primarily on fixed regulatory station data [
28]. However, such stations are sparse and typically located away from major roadways, limiting their ability to capture fine-scale spatial variations in air pollutant concentrations during commuting [
8,
17]. Near-road concentrations are significantly higher than urban background levels, and ignoring these gradients can lead to substantial underestimation of exposure during active commuting. By directly sampling near-road environments, mobile monitoring captures more actual exposure conditions experienced by commuters, including micro-scale variations associated with traffic volume, fleet composition, and roadway configuration.
In this study, we focused on middle school students, a group for whom walking is a common and practical mode of school commuting in many Chinese cities due to the school district policy. Compared to primary school students, middle school students are generally more independent, and parents are more comfortable allowing them to walk to school. We selected three representative middle schools, obtained the locations of residential communities within their catchment areas, and estimated PM
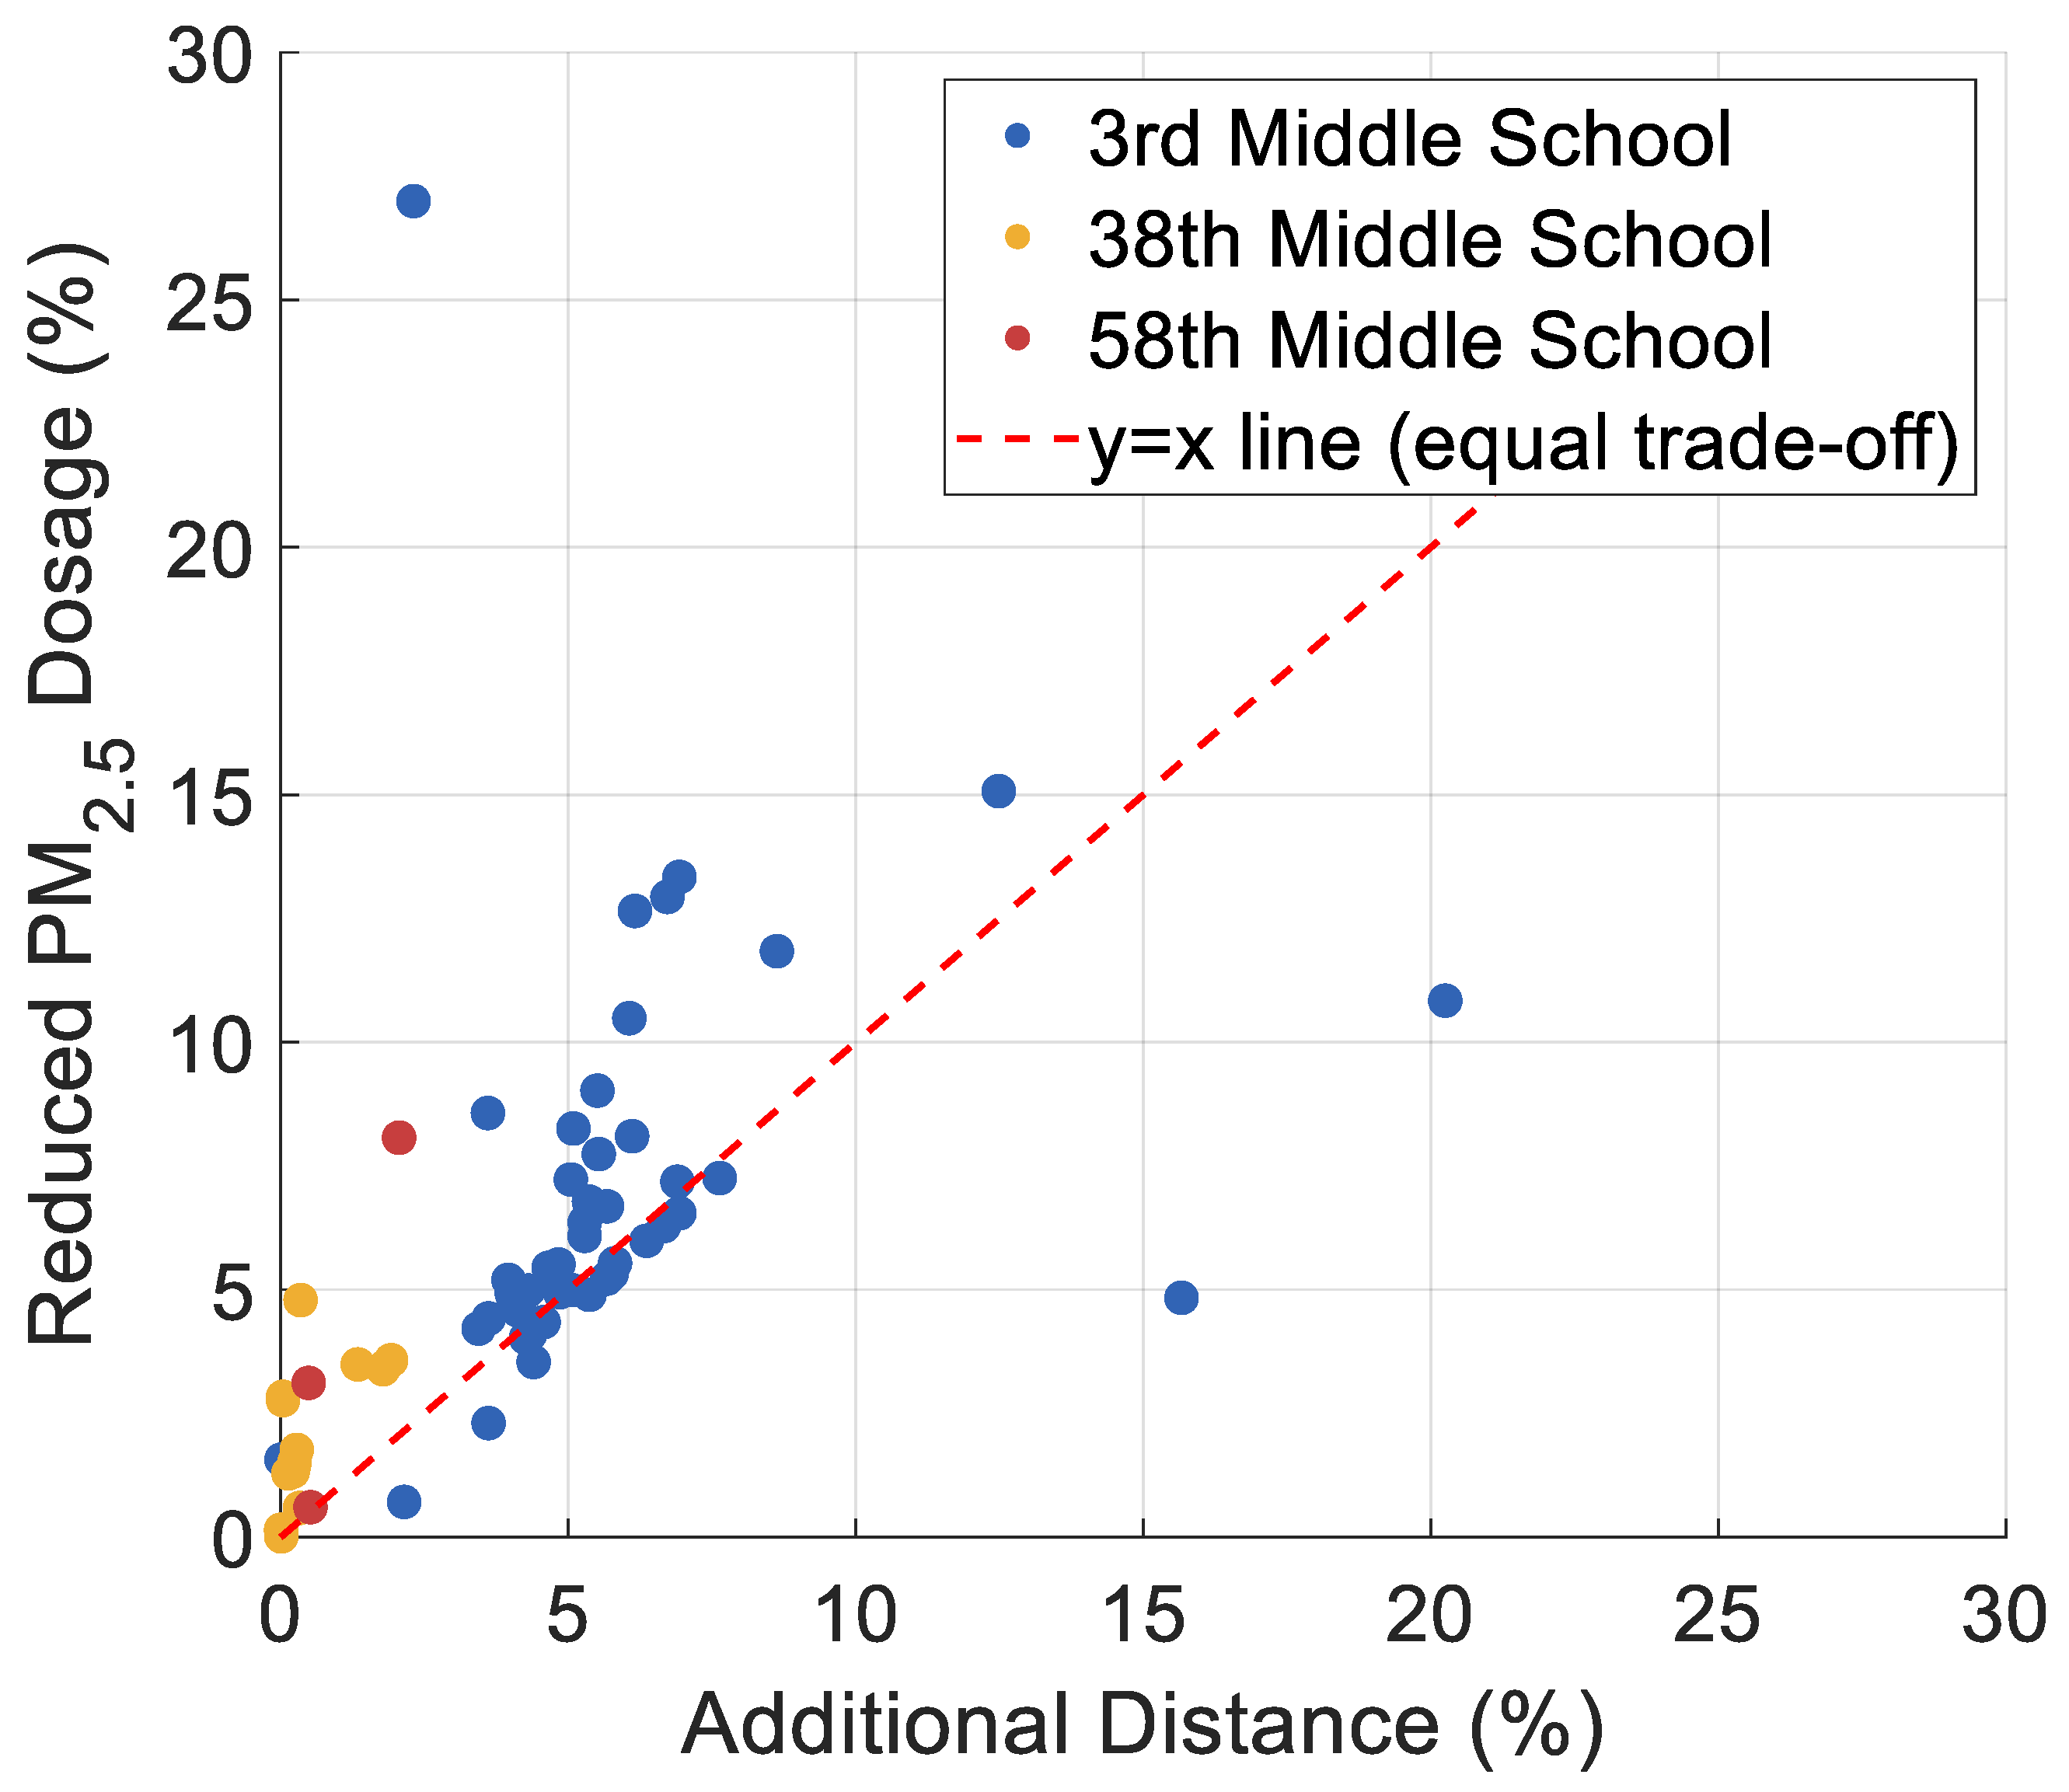
2.5 doses along the shortest-distance route, and we also tried to identify an alternative lowest-dose route for each home–school pair. Our trade-off analysis demonstrated that adopting the lowest-dose route could lead to substantial reductions in PM
2.5 dosages—sometimes exceeding 15%—at the cost of only a marginal (<5%) increase in walking distance. Such cost-effectiveness aligns with previous findings that for some students even small changes in route choice can significantly lower exposure risks without compromising travel convenience [
29,
30,
31,
32].
An alternative lowest-dose route can often be identified by making relatively small adjustments to the chosen path, such as walking along a parallel local road with lower pollution levels or selecting the less-trafficked side of the same street. These minor modifications can lead to substantial reductions in PM2.5 dosages without significantly increasing travel distance. The effectiveness of such adjustments depends on the spatial variability of PM2.5 concentrations, which is influenced by factors such as traffic density, building configurations, and the presence of vegetation barriers. In practice, this means that even in densely built urban environments where the shortest-distance route appears optimal in terms of time and distance, there may exist viable alternatives that achieve lower PM2.5 doses by leveraging micro-scale spatial differences in air quality.
Our findings suggest that students and parents should be aware of the potential benefits of choosing alternative lowest-dose routes. Such routes may involve walking along a parallel, less-polluted local road, or choosing the less trafficked side of the same road during peak hours, when tidal traffic patterns can produce concentration differences of up to 5–40% between sidewalks [
8]. In dense urban areas, even minor adjustments—such as crossing the street to walk on the side with lower traffic flow—can meaningfully reduce PM
2.5 doses, sometimes without appreciably increasing the total walking distance. This highlights the importance of disseminating route optimization strategies not only through academic publications but also via school-based health promotion programs and urban navigation apps [
33,
34], where real-time pollution information could guide students to safer routes.
In this study, we focused specifically on students’ morning commutes, comparing the shortest-distance routes with alternative lowest-dose routes in order to provide practical strategies for reducing PM2.5 dosages. Morning routes are relatively straightforward, as students usually prioritize time efficiency and tend to select the shortest-distance paths to school. However, the situation after school can be more complex. Students may take different routes to accompany friends, run small errands, or attend extracurricular activities, which introduces additional variability into their travel behaviors and potential exposure levels. Future research could expand the scope to include both morning and afternoon commutes, aiming to optimize the full set of student travel routes. Such efforts would allow for a more comprehensive evaluation of exposure reduction strategies, better reflecting the real-world diversity of student mobility patterns and helping to design more effective interventions to safeguard students’ health.
Building on our findings, several practical recommendations can be made to help walking students reduce their PM2.5 doses during daily home–school commutes. First, when feasible, students—particularly those living in central urban areas—should consider adopting an alternative lowest-dose route instead of the shortest-distance route, as the dense road network in city centers often provides multiple viable walking options with substantial differences in near-road pollution levels. Second, in cases where the shortest-distance route already follows quieter streets with limited traffic, such as in some peri-urban or residential neighborhoods, students may simply maintain their existing path, as the potential exposure reduction from rerouting would be minimal. Third, regardless of route length, students should avoid walking along major arterial roads during peak hours and instead use parallel, less-polluted local roads when available. Fourth, in high-traffic areas, walking on the side of the road with lighter traffic flow—taking into account tidal traffic patterns during rush hours—can meaningfully reduce PM2.5 doses, even if it requires crossing the street and adding a small number of steps to the journey. Last, we also recommend that students wear masks on their way to school if they pass through roads of pollution hotspots, as an additional measure to reduce exposure to air pollution. These strategies require minimal additional travel time and effort yet can yield notable reductions in inhaled PM2.5 dose, offering a cost-effective and accessible means of improving the health and safety of students’ daily commutes.
From an environmental justice perspective, our analysis revealed that while for one school, students did not experience a significant exposure inequity issue, for the other two schools, students from higher-priced residential communities were more likely to experience elevated PM
2.5 doses during their home–school walking commutes. This pattern contrasts with the conventional EJ hypothesis, which often posits that lower SES populations bear disproportionate environmental burdens [
35,
36,
37,
38]. In the context of Chinese cities, this divergence may be explained by unique patterns of residential distribution. High-priced communities in many urban cores are frequently located in close proximity to major transportation hubs—such as subway stations and bus stops—as well as densely populated commercial districts. While these locations offer superior accessibility and amenities, they are also characterized by higher traffic density and more intense human activity, both of which contribute to elevated near-road PM
2.5 concentrations. In contrast, some lower-priced communities situated in peri-urban areas may be farther from major traffic corridors, thereby exposing residents to comparatively lower commuting-related pollution levels.
Notably, our findings in EJ partially align with observations from Auckland, New Zealand, where a recent study on assessing students’ dose of NO
2 during home–school walking commutes found a similarly complex SES–exposure relationship [
18]. Specifically, students from lower-income families in suburban and citywide contexts were more likely to be exposed to higher NO
2 levels during walking commutes, which is consistent with the conventional EJ hypothesis. However, in central Auckland, students from higher-income families experienced higher NO
2 levels during walking commutes, likely because their residences—often high-rise apartments—were located close to major transport corridors and high-traffic areas. This parallel suggests that the reversal of the traditional EJ gradient in high-density urban cores may be a recurring phenomenon in cities where high-income housing is concentrated near mobility hubs and commercial activity centers. Such evidence from different geographical contexts reinforces the credibility of our results and underscores the need to interpret EJ patterns in light of local urban form, transportation infrastructure, and socio-spatial development histories. In Chinese megacities, the interplay between accessibility, housing markets, and traffic emissions appears to shape an atypical SES–exposure relationship, challenging assumptions derived from Western suburban-oriented urban models.
Although our analysis only focused on three representative middle schools in Xi’an, the proposed approach is highly transferable. By integrating high-resolution air quality mobile monitoring data with GIS-based route modeling, the methodology can be applied to any middle school within a city to evaluate and optimize walking routes for reduced PM2.5 doses. This scalability makes it a valuable tool for municipal education and transport departments aiming to improve students’ environmental health. Furthermore, the approach could be adapted to other vulnerable groups—such as the elderly or patients with cardiovascular conditions—who may benefit from lower-exposure walking routes in their daily routines. As air pollution mobile monitoring networks expand in urban areas worldwide, this framework has the potential to become a standard component of healthy urban mobility planning.
