1. Introduction
In recent years, countries around the world have been making efforts to reduce energy consumption and utilize energy more sustainably to combat climate change, but studies in the field continue to find that there is a gap between the actual energy consumption in industrial facilities and what it should be at an environmentally sustainable level [
1,
2]. Additionally, while the underlying principles of energy efficiency remain the same worldwide, there is no universal path to global energy efficiency improvement because each country has a different energy landscape. As such, studies that compare the application of energy efficiency improvement practices in different countries are key to closing the global energy gap. This study seeks to make such a comparison by analyzing energy auditing practices in Guatemala and the U.S.
Energy auditing—the process of identifying inefficiencies in a facility and developing energy efficiency measures (EEMs) to reduce both the facility’s energy consumption and costs, if implemented—has been cited as a key tool in closing the global energy gap [
3]. An energy audit typically consists of the analysis of a facility’s metrics (e.g., size, process flow, number of employees) and utility bills, an energy survey of the facility and analysis of the energy usage data obtained, and the development of EEM recommendations that include implementation costs, energy savings, emissions reductions, and payback periods. The recommended EEMs provide energy audit clients with specific opportunities by which to close the energy efficiency gap in their facility. However, though the energy auditing process has been increasingly refined and optimized over the years, little data-driven analysis of its effectiveness has been performed.
If EEMs are not implemented, an energy audit may not have been effective in improving energy efficiency. Much of the research that focused on energy auditing in residential applications concludes that audited clients are often discouraged from adopting recommended EEMs due to long payback periods and high implementation costs [
4,
5]. Other studies that focused on applications in small businesses and industrial facilities hail the beneficial impacts that even the simplest EEMs, such as the installation of efficient lighting, can have on a facility’s energy usage [
6,
7]. Furthermore, many of the studies that seek to analyze the effectiveness of energy audit programs employ survey-driven data [
8,
9,
10] that restrict analyses to the sampled population [
6], so drawing definitive conclusions about energy auditing practices across different locations and applications becomes difficult. As such, this study seeks to investigate the relationship between regional financial factors (energy and capital costs) and the payback periods of recommended EEMs using energy audit data from Guatemala and the U.S.
Guatemala, in particular, was chosen for comparison because Guatemala is categorized as a developing country, has been undergoing an industrial boom, and is the largest economy in Central America [
11]. Energy auditing practices implemented in Guatemala may very well lead the rest of the region in energy efficiency development. In evidence of this, there is an active U.S.-sponsored project focused on improving the energy efficiency of Guatemalan manufacturing facilities by supporting a local energy auditing center [
12]. As the U.S. and Guatemala both have the largest economies in their respective regions (North and Central America) and because collaboration in energy auditing practices is already ongoing between the two, a comparison follows naturally.
Additionally, because the U.S. is considered a developed country and Guatemala is considered developing, a comparison between the two can provide valuable insight into the overarching motivation of this study, that the differences in each country’s energy landscape must be accounted for in global energy efficiency improvement. Many of the existing studies on energy auditing practices focus on highly developed countries [
13,
14,
15], with less information available about energy auditing in developing countries; however, energy efficiency improvement in developing countries like Guatemala has been shown to have multi-impact benefits, allowing for economic growth and quality-of-life improvements to occur simultaneously rather than at each other’s expense [
16,
17,
18]. Developing countries are also expected to increase their energy demand by 45% in the next 20 years, accounting for nearly 100% of projected growth in global energy demand [
19].
This study therefore compares three common EEMs made both in the United States and Guatemala—installing solar panels to generate electricity, replacing current lighting with higher-efficiency lighting, and replacing old motors with premium efficiency equipment—using data obtained from U.S. industrial energy audits and from five audits of industrial facilities conducted in Guatemala [
20,
21]. The implementation of each of the three selected EEMs provides an actionable opportunity to improve sustainable energy consumption and reduce emissions in an industrial facility. Installing solar panels to generate electricity allows a facility to consume energy generated by a renewable energy source, as opposed to emission-intense power plant electricity generation. Installing higher-efficiency lighting and motors allows a facility to reap the same lighting levels/power output as less efficient equipment with lower energy input, cutting both energy consumption and costs.
The following analysis uses data from operating facilities, eliminating the methodological challenges posed by survey-driven data. Additionally, though the Guatemalan dataset is limited, Guatemala’s status as a key developing nation allows for an evaluation of its energy auditing practices to provide valuable insight into energy efficiency in developing nations.
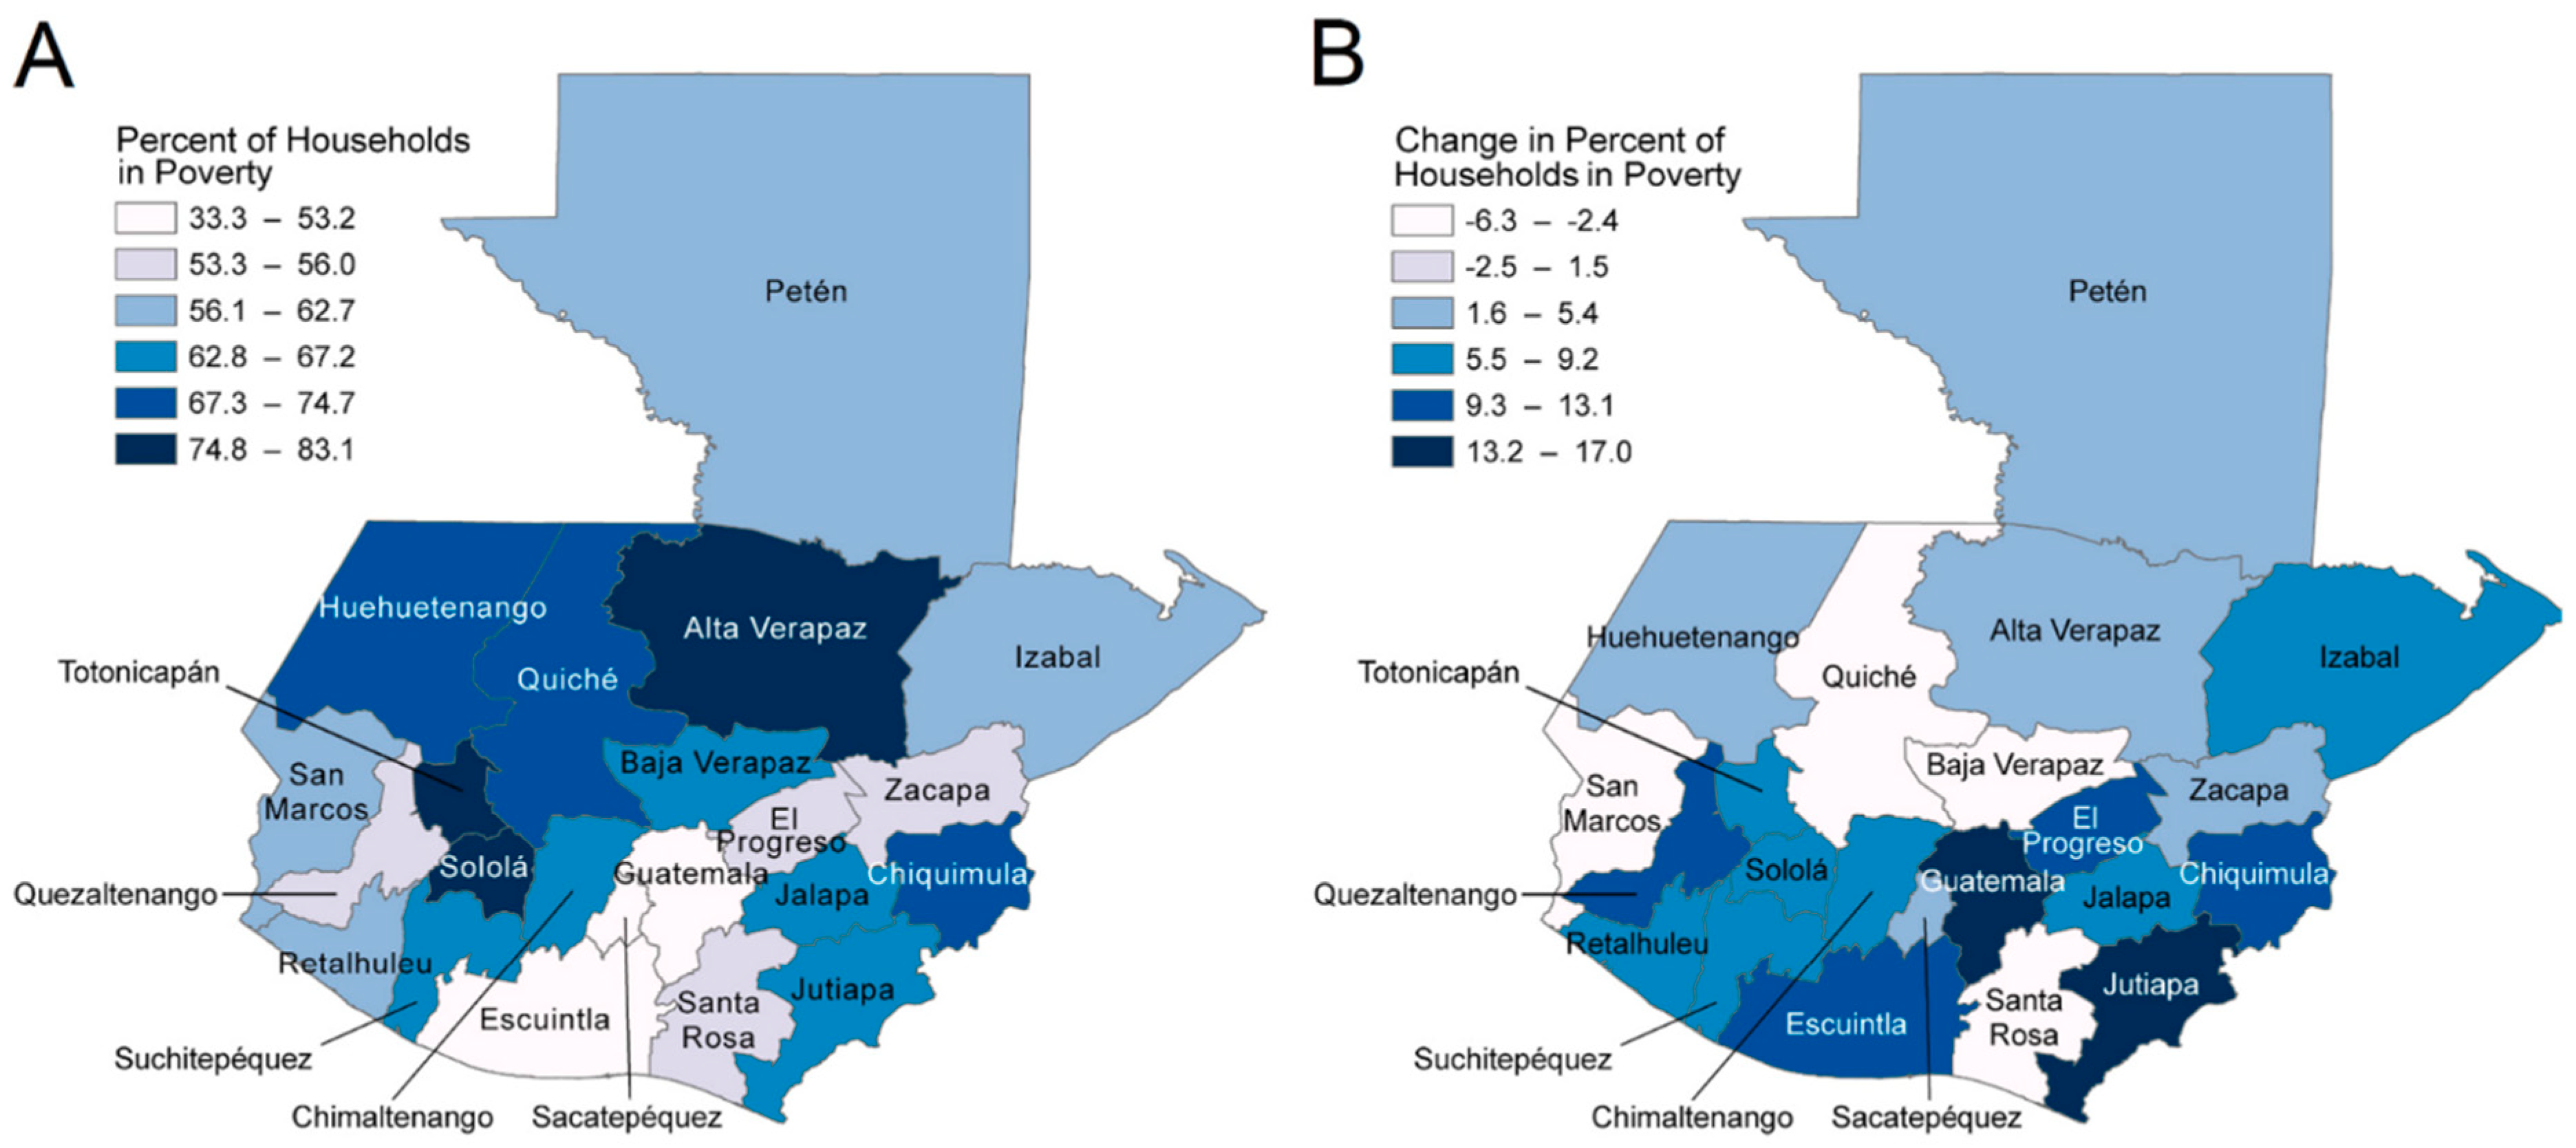
Guatemala is one of the few developing countries that is experiencing steady economic growth without seeing improvement in poverty rates (
Figure 1) [
22]; a 2020 study [
23] found that 76% of Guatemalan households could be classified as energy-poor by the United Nations definition of energy poverty [
24]. Additionally, a 2021 study by Henry et al. on how renewable energy development goals will affect poverty in Guatemala found that the effect of energy development on energy prices in Guatemala could push some energy-stressed households further into energy poverty and that due to Guatemalan capital costs, fossil fuels may remain the cheapest fuel option despite the implementation of EEMs [
22]. The balance between energy costs and capital costs in Guatemala therefore warrants further study, as it can provide insight into the impact of energy auditing on energy efficiency efforts in this country. Though many studies have conducted similar analyses on Latin American countries [
25,
26,
27], beyond assessments of energy poverty [
22] and the energy landscape [
28], no energy efficiency studies were identified for Guatemala.
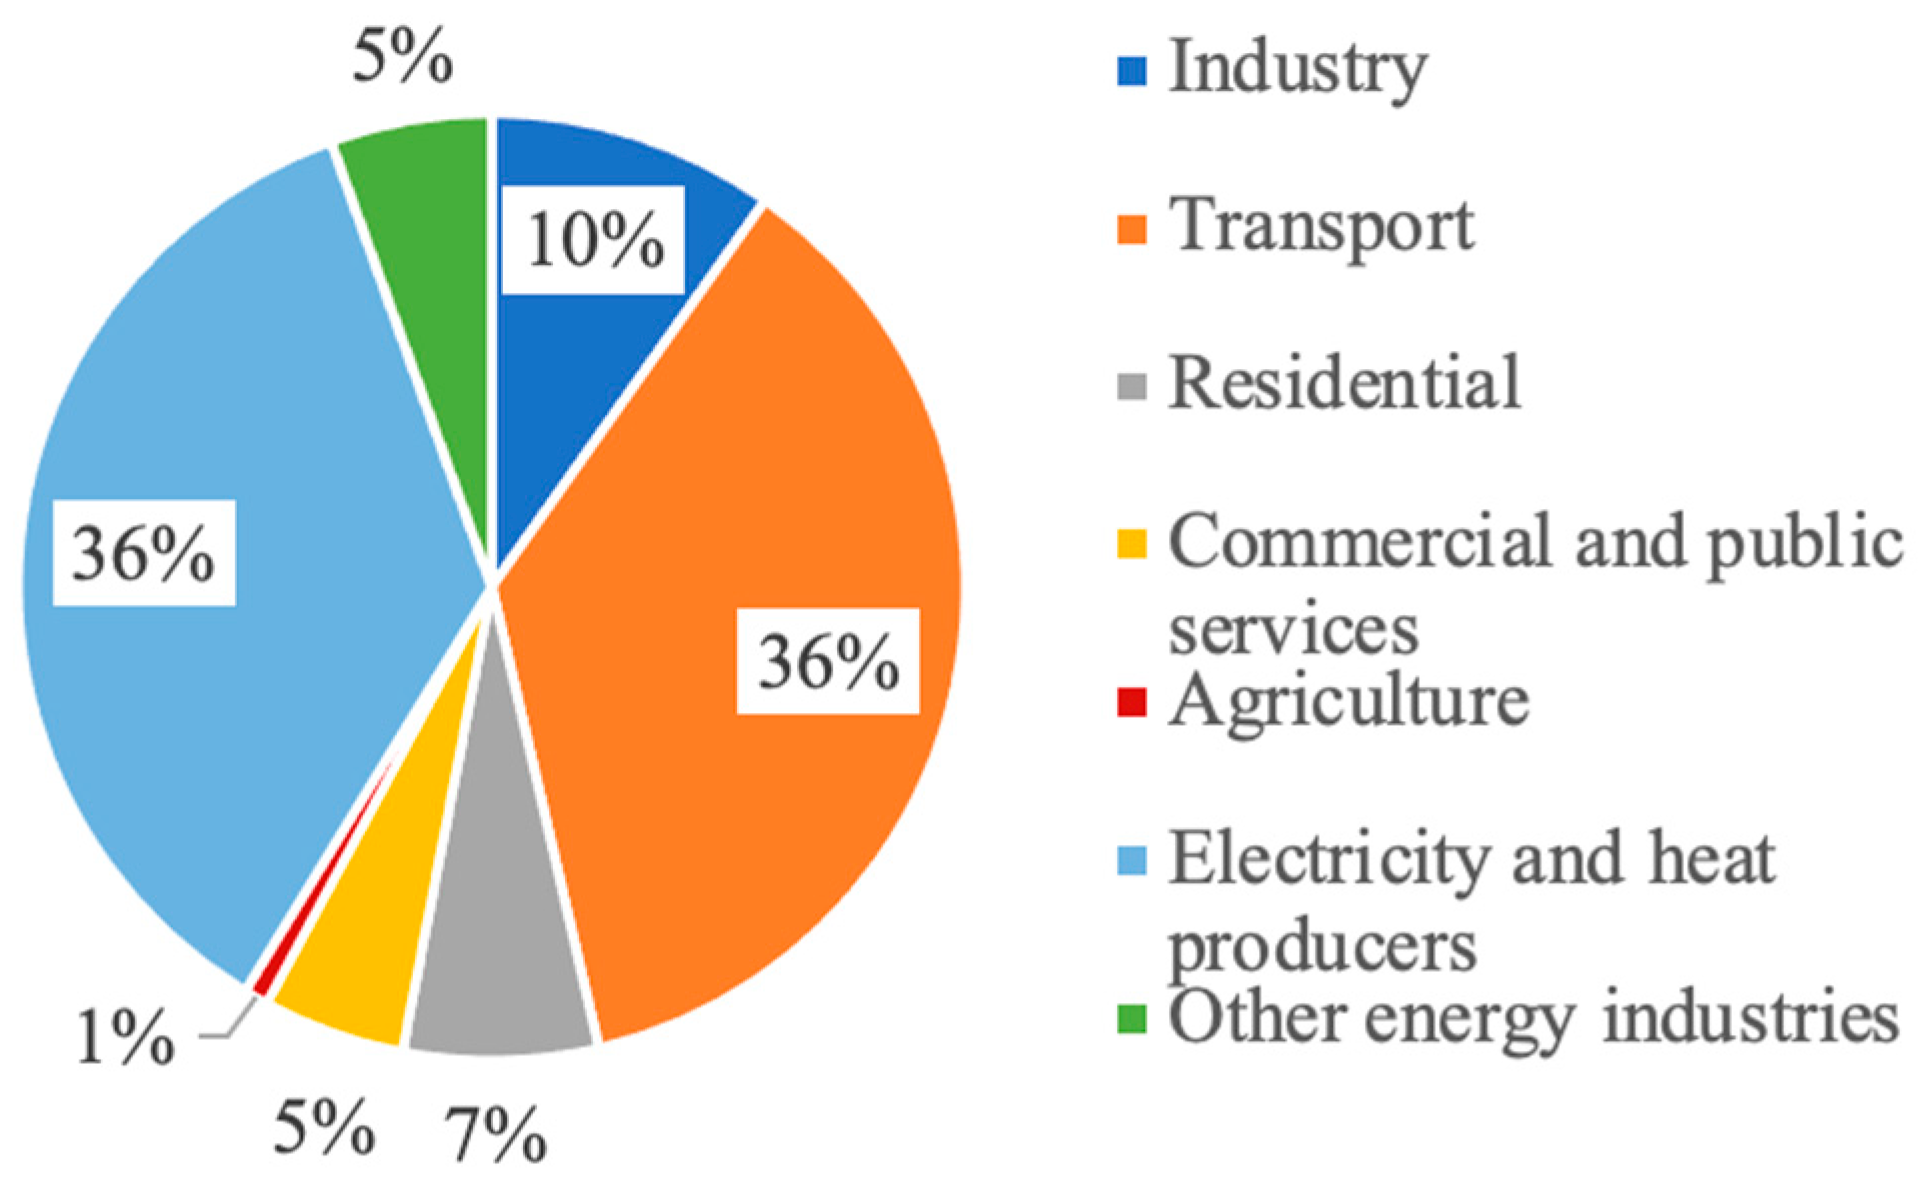
Emissions in Guatemala and the U.S.
To further highlight the importance of a comparison between energy efficiency applications in the U.S. and Guatemala, key differences between each country’s national emissions can be identified, as the energy usage reductions offered by EEM implementation also reduce global emissions to mitigate climate change.
Figure 2 and
Figure 3 below provide a breakdown of the U.S. and Guatemala’s national carbon dioxide (CO
2) emissions in 2021, created from International Energy Agency data (IEA) [
29,
30]. As can be seen in
Figure 2 and
Figure 3, the transportation, electricity and heat production, and industrial sectors are responsible for generating the majority of CO
2 emissions in both countries, which serves as an interesting point for comparison, especially given that the U.S. and Guatemala differ in their energy sources. Notably, the U.S. relies mainly on fossil fuels [
29], while Guatemala relies equally heavily on both fossil fuels and hydropower, as well as biomass [
30].
Targeting energy auditing practices to the same high-emitting sectors in each of these countries could serve to reduce national emissions for each, but the same recommended EEM would have a different impact in each country due to their differing energy landscapes, especially considering that the level of CO
2 emissions from developing countries can exceed that of developed countries due to rapid urbanization [
31]. Should an EEM focused on reducing fossil fuel consumption in an industrial facility be made in Guatemala, the contribution to national CO
2 emissions reductions may be less impactful than in the U.S. This further serves to highlight not only the need for energy auditing comparison between Guatemala and the U.S. but between recommended EEMs that are common to energy audits conducted in both countries.
3. Results
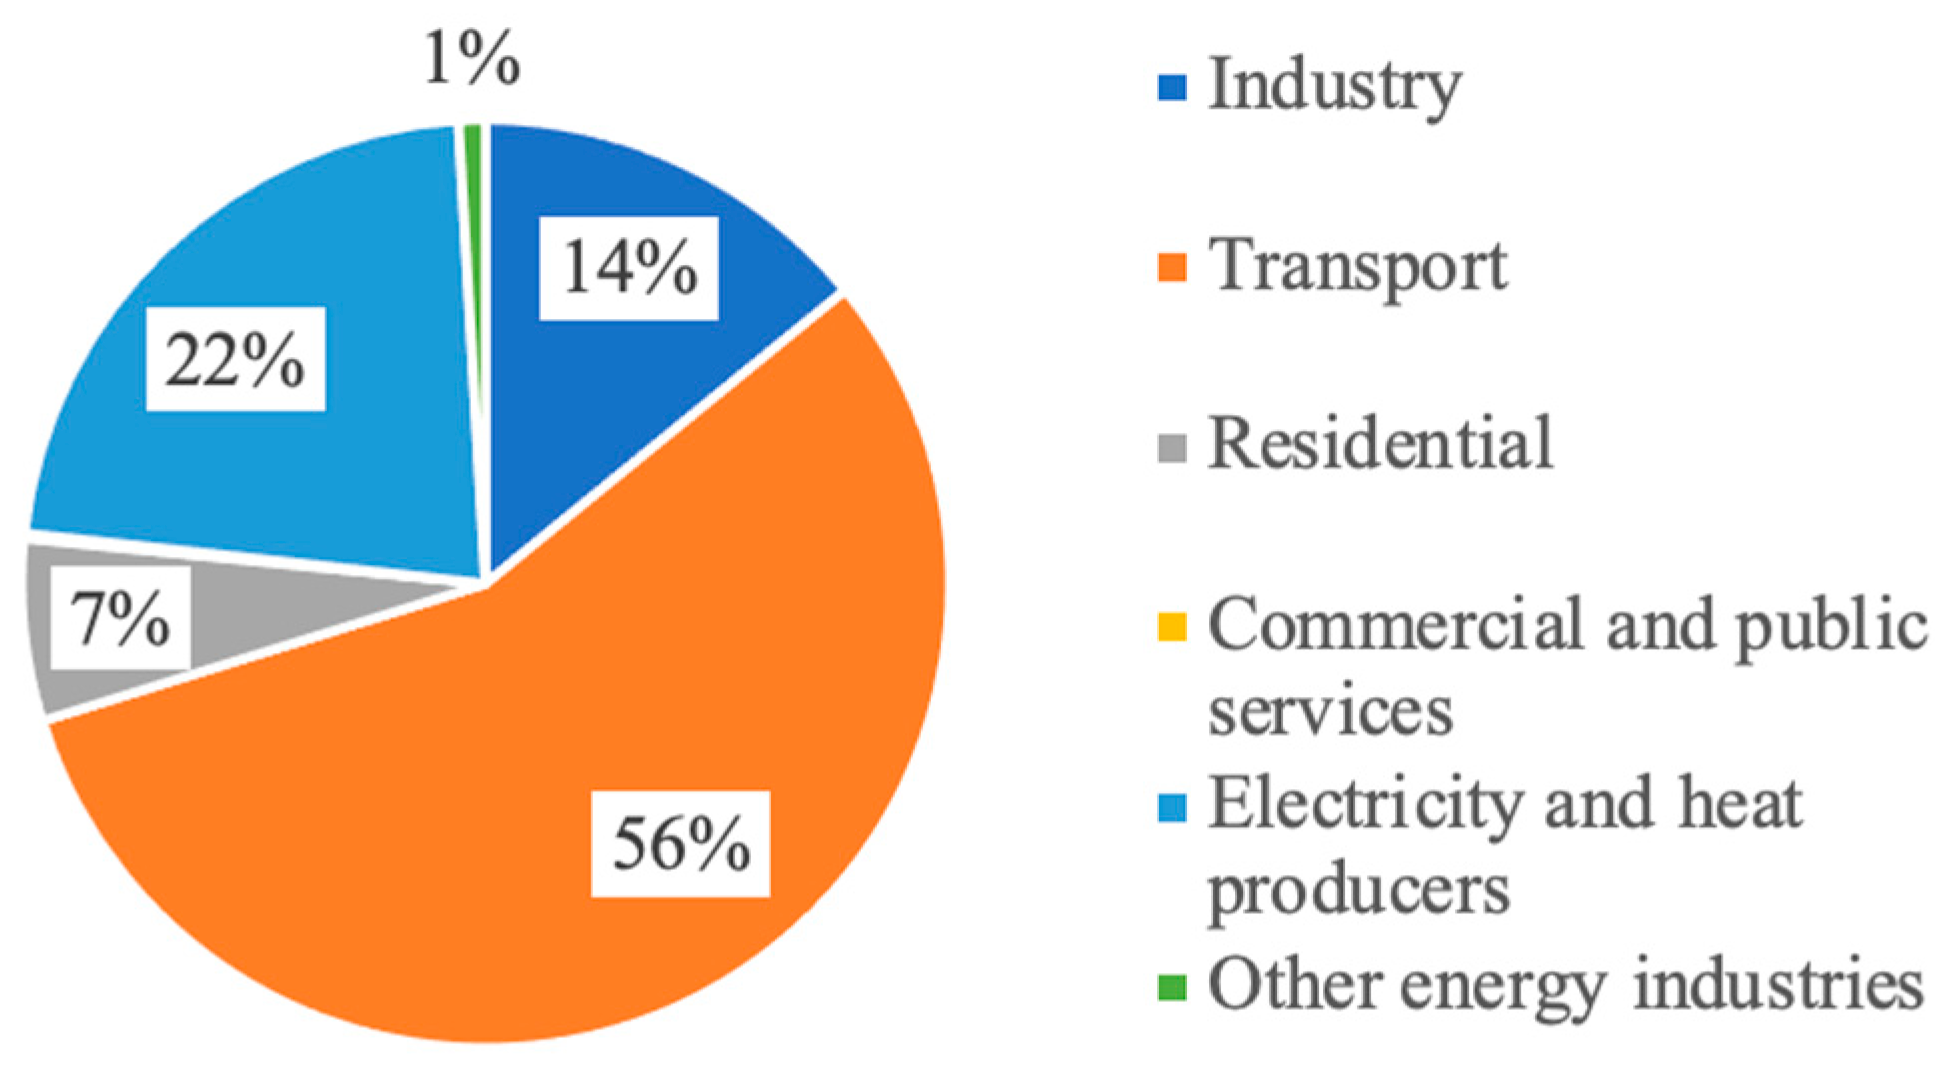
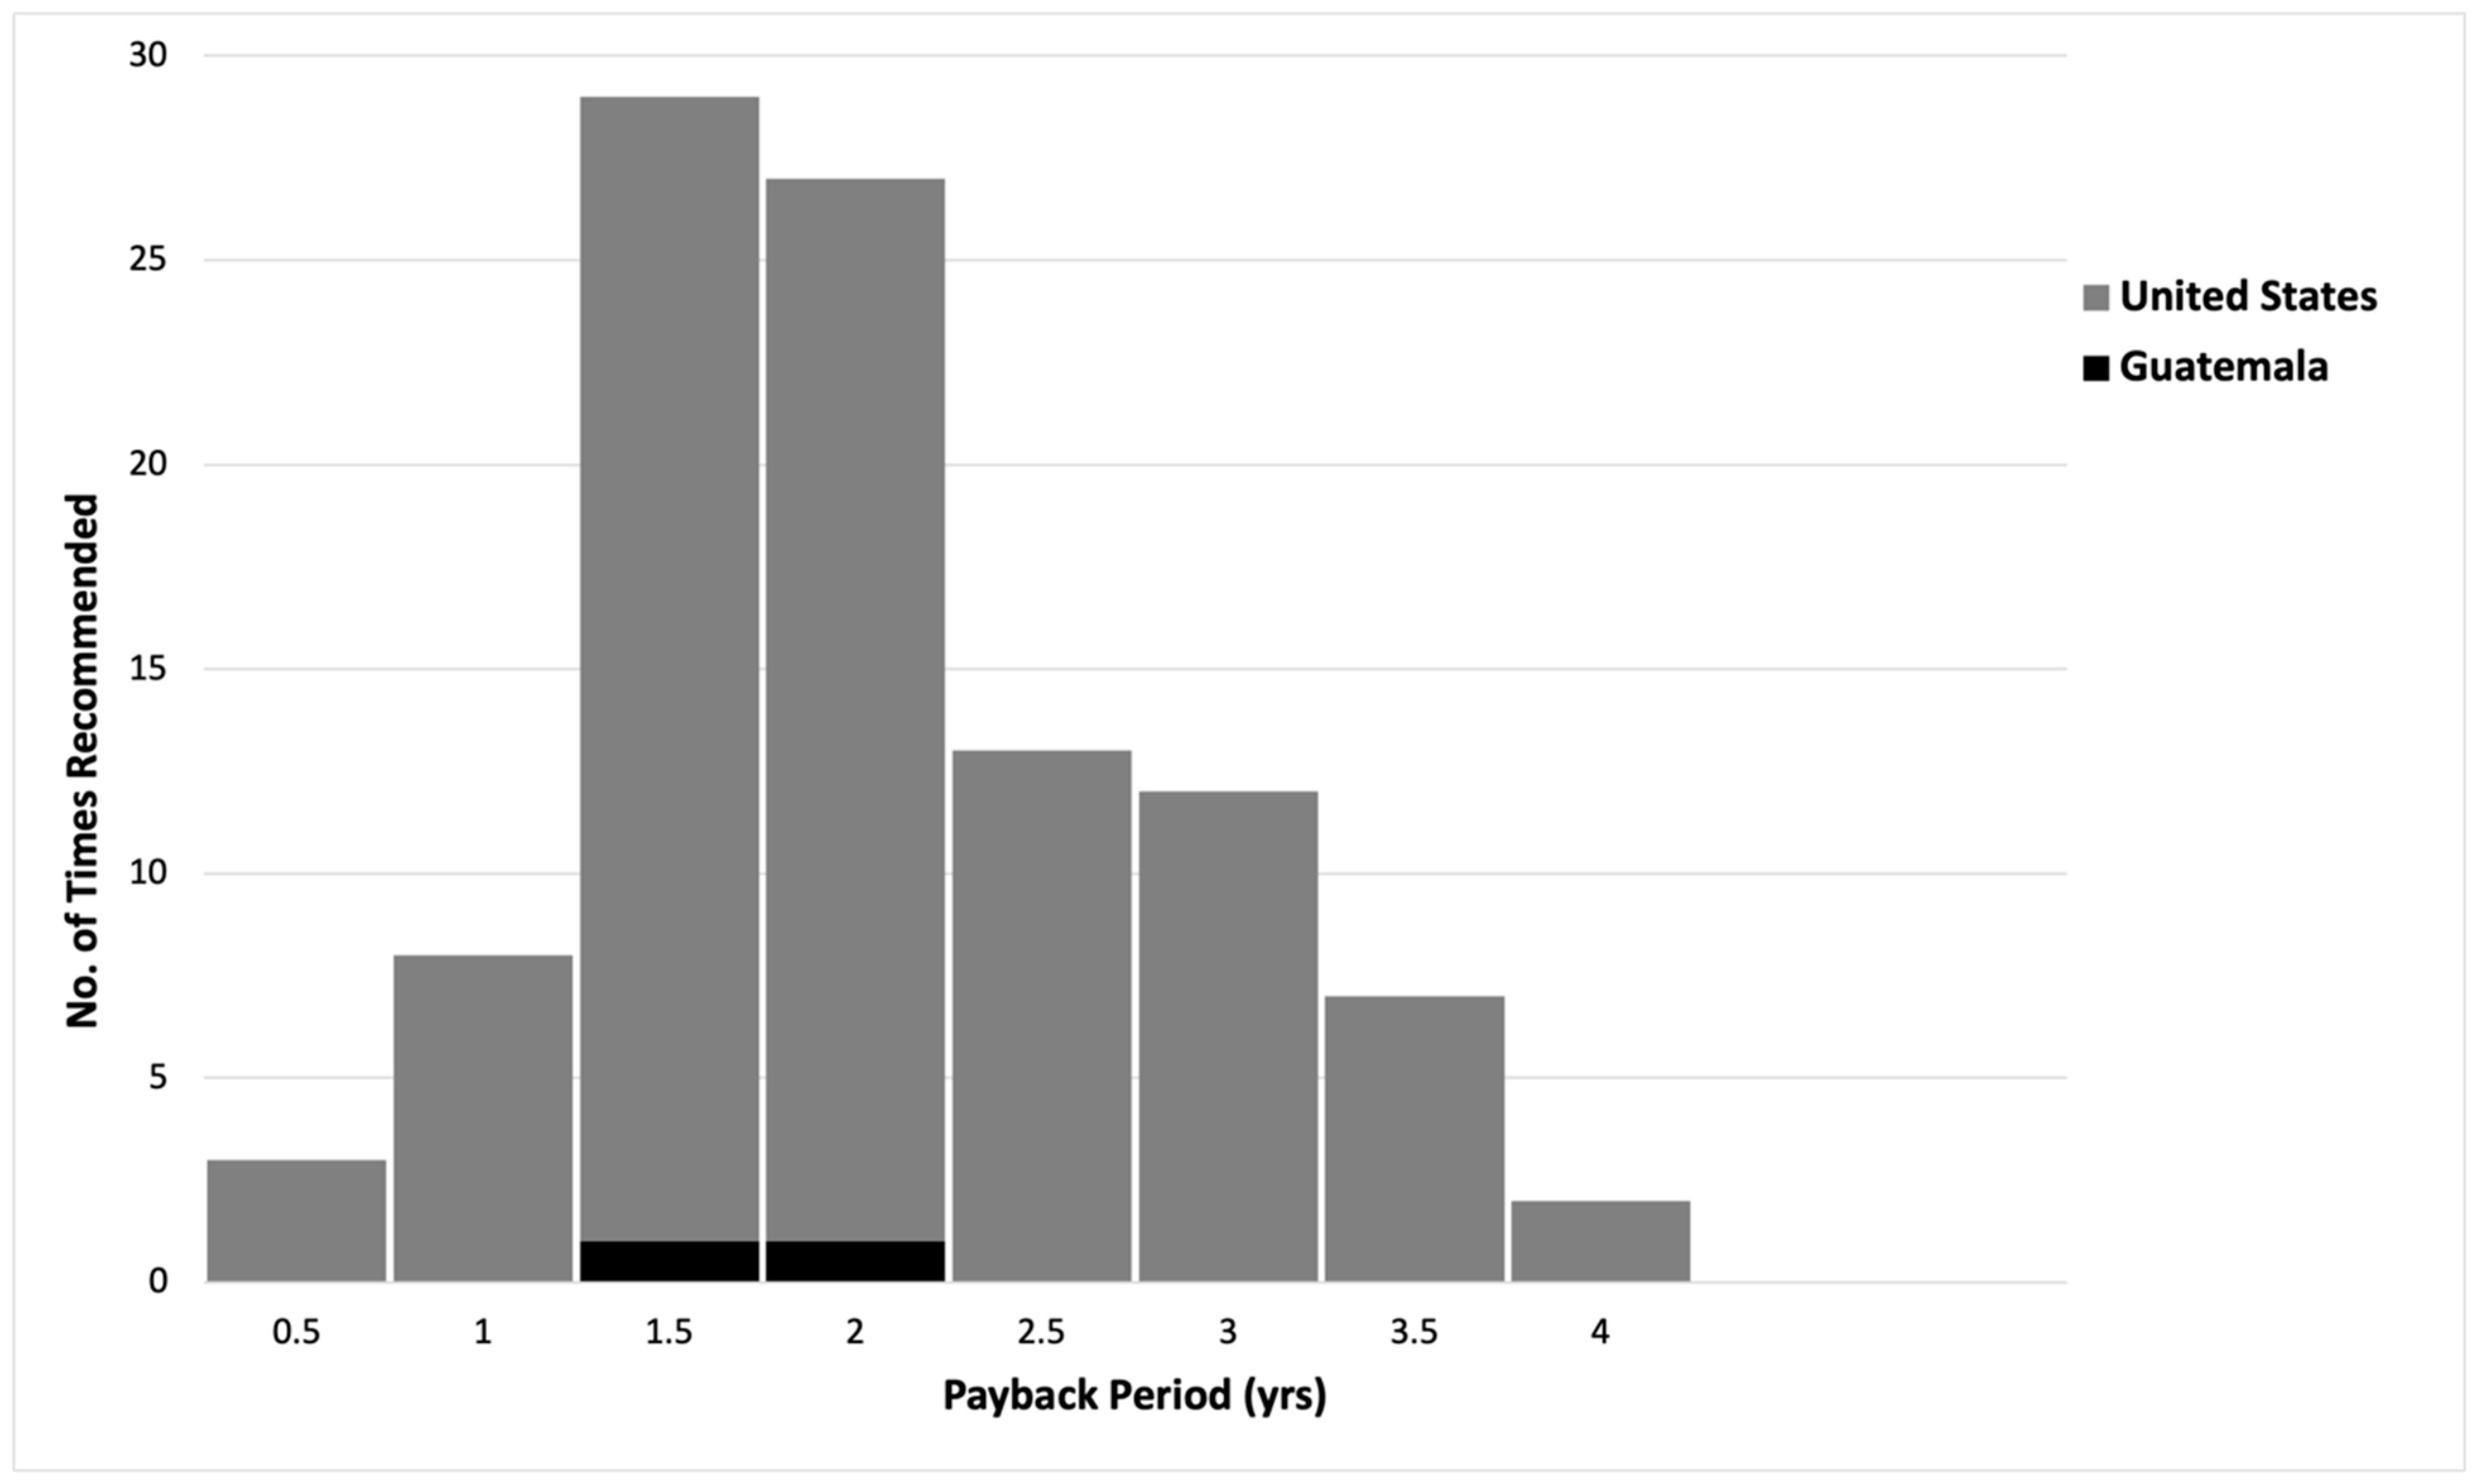
Figure 4, developed from the data presented in
Table 3 and
Table A1, shows the histogram distribution of payback periods for the recommended EEM to install solar panels to generate electricity in the U.S. and Guatemala. The payback periods for installing solar panels in Guatemala are far lower than the U.S. payback periods; the average Guatemalan payback period is ~5 years, while the average U.S. payback period is ~10 years, despite U.S. energy costs being USD ~0.10 per kWh lower than Guatemalan energy costs. From
Table 5, this is correlated with Guatemalan capital costs, which are USD ~0.40 per kW lower than U.S. capital costs for solar panel installation.
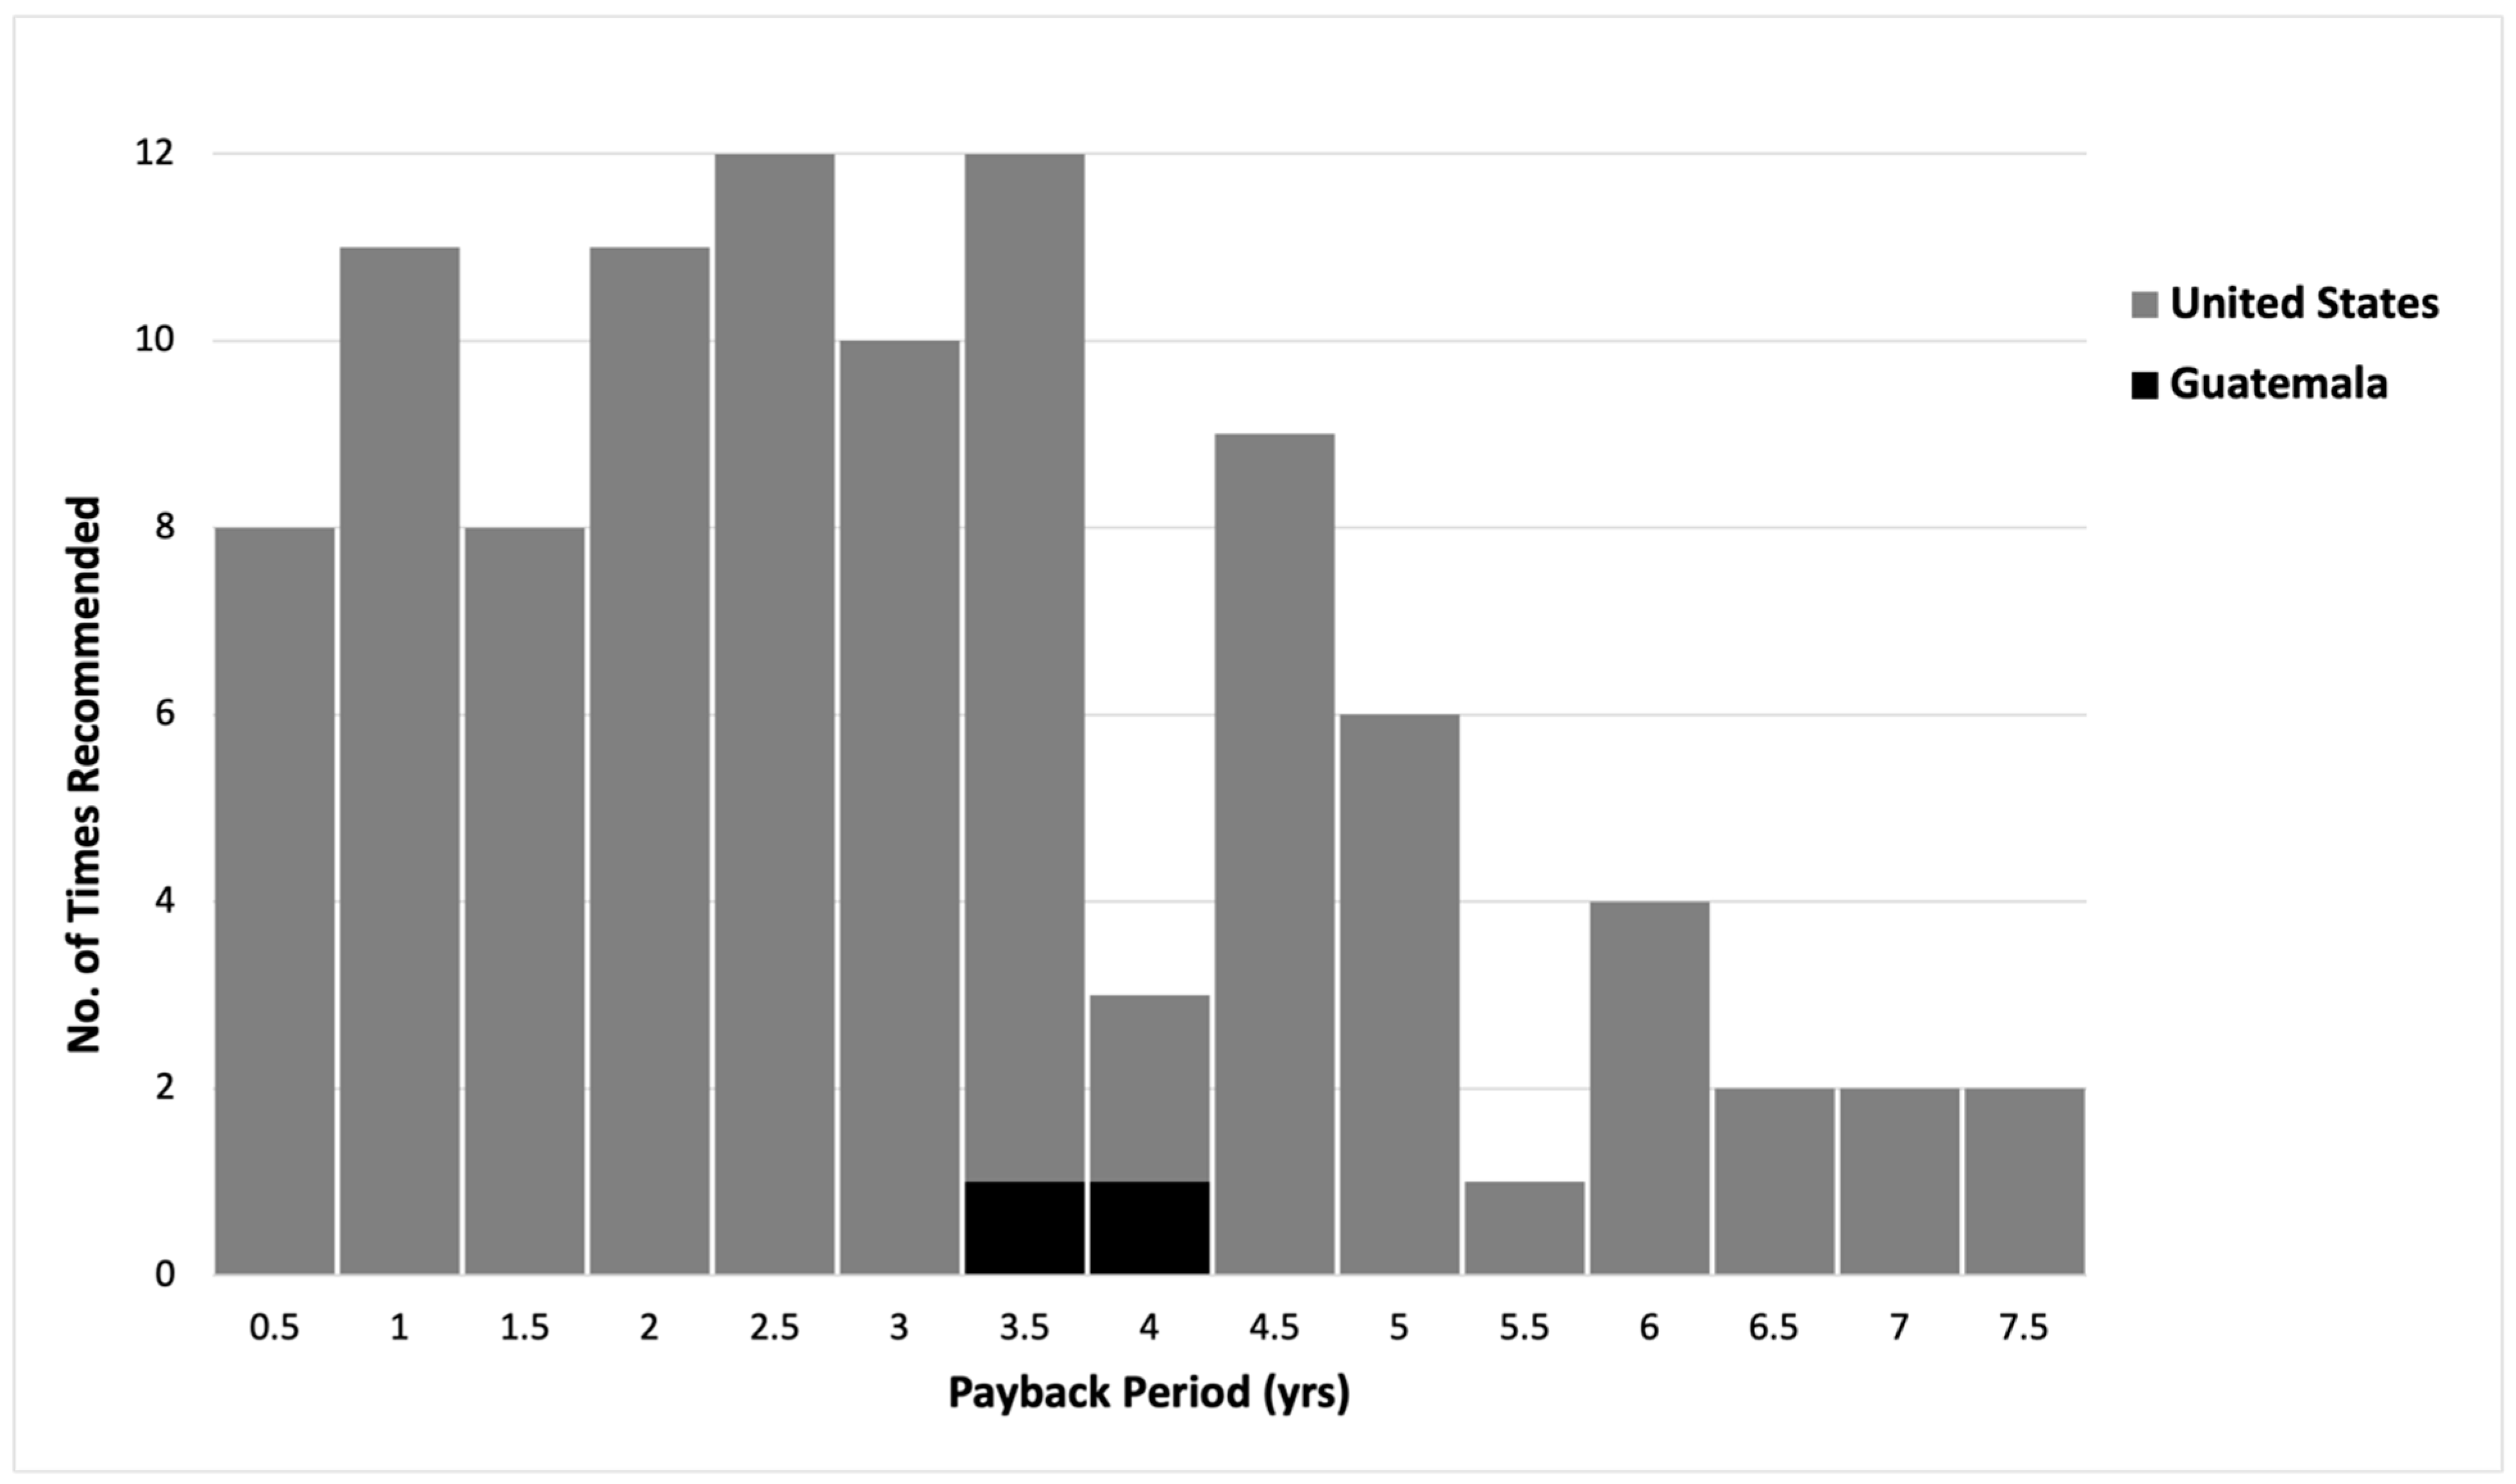
Figure 5, developed from the data presented in
Table 3 and
Table A2, shows the histogram distribution of payback periods for the recommended EEM to replace lighting with higher-efficiency lighting (i.e., LEDs) in the U.S. and Guatemala. The average Guatemalan payback period is ~1.7 years and the U.S. average is ~1.9 years. From
Table 5, Guatemalan capital costs for installing higher-efficiency LED lighting are more than twice the U.S. capital costs. Thus, in this case, lower Guatemalan energy costs and higher capital costs are correlated with similar payback periods, as seen in U.S. energy audits.
Figure 6, developed from the data presented in
Table 3 and
Table A3, shows the histogram distribution of payback periods for the recommended EEM to replace standard efficiency motors with premium efficiency equipment. The average Guatemalan payback period is ~3 years and the U.S. average is ~2.3 years. From
Table 5, Guatemalan capital costs for this EEM are ~50% greater than U.S. capital costs. Similar to the results in
Figure 5, higher Guatemalan capital costs and lower energy costs in this case are correlated with similar payback periods, as seen in the U.S. Additionally, the difference between U.S. and Guatemalan capital costs is greater in the higher-efficiency lighting case than in the motor upgrade case, and the difference between Guatemalan and U.S. payback periods for installing higher-efficiency lighting is lower than that of the recommended EEM to upgrade motors.
The correlations between capital and energy costs in a recommended EEM’s payback period demonstrated by
Figure 4,
Figure 5 and
Figure 6 are now further investigated by plotting projected payback period curves for each EEM recommendation calculated from Equations (2)–(9).
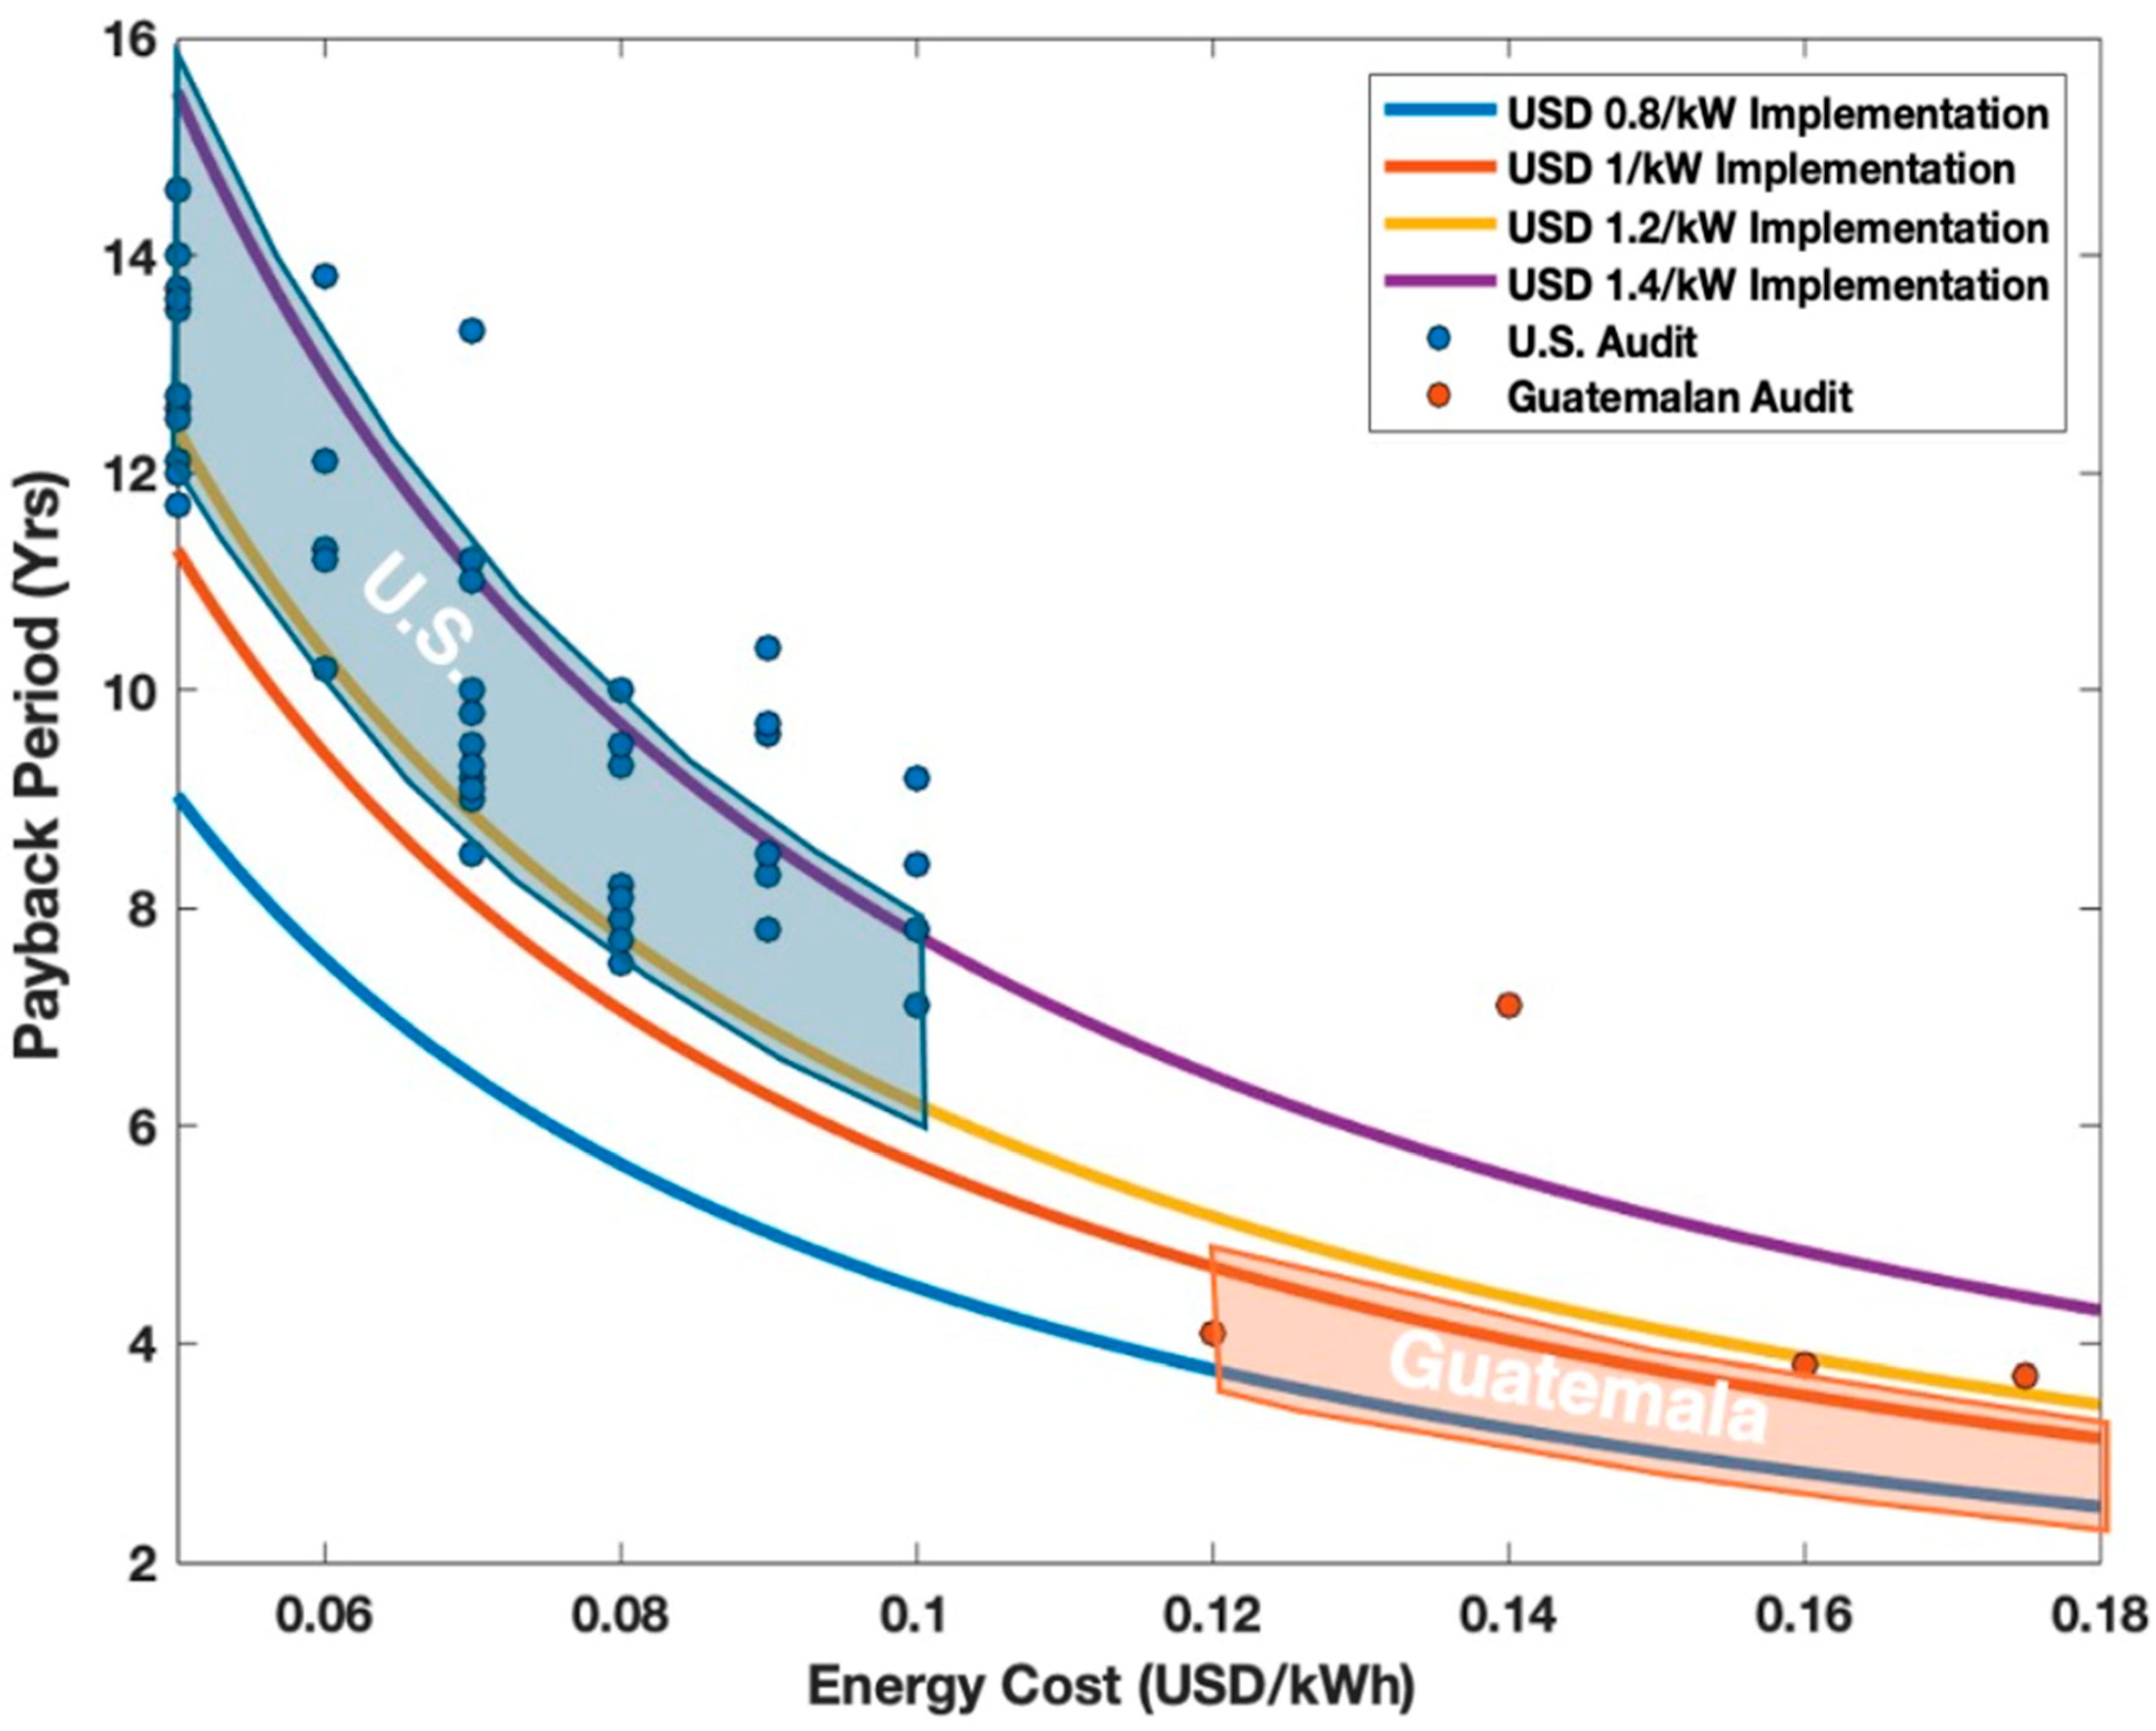
Figure 7 plots the expected payback period for the recommended EEM to install solar panels to generate electricity in the U.S. and Guatemala over the energy and capital cost ranges presented in
Section 2.3 and
Table 5. Energy audit data for each country [
20,
21] are plotted with the projected payback period curves, and note that only 50 data points of the 100 presented in
Table A1,
Table A2 and
Table A3 are plotted for figure clarity. The plotted curves in
Figure 7 indicate that payback periods can be expected to decrease with increasing energy costs and increase with increasing capital costs, and the correlations seen in
Figure 5 are corroborated by
Figure 7. For solar panel installation, the projected payback period area for each country in
Figure 7 is bounded by energy costs of USD 0.05–0.09 per kWh and capital costs of USD 0.8–1 per kW for the U.S. and by energy costs of USD 0.15–0.2 per kWh and capital costs of USD 1.2–1.4 per kW for Guatemala. As can be seen in
Figure 7, these projected areas indeed indicate that U.S. payback periods can be expected to be ~5 years longer than Guatemalan payback periods, which is reflected in the energy audit data from each country [
20,
21].
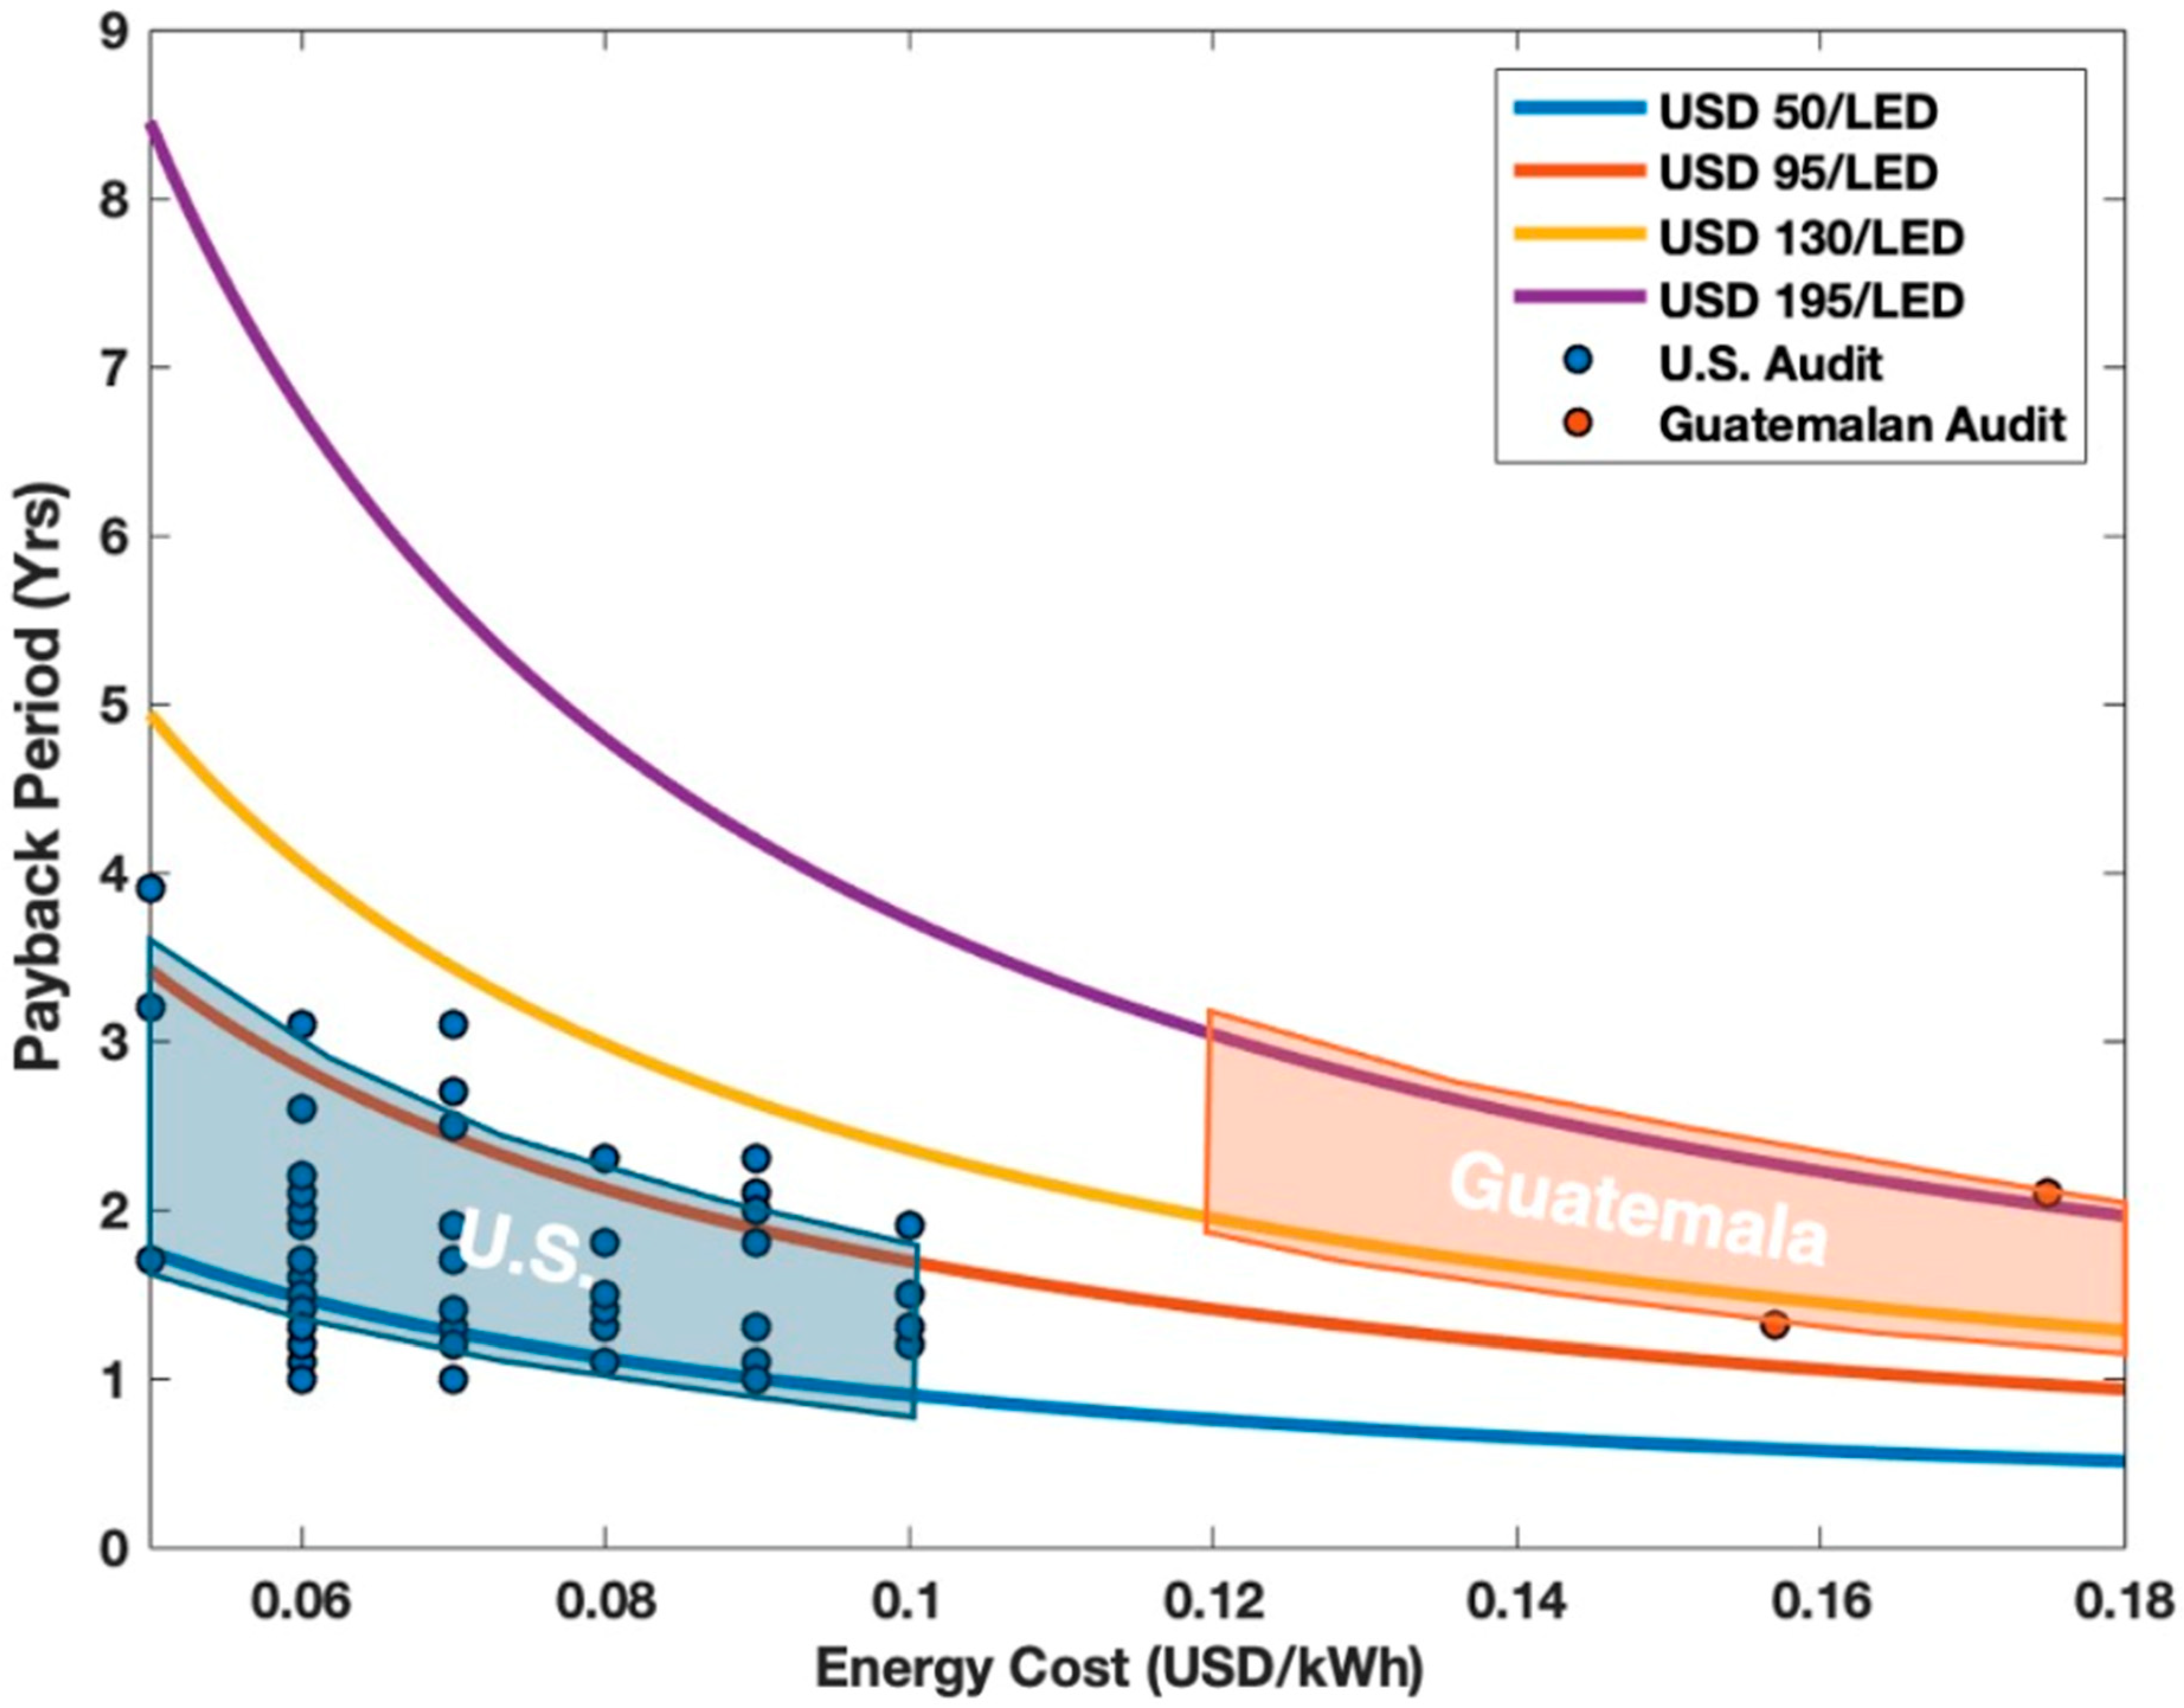
Figure 8 plots the expected payback period for the recommended EEM to replace current lighting with higher-efficiency lighting in the U.S. and Guatemala over the energy and capital cost ranges presented in
Section 2.3 and
Table 5. The projected payback period areas in
Figure 8 are bounded by energy costs of USD 0.05–0.09 per kWh and capital costs of USD 50–95 per LED light for the U.S. and by energy costs of USD 0.15–0.2 per kWh and capital costs of USD 130–195 per LED light for Guatemala. As expected based on
Figure 5, these projected areas indicate that U.S. payback periods for this EEM can be expected to be roughly the same as Guatemalan payback periods, a trend confirmed by the collected energy audit data [
20,
21].
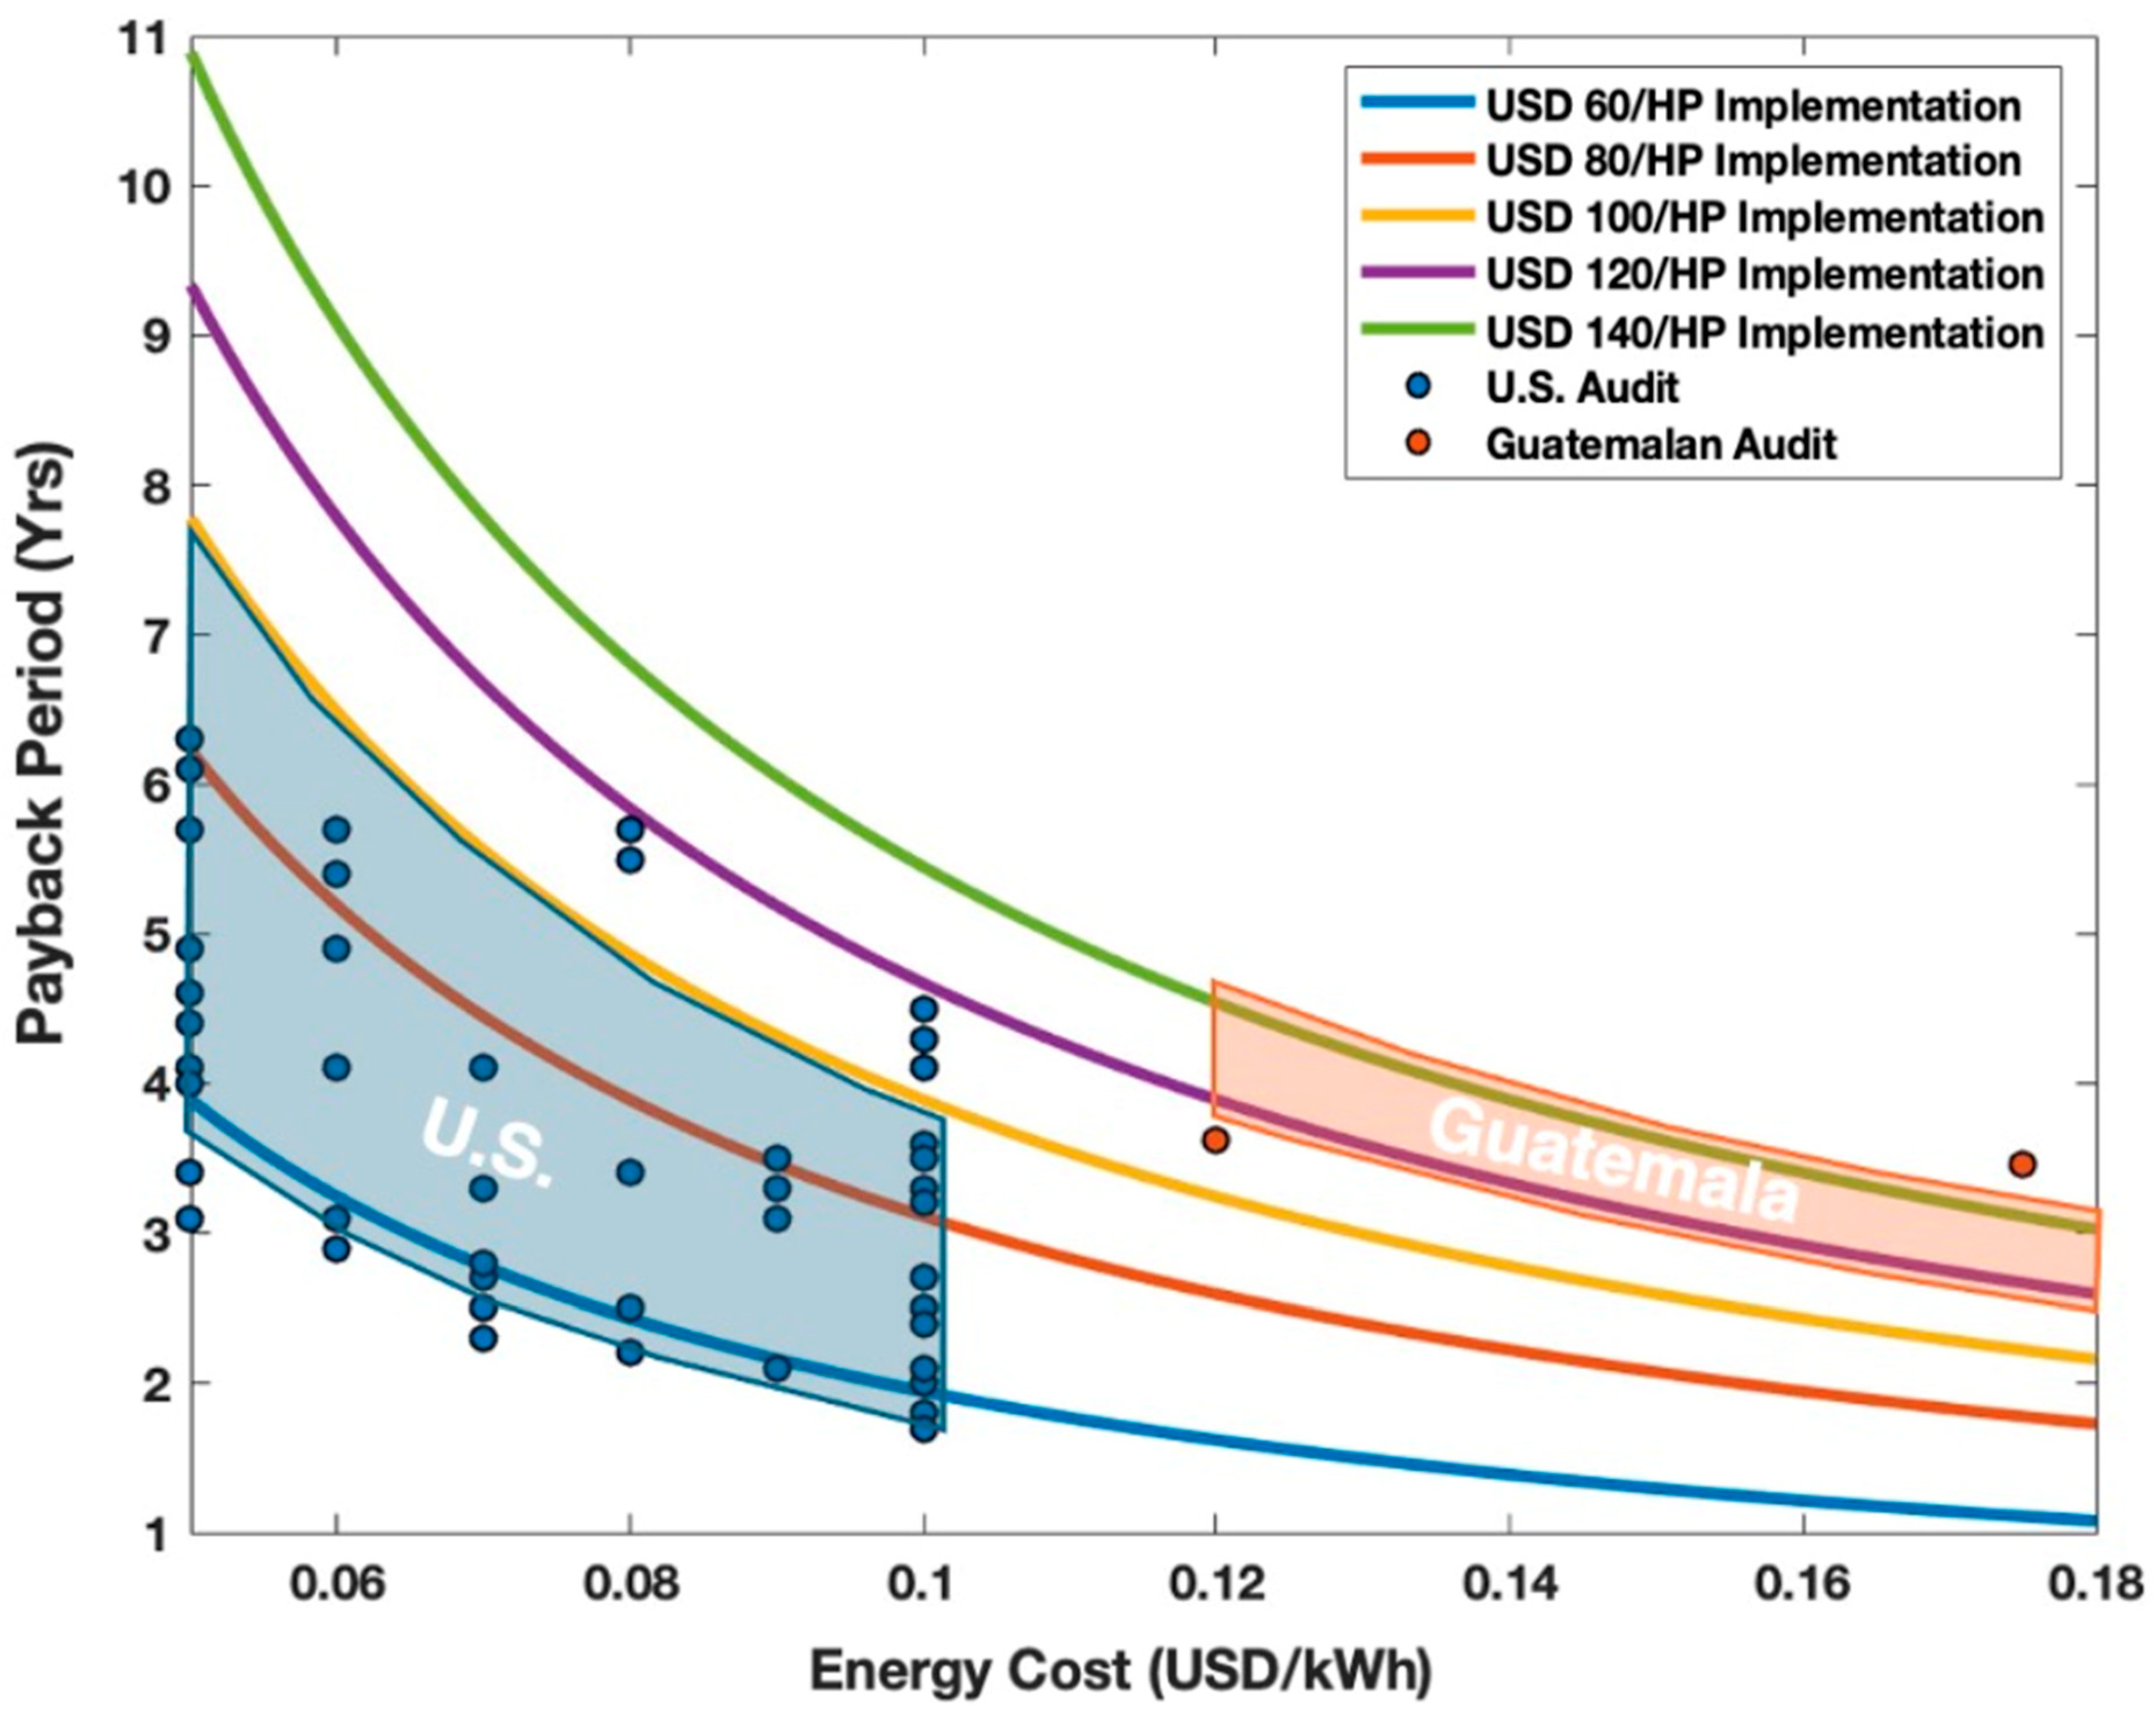
Finally,
Figure 9 plots the expected payback period for the recommended EEM to replace old motors with premium efficiency equipment in the U.S. and Guatemala over the energy and capital cost ranges presented in
Section 2.3 and
Table 5. The projected payback period areas in
Figure 9 are bounded by energy costs of USD 0.05–0.09 per kWh and capital costs of USD 70–90 per motor for the U.S. and by energy costs of USD 0.15–0.2 per kWh and capital costs of USD 100–120 per motor for Guatemala. As expected based on
Figure 6, these projected areas indicate that U.S. payback periods for this EEM can be expected to be similar and up to ~1 year shorter than Guatemalan payback periods, which is again reflected by the energy audit data [
20,
21].
The trends in
Figure 7,
Figure 8 and
Figure 9 can be tied directly to the motivating question of this study—how impactful is energy auditing for energy efficiency in developed vs. developing countries—by considering the existing work focused on EEM implementation. A 2012 study conducted by Fleiter et al. [
13] analyzing the barriers to the adoption of EEMs based on German energy audit data found that 80% of 160 facilities that received an energy audit reported high investment costs as a critical factor in the decision to forgo the implementation of an EEM. Further regression analysis also revealed that a lack of capital and low profitability held the highest statistical weight in the prediction of EEM adoption. A 2004 study [
28] analyzing the EEM adoption decisions of U.S. manufacturing facilities that received energy audits also found that the probability of EEM adoption declines logarithmically with increasing payback period. Numerous other studies in addition to these two cite implementation cost and payback period as critical factors in the adoption, and hence effectiveness, of a recommended EEM [
9,
10,
16,
28]. In combination with the results presented here, it is clear that across developing and developed countries, payback periods must be low for the sustainability-related benefits offered by an energy audit to be realized via EEM adoption, and that payback periods hinge on the balance of capital and energy cost.
4. Discussion
Guatemala’s energy sector is characterized by a lower per capita energy consumption than the U.S. In 2022, Guatemala’s per capita energy consumption was 0.714 MWh per person per year, which is significantly lower than the U.S.’s 12.87 MWh per person per year [
29,
30]. Additionally, a Guatemalan facility pays ~110% more on average for electricity than a facility in the United States [
29,
30]. This results in more favorable payback periods for Guatemalan EEM recommendations that reduce overall electricity consumption, and because Guatemalan electricity costs are higher, a facility in Guatemala would have a similar or lower payback period than a U.S. facility for the same EEM. This expected trend is corroborated by the results presented in
Figure 7,
Figure 8 and
Figure 9; as shown in the case of the solar panel installation EEM, the combination of lower capital cost and higher energy cost resulted in shorter payback periods in Guatemala. This also indicates that the balance of energy and capital cost is important in payback period calculation; though higher energy costs result in higher savings from reductions in energy consumption, higher capital costs can result in similar payback periods in some cases.
In the case of upgrading motors, the Guatemalan EEMs have roughly the same payback periods as the U.S. EEMs despite the higher savings that Guatemalan facilities would reap from their higher energy costs due to capital cost differences of only USD 30–50 per horsepower. Numerous studies have also reported that up-front EEM implementation costs have been found to hold more weight in the decision to implement an EEM than future energy savings [
27,
40,
41]. Given that nearly all of the projected future increase in global energy demand is expected to occur in developing countries like Guatemala, it is, therefore, important to consider—in light of the results presented here—that changing energy landscapes in developing countries will impact the effectiveness of EEMs recommended in energy audits. A 2021 study modeling how energy costs in Guatemala would be impacted by the adoption of renewable energy technology found that while solar power has the potential to meet projected Guatemalan energy demand for the lowest cost, the added cost of renewable energy generation translates to a 20–40% increase in energy expenditures [
22]. Should energy prices rise in Guatemala, according to the analysis presented above, the cost savings offered by reductions in energy use would increase, but capital costs have the potential to rise with increasing commercial demand as well.
The results presented here offer insight into the effect of energy technology subsidies on EEM payback periods as well, as they factor into the associated costs. The energy auditing services provided in the U.S. and resulting technology upgrades are occasionally subsidized, which has been found to reduce short-term implementation costs [
27]. However, while energy subsidies have been found to reduce energy inequality in developed countries with stable energy costs, in the case of developing countries, Henry et al. [
22] found that tax subsidies for EEM adoption may lower costs in the short term but also have the potential to raise energy prices in the long term, as new development costs trickle down to electricity consumers. The comparisons made here thus indicate that while higher Guatemala energy prices currently shorten payback periods, energy development in Guatemala—and other developing countries by extension—may shift the balance, especially given that lower short-term costs have long-term implications for energy costs.
In addition to providing insight into the effect of energy subsidies on energy efficiency, the results of this study can have implications for energy-related policy in developing countries as compared to developed countries. The establishment of energy audit programs has long been considered a useful instrument in improving energy efficiency—hence the U.S. involvement in Guatemalan energy auditing programs that serves as motivation for this study—but lack of incentive for EEM implementation presents a barrier to its effectiveness [
42]. As the successful implementation of EEMs can contribute significantly to closing a country’s energy efficiency gap while also having the effect of bolstering business and alleviating poverty for developing countries [
43], the results of this study can serve to inform what exactly the barriers to EEM implementation are given a country’s specific local energy and financial landscapes. For example, the results demonstrate that lowering capital costs through incentive programs can reduce the payback period and make EEM implementation more attractive in Guatemala, especially given the high energy costs.
5. Conclusions
The Guatemalan and U.S. energy audit data available in the IAC and PIEE databases [
20,
21] provide a unique opportunity to build on previous work investigating the effectiveness of energy auditing via EEM implementation by providing case study insight into the mechanisms that dictate EEM payback periods in both a developed and a developing country. It was found in previous work that shorter payback periods for recommended EEMs are correlated with higher implementation rates, and that lower implementation costs tend to be prioritized over future energy-saving potential by audited facilities.
This work finds that lower costs have the effect of reducing EEM payback periods and that an interplay between energy cost and capital cost exists in payback period calculation. In the case of solar panel installation, lower Guatemalan capital costs and higher energy costs resulted in payback periods that are nearly half of U.S. payback periods. However, as in the case of installing higher-efficiency lighting and upgrading motors, higher Guatemalan energy costs combined with higher capital costs resulted in payback periods very similar to those in the U.S. for the same EEMs, and the larger the difference between Guatemalan and U.S. capital costs, the lower the difference between each country’s payback periods. This indicates that capital costs and energy costs have opposite effects on EEM payback periods; as energy costs increase, payback periods decrease, while increases in capital costs increase payback periods. This also indicates that it is not capital costs alone that reduce payback periods but higher energy prices as well, so much so that even when Guatemalan capital costs are higher than in the U.S. (as for the higher-efficiency lighting and motor upgrade EEMs), higher energy costs prevent Guatemalan payback periods from increasing beyond those in the U.S.
In developing countries, as energy costs are less stable than in developed countries, lower short-term costs can have the effect of raising energy prices in the long term. Given the results of this study, this may indicate that for developing countries like Guatemala, payback periods may shorten further in the long term, but as a result of an overall increase in costs rather than a result of improved energy economics. Therefore, it follows that when citing energy auditing as a measure of energy efficiency, not only the energy audit data collected but also the socioeconomic context in which an energy audit was performed must be considered; tailored energy efficiency recommendations that consider local conditions and infrastructure can enhance energy savings. By leveraging the unique opportunities and addressing the specific challenges within a given country’s energy sector, substantial progress can be made towards sustainable energy consumption and environmental preservation.
It is additionally important to note that while this study provides insights for energy auditors in both Guatemala and the U.S. and emphasizes the need for context-specific energy strategies to achieve optimal results, it suffers from a lack of historical Guatemalan energy audit data. While data from hundreds of energy audits with the studied EEMs are available for the U.S., only data from five Guatemalan energy audits were available. Potential future work in this space may therefore benefit from an expanded data set, and a follow-up study comparing IAC data with EEM data from a variety of developing countries could serve to strengthen the comparisons made here. Additionally, as all of the Guatemalan data employed in this analysis are from audits conducted in 2023 and 2024, the implementation status of each analyzed EEM is currently unknown. Future work comparing the implementation of EEMs across developing countries could thus serve as an insightful extension of this study.


