Article

Development of a Hydrometallurgical Process for the Extraction of Cobalt, Manganese, and Nickel from Acid Mine Drainage Treatment By-Product

by
Alejandro Agudelo Mira
and
Qingqing Huang
*
Department of Mining Engineering, West Virginia University, 365 Mineral Resources Building, 1374 Evansdale Drive, Morgantown, WV 26506, USA
*
Author to whom correspondence should be addressed.
Environments 2024, 11(9), 194; https://doi.org/10.3390/environments11090194
Submission received: 11 July 2024 / Revised: 30 August 2024 / Accepted: 2 September 2024 / Published: 8 September 2024

Abstract

:
Critical minerals (CMs) are pivotal in modern industries, such as telecommunications, defense, medicine, and aerospace, contributing significantly to regional and global economic growth. However, the reliance on external sources for 26 out of 50 identified CMs raises concerns about supply chain vulnerabilities. To address this, the research focused on developing a hydrometallurgical process for extracting cobalt, manganese, and nickel from acid mine drainage (AMD) treatment by-products, emphasizing the need to diversify CM supply chains within the United States (US). A solution composed of an REE solvent extraction raffinate loaded with cobalt, manganese, nickel, and various impurity metals was utilized as a feedstock in this study. The developed hydrometallurgical process involved initial sodium hydroxide precipitation to remove impurities like aluminum and iron from an SX raffinate solution generated during the extraction of rare earth elements (REEs). Precipitation stages were performed in a pH region ranging from 2 to 12 to identify the optimum pH values, achieving a tradeoff between recovery and impurity removal. A subsequent precipitation process at pH 5–10 yielded a product rich in CMs, such as manganese, cobalt, and nickel. Further separation steps involved nitric acid washing, resulting in a Mn product with a purity of 47.9% by weight and a solution with extractable concentrations of cobalt and nickel. Stagewise precipitation with sodium sulfide subsequently produced three solid products: cobalt and nickel product at pH 1–5, manganese product at pH 5–10, and magnesium at pH 10–12. The study also explored other separation approaches, including solvent extraction, to enhance the separation of nickel from cobalt. Overall, the developed hydrometallurgical process generated the following products with varying degrees of purities: cobalt (9.92 wt.%), nickel (14 wt.%), manganese (47.9 wt.%), and magnesium (27.49 wt.%). This research aimed to contribute to the sustainable extraction of CMs from secondary sources, reducing the US’ reliance on imports and promoting a more resilient supply chain for these crucial elements.

1. Introduction

In the current era of technological advancements, societal transitions are underway to meet the evolving needs of environmental regulations, economic considerations, and social development [1]. This necessitates materials with specific chemical and physical attributes crucial for manufacturing goods and services that meet contemporary societal demands. These materials, recognized as critical minerals (CMs) by the U.S. Geological Survey [2], play a pivotal role in the economy and national security of the United States, rendering the supply chain vulnerable to potential disruptions.
The USGS first released a list of 35 CMs in 2018, later expanded to 50 elements in 2022. This dynamic classification considers mineral resource potential, consumption, production, disposal, and environmental interactions. It provides insights into the elements’ importance, interdependence across economic sectors, and forecasts potential disruptions in the supply chain [3].
Elements such as cobalt, manganese, nickel, zinc, aluminum, lithium, and magnesium, integral to diverse industrial applications, are indispensable for the sustainability and development of the economy. In 2022, 26 out of 50 CMs were entirely imported, emphasizing the nation’s reliance on foreign sources, notably China, the Democratic Republic of Congo, Australia, Indonesia, South Africa, and Canada [4]. Factors such as limited end-of-life recycling and rising global demand amplify the threat of supply chain disruptions, prompting the need for increased local production through innovative extraction technologies and alternative sources [5].
Manganese, cobalt, and nickel emerge as pivotal CMs in the global shift towards a low-carbon economy and clean energy. Cobalt faces supply risks due to its primary extraction as a by-product in copper and nickel processing [6]. Meanwhile, nickel demand surge is accompanied by uncertainties stemming from mining and export policies in Indonesia and the Philippines, exacerbated by COVID-19 impacts [7]. For manganese, challenges involve incomplete recovery from end-of-life products and slag, coupled with a geographical concentration of ore production locations [8]. To mitigate these risks, researchers explore alternative extraction methods and sources, including acid mine drainage (AMD) and its treatment by-product, which have demonstrated potential as a viable resource [9,10,11,12,13,14,15,16,17,18,19].
With this context, this study utilized coal AMD treatment sludge as a feedstock and presented a follow-up study on the previously developed process for rare earth extraction from the same feedstock [20]. The study continued investigating the feasibility of recovering additional CMs, including manganese, cobalt, and nickel, from a coal mine waste stream. Thus, a hydrometallurgical process was developed, capable of producing multiple concentrates from coal by-products in addition to rare earths. The study aimed to provide in-depth insights into CM extraction from alternative sources and enrich the body of knowledge on CM recovery.

2. Feedstock and Materials

2.1. Feedstock

The feedstock used in this study for critical minerals extraction was derived from coal-based acid mine treatment sludge. The sample was collected from an AMD treatment facility located in Central Appalachia. Upon receiving the samples at the Mineral Processing Lab, Inductively Coupled Plasma Mass Spectrometry (ICP-MS) analysis at West Virginia University’s National Research Center for Coal and Energy (NRCCE) Laboratory was employed to analyze the elemental composition of each sample for rare earth elements (REEs), critical minerals, and impurities. Before ICP-MS analyses, solid samples were calcinated at 1000 °C for 4 h and fused using a sodium peroxide-based method. The resultant fuseate was dissolved into a dilute nitric and hydrochloric acid solution, which was then submitted for ICP-MS analyses. Throughout the analysis, each batch of no more than 20 samples had a batch blank and Laboratory Control Sample. In addition, each batch had one sample run in duplicate to monitor the test results’ reproducibility. Detailed ICP-MS results of the sample on a dry basis are shown in Table 1.
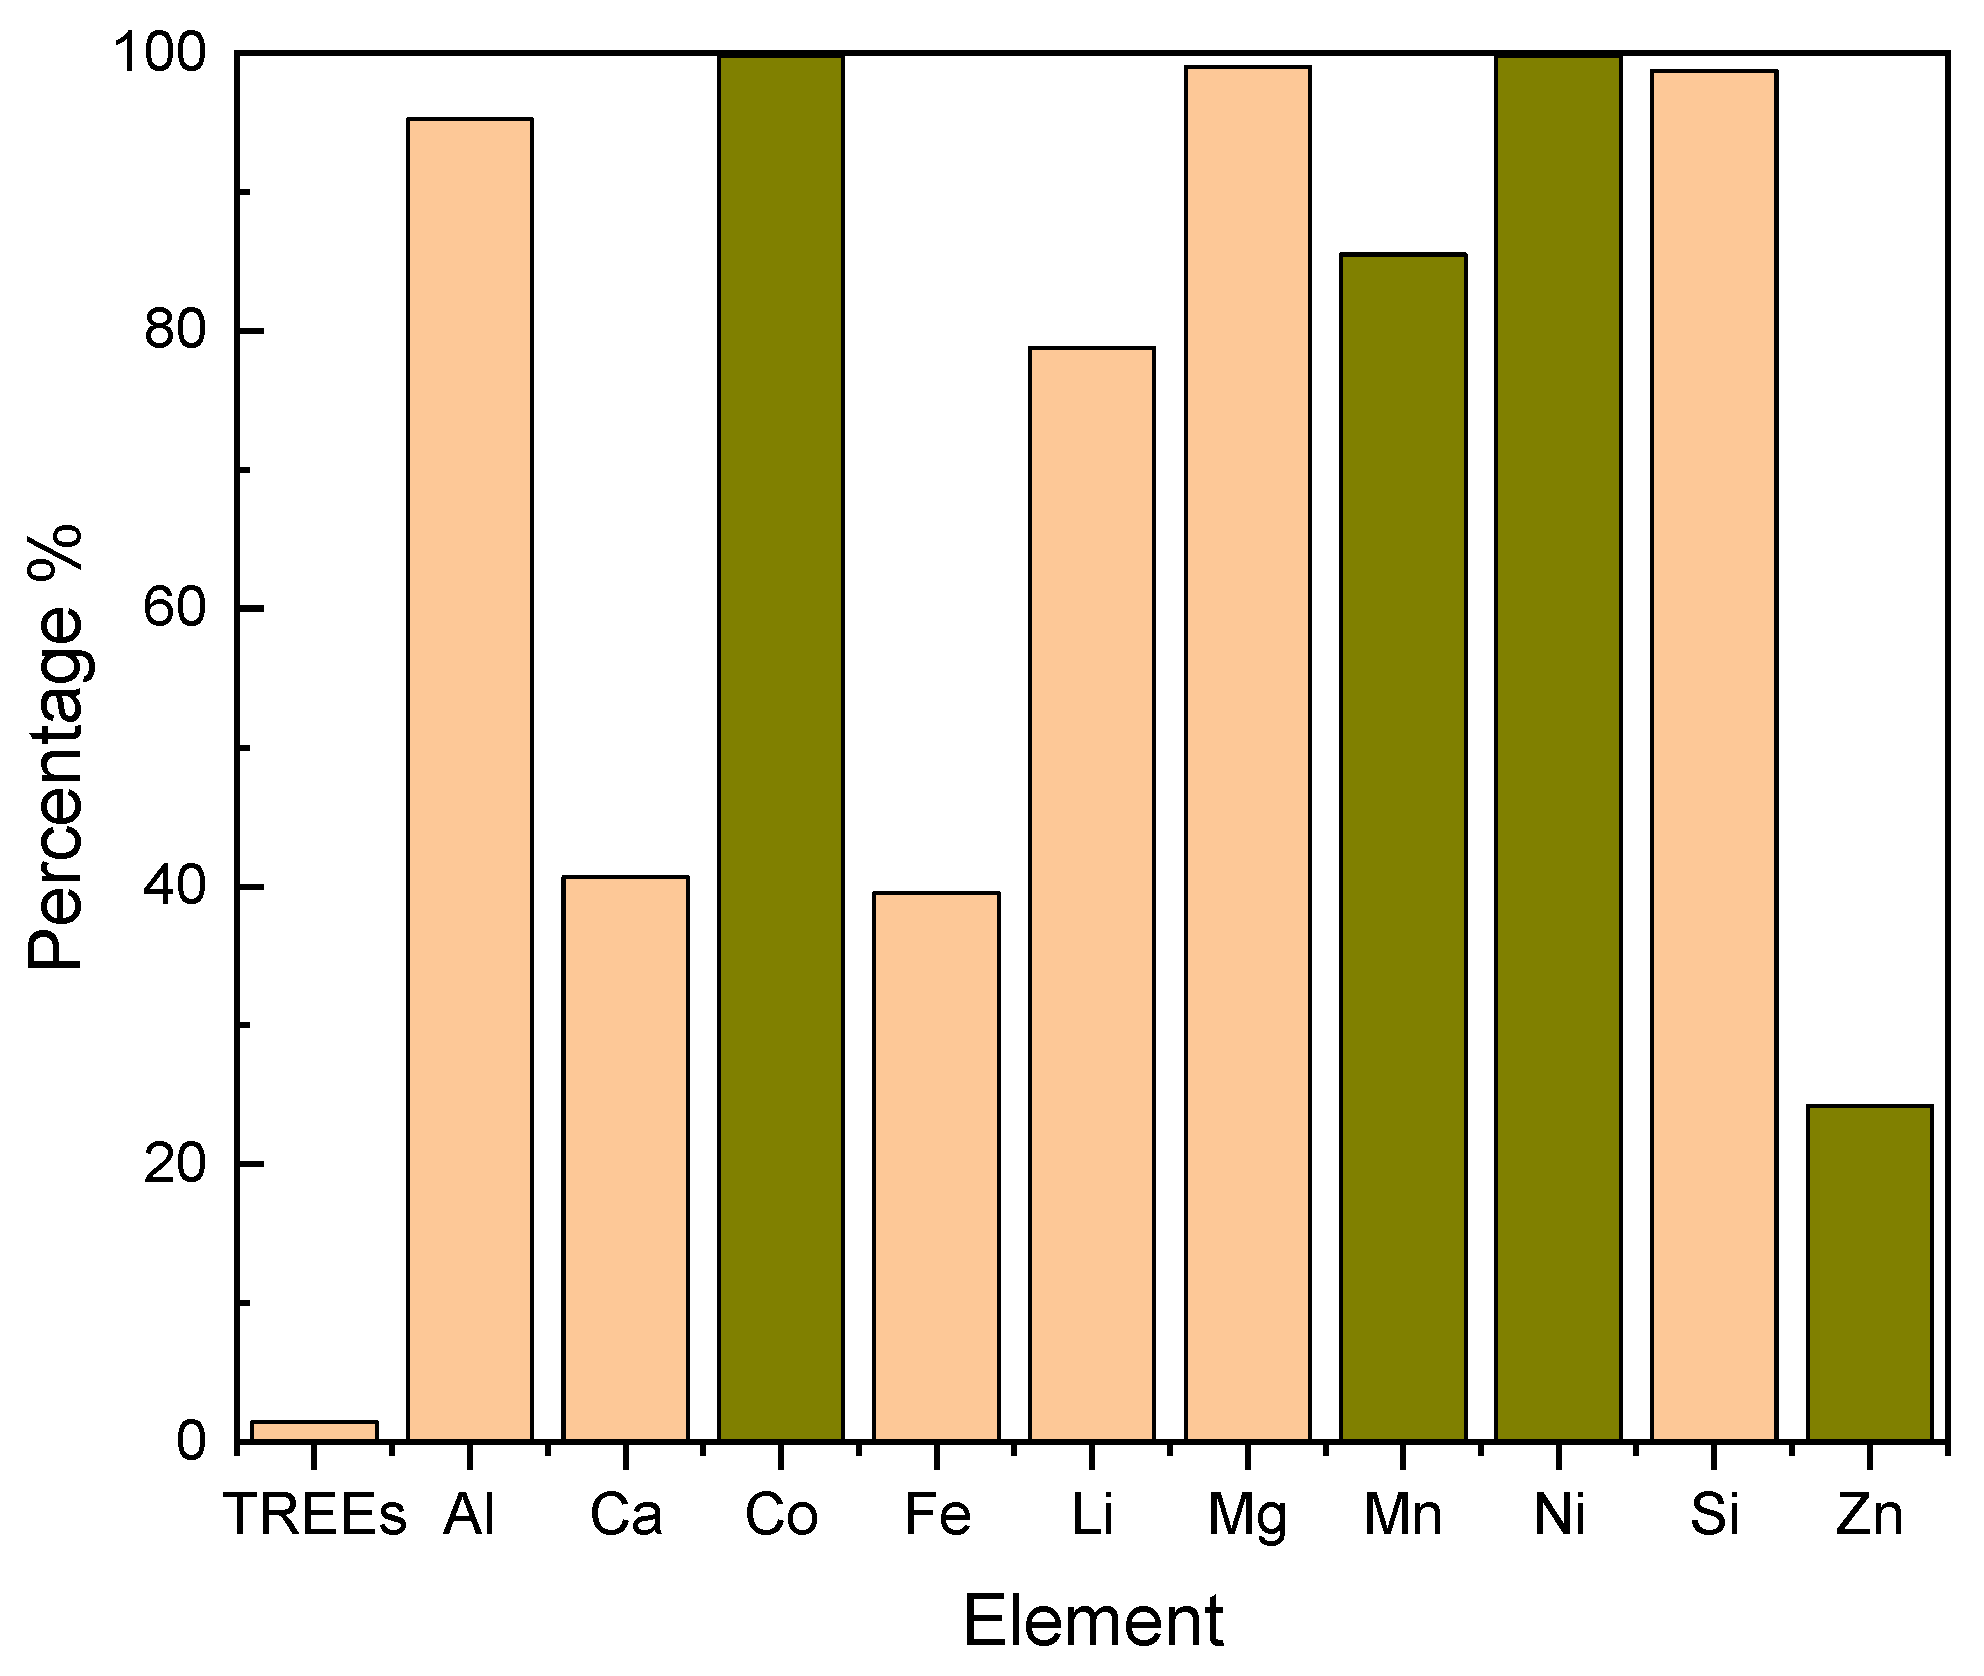
Table 1 shows that the feedstock contained around 0.04 wt.% of REEs, 1.11 wt.% of Mn, 0.02 wt.% of Co, 0.03 wt.% of Ni, and 0.06 wt.% of Zn. In addition, a high amount of Al, Mg, and Fe was also noticed, with a corresponding content of 2.63 wt.%, 1.11 wt.%, and 1 wt.%, respectively. A previous study was conducted on the same feedstock to selectively recover REEs and produce rare earth oxide with a purity of 80% by weight [20]. This developed process consisted of sulfuric acid leaching, oxidation precipitation to remove impurities such as iron and aluminum, and solvent extraction using Di-(2-Ethylhexyl) phosphoric acid dissolved in kerosene [20]. Throughout the REE extraction process, the partitioning of other critical minerals (CMs), including Co, Mn, Ni, and Zn, was also monitored. The distribution of these select CMs during REE solvent extraction is shown in Figure 1.
As can be seen from Figure 1, most REEs were successfully extracted during solvent extraction along with a certain amount of Fe and Zn. However, no Co and Ni were extracted, and approximately 90% of Mn remained in the raffinate. The concentration of Mn, Co, and Ni in the raffinate solution was around 370.69, 38.34, and 69.41 mg/L, respectively, as shown in Table 2. The contents of these select CMs were noticeably higher than the rest of the unit streams throughout the process. All these presented an opportunity to further recover additional CMs. Therefore, the rare earth solvent extraction raffinate was selected as a feedstock for the continuous extraction of Mn, Co, and Ni for value addition.

2.2. Materials

Various lab-scale equipment and chemicals were purchased from authorized sellers through the institutional website platform, WVU marketplace. Essential chemicals used in the development of the experiments included sulfuric acid (H2SO4) with a purity of 98 wt.% purchased from Fisher Scientific (Hampton, NH, USA). Sodium hydroxide pellets (NaOH) with a purity greater than 90 wt.% and sodium sulfide (Na2S) with a purity greater than 98 wt.% were ordered from Sigma Aldrich (St. Louis, MO, USA). Nitric acid (HNO3, 70 wt.%) was provided by Fisher Scientific, while hydrochloric acid (HCl, 37 wt.%) was purchased from Hack. Cyanex 272 (Bis(2,4,4-trimethylpentyl) phosphinic acid, 85 wt.%) was provided by Solvay USA (Chicago, IL, USA), and kerosene with a reagent grade was purchased from Sigma Aldrich for lab-scale testing. Equipment like Mettler Toledo (Columbus, OH, USA) pH meters, a Phipps & Bird’s INC (Richmond, VA, USA) jar tester, and a Caframo (Georgian Bluffs, Ontario, Canada)overhead mixer were used in different stages. Solid–liquid separation employed a horizontal centrifuge and laboratory vacuum filtration. Rigorous cleaning protocols were followed for glassware to avoid contamination. All laboratory glassware and lab supplies, including cylinders, beakers, funnels, stirrers, flasks, and tubes, among others, were carefully washed with soap detergent and rinsed with DI water to ensure no contaminants in the samples.

3. Experiment and Methodology

3.1. Sodium Hydroxide Stagewise Precipitation

Given the presence of impurity elements such as Al and Fe in the raffinate solution, stagewise precipitation was first conducted using 2M sodium hydroxide (NaOH) to identify the critical pH region where the removal of impurities could be maximized with minimal CM loss [9,21]. The addition of 2M NaOH to the raffinate solution was expected to progressively increase the pH, leading to the precipitation of various elements at the attained pH values during the first 10 min before the separation of the aqueous and solid phases. To conduct the test, a 300 mL sample with an initial pH of 2.2 was filtered using a filter paper with a pore size of 0.45 um to eliminate residual solids in the raffinate. Then, the solution’s pH was gradually raised to each target pH set point. Upon observing the precipitation of solids, the sample underwent centrifugation at 4000 RPM for 12 min, followed by filtration. The collected solids were dried and weighed while the aqueous solution continued to be used for further assessment of precipitation at varying pH levels. This process was iterated across the pH range from 3 to 11 to study the precipitation behavior of various elements at different pH values. Both representative solid and liquid samples at each stage were collected for ICP-MS analyses. Precipitation recovery percentages were determined following the equation below:
P r e c i p i t a t i o n   % = C r V r C f V f × 100
where Cf and Cr correspond to the feed solution volume and filtrate raffinate volume, respectively; on the other hand, Vf and Vr are the corresponding concentrations of the element of interest in the two solutions separately.

3.2. Nitric Acid Dissolution

For continuous CM extraction, solids collected from stagewise precipitation at pH 5–10 were dissolved in nitric acid to separate CMs from impurities. According to Boukerche et al. (2010) [22], under acidic conditions, dissolution rates of manganese, cobalt, and nickel can range from 80% to 99%. The solid precipitate, rich in cobalt, manganese, and nickel, was dried for 24 h, followed by partial dissolution in 0.5 M nitric acid to obtain high-purity manganese. The test involved mixing solids with nitric acid (1:100 S:L ratio) for 1 h at 75 °C. Afterward, the remaining solids were centrifuged at 4000 RPM for 12 min and separated using a laboratory vacuum system with 0.45 µm pore-sized filter paper [22,23].

3.3. Sodium Sulfide Precipitation

The solution generated during nitric acid dissolution was mainly rich in cobalt and nickel. However, low amounts of manganese and other impurities were still present. Sodium sulfide precipitation was then performed based on the distinctively different precipitation pH of Co, Ni, and Mn with Na2S to achieve a target selectivity [9].
One M Na2S solution was gradually added to the remaining nitric acid solution and mixed at 150 RPM. Three precipitation stages were conducted throughout the test to selectively remove solids at pH 5, 10, and 12. Starting with a pH of around 1, the solution’s pH was first increased until it reached 5 followed by centrifugation and vacuum filtration. The exact process was repeated with the filtrate solution for pH adjustment to 10 and 12. Solids and representative filtrate samples were collected at each pH set point for ICP-MS analyses.

3.4. Hydrochloric Acid Dissolution

To further purify and selectively extract cobalt and nickel, the solid with concentrated cobalt and nickel obtained from sodium sulfide precipitation was redissolved with hydrochloric acid, yielding a purer solution rich in the same elements. The dissolution of the elements occurred through the formation of soluble chloride salts due to the release of chloride ions (Cl) and the reactivity of these metals. The experiment involved mixing solids with 2M hydrochloric acid at a solid–liquid ratio of 1:100 at 100 RPM under the temperature of 85 °C for two hours. Afterward, the residual solids were removed from the liquid by centrifugation and filtration.

3.5. Cyanex 272 Solvent Extraction

The solution resulting from hydrochloric acid dissolution was subsequently subjected to solvent extraction to separate cobalt from nickel. Cyanex 272 provided by Solvay (Chicago, IL, USA) was used as the extractant. The organic phase containing 0.5 M 50% saponified Cyanex 272 dissolved in kerosene was prepared and used for the selective extraction of cobalt over nickel [24,25]. The feed pH was adjusted from an initial value of 0.5 to 6 to stabilize metal ions and eliminate contaminants such as aluminum via precipitation. Solvent extraction tests were carried out at the following conditions: an organic–aqueous (O:A) ratio of 1:1, 20 min mixing at 800 RPM, and an equilibrium pH between 4.5 and 5 for a suitable separation of cobalt and nickel in chloride media. Solvent extraction efficiency was calculated following a similar approach as shown in Equation (1), in which both the volume and elemental concentration of the feed and SX raffinate solutions were considered.

Cyanex Saponification

Cyanex 272 saponification was conducted using 0.25 M of sodium hydroxide to reduce the release of hydrogen ions during solvent extraction, which can impair extraction efficiency. The prepared sodium hydroxide solution was added to the organic phase to react with Cyanex 272 and form sodium–Cyanex compounds. The process involved mixing 0.5 M of Cyanex 272 with 0.25 M of sodium hydroxide at a 1:1 ratio for 2 h at 800 RPM. Following two hours of mixing, the solution was transferred to a separating funnel to separate the remaining alkaline solution from the organic [26]. The organic solution was then washed multiple times to remove any residual contaminants and sodium salts generated during saponification.

3.6. XRD and SEM Analyses

In addition to laboratory experimental tests, analytical analyses were also conducted on the obtained products for sample characterization. X-ray diffraction (XRD, D8 Discovery, Diffractometer, Bruker, Germany) analyses were conducted on the manganese product to determine its mineralogy. A scanning electron microscope energy-dispersive X-ray spectroscopy (SEM-EDS) analysis was performed on manganese and nickel products to provide detailed sample characterization information. The Hitachi S4700 Scanning Electron Microscope (Santa Clara, CA, USA) was used for the SEM-EDS analysis. Prior to analysis, the sample was subjected to sputtering using Denton Desk V Sputter and Carbon Coater to prevent charging and improve the quality of the image. During the analysis, accelerating voltage and working distance were kept at 5 kV and 12 mm, respectively.

4. Results and Discussion

4.1. Sodium Hydroxide Stagewise Precipitation

Stagewise precipitation test results with sodium hydroxide are shown in Figure 2. The main impurities, namely aluminum and iron, underwent precipitation in the pH range from 2 to 5. The concentration of these elements decreased gradually from pH 2 to 4. Notably, at pH 5, the aluminum concentration significantly dropped from 3089 mg/L at pH 4 to 19.61 mg/L, and iron exhibited a similar trend, decreasing from 257.25 mg/L at pH 4 to 1.41 mg/L at pH 5. Additional elements, including silicon and phosphorus, also experienced significant reduction at this pH. Conversely, at pH 5, the cumulative precipitation rates were 28.91 wt.% for manganese, 40.41 wt.% for cobalt, and 44.87 wt.% for nickel. This represents a content reduction of 11.99 mg/L, 64.35 mg/L, and 23.85 mg/L, respectively, from their initial concentrations. Consequently, pH 5 emerged as a promising value for impurity removal while maintaining suitable concentrations of cobalt, manganese, and nickel despite the presence of magnesium and calcium in the solution.
Based on previously gathered information, the decision was made to collect solids in two distinct pH ranges (2 to 5 and 5 to 10). This aimed to produce a pre-concentrate of cobalt, manganese, and nickel, predominantly obtained from the pH 5 to 10 range. At pH 9, approximately 99 wt.% of nickel and cobalt was precipitated, while manganese achieved a cumulative precipitation of 74 wt.%. Around 99 wt.% of manganese precipitation was accomplished at pH 11, but it also led to the precipitation of other impurities, such as magnesium. Therefore, solid collection ceased at pH 10, where manganese precipitation reached 94 wt.% while avoiding additional impurity precipitation.
ICP-MS analysis of the collected solids from both pH ranges revealed their elemental compositions and the grades of critical minerals and impurities, as shown in Table 3. As anticipated, the low pH range precipitated most impurities, resulting in an Al and Fe grade of 8.3 wt.% and 1.2 wt.%, respectively. Solids generated in the high pH range had content percentages by weight of 2.7 wt.%, 0.35 wt.%, and 0.67 wt.% for Mn, Co, and Ni, separately.
To validate the results obtained by the experimental procedure, Visual MINTEQ 3.1 was used to simulate the stagewise precipitation, which began at an initial pH value of zero and was completed at pH 14. The simulation allows it to predict the chemical species precipitated at different pH values based on the elemental composition and water chemistry of the feedstock solution used in laboratory testing. Table 3 presents the predicted species with their respective saturation index values for pH 5 and pH 10, respectively. As known, saturation index (SI) is a quantity commonly used to determine whether the solution is saturated, undersaturated, or supersaturated with respect to the given mineral and is calculated according to the following equation:
S I = l g I A P K s p
where IAP is the ion activity product, and Ksp is the equilibrium solubility product constant [27].
A positive SI value indicates precipitation, while negative values suggest that the mineral remains dissolved in the solution. As seen in Table 4, the results obtained from sodium hydroxide precipitation are well correlated to the predicted results. The chemical species predicted to precipitate are mostly aluminum and iron compounds at pH 5, including Boehmite (Al2O3·H2O), Diaspore (AlO (OH)3), Gibbsite (Al(OH)3), Hercynite (FeAl2O4), Mirabilite (Na2SO4.10H2O), and other compounds such as Al4(OH)10SO4(s) and AlOHSO4(s). On the other hand, at pH 10, compounds of Mn, Co, and Ni are precipitated according to the simulation, including Co(OH)2, CoO(s), Ni(OH)2, Ni4(OH)6SO4(s), and Pyrochroite (Mn(OH)2).

4.2. Nitric Acid Dissolution

Through NaOH precipitation in the pH range of 5 to 10, enriched solids with Co, Ni, and Mn were collected at pH 10 after 10 min of reaching the desired value. Then, these solids underwent a 0.5 M nitric acid dissolution process to selectively dissolve Co and Ni while keeping Mn in the solid phase. Throughout the process, approximately 94% of the initial mass was dissolved in nitric acid, resulting in a dissolved solution and a solid residue. ICP-MS analysis results of the solid residue indicate a significantly elevated Mn purity from an initial value of 2.77 wt.% to 46.99 wt.%. On the other hand, cobalt and nickel experienced slight decreases in their weight percentages, resulting in grades of 0.6 wt.% and 0.24 wt.%, respectively. Detailed elemental compositions of the dissolved solution and solid residue are shown in Table 4 and Table 5, respectively.
Figure 3 shows that the nitric acid dissolved solution contained approximately 393.02 mg/L of Co and 619.87 mg/L of Ni, which holds promise for further recovery of these two elements. On the other hand, around 2053.40 mg/L of Mn and 2437.21 mg/L of Mg were also present in the solution, along with other impurities, such as Al and Zn. Therefore, the nitric acid dissolved solution was subsequently subjected to Na2S precipitation to separate different CMs in the solution. In the meantime, a Mn concentrate with a purity of 46.99 wt.% was produced from the same experimental procedure.

4.3. Sodium Sulfide Precipitation

The solids obtained from the 3-stage precipitation exhibited promising results for the potential separation of Ni, Co, Mn, and Mg. In the pH range of 1 to 5, the precipitated solids were combined, and ICP-MS analyses of the mixed solid indicate that it contained approximately 8.35 wt.% of Ni and 5.25 wt.% of Co. However, aluminum was also present with a concentration of 4.27 wt.%. Upon increasing the pH from 5 to 10, a solid product with a Mn grade of 20.15 wt.% was generated, indicating an additional stream for Mn extraction. Finally, a Mg concentrate was obtained at pH 10–12 with a purity of 27.49% wt.%. The ICP-MS characterization of the solids generated from the 3-stage Na2S precipitation is detailed in Table 6.
Like sodium hydroxide precipitation, validation of the results obtained by experimental testing was also conducted using Visual MINTEQ 3.1 to predict the mineral species to be formed with the given water chemistry. Based on the experimental observations, most of the cobalt and nickel compounds were precipitated at pH 5; this fact can be validated by the simulation results shown in Table 7. As seen from the table, cobalt and nickel compounds are precipitated at pH 5, including CoS (alpha), CoS (beta), NiS (alpha), and NiS (beta). Moreover, at a pH range of 5 to 10, manganese sulfide (MnS) is likely precipitated. The third stage precipitation, which was performed in the pH region of 10 to 12, produced a solid magnesium product with a purity of 27.49 wt.%. According to Table 7, the solid species likely to appear at this pH region are pyrochroite (Mn(OH)2) and spinel (MgAl2O4). Spinel appears at both pH 10 and 12, indicating that the mineral starts forming at a pH value close to 10.

4.4. Hydrochloric Acid Dissolution

Following Na2S precipitation, solid redissolution was tested at varying acid concentrations to identify the optimal dissolution rate and favorable elemental composition for subsequent Co and Ni recovery. Two tests were conducted, one with a hydrochloric acid (HCl) concentration of 2M and the other with 4M. Unexpectedly, the 4M HCl experiment yielded a total mass dissolution of 85%, lower than the 97.59% achieved with 2M HCl. To validate the results, the experiment was repeated, and a similar dissolution rate was observed. Despite being unexpected, this phenomenon can be attributed to factors such as the common ion effect, which decreases the dissolution of solids in the chemical reaction due to the high production of Cl. Under this phenomenon, the reaction is reversed to relieve the excess of Cl ions, which reduce the solubility of the substance, leading to a low dissolution rate [28,29].
As indicated in Table 8, the 4M HCl test produced superior redissolution of the main elements, leaving Mn in the solid residue, resulting in a purer solution in terms of Co and Ni concentrations. The corresponding Co and Ni contents were 243 mg/L and 490 mg/L, respectively. In contrast, the 2M HCl test produced 206 mg/L of Co and 338 mg/L of Ni in the solution. The most notable difference was observed in the concentration of Mn, with a content value of 102.4 mg/L generated by 4M HCl, significantly lower than the 973.4 mg/L of Mn obtained from 2M HCl. Therefore, 4M HCl was selected as the acid concentration for redissolving the solid preconcentrate for Co and Ni extraction. This process generated two products: a dissolved solution containing Co and Ni as the main elements and others with lower amounts, such as Mn and Al, and a precipitated solid with approximately 9.92 wt.% Co, 10.93 wt.% Ni, and 0.28 wt.% Mn.

4.5. Solvent Extraction with Cyanex 272

4.5.1. Effect of Feed pH

The separation of cobalt from nickel in the HCl dissolved solution was conducted through solvent extraction by adjusting experimental parameters such as O:A ratio, extraction time, extractant concentration, feed pH, and equilibrium pH. Initially, to assess the pH’s effect on cobalt extraction, the experiment varied the feed pH from 4 to 5, maintaining an O:A ratio of 1:1, extractant concentration of 0.5 M, extraction time of 20 min, and a measured equilibrium pH of 7.5.
Results in Figure 4 indicated that while the process effectively extracted elements from the feed solution, it could not separate cobalt from nickel, suggesting that feed pH had no significant influence on element separation. The recovery percentage in Figure 4 demonstrates that approximately 99% of Co, Mn, and Ni, along with other impurities like Mg and Al, were all extracted to the organic solution, while Fe remained in the feed solution across the three-test run.
Although the tested feed pH range did not directly impact the separation of cobalt and nickel, it plays a crucial role in the extraction of elements. Swain et al. (2007) explored the distribution coefficient (DSX) of cobalt, a parameter linked to the stability of metal species, influencing the efficiency of metal extraction in a solvent extraction process. In the feed pH range of 4 to 6, cobalt extraction varied from 84% to 88%, and the study identified the optimal feed pH for cobalt extraction as 6 [30]. To prevent the loss of important minerals, the feed pH for the experiments in this study was set at 5, based on previous results from NaOH and Na2S precipitation.

4.5.2. Effect of Equilibrium pH

As previously mentioned, the feed pH was set at 5, with constant values for other parameters such as O:A ratio and separation time (1:1 and 20 min, respectively). After mixing the organic and aqueous solutions, the equilibrium pH was raised to approximately 7.5. It has been established that Ni and Co are co-extracted after the pH reaches 6.5 in chloride solutions but with negligible extraction before pH 3 [31]. Therefore, an equilibrium pH of 4.7 was selected, where most cobalt can be extracted along with a low amount of nickel.
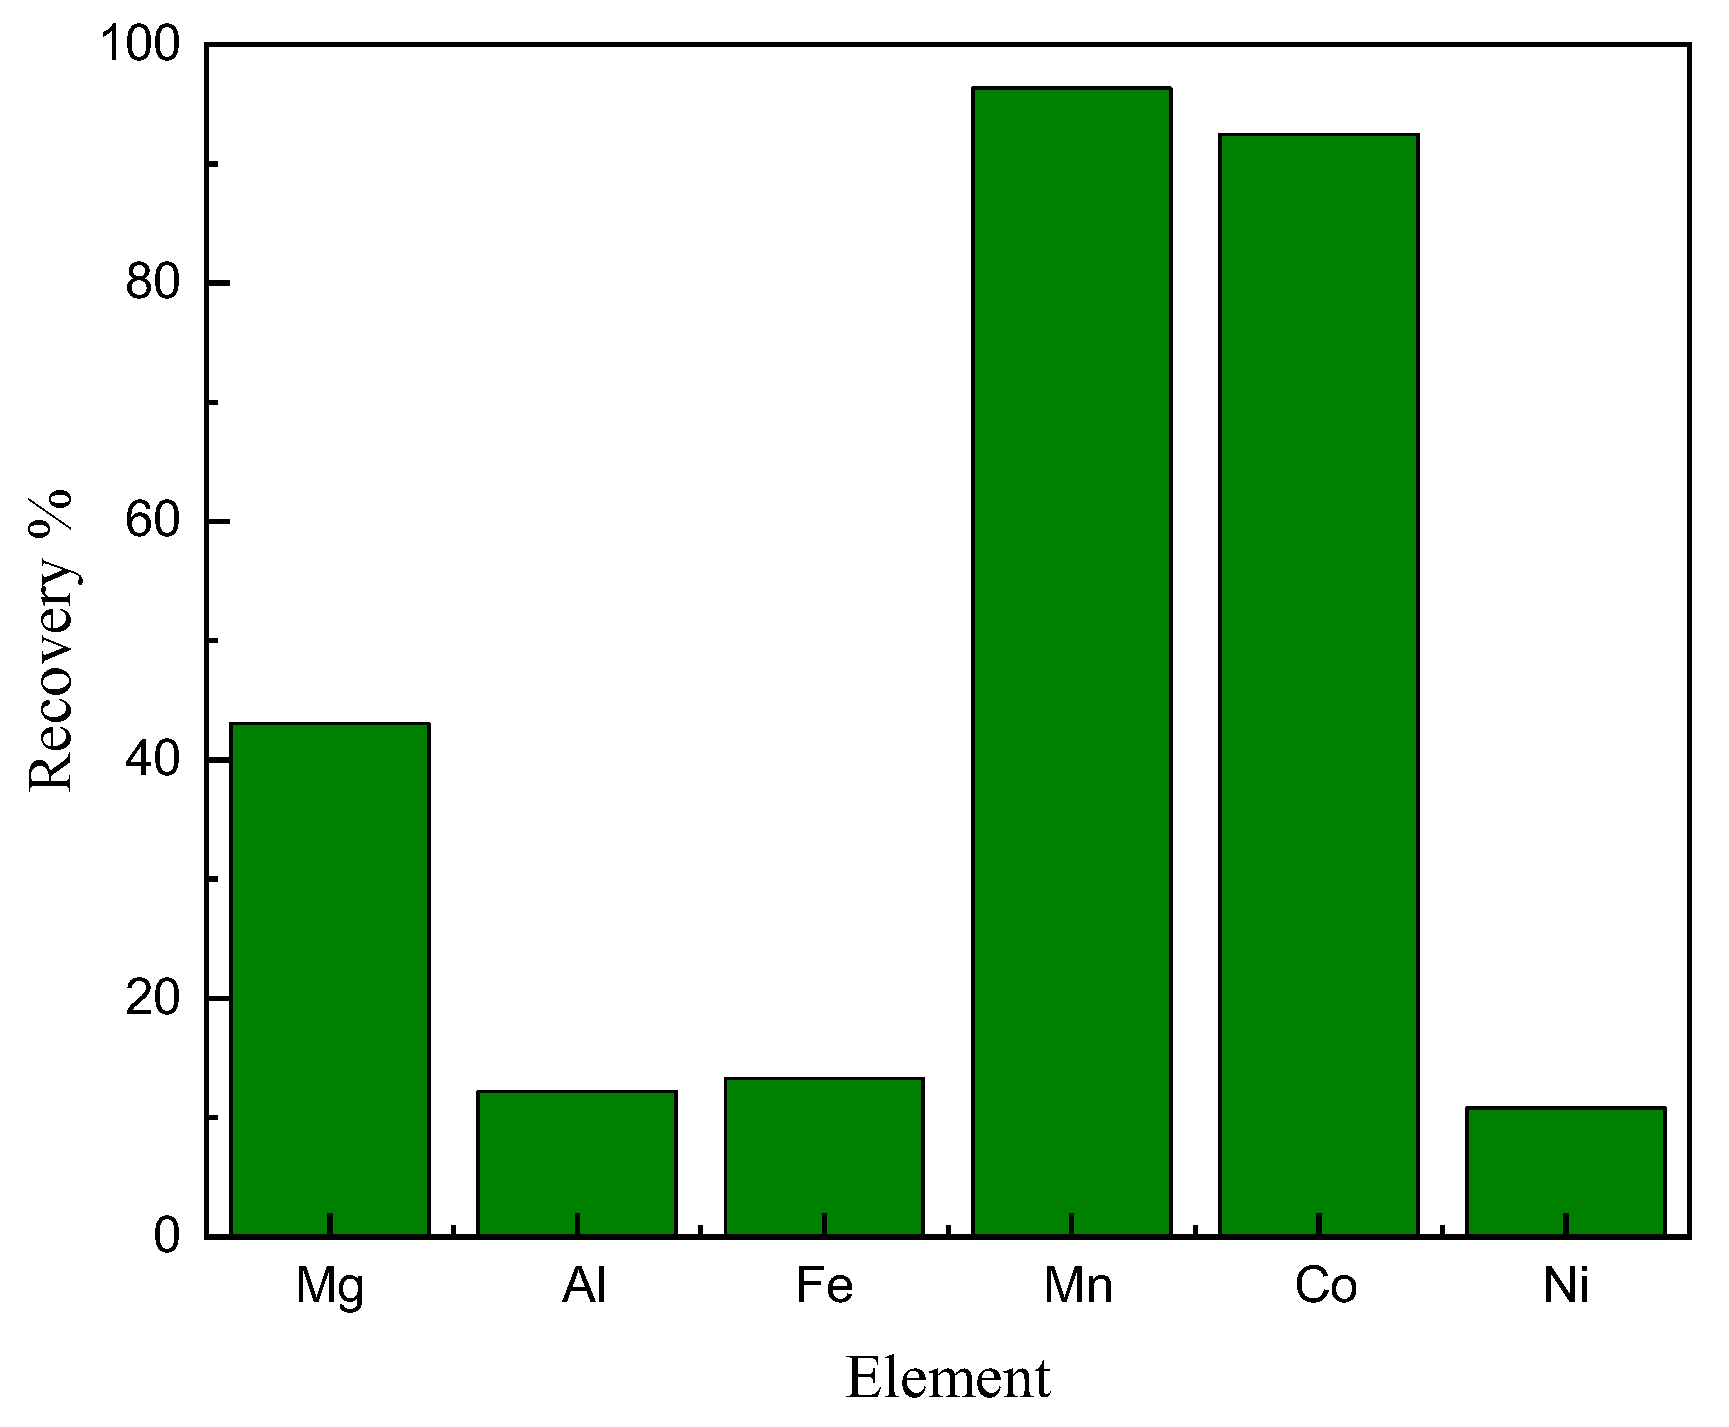
In the extraction process, 2M hydrochloric acid was gradually added to the organic–aqueous solution, lowering the equilibrium pH from 7.5 to 4.7 to achieve the desired value. Under this controlled condition, the process successfully extracted 96% of cobalt and 10% of nickel into the organic solution, as shown in Figure 5. Additionally, manganese and magnesium were extracted at percentages of 92% and 43%, respectively. Following extraction, the organic solution loaded with cobalt, manganese, and other elements underwent stripping, leaving a raffinate solution enriched with nickel and low amounts of other impurities.
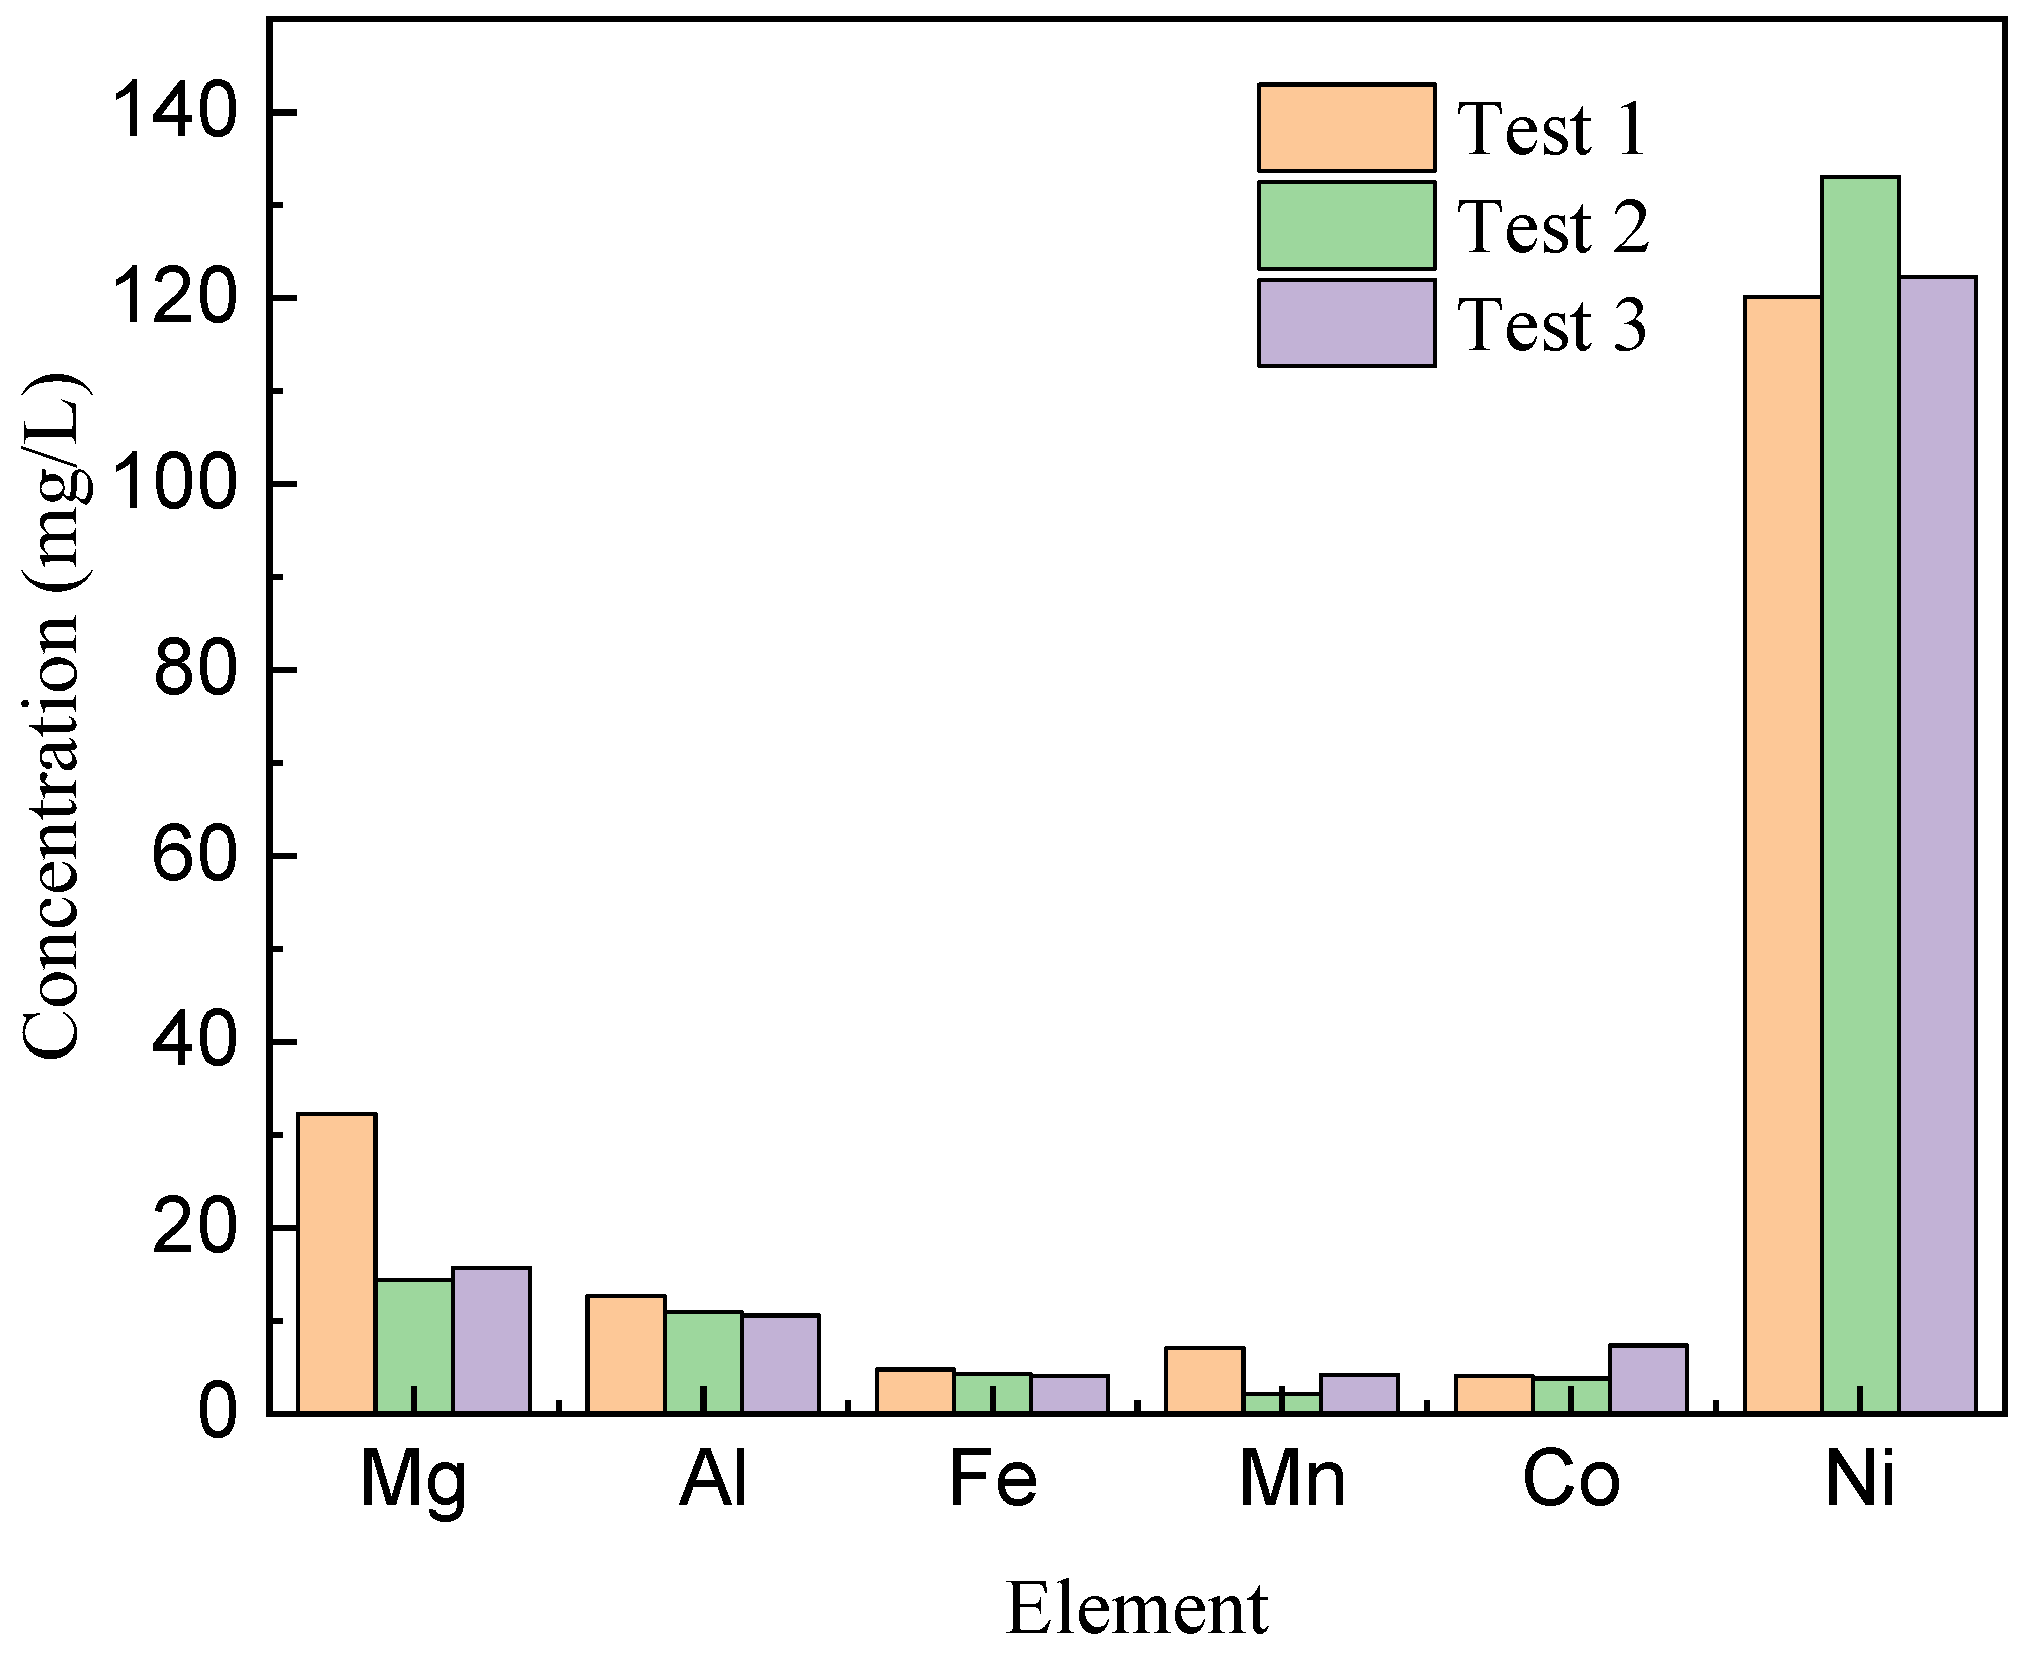
Replicate tests were conducted under the specified conditions, maintaining an equilibrium pH of 4.7. Across the three tests, the resulting raffinate solution exhibited slight variations in nickel content, ranging from 120 to 133 mg/L, cobalt concentrations from 3.8 to 7.3 mg/L, and manganese levels between 2.1 and 7.1 mg/L. Furthermore, certain impurities, including magnesium (an average concentration of 20.8 mg/L), aluminum (an average concentration of 11.4 mg/L), and iron (an average concentration of 5.0 mg/L), persisted in the raffinate solution (Figure 6). The blue color of the organic phase during solvent extraction indicates cobalt enrichment with saponified Cyanex 272, as shown in Figure 7.

4.5.3. Stripping of the Loaded Organic Solution

Following solvent extraction, the organic solution underwent a stripping process using 2M sulfuric acid (H2SO4). The procedure involved mixing the organic solution with 2M sulfuric acid at an O:A ratio of 1:1 for 5 min at 600 RPM. During this stage, the blue color of the organic solution changed to milky white, indicating the transfer of metals, particularly cobalt, into the acid solution (Figure 6). Subsequently, the organic and aqueous solutions were separated, and the aqueous solution underwent ICP-MS analysis to determine its elemental composition.
The analysis revealed a cobalt recovery of 82% from the organic solution, corresponding to a concentration of 52 mg/L in the aqueous solution. Additionally, manganese and zinc were extracted into the sulfuric solution, with concentrations of 95.5 mg/L and 106 mg/L, respectively. While these data provide insight into the efficiency of solvent extraction in separating nickel from cobalt, it is important to note that the organic solution also contained other elements, thereby reducing the purity of the strip solution in terms of cobalt.

4.5.4. Na2S Precipitation of the Raffinate and Stripping Solution

During the solvent extraction process using Cyanex 272, two aqueous solutions with varying critical mineral contents were produced. These solutions were then treated with sodium sulfide (Na2S) to yield solid products of nickel and cobalt. The raffinate solution, predominantly containing nickel, had its initial pH raised from 5 to 10, resulting in the formation of solids. Similarly, the strip solution containing cobalt and manganese had its pH adjusted from 0 to 5, leading to the precipitation of solids in the solution, which were subsequently separated via centrifugation and filtration.
In the precipitation of the raffinate solution, 99.5% of the nickel was recovered with a solid purity of 13.94 wt.%. Other detected elements had purities below 1 wt.%, except for silicon, which accounted for 2.56 wt.%. However, the precipitation of the stripping solution failed to produce a high-purity cobalt product despite recovering 80% of the cobalt. The low cobalt purity (0.4 wt.%) could be attributed to factors such as the low cobalt concentration in the stripping solution and the presence of other elements like silicon and zinc, which accounted for 0.83 wt.% and 1.47 wt.%, respectively, in the precipitated solid.

4.6. Solid Product Characterization

4.6.1. Manganese Characterization

For detailed characterization of the process products, the manganese concentrate underwent XRD analysis to elucidate its mineral composition. Utilizing JADE Pro software, the obtained diffraction pattern (Figure 8) was compared with known Mn-containing minerals, revealing that the manganese product primarily comprises manganese oxides, specifically MnO2.
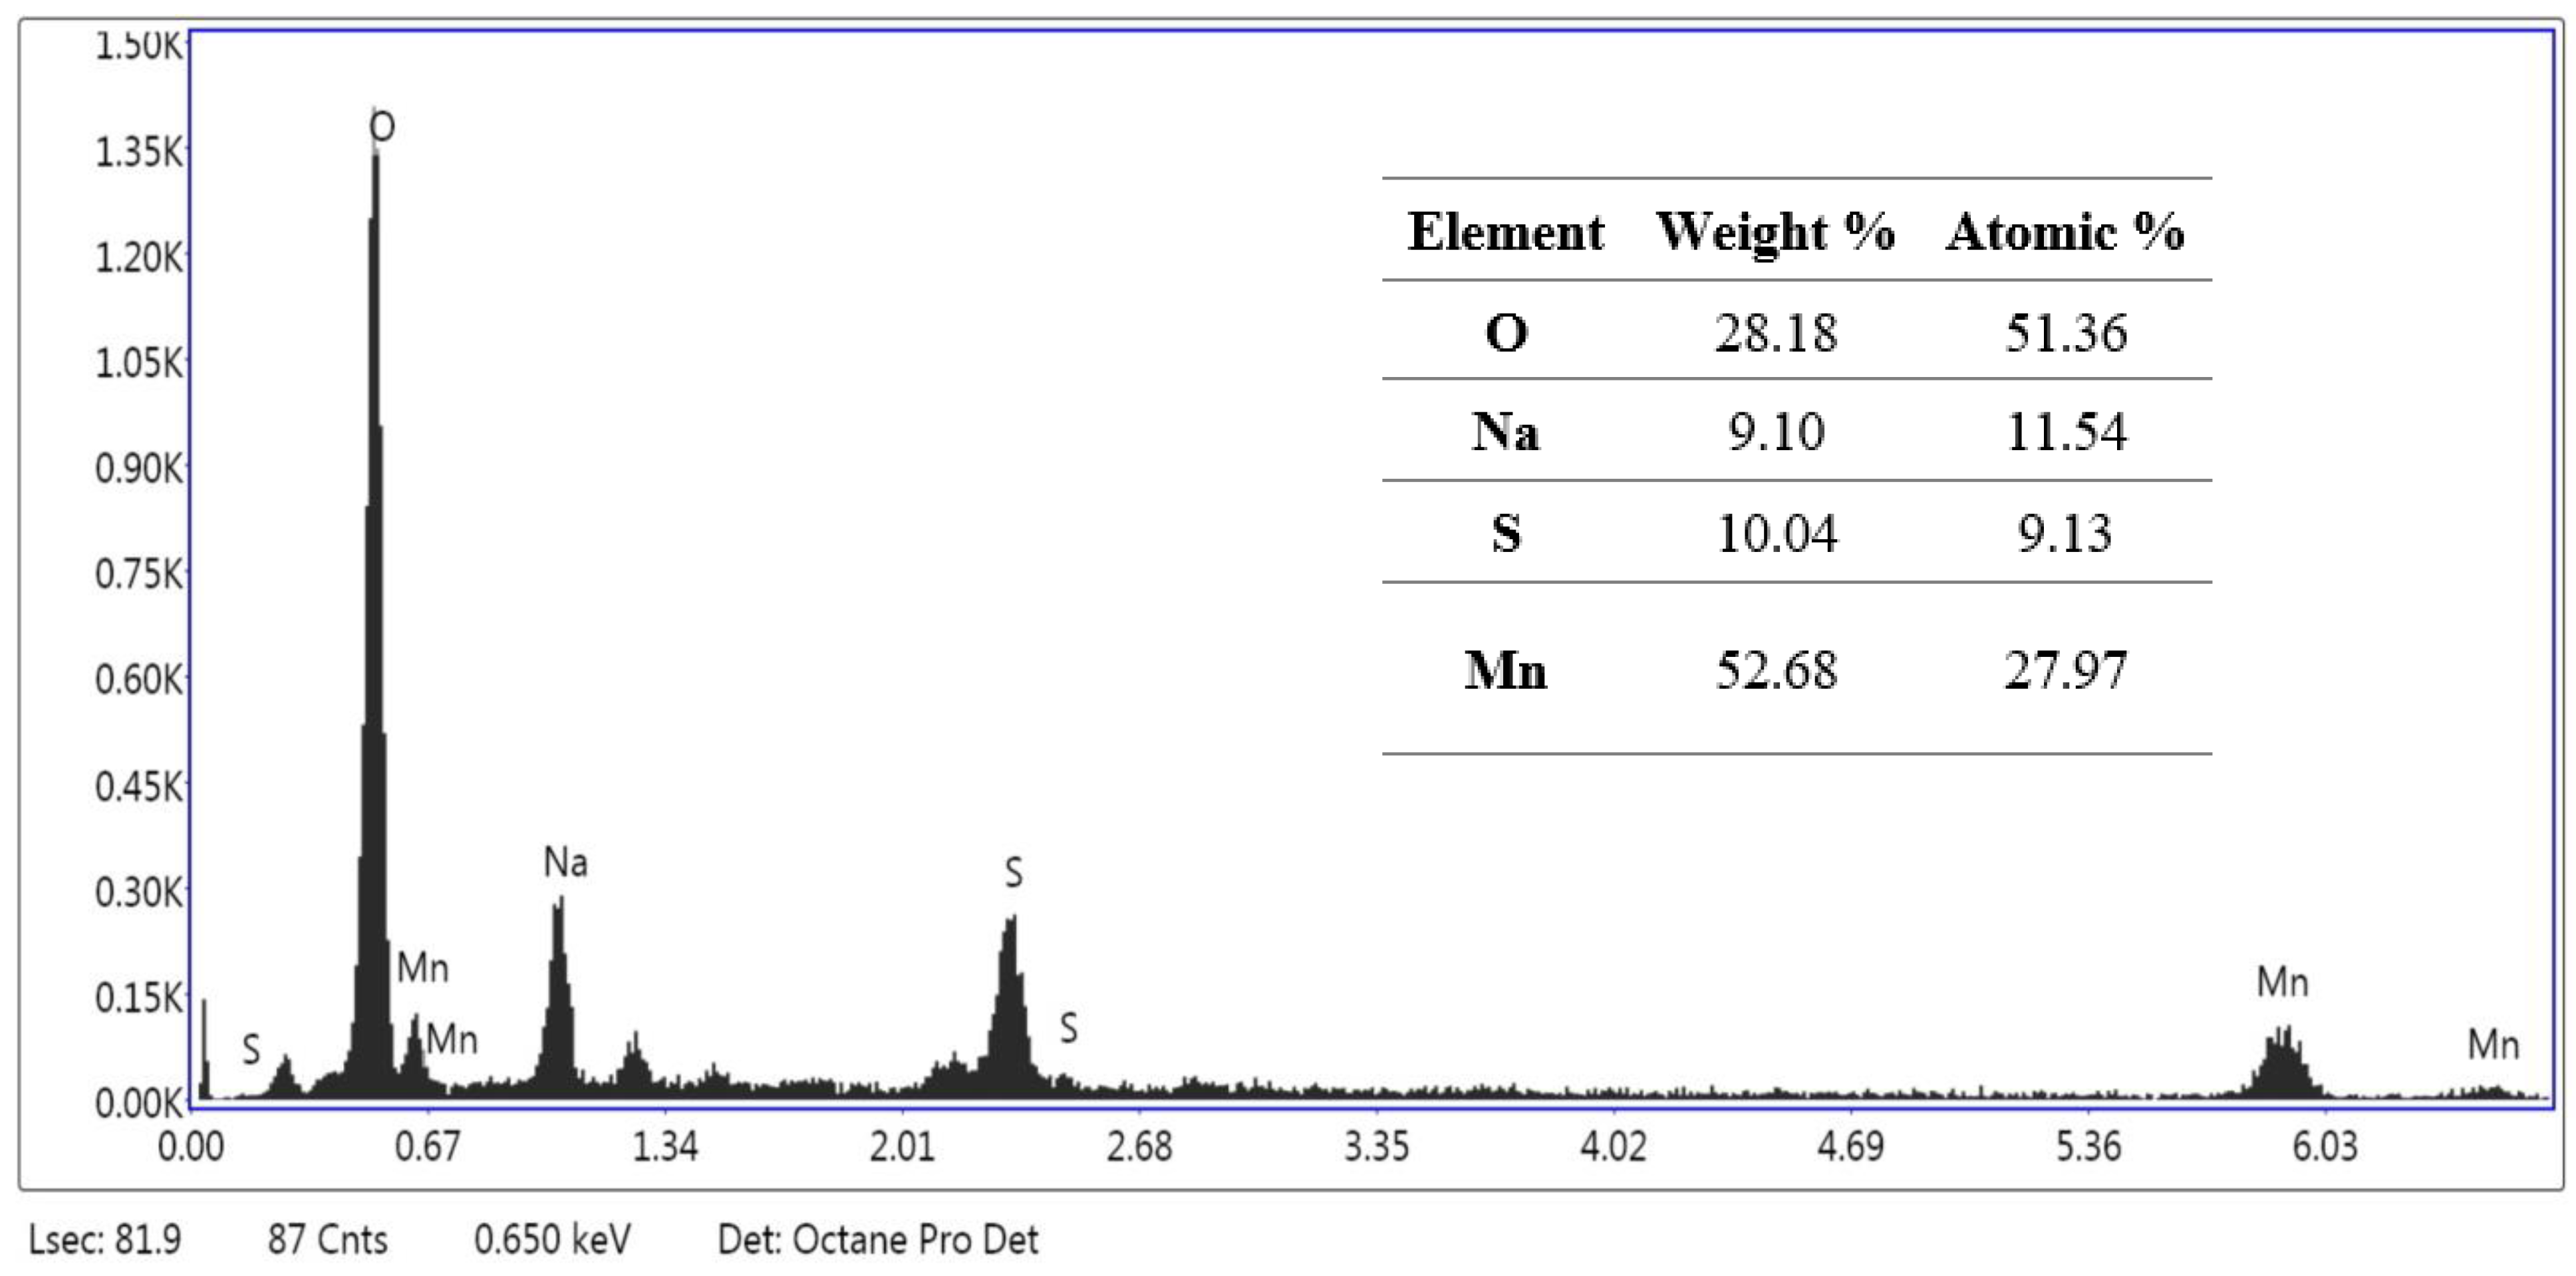
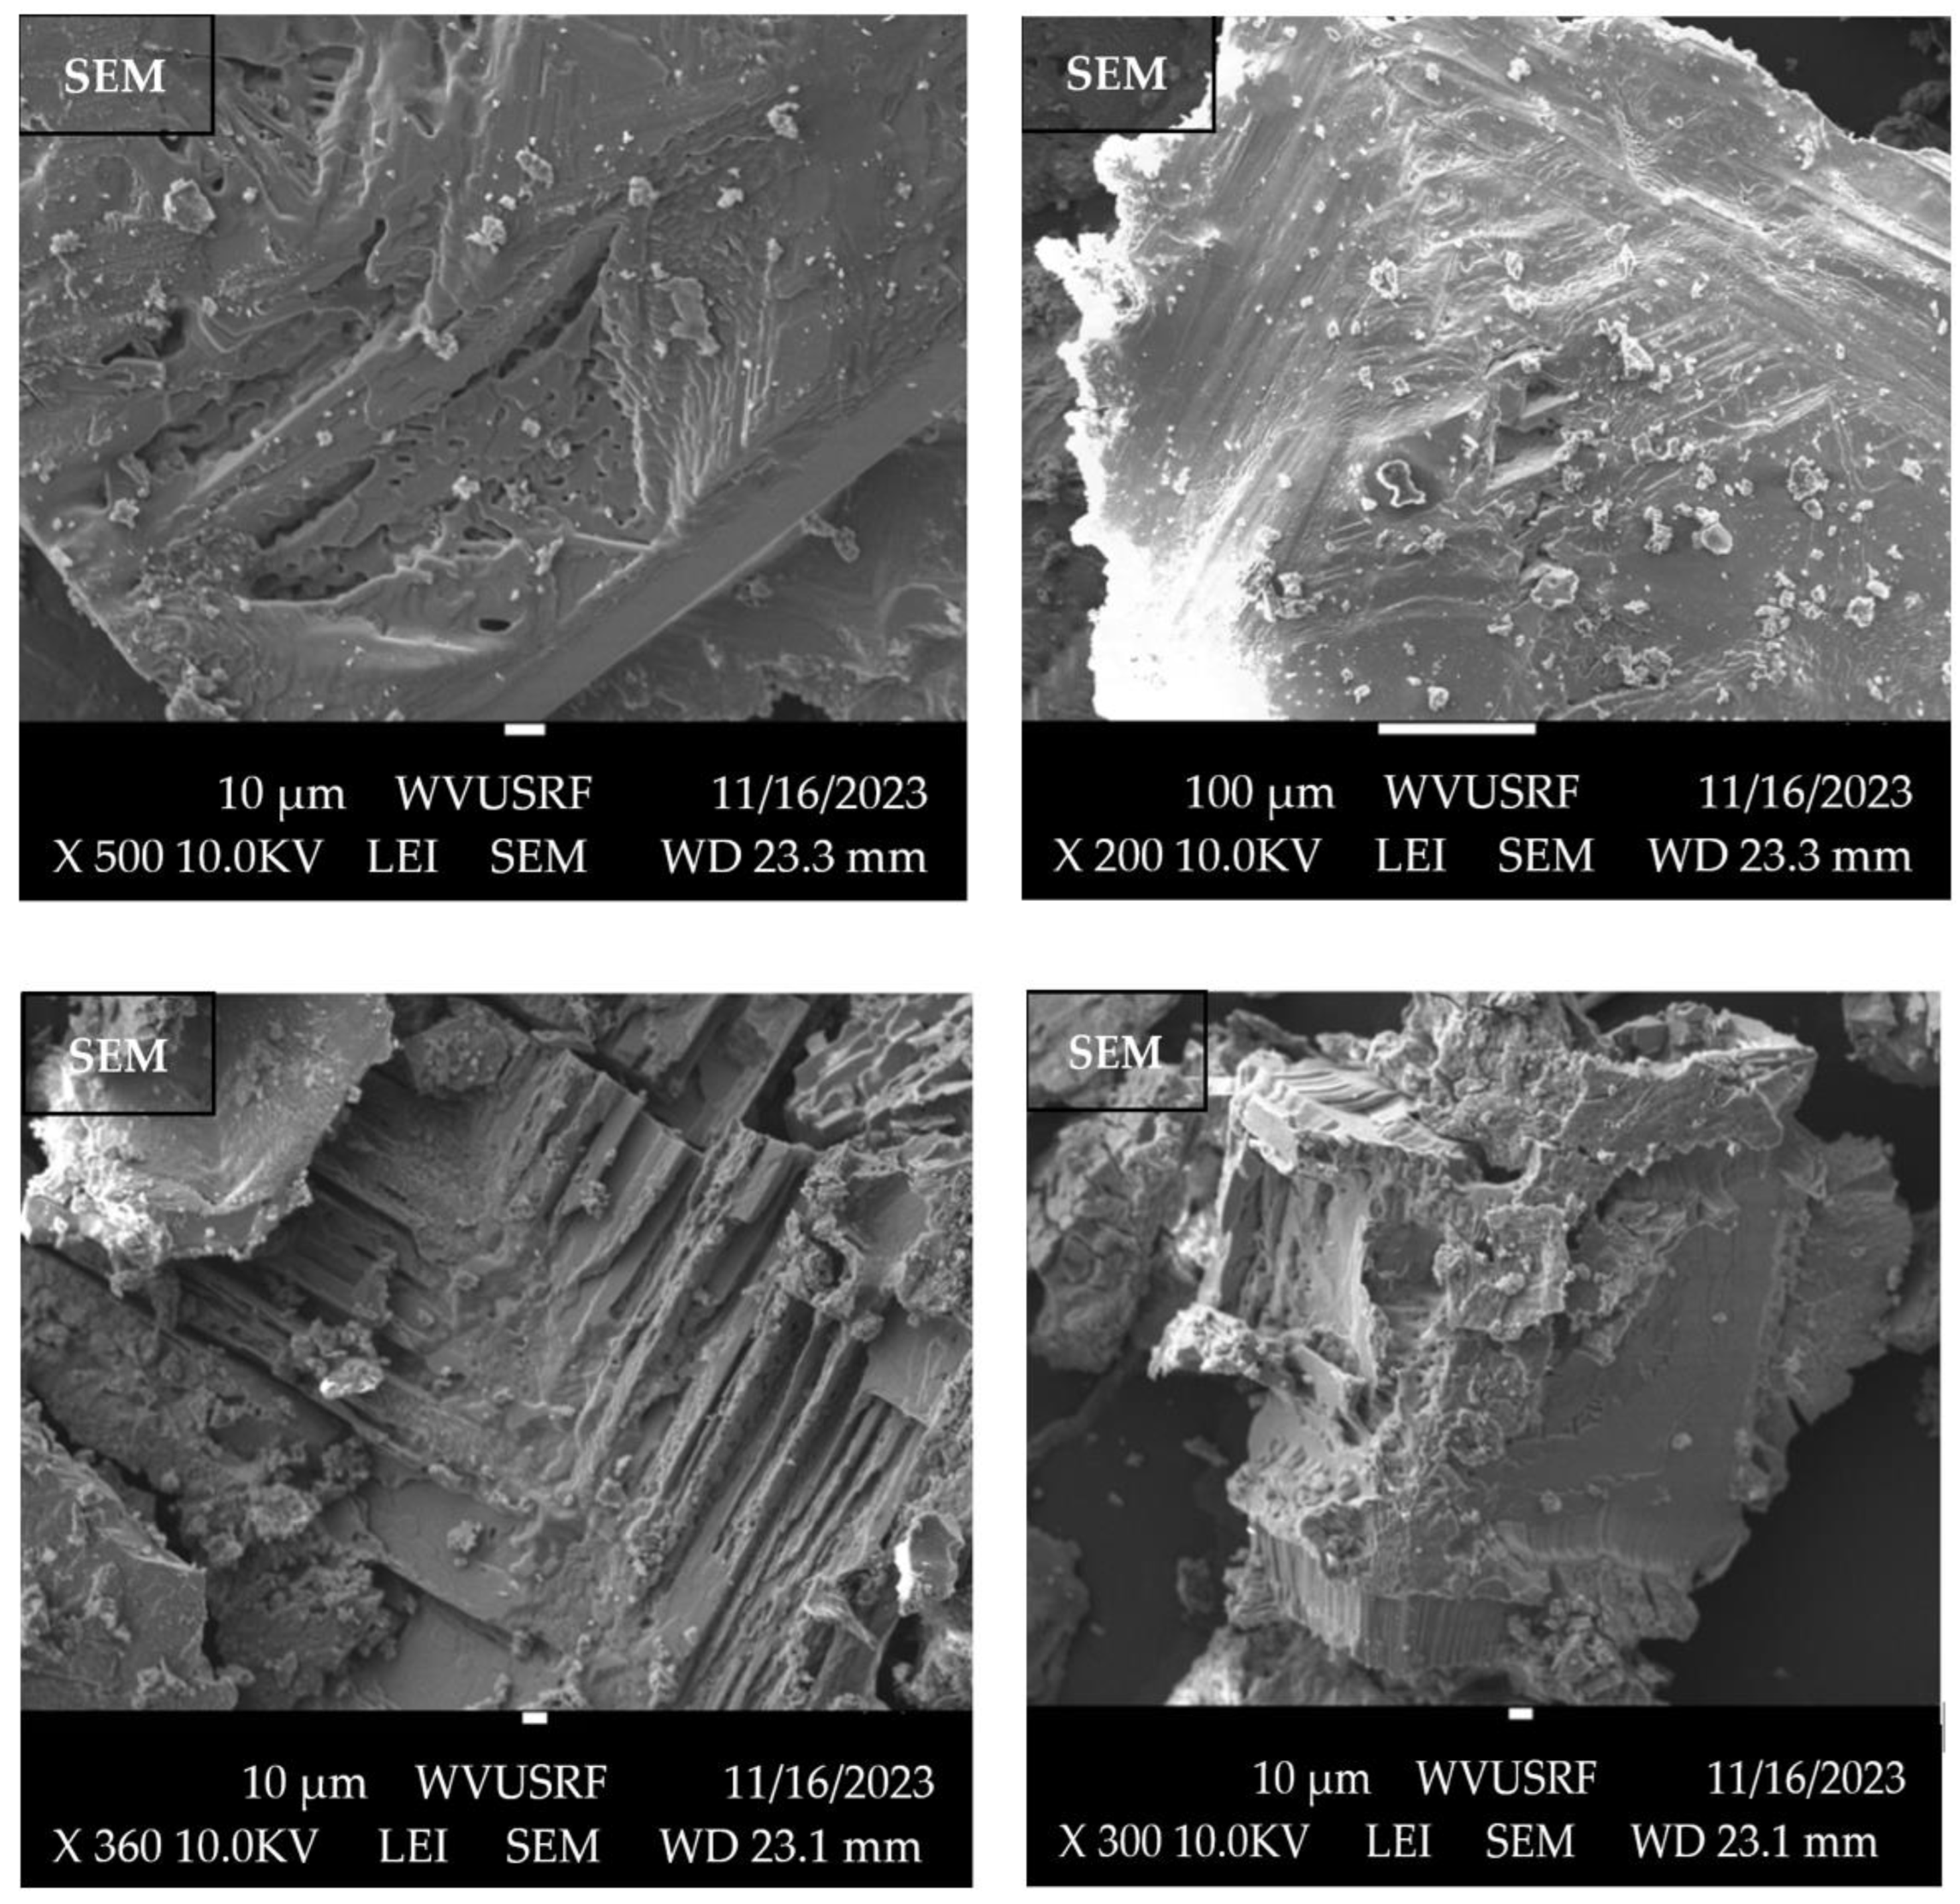
SEM-EDS analyses of the manganese concentrate produced during nitric acid washing (Figure 9 and Figure 10) revealed a mineral composition characterized by a significant oxygen content (28.18% by weight, 51.36% by atoms), indicative of oxygen-rich minerals, possibly oxides or silicates. Manganese constituted 52.68% by weight and 27.97% by atoms, suggesting the presence of manganese-containing minerals like rhodochrosite (MnCO3) and pyrolusite (MnO2). Additionally, sodium and sulfur were detected, indicating the presence of sodium-bearing and sulfate minerals. Combining XRD and SEM analyses, it is probable that the manganese product’s predominant mineralogy corresponds to MnO2. Figure 9 shows the surface morphology of the concentrate, indicating a rough, irregular and layered structure. In addition, the SEM pictures taken under high magnification reveal the blurry edges between particles, which may result from acid washing under elevated temperature, i.e., 75 °C.

4.6.2. Nickel Characterization

The SEM-EDS analysis of the 14 wt.% nickel sample obtained from precipitating the SX raffinate solution is presented in Figure 11 and Figure 12. The product primarily consists of sodium (Na) at a weight percentage of 23.70%. Oxygen (O) is present at a significant percentage of 15.67%, likely associated with silicates or oxides. Sulfur (S) at 7.90 wt.% and chlorine (Cl) at 27.05 wt.% suggest the potential presence of sulfides or chlorides. The detection of 4.57 wt.% nickel, coupled with the 15.67% oxygen, hints at the presence of nickel silicates like garnierite (Mg, Ni)3Si4O10(OH)2·nH2O) in the sample. The morphological characteristics of the nickel concentrate can be seen in Figure 10, where nano-sized particles were deposited on the top of the surface. On the other hand, EDS analyses are shown in Figure 11. The discrepancy in the nickel grades can be attributed to the semi-quantitative nature of EDS analyses, and each analysis only focuses on a regional spot of the whole sample instead of a comprehensive analysis.

4.7. Experimental Flowsheet

Based on the studies conducted throughout this research and the results presented above, a laboratory experimental flowsheet was developed to extract multiple CMs from a coal waste stream. As mentioned earlier, this research served as a continuation of a previously published study [20]. A coal AMD treatment sludge was used as the feedstock, and a process was developed to produce a mixed REO product with a purity greater than 80 wt.% [20]. This presented study utilized the raffinate from REE SX for the continuous extraction of additional CMs, including manganese, cobalt, and nickel. As seen in Figure 13, the developed flowsheet consists of multi-stage precipitation, solid dissolution, followed by sodium sulfide precipitation, redissolution, solvent extraction, and finally, product precipitation. Operating conditions of each stage were explored and determined based on the target process selectivity, with the ultimate objective of generating purer products. Resulting from this developed hydrometallurgical extraction process, multiple products were generated, including manganese, nickel, magnesium, and aluminum concentrates, with a purity of 47 wt.%, 14 wt.%, 27 wt.%, and 8.34 wt.%, respectively. In addition, an intermediate solid product was also obtained from hydrochloric acid redissolution, which contains approximately 10 wt.% of cobalt and 11 wt.% of nickel sulfides.
5. Summary and Conclusions

In conclusion, this study successfully developed a comprehensive process for the continuous extraction of multiple critical minerals from a rare earth solvent extraction raffinate, utilizing AMD treatment sludge as the initial feedstock. The research aimed to selectively extract manganese, cobalt, and nickel in addition to rare earths, addressing the challenges of impurity removal and mineral separation.
The experimental protocol involved staged NaOH precipitation to separate impurities such as aluminum and iron at pH 5, followed by cobalt, manganese, and nickel separation at pH 10. Nitric acid washing and subsequent sodium sulfide precipitation further facilitated the selective extraction of these critical minerals. XRD, SEM, and EDS analyses confirmed the mineralogy of the products, with manganese predominantly existing as pyrolusite (MnO2) and nickel likely present as garnierite (Mg, Ni)3Si4O10(OH)2·nH2O).
Key findings from this study include the efficient removal of impurities, the selective recovery of critical minerals, and the challenges associated with chemical similarities between cobalt, manganese, and nickel. Despite encountering difficulties such as low cobalt purity during precipitation, the study provided valuable insights into each stage of the process.
Moving forward, opportunities for further research include exploring alternative separation methods and optimizing existing processes to enhance the purity and yield of critical minerals. Overall, this study contributes to the advancement of hydrometallurgical techniques for sustainable mineral extraction and processing from secondary resources.

Author Contributions

Conceptualization, A.A.M. and Q.H.; methodology, A.A.M. and Q.H.; software, A.A.M.; validation, A.A.M. and Q.H.; formal analysis, A.A.M. and Q.H.; investigation, A.A.M. and Q.H.; resources, Q.H.; data curation, A.A.M. and Q.H.; writing—original draft preparation, A.A.M.; writing—review and editing, Q.H.; visualization, A.A.M. and Q.H.; supervision, Q.H.; project administration, Q.H.; funding acquisition, Q.H. All authors have read and agreed to the published version of the manuscript.

Funding

This research was funded by the Department of the Interior Office of Surface Mining Reclamation and Enforcement under Grant/Contract No. S20AC20042 and the Society for Mining, Metallurgy and Exploration Academic Career Grant.

Data Availability Statement

The original contributions presented in the study are included in the article, further inquiries can be directed to the corresponding author.

Conflicts of Interest

This manuscript was prepared as an account of work sponsored by an agency of the United States Government. Neither the United States Government nor any agency thereof, nor any of their employees, makes any warranty, express or implied, or assumes any legal liability or responsibility for the accuracy, completeness, or usefulness of any information, apparatus, product, or process disclosed, or represents that its use would not infringe privately owned rights. Reference herein to any specific commercial product, process, or service by trade name, trademark, manufacturer, or otherwise does not necessarily constitute or imply its endorsement, recommendation, or favoring by the United States Government or any agency thereof. The views and opinions of authors expressed herein do not necessarily state or reflect those of the United States Government or any agency thereof.

References

  1. Hayes, S.M.; McCullough, E.A. Critical minerals: A review of elemental trends in comprehensive criticality studies. Resour. Policy 2018, 59, 192–199. [Google Scholar] [CrossRef]
  2. USGS. MCS2022-Manganese, s.l. In Mineral Commodity Summaries; U.S. Geological Survey: Reston, VA, USA, 2022. [Google Scholar]
  3. Burton, J. 2022 List of Critical Minerals, s.l.; USGS: Reston, VA, USA, 2022.
  4. Venditti, B. The 50 Minerals Critical to U.S. Security. 2022. Available online: https://www.visualcapitalist.com/the-50-minerals-critical-to-u-s-security/ (accessed on 1 July 2024).
  5. Nassar, N.T.; Fortier, S.M. Methodology and Technical Input for the 2021 Review and Revision of the U.S. Critical Minerals List, s.l.; U.S. Department of the Interior U.S. Geological Survey: Reston, VA, USA, 2021.
  6. Savinova, E.; Evans, C.; Lèbre, É.; Stringer, M.; Azadi, M.; Valenta, R.K. Will global cobalt supply meet demand? The geological, mineral processing, production and geographic risk profile of cobalt. Resour. Conserv. Recycl. 2023, 190, 106855. [Google Scholar] [CrossRef]
  7. Wang, X.; Wang, A.; Zhong, W.; Zhu, D.; Wang, C. Analysis of international nickel flow based on the industrial chain. Resour. Policy 2022, 77, 102729. [Google Scholar] [CrossRef]
  8. Sun, X.; Hao, H.; Liu, Z.; Zhao, F. Insights into the global flow pattern of manganese. Resour. Policy 2020, 65, 101578. [Google Scholar] [CrossRef]
  9. Li, Q.; Zhang, W. Process development for recovering critical elements from acid mine drainage. Resour. Conserv. Recycl. 2022, 180, 106214. [Google Scholar] [CrossRef]
  10. Zhang, W.; Honaker, R. Process development for the recovery of rare earth elements and critical metals from an acid mine leachate. Miner. Eng. 2020, 153, 106382. [Google Scholar] [CrossRef]
  11. Vass, C.R.; Noble, A.; Ziemkiewicz, P.F. The occurrence and concentration of rare earth elements in acid mine drainage and treatment by-products: Part 1—Initial survey of the Northern Appalachian Coal Basin. Min. Metall. Explor. 2019, 36, 903–916. [Google Scholar] [CrossRef]
  12. Vass, C.R.; Noble, A.; Ziemkiewicz, P.F. The occurrence and concentration of rare earth elements in acid mine drainage and treatment byproducts. Part 2: Regional survey of Northern and Central Appalachian Coal Basins. Min. Metall. Explor. 2019, 36, 917–929. [Google Scholar] [CrossRef]
  13. Hedin, B.C.; Hedin, R.S.; Capo, R.C.; Stewart, B.W. Critical metal recovery potential of Appalachian acid mine drainage treatment solids. Int. J. Coal Geol. 2020, 231, 103610. [Google Scholar] [CrossRef]
  14. Cánovas, C.R.; Nieto, J.M.; Macías, F.; Basallote, M.D.; Olías, M.; Pérez López, R.; Ayora, C. Recovery of Critical Raw Materials from Acid Mine Drainage (AMD) The EIT-Funded MORECOVERY Project. In Recovery of Byproducts from Acid Mine Drainage Treatment; Wiley Online Library: Hoboken, NJ, USA, 2020; pp. 219–233. [Google Scholar] [CrossRef]
  15. Talan, D.; Huang, Q. A review study of rare Earth, Cobalt, Lithium, and Manganese in Coal-based sources and process development for their recovery. Miner. Eng. 2022, 189, 107897. [Google Scholar] [CrossRef]
  16. Honaker, R.Q.; Zhang, W.; Yang, X.; Rezaee, M. Conception of an integrated flowsheet for rare earth elements recovery from coal coarse refuse. Miner. Eng. 2018, 122, 233–240. [Google Scholar] [CrossRef]
  17. Hassas, B.V.; Shekarian, Y.; Rezaee, M.; Pisupati, S.V. Selective recovery of high-grade rare earth, Al, and Co-Mn from acid mine drainage treatment sludge material. Miner. Eng. 2022, 187, 107813. [Google Scholar] [CrossRef]
  18. Larochelle, T.; Noble, A.; Ziemkiewicz, P.; Hoffman, D.; Constant, J. A fundamental economic assessment of recovering rare earth elements and critical minerals from acid mine drainage using a network sourcing strategy. Minerals 2021, 11, 1298. [Google Scholar] [CrossRef]
  19. Chen, G.; Ye, Y.; Yao, N.; Hu, N.; Zhang, J.; Huang, Y. A critical review of prevention, treatment, reuse, and resource recovery from acid mine drainage. J. Clean. Prod. 2021, 329, 129666. [Google Scholar] [CrossRef]
  20. Cicek, Z.; Mira, A.A.; Huang, Q. Process development for the extraction of rare earth elements from an acid mine drainage treatment sludge. Resour. Conserv. Recycl. 2023, 198, 107147. [Google Scholar] [CrossRef]
  21. Chen, L.; Tang, X.; Zhang, Y.; Li, L.; Zeng, Z.; Zhang, Y. Process for the recovery of cobalt oxalate from spent lithium-ion batteries. Hydrometallurgy 2011, 108, 80–86. [Google Scholar] [CrossRef]
  22. Boukerche, I.; Habbache, N.; Alane, N.; Djerad, S.; Tifouti, L. Dissolution of cobalt from CoO/Al2O3 catalyst with mineral acids. Ind. Eng. Chem. Res. 2010, 49, 6514–6520. [Google Scholar] [CrossRef]
  23. Mohammadzadeh, M.; Bagheri, H.; Ghader, S. Study on extraction and separation of Ni and Zn using [bmim][PF6] IL as selective extractant from nitric acid solution obtained from zinc plant residue leaching. Arab. J. Chem. 2020, 13, 5821–5831. [Google Scholar] [CrossRef]
  24. Cheng, C.Y. Solvent extraction of nickel and cobalt with synergistic systems consisting of carboxylic acid and aliphatic hydroxyoxime. Hydrometallurgy 2006, 84, 109–117. [Google Scholar] [CrossRef]
  25. Mubarok, M.Z.; Hanif, L.I. Cobalt and nickel separation in nitric acid solution by solvent extraction using Cyanex 272 and Versatic 10. Procedia Chem. 2016, 19, 743–750. [Google Scholar] [CrossRef]
  26. Kang, J.; Senanayake, G.; Sohn, J.; Shin, S.M. Recovery of cobalt sulfate from spent lithium ion batteries by reductive leaching and solvent extraction with Cyanex 272. Hydrometallurgy 2010, 100, 168–171. [Google Scholar] [CrossRef]
  27. Talan, D.; Huang, Q.; Liang, L.; Song, X. Conceptual process development for the separation of thorium, uranium, and rare earths from coarse coal refuse. Miner. Process. Extr. Metall. Rev. 2023, 44, 330–345. [Google Scholar] [CrossRef]
  28. Chung, C.; Clark, J.; Tung, E.; Danai, M. 2023. Available online: https://chem.libretexts.org/Bookshelves/Physical_and_Theoretical_Chemistry_Textbook_Maps/Supplemental_Modules_(Physical_and_Theoretical_Chemistry)/Equilibria/Solubilty/Common_Ion_Effect (accessed on 1 July 2024).
  29. William, S.H.; Herring, F.G.; Jeffry, D.M.; Ralph, H.P. General Chemistry Principles and Modern Applications; Prentice Hall: Upper Saddle River, NJ, USA, 2007. [Google Scholar]
  30. Swain, B.; Jeong, J.; Lee, J.C.; Lee, G.H. Extraction of Co (II) by supported liquid membrane and solvent extraction using Cyanex 272 as an extractant: A comparison study. J. Membr. Sci. 2007, 288, 139–148. [Google Scholar] [CrossRef]
  31. SOLVAY. CYANEX® 272 Extractant, s.l.; SOLVAY SA: Brussels, Belgium, 2017. [Google Scholar]
Figure 1. The distribution percentage of various elements in the REE extraction raffinate.
Environments 11 00194 g001
Figure 2. Cumulative precipitation percentages of different elements obtained from sodium hydroxide stagewise precipitation. (A) 2–5 pH range; (B) 6–11 pH range.
Environments 11 00194 g002aEnvironments 11 00194 g002b
Figure 3. ICP-MS characterization of the nitric acid dissolved solution.
Environments 11 00194 g003
Figure 4. Metal recovery percentages of the SX test run at different feed pH values.
Environments 11 00194 g004
Figure 5. Recovery of metals in SX with Cyanex 272 at an equilibrium pH of 4.7.
Environments 11 00194 g005
Figure 6. Concentration of the main elements in the three SX raffinate solutions conducted for the separation of Co from Ni.
Environments 11 00194 g006
Figure 7. Cobalt extraction process with 0.5 M 50% saponified Cyanex 272.
Environments 11 00194 g007
Figure 8. X-ray diffraction pattern of the Mn concentrate with a purity of 47 wt.%.
Environments 11 00194 g008
Figure 9. SEM characterization of Mn concentrates (47 wt.% purity) generated in nitric acid washing.
Environments 11 00194 g009
Figure 10. EDS spectrum of the manganese product with a purity of 47 wt.% generated during the nitric acid washing procedure.
Environments 11 00194 g010
Figure 11. SEM characterization of Ni concentrates (14 wt.% purity) generated from SX-raffinate precipitation.
Environments 11 00194 g011
Figure 12. EDS spectrum of the Ni product with a purity of 14 wt.% formed from SX-raffinate precipitation.
Environments 11 00194 g012
Figure 13. Experimental flowsheet developed for the selective recovery of various CMs from a coal AMD treatment sludge.
Environments 11 00194 g013
Table 1. ICP-MS characterization of the feedstock samples on a dry basis.
ElementAlCoMgMnUCaFeNiSiZnThTotal REEs
Concentration (mg/kg)26,335.70226.0111,125.155540.671.853840.7310,001.41298.2418,167.45628.361.03356.78
Table 2. Elemental composition of the REE solvent extraction raffinate solution.
ElementTREEsAlCaCoFeLiMgMnNiSiZn
Content, mg/L0.73463.1224.138.3159.23.92161.4370.769.4151.834.4
Table 3. ICP-MS characterization of the solids precipitated at different pH ranges.
Solids Precipitated—ICP-MS Characterization
Solids at pH 2–5 Solids at pH 5–10
Elementppmwt.%Elementppmwt.%
Mg2967.170.30Mg17,193.831.72
Al83,427.868.34Al3501.330.35
Si2099.860.21Si1823.170.18
P911.920.09PNDND
S126,692.6112.67S160,415.5016.04
Ca446.920.04Ca1440.500.14
Mn1645.060.16Mn27,724.002.77
Fe12,380.441.24Fe477.170.05
Co347.280.03Co3559.330.36
Ni756.310.08Ni6772.170.68
Cu60.670.01Cu24.670.00
Zn443.250.04Zn1991.330.20
Rb1.000.00Rb1.170.00
Sr2.420.00Sr4.500.00
Zr5.500.00Zr5.000.00
Mo3.000.00Mo3.330.00
Ba42.530.00Ba49.670.00
Table 4. Mineral species predicted to be formed during 2M NaOH stagewise precipitation with Visual MINTEQ 3.1 at pH 5 and 10.
pH 5pH 10
MineralSaturation IndexMineralSaturation Index
Al(OH)3 (am)−1.574Al(OH)3 (am)1.26
Al(OH)3 (Soil)0.936Al(OH)3 (Soil)3.77
Al2O3(s)−1.116Al2O3(s)4.559
Al4(OH)10SO4(s)3.81Al4(OH)10SO4(s)5.293
AlOHSO4(s)2.062AlOHSO4(s)−4.957
Boehmite0.676Boehmite3.512
Brucite−9.96Brucite−0.088
Co(OH)2 (am)−8.119Co(OH)2 (am)1.684
Co(OH)2 (c)−7.315Co(OH)2 (c)2.488
CoO(s)−8.584CoO(s)1.222
CoSO4(s)−8.221CoSO4(s)−8.271
CoSO4:6H2O(s)−3.115CoSO4:6H2O(s)−3.179
Diaspore2.381Diaspore5.217
Epsomite−1.324Epsomite−1.321
Fe(OH)2 (am)−7.779Fe(OH)2 (am)2.071
Fe(OH)2 (c)−7.179Fe(OH)2 (c)2.671
Gibbsite (C)1.486Gibbsite (C)4.32
Hercynite1.383Hercynite16.909
Melanterite−2.67Melanterite−2.69
Mg(OH)2 (active)−11.654Mg(OH)2 (active)−1.782
Mirabilite0.022Mirabilite−0.022
MnSO4(s)−6.884MnSO4(s)−7.269
Morenosite−3.256Morenosite−3.304
Ni(OH)2 (am)−7.7Ni(OH)2 (am)2.121
Ni(OH)2 (c)−5.6Ni(OH)2 (c)4.221
Ni4(OH)6SO4(s)−21.635Ni4(OH)6SO4(s)7.798
Periclase−14.416Periclase−4.542
Pyrochroite−9.101Pyrochroite0.367
Retgersite−3.333Retgersite−3.378
Spinel−11.143Spinel4.406
Thenardite−1.132Thenardite−1.153
Table 5. ICP-MS characterization of the solid concentrate post nitric acid dissolution.
ElementConcentration (mg/kg)wt.%
Na8580.050.86
Mg2396.600.24
Al419.880.04
Si6820.740.68
P200.210.02
K193.350.02
Ti13.050.00
Cr5.230.00
Fe210.040.02
Mn469,913.4346.99
Co5989.470.60
Ni2373.960.24
Cu28.880.00
Zn4313.020.43
TREE691.600.07
Table 6. ICP-MS characterization of solids generated from the three-stage Na2S precipitation.
Elemental Composition of Solids at Different pH Regions (mg/kg)
ElementpH 1–5Wt.%pH 5–10Wt.%pH 10–12Wt.%
Na86,679.398.67112,989.1711.3096,340.969.63
Mg2746.480.2723,343.902.33274,850.2427.49
Al44,148.994.411879.660.19268.590.03
Si3923.310.397439.580.745821.730.58
P167.610.0249.420.00129.730.01
Sc0.080.000.000.000.000.00
Cr2957.740.3049.990.000.000.00
Fe12,202.951.22215.200.020.000.00
Mn15,605.021.56201,452.2420.15915.170.09
Co50,758.915.0813.360.000.000.00
Ni80,183.408.0242.870.0093.780.01
Cu722.520.070.000.000.000.00
Zn50,458.635.050.000.000.000.00
TREE0.000.002271.430.2313.530.00
Table 7. Simulation of the 1M Na2S stagewise precipitation with Visual MINTEQ 3.
MineralSaturation Index at pH 5Saturation Index at pH 10Saturation Index at pH 12
Al(OH)3 (am)0.915−0.322−2.322
Al(OH)3 (Soil)3.4252.1880.188
Al2O3(s)3.7771.303−2.697
Boehmite3.1371.9−0.1
Brucite−8.8681.0194.45
Co (OH)2 (am)−9.148−1.1792.473
Co (OH)2 (c)−8.344−0.3753.277
CoO(s)−9.64−1.6711.98
CoS (alpha)4.3379.31510.969
CoS (beta)8.63713.61515.269
Diaspore4.8423.6051.605
Gibbsite (C)3.9752.7380.738
Mg(OH)2 (active)−10.562−0.6752.756
MgS(s)−16.477−9.581−8.148
MnS (grn)−2.1822.8184.579
MnS (pnk)−5.182−0.1821.579
Ni (OH)2 (am)−9.048−2.3451.26
Ni (OH)2 (c)−6.948−0.2453.36
NiS (alpha)2.3326.0457.652
NiS (beta)7.83211.54513.152
NiS (gamma)9.53213.24514.852
Periclase−13.352−3.465−0.034
Pyrochroite−10.366−2.3751.383
Spinel−5.1862.2271.658
Table 8. ICP-MS characterization of the solid and liquid generated from 4 M HCl redissolution.
ElementConcentration of Dissolved Solution (mg/L)Concentration of Remaining Solids (mg/kg)wt.%
Na1536.463890.64
Mg51.62940.03
Al385.616250.16
Si69.026350.26
P2.44060.04
Cr4.82540.03
Fe25.465920.66
Mn102.427730.28
Co243.499,1969.92
Ni490.2109,35310.94
Cu0.420370.20
Zn351.829430.29
Disclaimer/Publisher’s Note: The statements, opinions and data contained in all publications are solely those of the individual author(s) and contributor(s) and not of MDPI and/or the editor(s). MDPI and/or the editor(s) disclaim responsibility for any injury to people or property resulting from any ideas, methods, instructions or products referred to in the content.