Article

Comparison of Greenhouse Gas Emission Assessments of Solar and Energy Efficiency Improvements at Small Water Resource Recovery Facilities

1
HDR Inc., Omaha, NE 68106, USA
2
Department of Civil and Environmental Engineering, University of Nebraska-Lincoln, Lincoln, NE 68588, USA
*
Author to whom correspondence should be addressed.
Environments 2024, 11(6), 118; https://doi.org/10.3390/environments11060118
Submission received: 21 March 2024 / Revised: 16 May 2024 / Accepted: 18 May 2024 / Published: 3 June 2024
(This article belongs to the Special Issue Greenhouse Gas Emission Reduction and Green Energy Utilization)

Abstract

:
Small water resource recovery facilities (WRRFs) account for the majority of centralized systems in the world and have higher energy intensities than large facilities. This study compares potential greenhouse gas emission reductions based on on-site solar energy and energy efficiency (E2) improvements made at small WRRFs. Case study data from 31 existing small WRRFs in Nebraska were collected and included 35 site-specific energy efficiency (E2) recommendations and on-site solar renewable energy systems integrated at three facilities, and the data were used to compare the benefits of on-site solar energy and E2 improvements made at small WRRFs. Improvements in E2 (e.g., improved aeration control) presented the largest reduction in emissions per dollar invested. They often exhibited shorter paybacks, with operational changes in aeration strategies showing the highest impact (up to 0.2 kg CO2eq/m3 treated water). On-site solar systems showed the largest net potential for reducing environmental footprint (0.35 kg CO2eq/m3) but often showed the smallest emissions reduction per cost. While the use of both E2 improvements and the integration of on-site solar renewable energy can significantly improve the sustainability of small WRRFs, on-site solar has advantages for small facilities in that it often requires less operational involvement, allows for greater facility resiliency, and presents less uncertainty in terms of environmental benefit.

1. Introduction

1.1. Energy Use at Small WRRFs

Electricity use by small mechanical wastewater plants, often referred to in the United States as water resource recovery facilities (WRRFs), has shown the largest contribution to almost all environmental impact categories. Most developed countries are aiming to drive toward carbon neutrality by 2050, and the production of electricity by fossil fuels is the largest contributor of these emissions [1]. Consequently, efforts to employ life cycle assessment (LCA) and carbon footprinting to analyze economic changes to existing infrastructure electricity use is important for supporting these efforts. Wastewater plants and local water systems can account for up to 30–40% of the electricity used by a municipal government in small communities [2]. In this study, the small systems analyzed served a population less than 10,000 [2]. Small systems exhibit energy intensities up to 4–5 times higher than larger systems due to the economy of scale, technology choice, system sizing, design, and operations [3,4,5]. Small WRRFs face different challenges than larger WRRFs such as the lack of economy of scale, limited available financing, and limited staff expertise, which may mean that the most effective approaches to improving their sustainability are not the same as those for larger WRRFs [6].
In general, this electricity use can be reduced by making the system more energy-efficient in process operation, lighting, and the building envelope, or by utilizing a more sustainable source of electricity generation such as solar energy. Both options require different types and amounts of economic, material, and technical input to be integrated with existing systems. Similarly, they can provide a different output in terms of potential environmental benefits (e.g., carbon emission footprint) and economic cost, and are likely to exhibit varying degrees of uncertainty regarding expected performance.

1.2. Energy Efficiency and Renewable Energy Options for Small WRRFs

The high energy use of wastewater treatment systems has led to significant attention being paid to how to improve their energy efficiency (E2) [7,8]. In this context, the energy efficiency of the wastewater treatment process refers to the amount of energy required to treat the water to achieve sufficient quality. Efforts to improve the E2 have seen great focus on benchmarking from a plant-wide metric standpoint and have revealed that significant variance is observed within systems and that environmental, operational, and design factors can influence such efficiencies [4,9,10,11]. Energy audits aimed at measuring unit process energy use and the impact of E2 changes have revealed the processes of greatest potential opportunity, such as secondary treatment aeration, sludge management, as well as building space heating [3,12,13]. The evaluation of the environmental life cycle impact of different E2 retrofits within small mechanical WRRFs is largely absent within the literature, and thus, there is a need to evaluate the potential impact and areas of greatest opportunity.
Within efforts to improve system resiliency and sustainability, some systems have installed other forms of renewable energy sources, such as solar, wind, hydropower, and geothermal, on-site to help offset their environmental footprint [14]. In Nebraska, solar is the most common renewable energy applied in small community WRRFs on adjacent land, which currently serves as a buffer for neighboring properties.

1.3. Research Goal

Although this study uses case study data from Nebraska in the United States, the economic and carbon footprint results provide insights into the comparison of the application of producing renewable on-site energy vs. improving energy efficiency within a plant for small WRRFs, for which the general conclusions will be relevant throughout the developed world. This work provides a unique case study that compares two methods of improving sustainability, one focusing on reducing energy demand at the point of use and the second reducing the electrical demand from the electric grid. The methodology of comparing these improvements could be applied to other industries considering the site- and industry-specific aspects of their processes.
The aim of this study was to provide small communities, regulatory agencies, and design engineers with information on the potential environmental life cycle benefits and tradeoffs of different practices that reduce the use of grid electricity and their associated environmental emissions in small mechanical WRRFs. This study focused on systems in communities generally smaller than 5000 people, where the unique challenges for small systems are most acute. This work aimed to investigate benefits and compare on-site solar energy and several common energy efficiency (E2) improvements for mechanical WRRFs. E2 improvements include changes in infrastructure and/or operations that result in a reduction in energy use while still maintaining the same or better level of treatment capacity at the facility (e.g., higher efficiency motors, reducing over aeration). Nebraska provides a useful case study for comparison with systems throughout the developed world. Energy benchmarks of the mechanical WRRFs were shown by Hanna [4] to be similar to other states and countries. The study had the following objectives:
(1)
To examine the greenhouse gas (GHG) impacts of energy efficiency (E2) improvements made at small WRRFs.
(2)
To evaluate the GHG profiles of three existing case study sites utilizing on-site solar energy.
(3)
To compare the net environmental tradeoffs and payback times of E2 and on-site solar improvements.

2. Literature Review

Small systems serving a population less than 10,000 make up 80% of centralized wastewater treatment systems in the United States [15], and small systems constitute a majority of the systems in other countries such as Switzerland [16]. Life cycle assessment can be used to study the impacts of WRRFs. The operational phase of a WRRF is generally considered to have a much larger contribution to environmental impacts [3,17,18].
Facilities that treat lower flow rates were shown to use more energy per unit flow in the United States [4] and Australia [19]. While the underlying processes of wastewater treatment facilities tend to be the same as those of larger systems, very distinct differences are observed at facilities of different sizes. Small systems differ from large systems for several different reasons, including that they are inherently less energy efficient, have limited managerial capacity, have difficulty in attracting and retaining skilled system operators, have limited financial resources, and often apply different technologies (e.g., [2,18]).
The 2021 infrastructure funding bill recently passed by the US Congress allocated USD 55 billion to upgrading water and wastewater infrastructure and included funding specifically for sustainability and resilience improvements in small communities [20]. Additional US federal grant funds are targeting reducing greenhouse gas emissions, including focusing on the municipal wastewater sector, including those in small communities with populations of less than 10,000 [21,22].
Although multiple studies have examined the LCA impacts of systems, few studies have reported the greenhouse gas emission mitigation benefits of using photovoltaic solar to power wastewater treatment plants [23], and no studies have compared energy efficiency measures to adding photovoltaic solar energy in terms of the relative benefits of decarbonization for small WWRFs.
For small WRRFs, operating energy is a dominant source of environmental impact [18], and LCA can be helpful to confirm that changes within a system are not shifting environmental burdens when making sustainability improvements, such as installing solar panels [24]. There is a research gap in the literature in the assessment of the environmental LCA of small WRRFs based on case study data [18,25,26], and studies comparing the net environmental tradeoffs and economic payback times of E2 and on-site renewable energy installations such as solar are lacking. This research helps address this problem by collecting and analyzing such data from real systems.

3. Methodology

Case study data were collected and analyzed, and comparisons were made between existing on-site solar energy systems and previously assessed energy efficiency recommendations at small WRRFs. Methods for analyzing solar energy are provided first, followed by details on the energy efficiency improvements. Lastly, the methods used for comparing energy efficiency improvements and solar energy are discussed.

3.1. Life Cycle Assessment

The environmental life cycle assessment was performed in accordance with ISO 14040 and 14044 standards [27,28]. These standards define four key stages in analysis: (1) goal and scope definition; (2) life cycle inventory (LCI) analysis; (3) environmental impact assessment; and (4) interpretation. Each stage is described in more detail in the following sections.
To evaluate and compare the impact of on-site solar systems and E2 improvements, the study focused primarily on potential reductions in electricity use. A full life cycle inventory of a mechanical plant was included to understand the impact of these changes on the overall facility’s environmental profile. Figure 1 shows the system boundary of the facility. The production of most physical materials and energy use at facilities were included in the system boundary. End-of-life processes, construction-phase activities, and a few other services were not included in the life cycle assessment but anticipated to be small relative to other impacts. The functional unit of treated water volume (m3 of treated water) was used to normalize all energy and reduce the environmental impact. Energy supplied to the grid from on-site solar renewable energy is assumed to offset electricity production from the local grid mix, although the economics vary by location. While the generation and supply of this to the grid may impact a specific fuel-generation source (e.g., natural gas), the average mix offset was used and likely is a more conservative estimate of net impact.
Life cycle inventory (LCI) had previously been collected on 28 small wastewater treatment facilities, including data associated with the material, emission, and energy use [18]. Table 1 summarizes these facilities’ LCI data types and collection methods. A construction inventory was collected from engineering design documents and included all the facility’s built materials and excavation inputs. Materials were cataloged by specification (e.g., pipe material, diameter) and then converted to equivalent inventory mass based on data collected from product specification sheets. The total volume of the treated flow of the facility normalized the life cycle inventory and corresponding impacts since organic loading data from many small systems are unreliable. This is an acceptable normalization factor for wastewater treatment systems for both energy and sustainability assessments [29,30], with the realization that if reliable organic loading data (e.g., COD or BOD) were available, it might be used [31]. LCI data were collected from solar facilities at three small wastewater plants.
Life cycle impact assessment was accomplished using the Tool for the Reduction and Assessment of Chemical and Other Environmental Impacts (TRACI v2.1) method [32]. To investigate all impact categories on a comparative basis, US 2008 normalization factors from TRACI v2.1 were used to assess the impact of the systems compared to US national emissions [33]. Computation was completed using OpenLCA software v1.7 in addition to further analysis in a spreadsheet.
The carbon intensity from electricity generation varies geographically and over time due to different production sources. The global warming potential emission factor electricity production for the 2022 Southwest Public Power Pool (SWPPP) balancing authority was used for this study (0.437 kg CO2eq/kWh) [34]. It should be noted that results will vary significantly based on different electric grid mixes applied, but they would have a proportional impact on estimated impacts. For reference of the range of this variability, the national U.S. average grid mix was 0.373 kg CO2eq/kWh, the Bonneville Power Administration had a carbon intensity of 0.0708 kg CO2eq/kWh, and the Western Area Power Administration had a carbon intensity of 0.846 kg CO2eq/kWh. These emission factors are also not static as communities uptake further renewable energy sources and, accordingly, a sensitivity analysis was conducted, examining the impact of results with future grid carbon intensity scenarios based on forecasted energy grid mixes by the National Renewable Energy Laboratory (NREL) [35]. The projected electric grid carbon intensity for these different scenarios are summarized in Table S2.
Table 1. Data sources for life cycle inventory of wastewater treatment systems.
Data TypeData Source
Construction inventoryEngineering design documents and contractor line item documents
Electricity usage and solar production dataFacility utility bills and utility providers
Flowrates, water quality, and biosolid characteristicsNebraska Department of Environment and Energy (NDEE) Discharge Monitoring Reports
Air emissions from biological processesEstimated based on the literature [36]
Background process dataEcoinvent Database v3.6
Carbon Intensity of ElectricityUSEPA eGRID [34] and NREL [35]
Design life10 State Standards (Great Lakes-Upper Mississippi River Board’s Recommended Standards for Water Works)

3.2. Evaluation of On-Site Solar Energy Generation

The assessment of the environmental impact of implementing on-site solar energy generation systems was conducted through the collection of case study data on three systems in Nebraska. Due to the often-available adjacent buffer land next to the wastewater treatment facilities, the communities had installed solar energy to provide renewable energy to the system and in two of the cases also provide solar energy to the local community electricity grid. Data for 1 to 3 years of electricity generation were collected from the community either directly or via the power provider. The built infrastructure of the solar panels was estimated by measuring the total square footage of the panels from Google Earth and utilizing the Ecoinvent Database v3.6 inventory for PV solar systems. The lifespan of the system was assumed to be 20 years based on the typical warranty of the panels. A 0.5% degradation in energy generation capacity per year was factored into the assessment [37]. The environmental impact of the operating WRRF was then assessed with and without using renewable energy to offset grid electricity use on an annual basis. The impact of implementing the solar system was compared to the net life cycle emissions of the overall facility previously collected and analyzed [18]. An example of solar generation and plant load data for case study A is provided in Table S1 and Figure S1 in the Supplementary Materials. This included the operating energy use; built infrastructure; and direct air, water, and soil emissions.

3.3. Evaluation of Energy Efficiency (E2) Improvements

An assessment of the environmental benefits of E2 improvements for either process-related components and/or auxiliary infrastructure was performed as discussed subsequently. E2 improvements were evaluated based on data collected from previous energy assessment recommendations conducted by two local technical assistance programs [4,38]. These recommendations typically included an assessment of the existing unit operation’s energy use, a modeled projected performance with modification, required resources for modification, implementation cost, and an estimated simple economic payback period.
Process-based energy efficiency improvements are defined in this study as any change that directly impacts the wastewater treatment process or process equipment, for example, in improving the level of automation or operation of secondary and sludge digestion aeration systems. As noted in previous energy efficiency studies [3,12,13], significant benefits exist in improving the level of the automation or operation of secondary and sludge digestion aeration systems. In this study, it was proposed to examine the energy efficiency benefit and associated environmental life cycle benefit of different levels of aeration automation. This included examining the implementation of variable frequency drives (VFDs) with and without automated dissolved oxygen control as well as the use of timer-based systems in comparison to non-controlled aeration systems that are commonly present in this case study data set.
In addition to process-based E2 improvements, changes associated with auxiliary infrastructure were investigated and compared to process-based changes. Due to the particularly high relevance of space heating observed in previous studies [3,4], some focus was centered on improvements being made in building envelope insulation. This impact of higher-efficiency lighting is often one of the most convenient E2 improvements to implement and was investigated based on site specifics of small WRRFs.
In total, 35 E2 recommendations were compiled from assessments conducted at 28 small WRRFs. Table 2 summarizes the specific E2 recommendations characterized by improvement type and area of focus. Lighting was the most common E2 recommendation provided in most assessments, with improvements in building insulation and the implementation of occupancy sensors appearing in a small subset of recommendations. It should be noted that recommendations provided in these reports were only included if they were identified to be cost-effective for communities with simple payback periods of less than 5 to 10 years. Site-specific information related to the E2 recommendations is provided in the Table S3 in Supplementary Materials. Detailed examples of the background data and calculations for two E2 recommendations (aeration and lighting) are included in the Supplemental Information. The recommendations are not a comprehensive sample of every E2 improvement in small WRRFs. However, they represent a sample of the most common types employed and cover most major energy-intensive building and process components. While there are many improvements that are theoretically possible to implement in small WRRFs, this research documents what changes are actively being made in communities based on site-specific drivers.

4. Results and Discussion

The goal of this work was to investigate benefits and compare on-site solar energy and several different common energy efficiency (E2) improvements. Impacts associated with implementing on-site solar energy are presented first and are followed by an assessment of specific energy efficiency improvements. Lastly, comparisons are made between the two methods for improving sustainability in small facilities.

4.1. On-Site Solar Energy Improvements

On-site solar energy installed at the three case study sites (A, B, and C) supplied different quantities of electricity (for example, monthly solar generation and facility load data in the Supplemental Information). The case study with a full life cycle inventory provided a representative sample of its impact on the profile. This included both operating electricity use and infrastructure associated with the solar energy system. Figure 2 shows the relative environmental impact of Case Study A analyzed with and without solar installation characterized by process and for each impact category; note that the environmental impacts from the wastewater plant infrastructure (civil works, equipment, pipes, fittings, and valves), water emissions, soil emissions, and air emissions from the wastewater remain unchanged in Figure 2 for both cases. This case study was for a 1.8 MGD oxidation ditch facility that had a 538 kW panel array installed adjacent to the facility to help reduce operating costs.
The solar system supplied approximately 76% of the annual electricity demand of the facility and reduced net GWP impacts by approximately 42%. For other impact categories, reductions in net impacts varied from 3% to 65%. In reducing energy impacts, built materials and operating air emissions become a much larger share of the overall environmental profile (>50% in most cases). This observation is also expected in counties with high renewable energy uptake in their electric grid, as found in past research [18].
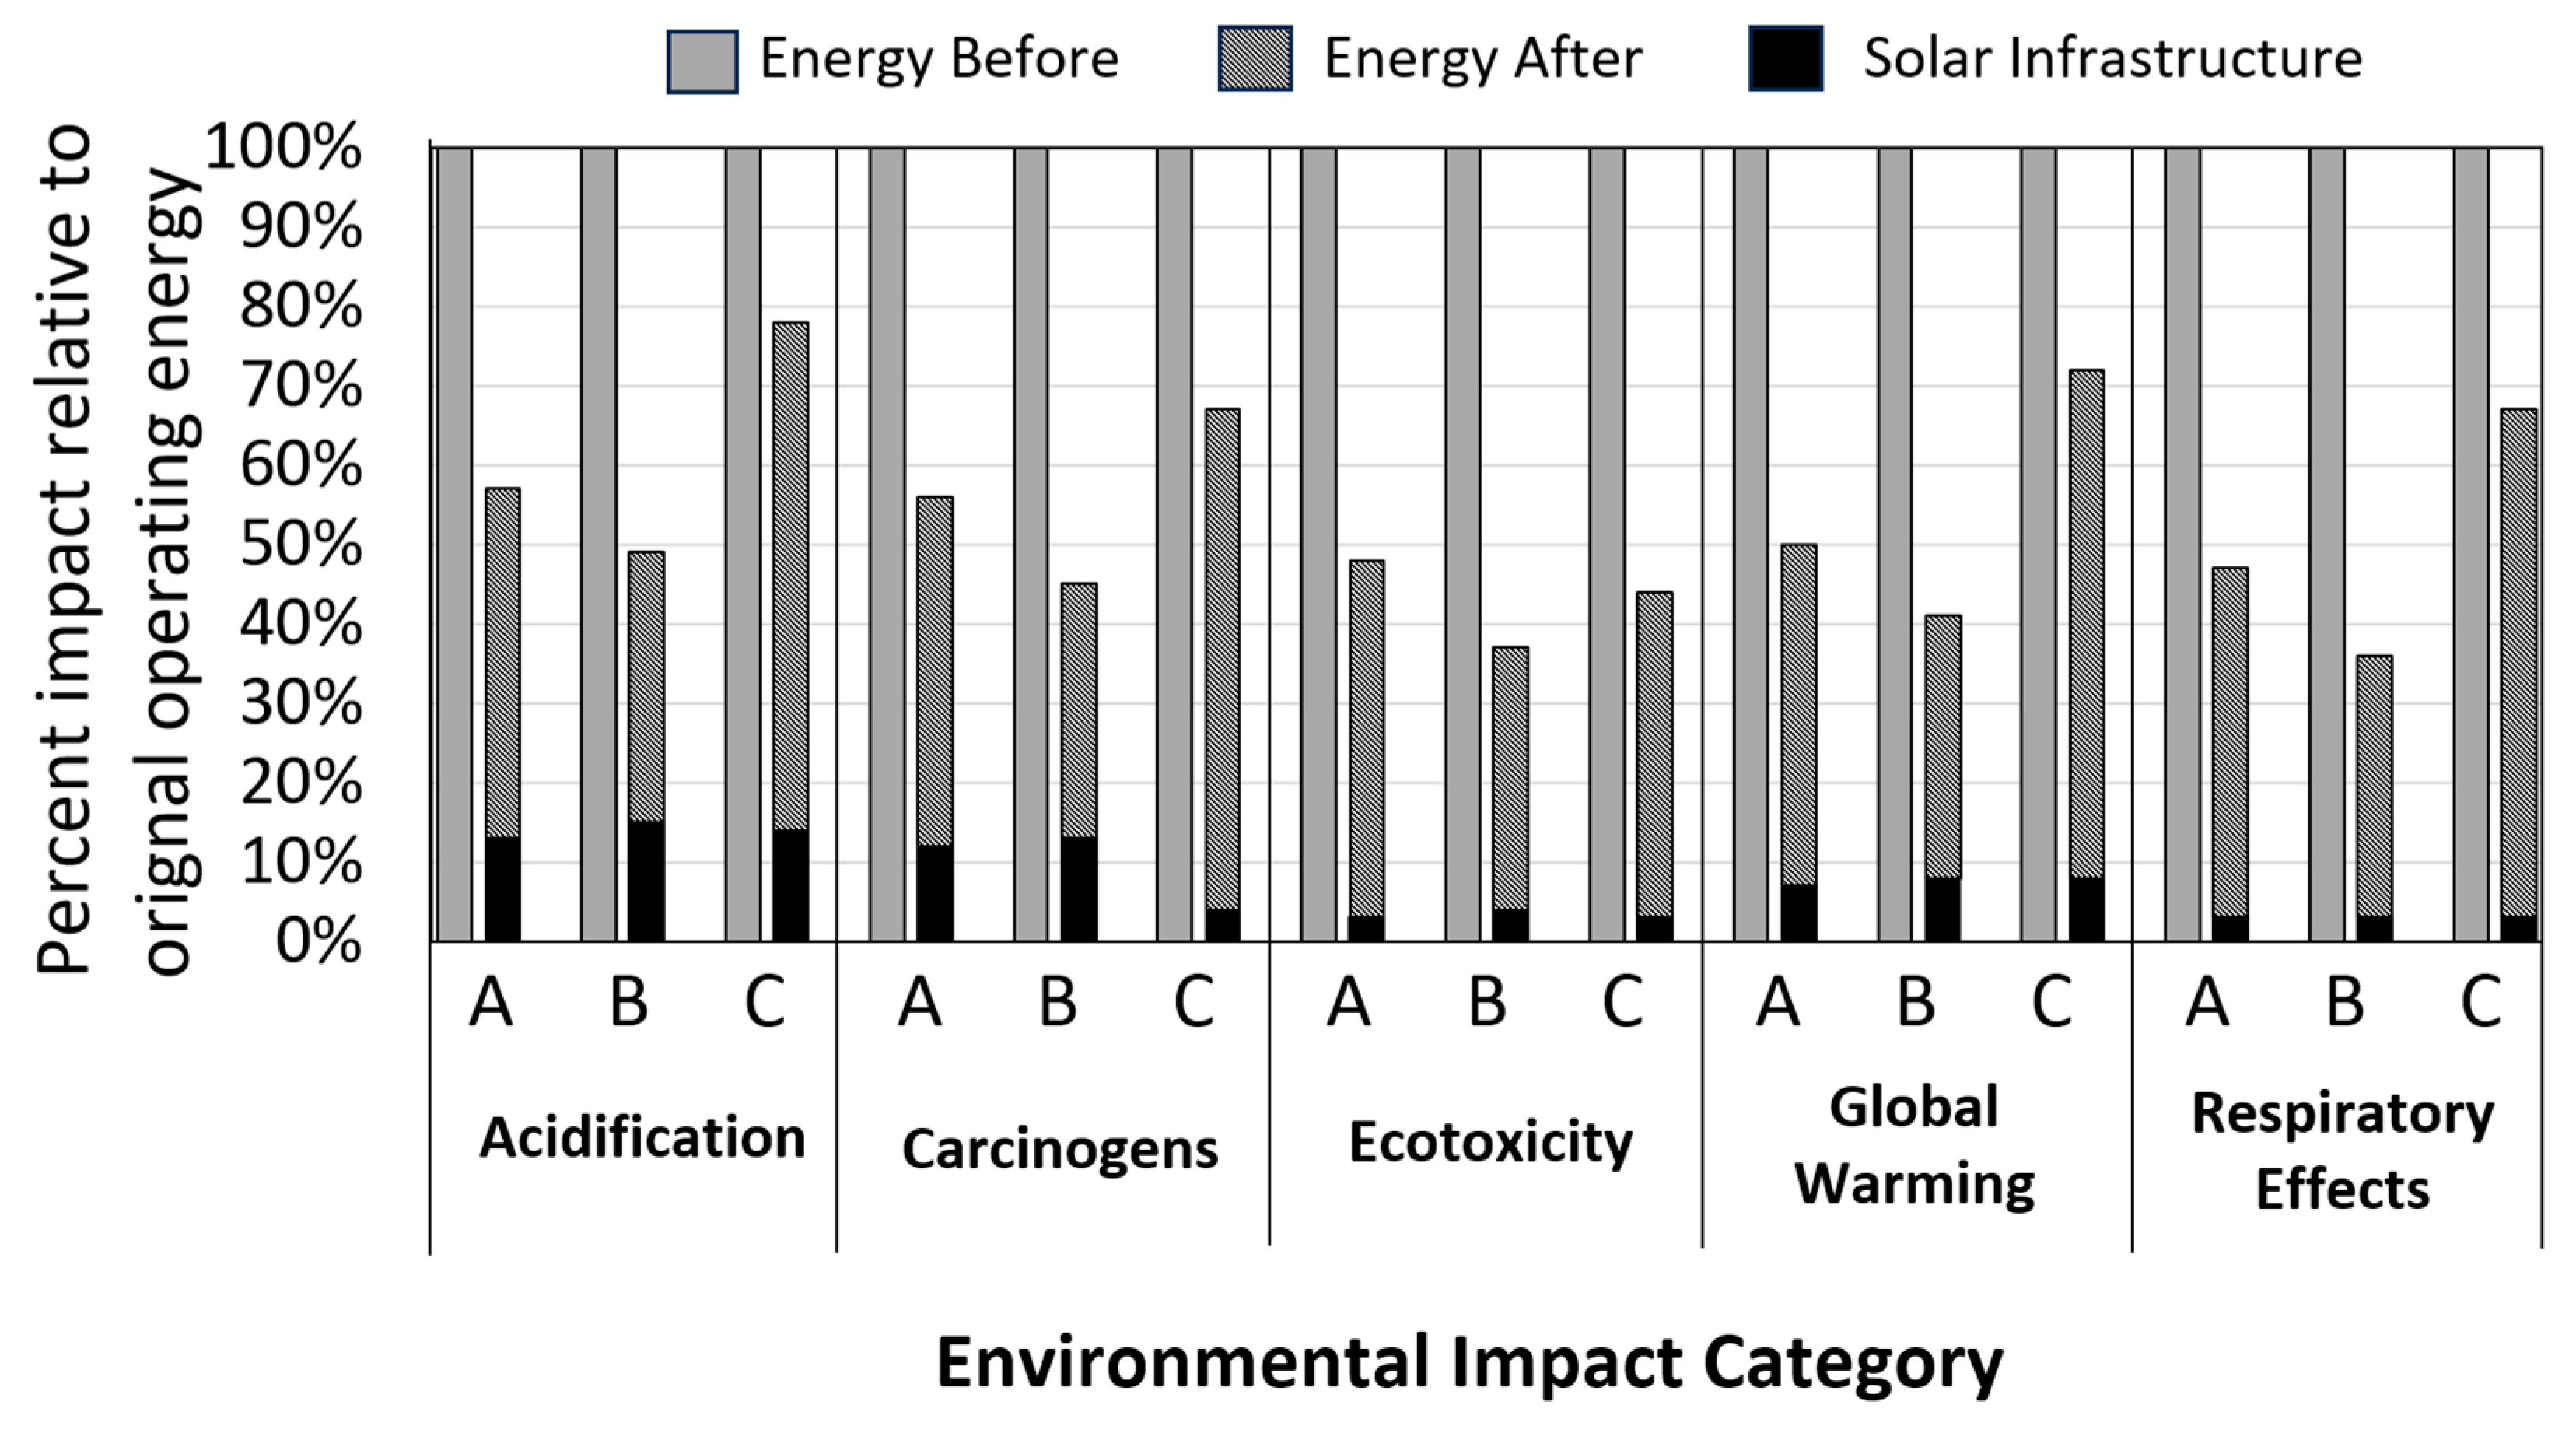
The relative environmental impact of on-site solar energy across the three case studies is compared in Figure 3 for a sample of different environmental impact categories. Note that for this figure, the comparison is only made between operating energy use before adding solar, energy impacts after, and the solar infrastructure. The relative percentage of the environmental impact of the new facility energy use and impact associated with solar infrastructure was compared to the prior energy use. Case Study B showed the largest reduction associated with net energy use (76%) and Case Study C showed the least (~50%). While these other cases did not have a full life cycle inventory collected, the comparison of energy reduction to existing energy use and solar infrastructure was expected to be similar to the prior profile shown and scaling proportionally with energy offsets. GWP intensity offsets for the three case studies varied from 0.43 to 0.65 kg CO2eq/m3. The net percentage of impact was also less for facilities with greater energy intensity.
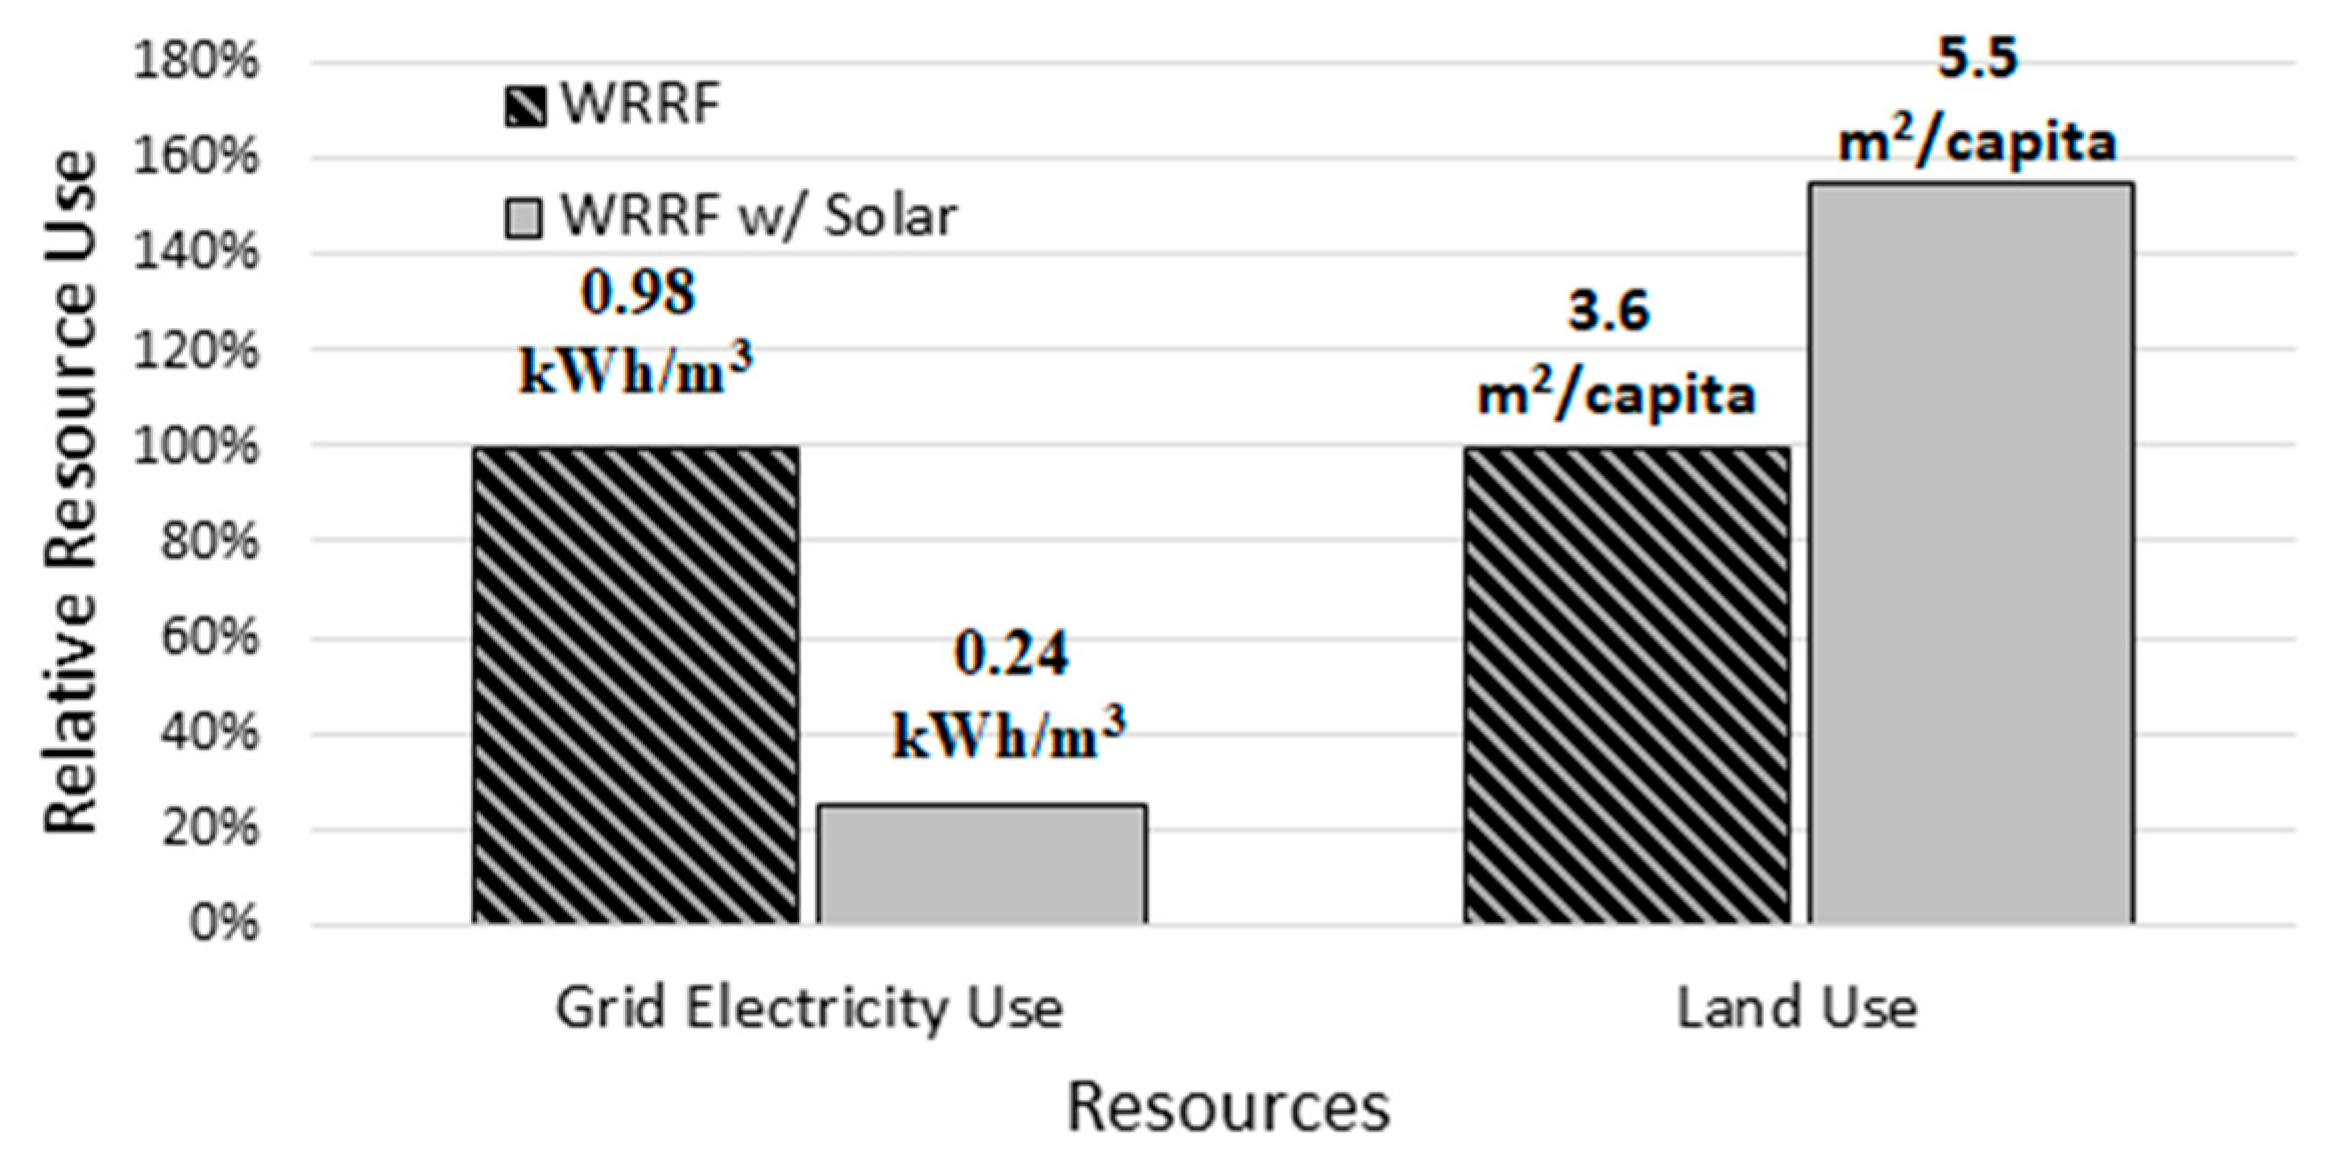
An additional factor analyzed for the case study was land use impacts. Figure 4 shows the relative resource tradeoffs of grid electricity use and land use in Case Study A. This site reduced electricity use from the grid significantly with the tradeoff of a 55% increase in required land for the system. However, this marginal increase in land use is relatively small compared to alternative technologies (i.e., lagoons, constructed wetlands) for small communities that exhibit more sustainable profiles and large spatial footprints (45–91 m2/capita) [18]. Integrating on-site solar energy into facilities allows them to reduce their environmental impacts to comparable levels to these other technologies while maintaining relatively minor land use.

4.2. Energy Efficiency Improvements

A total of 35 energy efficiency improvements from 20 small WRRFs were assessed and categorized by building and process-based improvement types. These represented common improvements implemented by these facilities [39,40]. Figure 5 summarizes the (a) simple economic payback period and (b) net GWP intensity offset average for each recommendation type. For recommendations with multiple applications (e.g., data points), the range (i.e., maximum and minimum) was denoted by the line.
Building-related improvements (e.g., space heating, window/door replacement) shown in Figure 5 have relatively low environmental impacts (e.g., lower GWP reduction) and high economic payback periods relative to process-based improvements. However, one exception was improvements in building insulation that could, in some cases, reduce electricity space heating significantly but also carried high payback periods for implementation. While improving lighting and adding occupancy sensors exhibited relatively fast payback periods, it exhibited an almost negligible impact. Past research observed that many small WRRF buildings are infrequently occupied and use very little lighting energy [3].
Process-based improvements exhibited a wide range of payback periods and impacts. Recommendations focused specifically on improving the operation of the secondary and aerobic digestion aeration had the largest impact out of all recommendations while showing low payback periods. In contrast, replacing existing motors with premium-efficiency motors exhibited small environmental benefits and with high economic payback periods. Improvements associated with belt filter press (BFP) operations and aerobic digestion were the largest impacts observed. For aerobic digestion, adding timers to help operators remember when to turn off blowers once sufficient aeration has occurred was very beneficial. For the two facilities with BFP improvements recommended, an increase in the frequency of dewatering and biosolid transfer from the aerobic digester would allow a significant reduction in required aeration. Supplying excess air for suspension allows the prolonged storage of biosolids and wasted process air and creates a higher back pressure and consequential electrical load on the blower motor. More frequent dewatering operations could reduce basin design sizing and energy use.
Recommendations exhibiting the lowest payback period while achieving the most significant environmental impact reductions were observed to be operational changes. The use of low-cost control methods such as timer systems presented a significant path for small WRRFs to reduce their energy use without the excessive burden of additional process instrumentation and process control systems. Local regulations require a professional engineer’s approval when making any permanent change to a motor’s power output (e.g., with a VFD) by which the engineering fees alone incur a significant cost, often making such changes economically unviable for a small system. While these improvements can save energy in other facilities, they also need to be implemented in tandem with proper training to ensure adequate process water and solids quality is maintained.

4.3. Comparison of On-Site Solar and E2 Retrofits

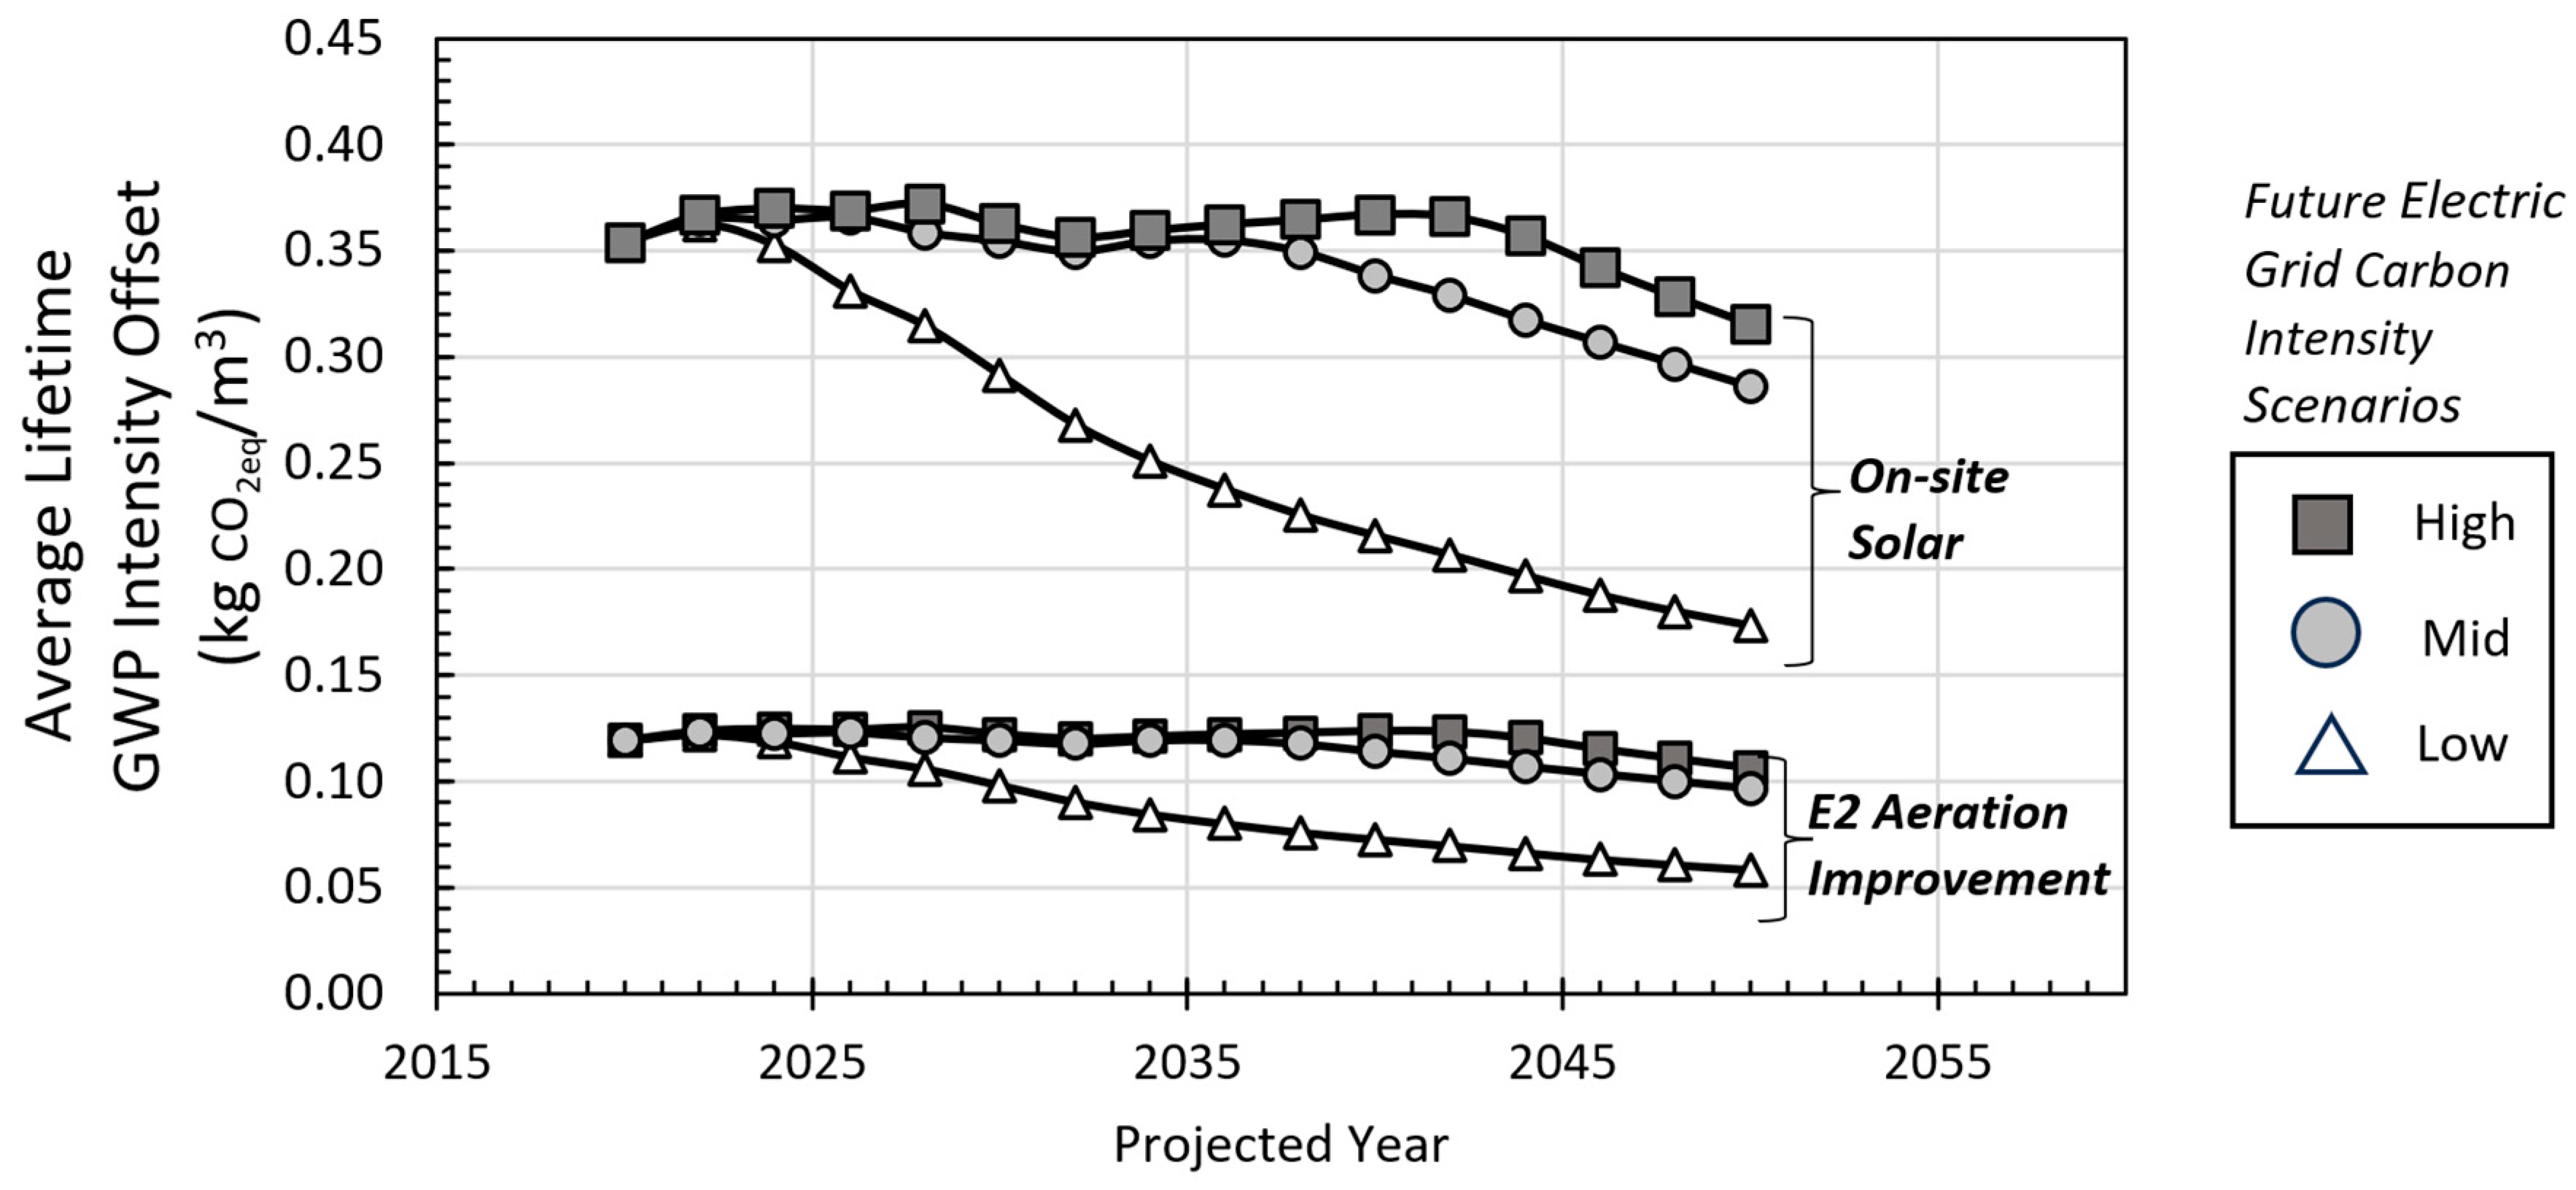
For small communities examining ways to improve the sustainability of their WRRFs, there are significant differences and tradeoffs associated with making energy efficiency improvements and installing on-site solar. In the Supplemental Information, the average GWP offset comparison of an on-site solar case study and the largest E2 aeration improvement observed in this study is shown and plotted over the future projected years under different future electric grid carbon intensity scenarios, and the forecasted carbon intensities of the grid are provided in the Supplemental Information. Solar renewable energy exhibited three times the impact relative (in reducing GHGs) as compared to the most significant E2 improvement made in facilities, based on current data. If future renewable energy costs become significantly cheaper than current market values, further uptake in the market will drive the electricity grid to have less of an environmental impact per kWh of electricity produced. This may reduce the magnitude of environmental benefits of adding on-site solar by as much as 25% over the next few decades.
In general, E2 improvements are limited in the magnitude of the overall impact of how much of the facility energy use can be reduced due to inherent inefficiencies associated with process energy/mass transfers (e.g., motor, blower, oxygen transfer efficiencies). Both motors and blowers tend to have lower energy efficiencies at smaller sizes (and trading for a higher-efficiency motor can result in improved efficiency by only a few percent). The equipment also has limitations in adjusting the capacity to meet process variations (e.g., benefits from blower VFDs can only be turned down by a limited percentage). In contrast, a facility could, in theory, receive enough renewable energy to offset its overall net environmental footprint.
Decision-making for many small communities is often driven by upfront capital cost expenditures associated with improvements. Accordingly, the carbon emission reduction per capital investment dollar was analyzed for the on-site solar systems and E2 improvements shown in Figure 6. While solar can have the biggest incremental emission offset, it offers the lowest reduction per investment dollar. In contrast, operational process control improvements offered orders of magnitude more impact per dollar invested. These same trends may not be observed for larger systems where the relative energy savings per cost of installing a VFD may be significantly higher.
Some E2 improvements may not be feasible in all facilities due to a lack of operational staff. Further, improvements associated with building insulation likely represent the worst-case scenario of poorly insulated buildings or spaces. This emphasizes the need to improve training opportunities and wastewater treatment designs that allow for easier process control in small WRRFs.
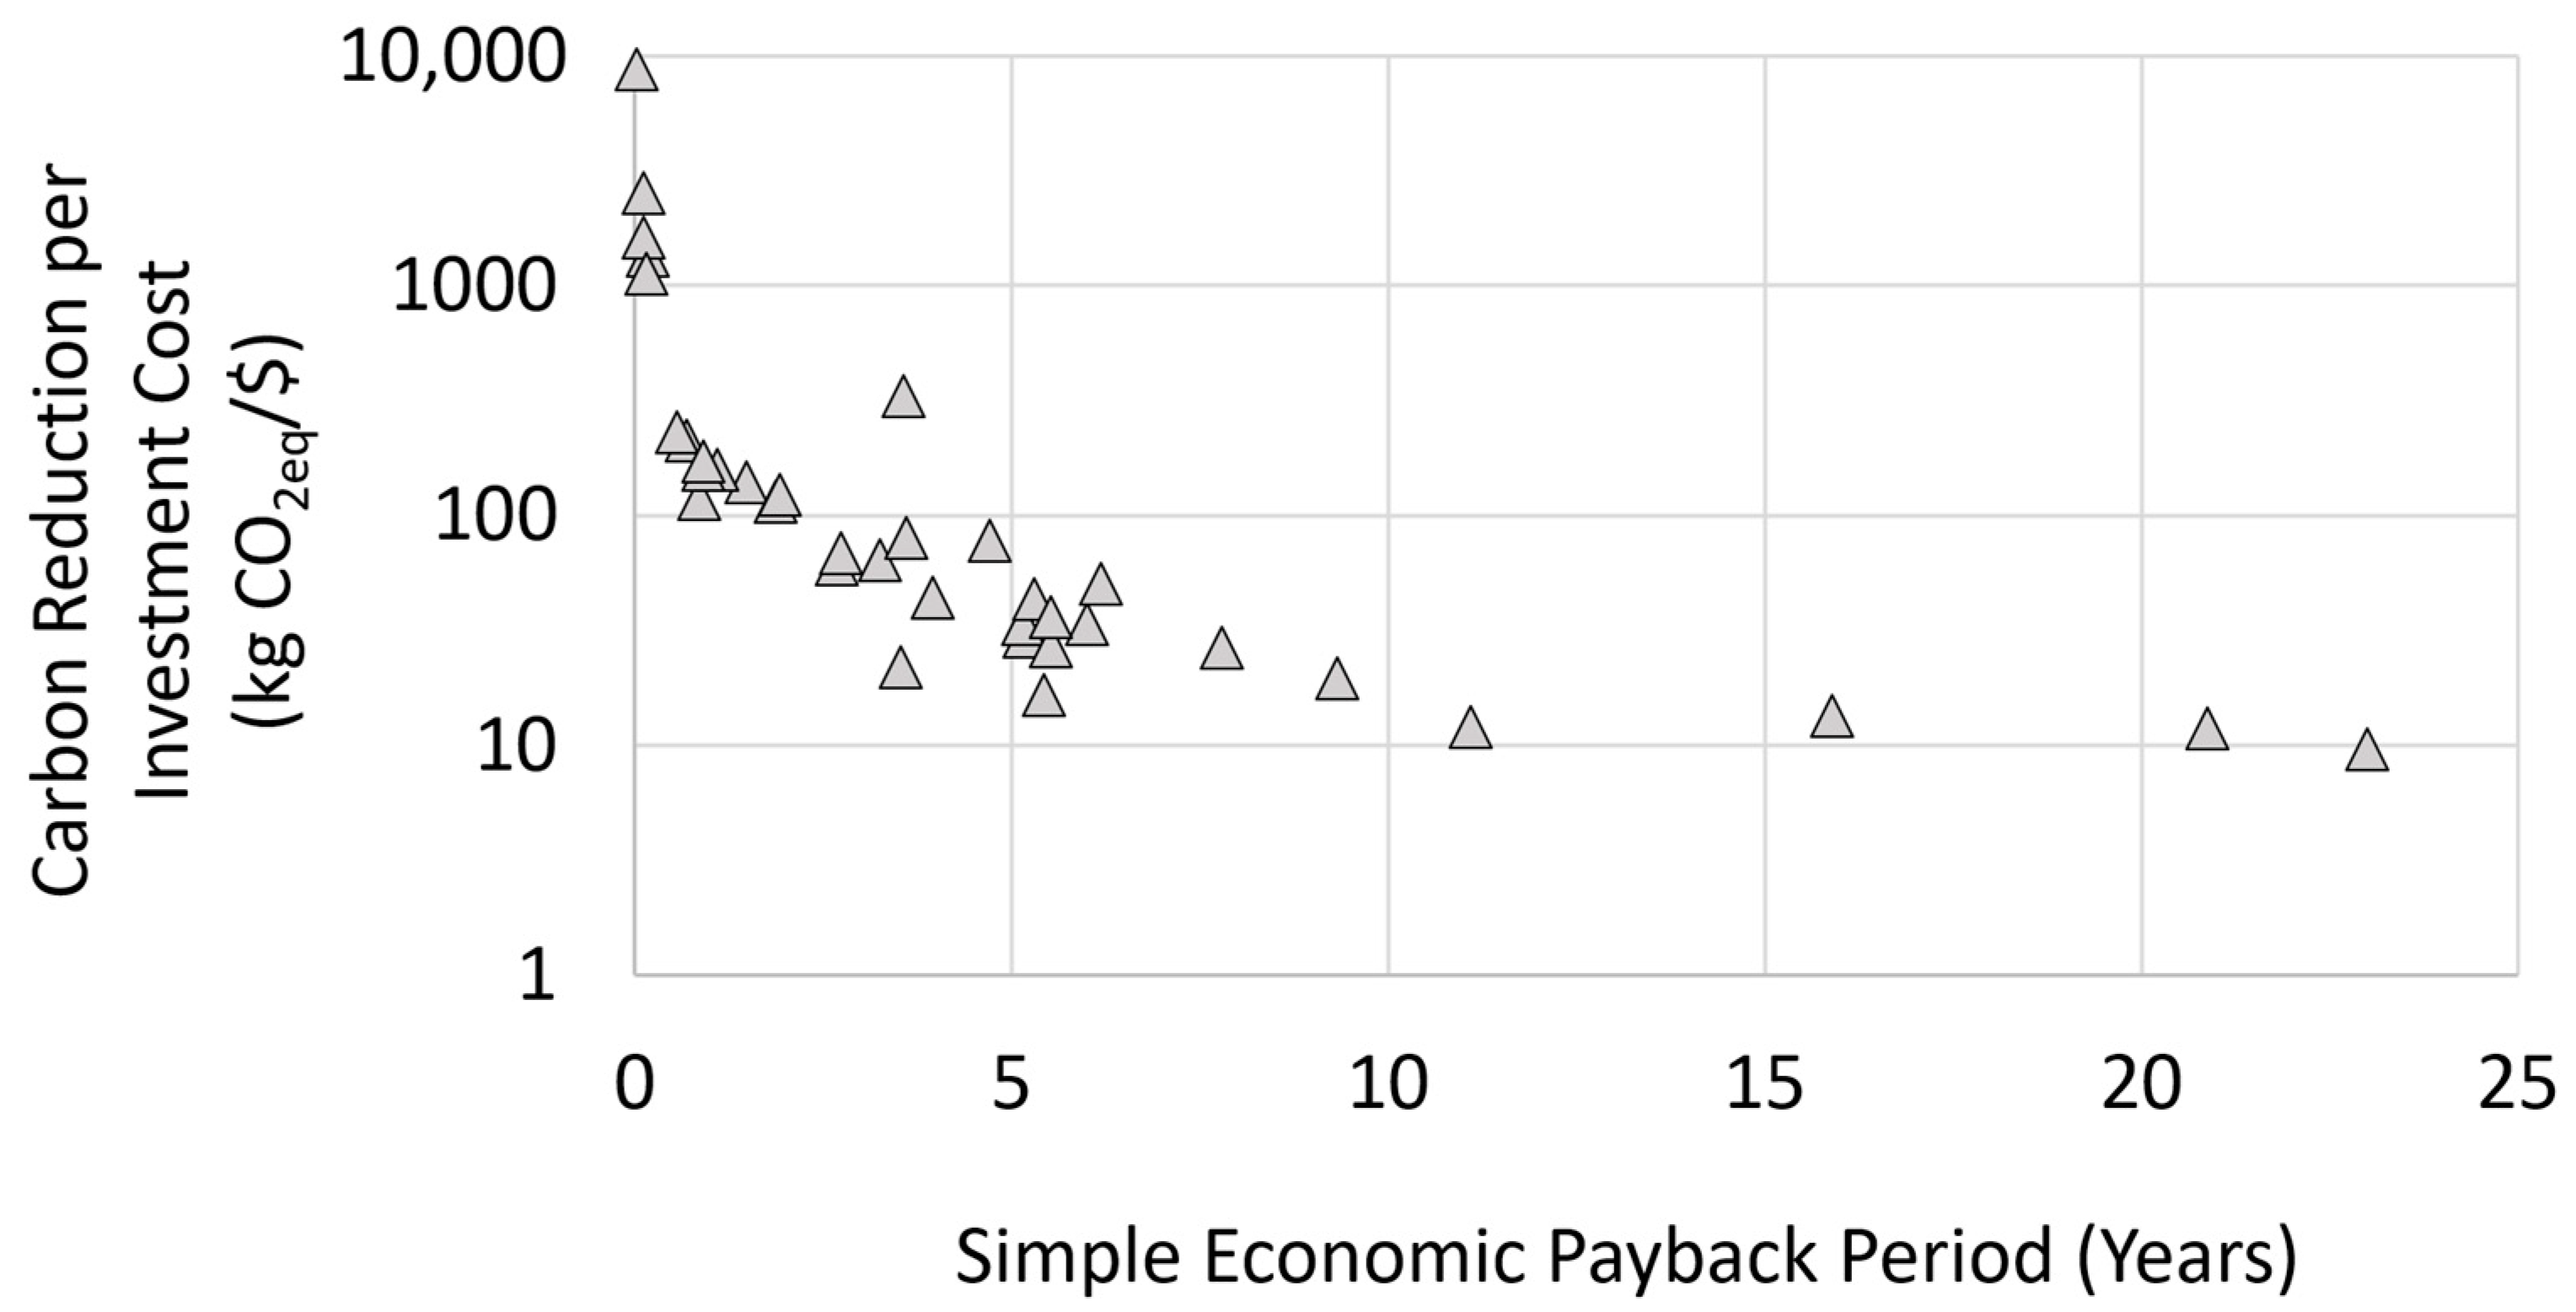
The carbon reduction per dollar invested is shown in Figure 7 relative to the simple economic payback period of the recommendations. It was observed that improvements that have relatively low costs and short payback periods would often provide the highest reduction in emissions per dollar spent; however, the magnitude of the benefit relative to the overall life cycle footprint varied significantly. Operational changes that reduce aeration (e.g., manual checking of dissolved oxygen levels and turning down blowers) were the single largest valued improvement with the shortest payback period, given the high energy use of aeration within small WRRFs. Due to locally less advantageous electric pricing for sending power back into the grid, solar has a relatively long payback period and low carbon reduction per dollar invested but has the potential to offset the largest net magnitude of emissions.
While the results of this study show the emission reduction potential of E2 improvements and on-site solar based on local 2022 electric grid mixes, it is projected that these grid mixes will become less carbon-intensive over time. Using projected future grid mixes estimated by NREL, the future projected integration of on-site solar and an energy efficiency improvement in aeration are shown in Figure 8 [35]. Each change is modeled from an initial year of 2020 to 2045 based on the different carbon-intensity scenarios. As the collective grid becomes less carbon-intensive, the environmental impact of making these improvements could be reduced by 50 to 75% over time based on current projections. This highlights the value of using a future forecasting approach to assessing the impact of these changes over time versus assuming constant electric grid mixes in such assessments.
There are quantitative environmental and resource impact tradeoffs (discussed previously) and other considerations that require discussion when considering comparisons of on-site solar energy and E2 improvements. Table 3 summarizes the tradeoffs between on-site solar and E2 improvements. On-site solar systems involve less operational involvement, can improve the energy resiliency of the facility, and carry less risk in terms of potential impact offsets relative to E2 improvements. E2 improvements often have higher uncertainty and risk associated with the magnitude of their impact while also potentially requiring additional operational effort. For example, a system that is oversized initially may observe increased loadings that reduce the net potential benefit of a process with improved process control over time.

4.4. Limitations and Uncertainties

This work examined a set of small WRRFs in Nebraska and comes with limitations and uncertainties associated with the results. The emissions reduction potential of these recommendations was based on case studies of a limited geographical range. Differences in economically viable E2 opportunities may be driven by factors such as differences in climate, previously implemented changes such as regulatory mandates (e.g., energy codes), and engineering design conventions. Locations with significantly higher electricity costs (e.g., >USD 0.10/kWh) may find some E2 improvements with payback periods below 5 to 10 years beyond those reported in this study. Furthermore, the impacts measured here are based on the SWPPP grid mix and will vary depending on the local composition of the grid mix. Locations with significantly higher CO2 emissions per unit energy used may find even higher CO2 reduction benefits than those reported here. Alternatively, locations with greener electric grid mixes (e.g., lower CO2 emissions per unit energy) will observe lower CO2 benefits. Air emissions were not included in this assessment, and changes specifically associated with intermittent aeration could impact N2O direct emissions from wastewater.
The overall benefits of adding solar panels to a small wastewater plant may vary incrementally, site-to-site, due to a range of factors not explored in this study. The benefits of solar for small wastewater plants may vary by the solar potential in a location; regions with more favorable solar potential (e.g., southern US) may show incrementally better results with higher energy production and locations with lower solar potential (e.g., northwest US) may yield incrementally less favorable results [41]. The end of life for solar panels can lead to additional economic and environmental impacts and were not captured in this study. It is not anticipated that their addition would drastically impact the GHG benefits but may influence other impact categories (resulting in burden shifting). The environmental impact from the fabrication, construction, and end of life of a solar system will vary based on the specific technologies applied and will have an incremental impact on the LCA and greenhouse gas emission impacts [42,43].

5. Conclusions

The goal of this work was to compare the environmental impact tradeoffs of on-site solar energy and several different common energy efficiency (E2) improvements for small mechanical WRRFs. The examination of case study data of three on-site solar energy systems showed that a significant portion (>50%) of the facility’s net environmental impact can be reduced. The reduced impacts from the off-site electric generation far outweigh the LCA impacts from the fabrication and use of solar panels. With the exception of some building envelope improvements to reduce heating, process-based E2 improvements and specifically operational changes associated with aeration exhibit the most meaningful impacts for reducing energy use in small WRRFs. In comparing these different methods for addressing the environmental impacts associated with energy use at facilities, each comes with clear tradeoffs in terms of the magnitude of impact, cost, ease of implementation, risks and uncertainty, spatial needs, and other considerations. This work provides an example case study that other communities could use to inform them on where to focus sustainability efforts within their wastewater treatment systems. Many small communities have already made significant strides to improve their sustainability profile and have provided some case studies highlighting the magnitude of the impact of such efforts.

Supplementary Materials

The following supporting information can be downloaded at https://www.mdpi.com/article/10.3390/environments11060118/s1: Table S1. Monthly electricity solar generation and facility load data for Case Study A, Figure S1. Monthly electricity solar generation and facility load plotted over time, Figure S2. Carbon offset relative to implementation cost for E2 improvements, Table S2. Summary of forecasted carbon intensity of grid electricity under different renewable energy adoption scenarios, Table S3. Summary of energy efficiency improvements recommended in assessments and examples of energy efficiency recommendations detailed in reports from technical assistance providers: example 1: aeration improvement and example 2: lighting improvement.

Author Contributions

Conceptualization, M.T. and B.D.; methodology, M.T.; formal analysis, M.T.; data curation, M.T.; writing—original draft preparation, M.T. writing—review and editing, B.D.; supervision, B.D.; funding acquisition, B.D. All authors have read and agreed to the published version of the manuscript.

Funding

This work was supported by a grant from the grant from the US EPA (Award # 97785201) and funds from the US Department of Energy, Industrial Assessment Center Awards DE-EE0007718 and DE-EE0009709.

Data Availability Statement

The data presented in this study are available on request from the corresponding author, with information identifying the specific locations removed, due to requests by cooperating utilities. Portions of the datasets used are included in the Supplemental Information.

Acknowledgments

The authors would like to thank the communities assessed, their engineering consulting firms, and their construction contractors for their willingness to share utility, operation, and construction data.

Conflicts of Interest

Matthew Thompson is employed by the company HDR Inc. The remaining author declare that the research was conducted in the absence of any commercial or financial relationships that could be construed as a potential conflict of interest. The funders had no role in the design of the study; in the collection, analyses, or interpretation of data; in the writing of the manuscript; or in the decision to publish the results.

References

  1. Lu, J.; Tang, J.; Shan, R.; Li, G.; Rao, P.; Zhang, N. Spatiotemporal analysis of the future carbon footprint of solar electricity in the United States by a dynamic life cycle assessment. iScience 2023, 26, 106188. [Google Scholar] [CrossRef]
  2. US EPA. About Small Wastewater Systems. Available online: https://www.epa.gov/small-and-rural-wastewater-systems/about-small-wastewater-systems (accessed on 12 August 2023).
  3. Thompson, M.; Dahab, M.F.; Williams, R.E.; Dvorak, B. Improving Energy Efficiency of Small Water-Resource Recovery Facilities: Opportunities and Barriers. J. Environ. Eng. 2020, 146, 05020005. [Google Scholar] [CrossRef]
  4. Hanna, S.; Thompson, M.; Williams, R.; Dahab, M.; Dvorak, B. Benchmarking the Electric Intensity of Small Nebraska Wastewater Treatment Facilities. Water Environ. Res. 2018, 90, 738–747. [Google Scholar] [CrossRef] [PubMed]
  5. Gu, Y.; Li, Y.; Li, X.; Luo, P.; Wang, H.; Robinson, Z.; Wang, X.; Wu, J.; Li, F. The feasibility and challenges of energy self-sufficient wastewater treatment plants. Appl. Energy 2017, 204, 1463–1475. [Google Scholar] [CrossRef]
  6. US EPA. Sustainable Water Infrastructure: Energy Efficiency for Water Utilities. Available online: https://www.epa.gov/sustainable-water-infrastructure/energy-efficiency-water-utilities (accessed on 10 February 2023).
  7. EPRI. Water and Wastewater Industries: Characteristics and Energy Management Opportunities. Electrical Power Research Institute. (EPRI/CR-106941, September 1996). Available online: https://www.epri.com/research/products/000000003002001433 (accessed on 21 May 2024).
  8. Pabi, S.; Amarnath, A.; Goldstein, R.; Reekie, L. Electricity Use and Management in the Municipal Water Supply and Wastewater Industries; Report No. 3002001433; Electric Power Research Institute: Palo Alto, CA, USA, 2013; Available online: https://www.sciencetheearth.com/uploads/2/4/6/5/24658156/electricity_use_and_management_in_the_municipal_water_supply_and_wastewater_industries.pdf (accessed on 21 May 2024).
  9. Balmér, P.; Hellström, D. Performance indicators for wastewater treatment plants. Water Sci. Technol. 2012, 65, 1304–1310. [Google Scholar] [CrossRef] [PubMed]
  10. Huang, R.; Shen, Z.; Wang, H.; Xu, J.; Ai, Z.; Zheng, H.; Liu, R. Evaluating the energy efficiency of wastewater treatment plants in the Yangtze River Delta: Perspectives on regional discrepancies. Appl. Energy 2021, 297, 117087. [Google Scholar] [CrossRef]
  11. Sowby, R.; Thompson, M. Energy Profiles of Nine Water Treatment Plants in the Salt Lake City Area and Implications for Planning, Design, and Operation. J. Environ. Eng. 2021, 147, 04021018. [Google Scholar] [CrossRef]
  12. Daw, J.; Hallett, K.; DeWolfe, J.; Venner, I. Energy Efficiency Strategies for 503 Municipal Wastewater Treatment Facilities. 2012; [NREL/TP-7A30-53341]. Available online: https://www.nrel.gov/docs/fy12osti/53341.pdf (accessed on 21 May 2024).
  13. Foladori, P.; Vaccari, M.; Vitali, F. Energy audit in small wastewater treatment plants: Methodology, energy consumption indicators, and lessons learned. Water Sci. Technol. 2015, 72, 1007–1015. [Google Scholar] [CrossRef]
  14. Landis, A.E. The state of water/wastewater utility sustainability: A North American survey. J.-Am. Water Work. Assoc. 2015, 107, E464–E473. [Google Scholar] [CrossRef]
  15. US EPA. Clean Watersheds Needs Survey 2012; [EPA/830/R-15005]; United States Environmental Protection Agency: Washington, DC, USA, 2016. Available online: https://www.epa.gov/sites/default/files/2015-12/documents/cwns_2012_report_to_congress-508-opt.pdf (accessed on 21 May 2024).
  16. Doka, G. Part IV: Wastewater Treatment. In Life Cycle Inventories of Waste Treatment Services; Ecoinvent Report No. 13; Swiss Centre for Life Cycle Inventories: Dübendorf, Switzerland, December 2003; Available online: https://www.doka.ch/13_IV_WastewaterTreatment.pdf (accessed on 1 June 2021).
  17. Nguyen, T.K.L.; Ngo, H.H.; Guo, W.S.; Chang, S.W.; Nguyen, D.D.; Nghiem, L.D.; Nguyen, T.V. A critical review on life cycle assessment and plant-wide models towards emission control strategies for greenhouse gas from wastewater treatment plants. J. Environ. Manag. 2020, 264, 110440. [Google Scholar] [CrossRef]
  18. Thompson, M.; Moussavi, S.; Li, S.; Dvorak, B. Environmental Life Cycle Assessment of small water resource recovery facilities: Comparison of mechanical and lagoon systems. Water Res. 2022, 215, 118234. [Google Scholar] [CrossRef] [PubMed]
  19. de Haas, D.; Dancey, M. Wastewater Treatment Energy Efficiency. Water J. Aust. Water Assoc. 2015, 42, 53. [Google Scholar]
  20. US Congress. S.914—Drinking Water and Wastewater Infrastructure Act of 2021. 117th Congress (2021–2022). Available online: https://www.congress.gov/bill/117th-congress/senate-bill/914 (accessed on 21 May 2024).
  21. USDA. Water & Waste Disposal Loan & Grant Program. Available online: https://www.rd.usda.gov/programs-services/water-environmental-programs/water-waste-disposal-loan-grant-program (accessed on 10 February 2023).
  22. NDEE (Nebraska Department of Environment and Energy). Nebraska Climate Pollution Reduction Planning. Available online: https://dee.ne.gov/ndeqprog.nsf/onweb/cprg (accessed on 12 June 2023).
  23. Milani, S.; Bidhendi, G. Biogas and photovoltaic solar energy as renewable energy in wastewater treatment plants: A focus on energy recovery and greenhouse gas emission mitigation. Water Sci. Eng. 2023. [Google Scholar] [CrossRef]
  24. Algunaibet, I.; Guillén-Gosálbez, G. Life cycle burden-shifting in energy systems designed to minimize greenhouse gas emissions: Novel analytical method and application to the United States. J. Clean. Prod. 2019, 229, 886–901. [Google Scholar] [CrossRef]
  25. Lopsik, K. Life cycle assessment of small-scale constructed wetland and extended aeration activated sludge wastewater treatment system. Inter. J. Environ. Sci. Technol. 2013, 10, 1295–1308. [Google Scholar] [CrossRef]
  26. ISO (2006a). “Environmental Management—Life Cycle Assessment—Principles and Framework.” ISO 14040. Available online: https://wapsustainability.com/wp-content/uploads/2020/11/ISO-14040.pdf (accessed on 2 February 2023).
  27. ISO (2006b). “Eanvironmental Management—Life Cycle Assessment—Requirements and Guidelines.” ISO 14044. Available online: https://wapsustainability.com/wp-content/uploads/2020/11/ISO-14044.pdf (accessed on 2 February 2023).
  28. Garfí, M.; Flores, L.; Ferrer, I. Life Cycle Assessment of wastewater treatment systems for small communities: Activated sludge, constructed wetlands and high rate algal ponds. J. Clean. Prod. 2017, 161, 211–219. [Google Scholar] [CrossRef]
  29. Longo, S.; d’Antoni, B.; Bongards, M.; Chaparro, A.; Cronrath, A.; Fatone, F.; Lema, J.; Mauricio-Iglesias, M.; Soares, A.; Hospido, A. Monitoring and diagnosis of energy consumption in wastewater treatment plants. A state of the art and proposals for improvement. Appl. Energy 2016, 179, 1251–1268. [Google Scholar] [CrossRef]
  30. Corominas, L.; Byrne, D.; Guest, J.S.; Hospido, A.; Roux, P.; Shaw, A.; Short, M.D. The application of life cycle assessment (LCA) to wastewater treatment: A best practice guide and critical review. Water Res. 2020, 184, 116058. [Google Scholar] [CrossRef] [PubMed]
  31. Li, J.; Tang, W.Z.; Gu, L. Energy efficiency assessment of China wastewater treatment plants by unit energy consumption per kg COD removed. Environ. Technol. 2023, 44, 278–292. [Google Scholar] [CrossRef]
  32. Bare, J.C. The Tool for the Reduction and Assessment of Chemical and Other Environmental Impacts. J. Ind. Ecol. 2002, 6, 49–78. [Google Scholar] [CrossRef]
  33. Ryberg, M.; Vieira, M.D.M.; Zgola, M.; Bare, J.; Rosenbaum, R.K. Updated US and Canadian normalization factors for TRACI 2.1. Clean Technol. Environ. Policy 2014, 16, 329–339. [Google Scholar] [CrossRef]
  34. US EPA. eGRID Data Explorer. Available online: https://www.epa.gov/egrid/data-explorer (accessed on 28 April 2024).
  35. Gagnon, P.; Cowiestoll, B.; Schwarz, M. Cambium 2022 Data. National Renewable Energy Laboratory. Available online: https://scenarioviewer.nrel.gov (accessed on 28 April 2024).
  36. Foley, J.; de Haas, D.; Hartley, K.; Lant, P. Comprehensive life cycle inventories of alternative wastewater treatment systems. Water Res. 2010, 44, 1654–1666. [Google Scholar] [CrossRef] [PubMed]
  37. Jordan, D.C.; Kurtz, S.R.; VanSant, K.; Newmiller, J. Compendium of photovoltaic degradation rates. Prog. Photovolt. Res. Appl. 2016, 24, 978–989. [Google Scholar] [CrossRef]
  38. Dvorak, B.I.; Stewart, B.A.; Hosni, A.; Hawkey, S.A.; Nelsen, V. Intensive Environmental Sustainability Education: Long-Term Impacts on Workplace Behavior. J. Prof. Issues Eng. Educ. 2011, 137, 113–120. [Google Scholar] [CrossRef]
  39. US EPA. Evaluation of Energy Conservation Measures for Wastewater Treatment Facilities [EPA/832/R-10/005]; United States Environmental Protection Agency: Washington, DC, USA, 2010. [Google Scholar]
  40. US EPA. Energy Efficiency in Water and Wastewater Facilities: A Guide to Developing and Implementing Greenhouse Reduction Programs [EPA/430/R-09/038]; United States Environmental Protection Agency: Washington, DC, USA, 2013. [Google Scholar]
  41. Grant, C.; Hicks, A. Effect of manufacturing and installation location on environmental impact payback time of solar power. Clean Technol. Environ. Policy 2020, 22, 187–196. [Google Scholar] [CrossRef]
  42. Krebs-Moberg, M.; Pitz, M.; Dorsette, T.; Gheewala, S. Third generation of photovoltaic panels: A life cycle assessment. Renew. Energy 2021, 164, 556–565. [Google Scholar] [CrossRef]
  43. Rashedi, A.; Khanam, T. Life cycle assessment of most widely adopted solar photovoltaic energy technologies by mid-point and end-point indicators of ReCiPe method. Environ. Sci. Pollut. Res. 2020, 27, 29075–29090. [Google Scholar] [CrossRef]
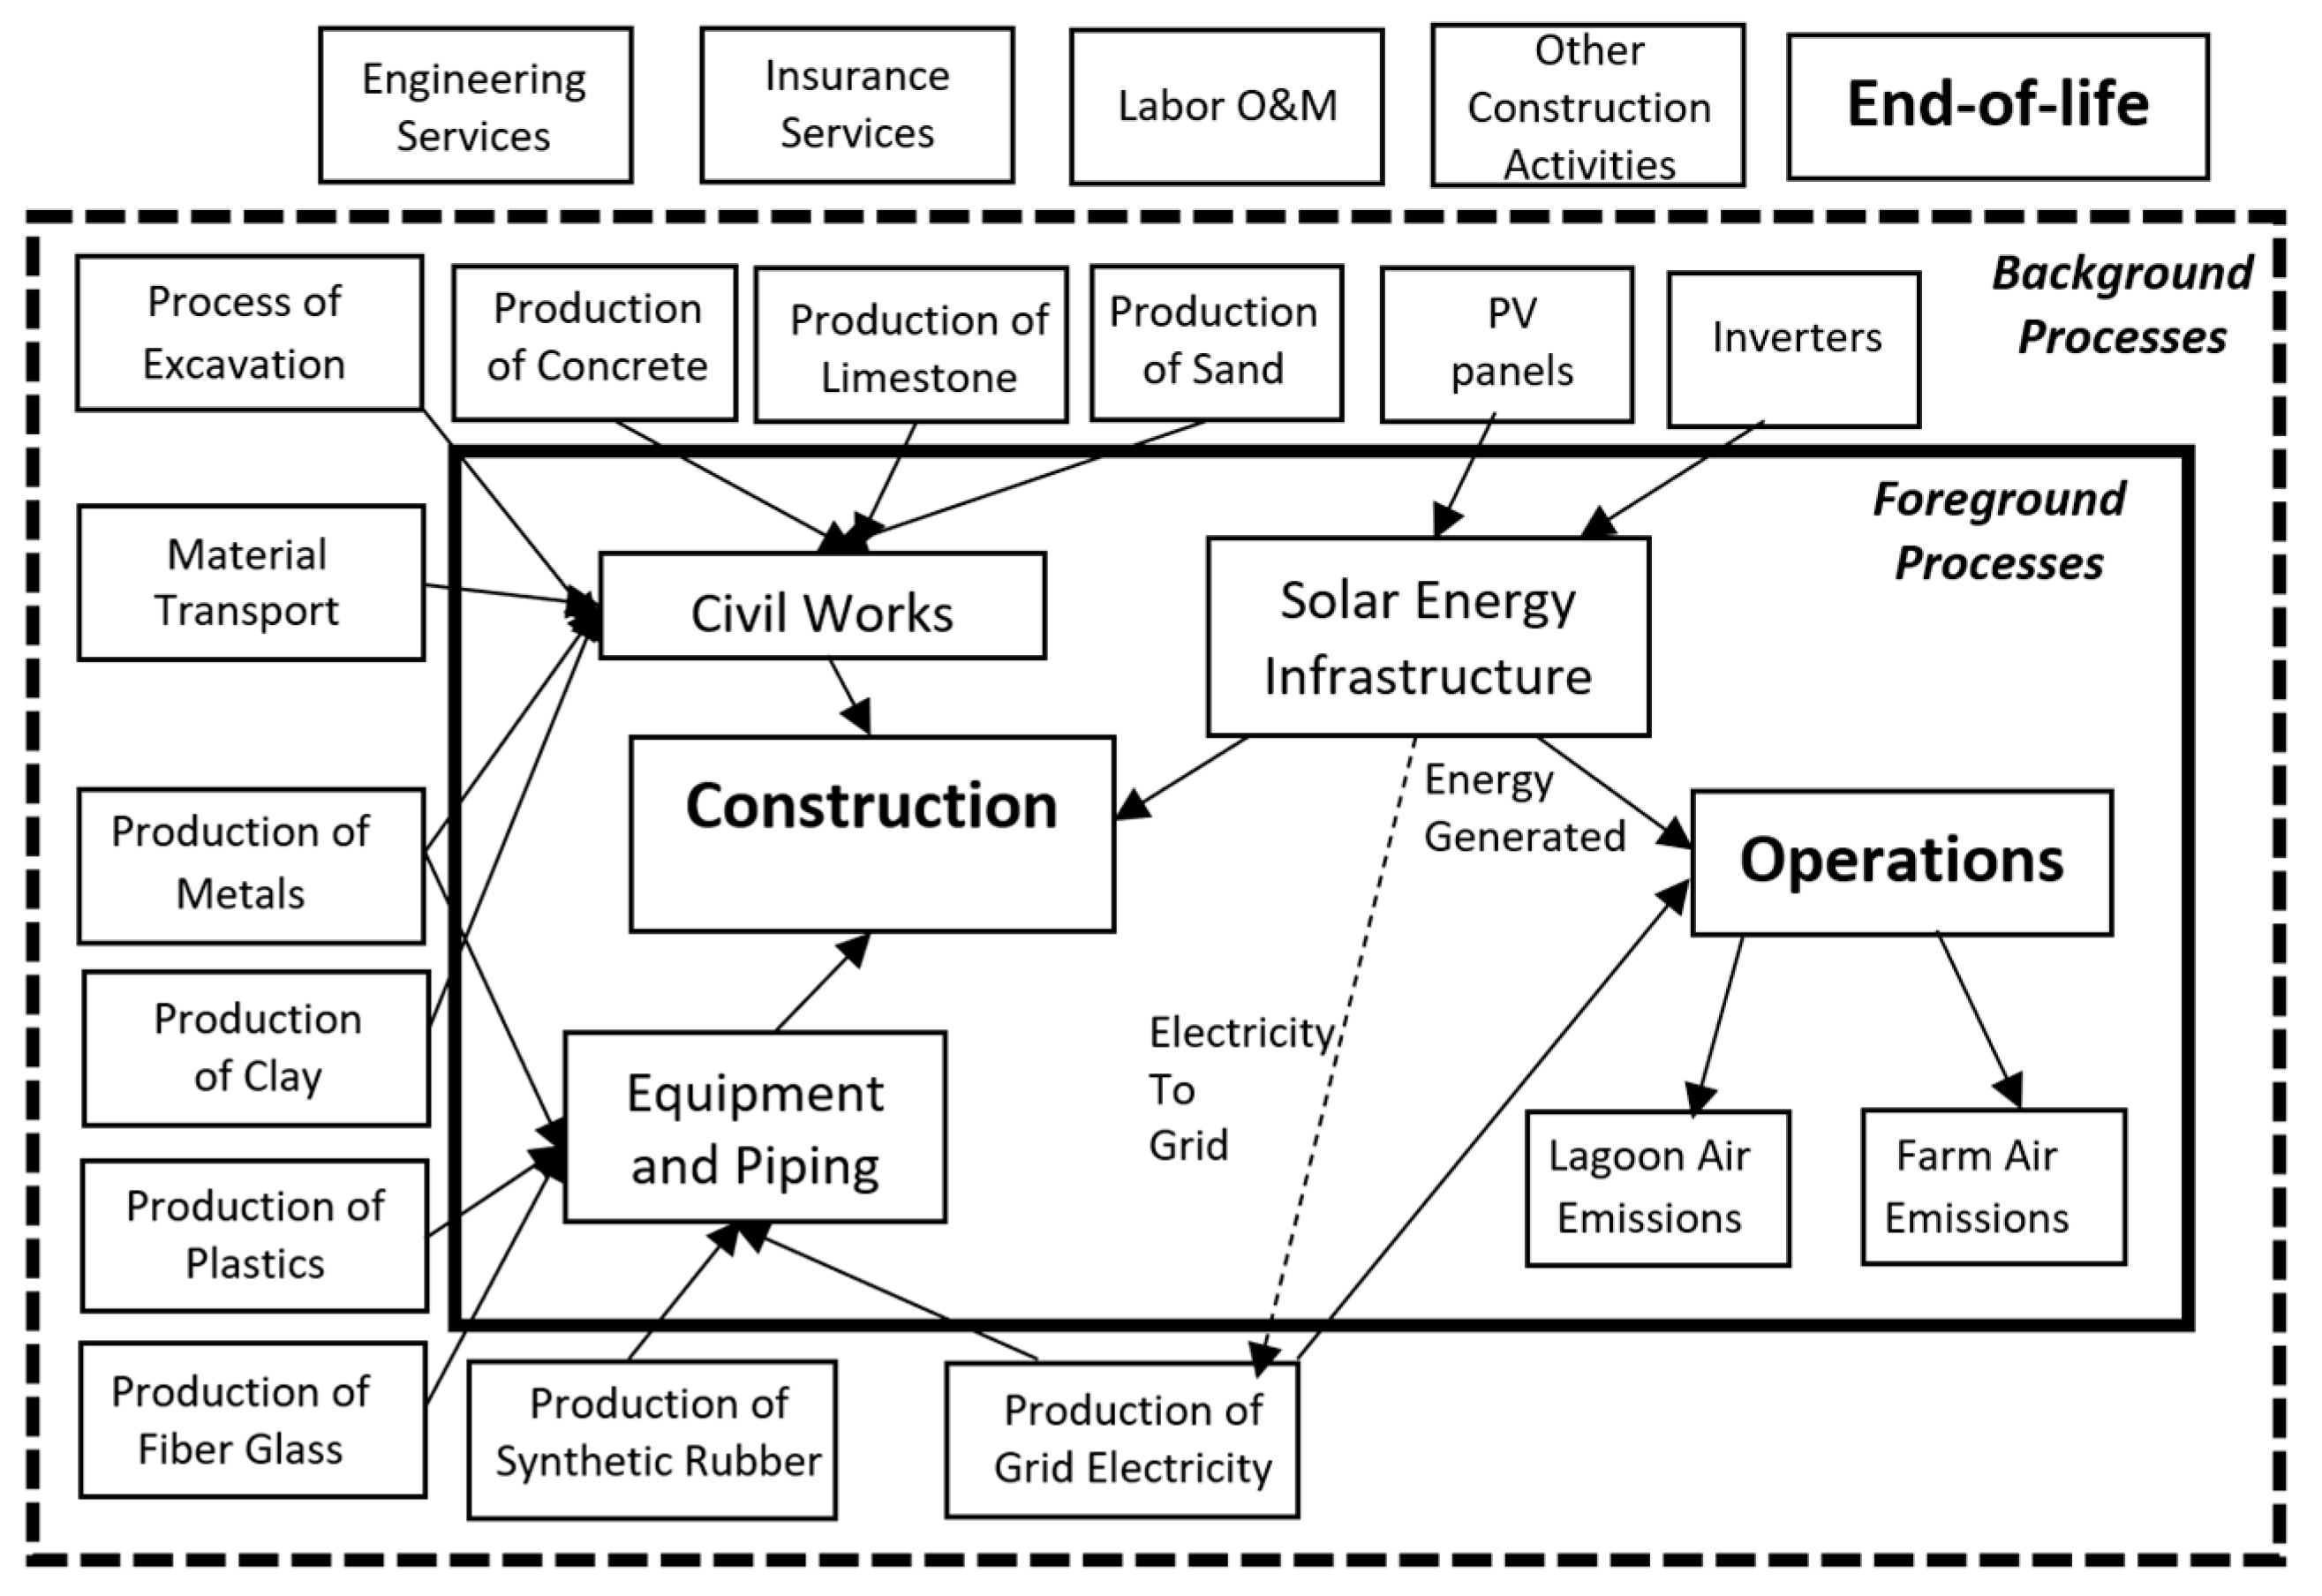
Figure 1. System boundary of LCA study on solar energy and E2 improvements in WRRFs.
Environments 11 00118 g001
Figure 2. Relative environmental impact of Case Study A with and without on-site solar energy characterized by process and impact category.
Environments 11 00118 g002
Figure 3. Relative environmental impact of solar energy and associated infrastructure for three case studies (note: letter denotes case study).
Environments 11 00118 g003
Figure 4. Tradeoff between grid electricity use reductions (per m3 of wastewater treated) and increased land use (m2) associated with solar energy adoption at Case Study A.
Environments 11 00118 g004
Figure 5. Energy efficiency improvements characterized by the process: (a) simple economic payback period and (b) net GWP intensity offset with the sample size of each improvement shown in parentheses. (note: the small bar represents the minimum and maximum observed range observed for improvement category.
Environments 11 00118 g005
Figure 6. Carbon emission reduction per initial capital cost investment for solar and energy efficiency improvements.
Environments 11 00118 g006
Figure 7. Carbon reduction per investment cost relative to the simple economic payback period for E2 improvements and on-site solar energy.
Environments 11 00118 g007
Figure 8. Carbon reduction offset of on-site solar and E2 aeration improvements forecasted over time with different future electric grid carbon intensity scenarios.
Environments 11 00118 g008
Table 2. E2 recommendations investigated.
Improvement TypeArea of FocusRecommendation# of Recommendations
BuildingBuilding EnvelopeImprove building insulation3
LightingInstall LED lightbulbs14
LightingOccupancy sensors1
Treatment ProcessSecondary TreatmentDownsize aeration blower1
Timer on secondary aeration1
VFD on secondary aeration2
Install premium efficiency motor1
Biosolids ManagementImprove BFP/aerobic digester operation2
Improve sludge blower operations2
Install aerobic digester cover2
Timer on aerobic digester blower4
VFD on aerobic digestion1
PumpingInstall premium-efficiency motor1
Aeration1
Table 3. Summary of tradeoffs between on-site solar and E2 improvements.
On-Site Solar PowerE2 Improvements
Largest potential for net GHG reductionsOften shorter paybacks
Lower operational involvementLarge GHG reductions per unit cost
Longer paybacksMay require additional operational effort
Lowest GHG reduction per initial costHigher uncertainty and risks
Larger land useTend to have smaller overall net impact
Resiliency of on-site electricity sourceMinimal additional spatial footprint
Disclaimer/Publisher’s Note: The statements, opinions and data contained in all publications are solely those of the individual author(s) and contributor(s) and not of MDPI and/or the editor(s). MDPI and/or the editor(s) disclaim responsibility for any injury to people or property resulting from any ideas, methods, instructions or products referred to in the content.