Article

A Microplastic Pollution Hotspot: Elevated Levels in Sediments from the San Francisco Bay Area

1
Environmental Engineering Laboratory, Department of Chemical Engineering, University Rovira and Virgili, Paisos Catalans Avenue 26, 43007 Tarragona, Catalonia, Spain
2
Laboratory of Toxicology and Environmental Health, School of Medicine, University Rovira and Virgili, Sant Llorenc 21, 43201 Reus, Catalonia, Spain
3
Institut d’Investigació Sanitària Pere Virgili (IISPV), 43204 Reus, Catalonia, Spain
4
San Francisco Estuary Institute, 4911 Central Avenue, Richmond, CA 94804, USA
5
Department of Toxic Substances Control, California Environmental Protection Agency, 700 Heinz Avenue, Suite 100, Berkeley, CA 94710, USA
6
Department of Obstetrics, Gynecology and Reproductive Sciences, University of California-San Francisco, San Francisco, CA 94143, USA
7
California Department of Public Health, Environmental Health Laboratory Branch, 850 Marina Bay Parkway, Richmond, CA 94804, USA
8
Faculty of Pharmacy and Food Sciences, Universitat de Barcelona, Joan XXIII Avenue s/n, 08028 Barcelona, Catalonia, Spain
*
Author to whom correspondence should be addressed.
Environments 2024, 11(5), 103; https://doi.org/10.3390/environments11050103
Submission received: 18 April 2024 / Revised: 9 May 2024 / Accepted: 16 May 2024 / Published: 20 May 2024
(This article belongs to the Special Issue Plastics Pollution in Aquatic Environments)

Abstract

:
San Francisco Bay’s sediment is currently monitored for a variety of contaminants; however, data regarding the microplastics (MPs) in the area are still scarce. MPs’ occurrence in sediment samples has gained recognition as a reservoir for MP accumulation. Moreover, Bay sediment is also an important matrix for monitoring because sediment tends to accumulate certain contaminants and act as a source of contaminants in the Bay food web. This study analyzed MPs ranging from 25 µm to 5 mm in surface sediment grab samples (n = 8) and two sediment core samples (n = 2 cores analyzed with 11 samples from different depths). Our findings provide an evaluation of MP levels in different regions of the bay. The MP levels detected in Bay surface grab samples ranged from 2.1 to 11.9 MPs/g dry weight (n = 8), with a mean value of 6.2 MPs/g. The most abundant morphology was fibers, followed by fragments and films.

1. Introduction

Microplastics (MPs), defined as plastic particles measuring less than 5 mm, have become a prominent environmental issue worldwide. MPs are not a conventional chemical contaminant; rather, they are a diverse mixture of anthropogenic debris consisting of various-sized polymers, chemical additives, and adsorbed pollutants [1]. They are composed of synthetic, insoluble compounds, and these particles can be categorized based on their distinct morphologies, including fibers, films, foams, fragments, and pellets [2]. A comprehensive monitoring of MP contamination involves the physical–chemical characterization of various parameters such as their size, shape, color, and polymer type. This characterization process requires appropriate sample preparation and subsequent analysis utilizing suitable analytical methods [3].
MPs can enter aquatic environments through various pathways including atmospheric deposition [4], effluent from wastewater treatment plants [5,6], urban runoff [7], and illegal dumping [8]. In particular, the improper management of waste, as well as particles released from synthetic items, such as tires, in outdoor urban areas has the potential to allow particles to be dislodged from the landscape, due to precipitation, and subsequently carried through stormwater runoff to nearby water bodies [7].
While MPs’ presence in aquatic environments has received considerable attention, their occurrence in sediment samples has gained recognition as a reservoir for MP accumulation [9,10,11]. Given the persistent nature of MPs, they tend to accumulate extensively within sediments, potentially increasing the ecological risks associated with their presence [12]. Consequently, there is a need to better understand MPs’ accumulation in sediments. Conducting ecological risk assessments and pollution source analyses of MPs are vital steps in effectively managing and controlling MP pollution in sedimentary environments [13,14].
MPs can be ingested or absorbed by various marine organisms and have the potential to bioaccumulate, particularly in higher-trophic-level organisms [15,16]. The effects of MPs depend on the organism and the size and type of particle [17], and can range from physical blockage, entanglement, and abrasion to the disruption of feeding and respiratory systems [18]. Long-term effects observed in laboratory studies include gene regulation changes, immune responses, behavioral alterations, and developmental abnormalities in fish and mussels [18]. By 2050, according to the most pessimistic projections, the quantity of MPs is expected to surpass that of fish, indicating a potentially significant impact on the environment [19].
The San Francisco Bay Area is a dynamic and highly urbanized coastal region renowned for its ecological diversity and economic significance. However, alongside its numerous benefits, this area also faces environmental challenges, including pollution from diverse sources. Among the emerging contaminants of concern, MPs have gained considerable attention and have been monitored in the surface water, fish, sediment, stormwater runoff, treated wastewater [6], and mussels [20]. Although multiple San Francisco Bay matrices have been subject to monitoring, there are still significant knowledge gaps in our understanding of the geographic and temporal trends in MP concentrations, particularly in the sediment. Addressing these knowledge gaps may inform and be used to evaluate the effectiveness of plastic mitigation strategies over time. Spatial and temporal information enables policymakers and environmental managers to develop targeted measures for reducing MPs pollution.
The aim of the present study was to investigate the concentrations, size, morphology, and chemical composition of MPs in sediment samples from the San Francisco Bay (hereinafter Bay). This study leveraged archived sediment samples from two different sampling events. First, archived surface grab samples that were collected from various locations within the Bay were analyzed to examine the spatial distribution patterns of MPs in the sediment in different sub-regions of the Bay. Second, archived sediment cores were analyzed to investigate the temporal distribution of MPs in Bay sediment for the first time.

2. Materials and Methods

2.1. Sampling of Microplastics and Sample Preparation

San Francisco Bay is situated between the Sacramento and San Joaquin rivers, to the north, and the Pacific Ocean, to the west, with more than 7 million inhabitants within its watershed. It serves as the drainage basin for approximately 40% of California [21]. Spanning across a varied terrain, the region consists of urban areas, agricultural landscapes, and recreational parks, as well as undeveloped areas [22]. The discharge of effluent from 42 wastewater treatment plants (WWTPs) may have an impact on its ecosystem [21]. For the purposes of this study, the different Bay sub-regions from which microplastics were analyzed are divided into four regions: Lower South Bay (LSB), South Bay, Central Bay (CB), and North Bay (NB) (Figure 1, Table S1).

2.2. Collection of Surface Sediment Grab Samples for Evaluating Geographic Distribution of Microplastics in Bay Sediment

Sediment samples from the Bay were collected during the summer of 2018 through the Regional Monitoring Program for Water Quality in San Francisco Bay, which implements a rigorous probabilistic study design for sediment sampling to gather an accurate representation of ambient sediment samples throughout the Bay for contaminant monitoring. From these archived sediments, a total of eight surface grab samples (n = 8) (Figure 1, blue sampling points; Figure S1) were selected for our MP sample analysis, with the selection distributed among the different regions as follows: LSB (n = 2), SB (n = 2), CB (n = 2), and NB (n = 2). The sediment sampling process involved utilizing a clean stainless steel scoop to collect samples from the center of a Van Veen grab, specifically avoiding the sides. Care was taken to collect only the uppermost layer of sediment, approximately 5 to 10 mm in depth, which was then carefully transferred to sample jars.

2.3. Collection of Sediment Core Samples for Evaluating Temporal Trends in Microplastics in Bay Sediment

Two sediment cores (Figure 1, red sampling points) were collected during the summer of 2020 in the South Bay subregion known as Steinberger Slough in order to evaluate sediment concentration profiles to provide information about temporal trends. This area is a complex of sloughs and channels and is a priority area for monitoring legacy contaminants, such as PCBs. One of the sediment core samples was collected at the outlet of Pulgas Creek (Core 1), and therefore most impacted by urban stormwater runoff, while the second core sample (Core 2) was 2666 m away and less directly influenced by Pulgas Creek discharges.
To process the collected sediment cores, a slicing technique was employed in the laboratory. Typically, cores are sectioned while frozen; however, this method was inconvenient for this study because of the plastic tubes in which the core samples were stored, as cutting could potentially introduce sample contamination. Hence, an alternative approach was adopted. The sediment core was extruded using a pre-cleaned customized tool made out of a plastic plug wrapped in aluminum, to avoid any cross-contamination, that had the same diameter as the tool.
Each sediment core was subsequently analyzed by dividing it into discrete sections of 5 cm. For Core 1, the total core length was 35 cm, resulting in seven prepared samples (n = 7): 0–5 cm, 5–10 cm, 10–15 cm, 15–20 cm, 20–25 cm, 25–30 cm, and 30–35 cm. Regarding Core 2, the total core length measured 33 cm, and three samples were prepared (n = 3): two surface samples (0–5 cm and 5–10 cm) and one bottom sample (28–33 cm). The bottom layer was divided into two samples and analyzed as a laboratory duplicate to ensure the reliability of the results. The bottom layer of Core 2 is identified as potentially predating the 1900s. Considering its age, this layer is not expected to contain a significant amount of MPs. Hence, it serves as a valuable reference sample for validating the methods employed in this study. Consequently, our analysis focused specifically on the bottom layer of Core 2 to validate the method employed.

2.4. Pretreatment Protocol

Prior to sample pretreatment and analysis, the total organic matter content was assessed following the Loss on Ignition (LOI) method, which involved heating the sediment sample in a muffle furnace (550–600 °C) to measure the weight lost due to the combustion of organic matter and to select the most suitable pretreatment method for MPs’ extraction. The total organic matter content was found to be below 1%. Therefore, a density separation step was conducted initially to eliminate inorganic matter from the sediment samples. Approximately 100 g of wet weight (ww) was analyzed from each sample. To account for moisture content, the humidity of each sample was determined by analyzing a 10 g aliquot. The total sample mass analyzed is provided in the Supplementary Materials (Table S2). The results are calculated based on the dry weight (dw) of the samples.
The following chemicals and materials were used for the MPs’ pretreatment: absolute ethanol (Scharlau, Barcelona, Spain, >99.9%), iron (II) sulfate heptahydrate (FeSO4·7H2O) (Thermo Scientific, Waltham, MA, USA, 98.0%), hydrogen peroxide (H2O2) (Thermo Scientific, 35.0%), PTFE- filter (Sartorius, Göttingen, Germany, 5 μm pore size), zinc chloride (ZnCl2) (Thermo Scientific, 98.0%), potassium hydroxide (KOH) (Thermo Scientific, 85.0%), chitinase (ASA Spezialenzyme GmbH, Wolfenbüttel, Germany), acetic acid (CH3COOH) (Sigma-Aldrich, 99.8%), and sodium acetate (NaC2H3O2) (Scharlau, 99.5%).
All sediment samples underwent pretreatment as part of the experimental protocol (Figure 2). The protocol for the MPs’ extraction was based on the nature and requirements of the samples. Considering the previous detection of high-density MPs in the Bay, such as tire wear particles [7], a density extraction method specifically designed to capture these particles was implemented using a ZnCl2 salt solution. The density was set to 1.9 g/cm3, based on the recommendations of the previous study, to ensure that all high-density MPs were effectively extracted and separated from the sample [23]. In order to eliminate natural organic matter from the sample, various established methods were employed, including advanced Fenton’s oxidation, alkaline digestion, and enzymatic digestion [10,24,25,26]. These techniques have been widely utilized in MPs research to effectively remove organic components and enhance the analysis of MPs.
To begin, each sample was homogenized and its mass was measured. An aliquot was then taken to determine the sample’s humidity. Density separation was conducted next, allowing for the separation of components. This separation process was carried out over a 24 h period. Following this, the supernatant was carefully separated into a new Erlenmeyer flask, and an additional ZnCl2 solution was introduced for a second round of separation. The extraction procedure was performed three times for each sample. The resulting supernatants were collected and sieved using stainless steel sieves with mesh sizes of 0.5 mm and 25 µm. This division allowed for the separation of particles into two fractions: particles larger than 0.5 mm and particles below 0.5 mm. To remove organic matter, advanced Fenton oxidation was employed (hydrogen peroxide and iron (II) sulfate heptahydrate). The portion retained by the sieves underwent filtration using vacuum filtration equipment and a 5 µm PTFE filter. The filtered samples were subjected to 10 min of agitation at 40 °C and left to react for 24 h. After 24 h, samples were filtered through a 5 µm PTFE filter, and alkaline digestion with KOH was performed next by immersing the filter in a solution for 24 h with 10 min of agitation. After this step, the sample was filtered once again using a 5 µm PTFE filter and placed in a clean Petri dish for further analysis.
A further density separation step was conducted using a sodium chloride solution with a density of 1.2 g/mL. This separation process was carried out over a 24 h period. The purpose of this second density separation was to divide the already concentrated MPs into two groups based on their density, thereby facilitating the quantification process. The final step of the protocol involved enzymatic digestion using a chitinase solution in an acetic buffer solution (pH = 5) at 40 °C and agitation. The reaction took place for 48 h and the solution was filtered through a 10 µm PTFE filter. Following this, visual inspection was carried out utilizing optical and stereoscopic microscopes to examine the MPs.

2.5. Quantitative and Qualitative Analysis of Microplastics

Following sample pretreatment, the particles were visually sorted and quantified utilizing advanced microscopy techniques. A LEICA MZ10 spectroscopic microscope equipped with a FLEXACAM C1 camera and an Olympus CX41 optical microscope were employed for this purpose. Suspected MPs were categorized into two size fractions: above and below 0.5 mm, and further classified into three predominant shape categories—films, fragments, and fibers [27,28,29].
Particle analysis below 0.5 mm was conducted on calcium fluoride slides using infrared (IR) mapping techniques (Supplementary data, Figure S3). A Thermo Scientific Nicolet™ iN™10, equipped with an MCT detector and a pixel aperture of 25 × 25 µm in transmission mode, was used. The IR spectra were obtained over a range of 715–4000 cm−1 with a spectral resolution of 4 cm−1, utilizing 4 scans. Particles larger than 0.5 mm were analyzed by infrared spectroscopy with a Perkin Elmer FrontierTM instrument equipped with an Attenuated Total Reflectance (ATR) accessory, a DTGS detector, a Glowbar source, a CsI beam splitter, and Spectrum 10TM software. Its IR spectra were obtained in the range of 230–4000 cm−1 with a spectral resolution of 4 cm−1, using 4 scans. The acquired spectra from both instruments were analyzed using OMNIC Specta MCS Software (v. 4.1). To identify the particles, an unknown-spectrum-matching approach was employed by comparing them with available databases such as the HR Nicolet Sampler Library, Hummel Polymer Sample Library, Polymer Laminate Films, Wizard Library, and Willey’s Know It All, as well as a custom library that was generated with more than 80 spectra. The standard criterion of a ≥70% match between the sample and reference spectra was followed.

2.6. Quality Assurance and Quality Control (QA/QC)

To ensure the integrity of the results and prevent cross-contamination, strict quality control measures were implemented in the present study. The laboratory environment was cleaned using a combination of 70% ethanol and MilliQ water. To minimize the risk of cross-contamination, laboratory personnel wore cotton laboratory coats exclusively. All equipment and tools used for sample processing were cleaned with 70% ethanol and MilliQ water. The study utilized analytical grade chemicals, and all reagents were prepared using MilliQ water. To verify the accuracy of the analysis, multiple blank samples were included as control measures. The total number of blank samples analyzed can be found in the Supplementary Materials (Table S3). MPs were detected in all of the blank samples. It is highly likely that airborne fibers were the source of this contamination, as they were observed in blank samples from both laboratories. The blank sample consisted of an open Petri dish that was placed in the hoods during the sample pretreatment process. The fiber deposition rates for the blank samples were determined to be 1.13 and 0.5 fibers/day/cm2 at the two laboratories in California and Spain, respectively. Subsequently, the appropriate corrections were applied to all the samples based on their exposure time.
Furthermore, a field blank was collected from the Lower South Bay, and, despite taking precautions to prevent cross-contamination at the sampling site, it revealed the presence of 2 fibers, 3 films, and 1 fragment. Given the isolated nature of this finding, the decision was made not to blank-correct the results based on this field blank. However, it underscores the importance of maintaining rigorous sampling protocols and ongoing monitoring for potential sources of contamination in future studies.
Additionally, a laboratory duplicate was analyzed for the bottom layer of the Core 2 sediment, and the coefficient of variation, calculated as a percentage, was found to be 24.22%. Recovery rate experiments were conducted in a previous study [30] for the extraction of MPs. The average recovery for triplicate samples was 75% for spiked MPs (fluorescent polyethylene (PE) microspheres, Cospheric innovations, CA, USA) with a diameter size of 53–63 μm, 74% for spiked MPs with a diameter size of 125–150 μm, 70% for particles with a diameter size of 250–300 μm, and 100% for particles with diameter sizes of 450–500 μm. These results indicate a satisfactory laboratory performance in terms of recovery rates.

3. Results

3.1. Occurrence of Microplastics in Surface Sediments of San Francisco Bay Area

MPs were identified in all sediment samples: 1582 and 2530 MPs in the core samples and surface sediment, respectively; however, their concentration exhibited significant variability across different sampling locations (Table 1). The detected MP concentrations in the surface sediments from the Bay ranged from 2.1 to 11.9 MPs/g dry weight (dw), with an average value of 6.2 MPs/g dw. The highest concentration was observed in the Lower South Bay, while the lowest concentration was found in the North Bay, near two river sites (the Sacramento River and San Joaquin). The higher concentrations of MPs observed in the Lower South Bay can be attributed to factors such as limited water flushing and the influence of wastewater and urban stormwater discharges [31]. Previous studies in the area have also highlighted elevated levels of various contaminants in sediments from the South and Lower South Bay, including pharmaceuticals [32], triclosan [33], perfluorooctane sulfonate [34], and specific alternative flame retardants [35].
Zhu et al. [6] also conducted a study on MP debris in sediment samples from the San Francisco Bay and their findings revealed similar MPs levels, ranging from 0.03 to 42.10 particles/g dw, with a mean concentration of 5.18 particles/g. Notably, the highest concentration on average was consistently observed in the Lower South Bay. Bayo et al. [36] reported the presence of MPs in coastal sediments near the harbor in Cartagena, Spain, with an average abundance of 0.02 items/g. The areas with the highest MP abundance were close to car roads and areas with beachgoer activity. Another study in Spain, by Expósito et al. [10], investigated marine sediments from the Western Mediterranean and found an MP mean abundance of 0.03 MPs/g. Bronzo et al. [37] found the occurrence of MPs in coastal sediments from the inner Oslofjord, Norway, with the MPs’ abundance ranging from 0.02 to 1.71 MPs/g. The highest abundance of MPs was observed near the input of sewage treatment plants and in areas with high human activities. Comparatively, our study demonstrates similar results as a previous MPs study of the sediment of the San Francisco Bay [6] and significantly higher MP concentrations than those reported in previous studies conducted worldwide [10,36,37]. It is noteworthy that a comparison between the studies should be approached with caution, since different studies are likely to employ diverse methodologies for their MPs analysis, such as variations in sampling techniques, sample processing procedures, and analytical instrumentation. These methodological differences can lead to differences in the quantification and identification of MPs, making direct comparisons challenging. Furthermore, sampling locations, hydrodynamic conditions, sediment characteristics, and local ecosystem dynamics can also impact the accumulation and distribution of MPs.
In the present study, our analysis categorized MPs into three distinct shapes: fibers, fragments, and films. Fibers were found to be the most prevalent morphology, accounting for over 60% of the MPs in all sediment samples. The size of the detected particles ranged from 25 µm to 5 mm, and the samples were further divided into size categories: those larger and smaller than 0.5 mm (Figure S2). Figure 3 showcases illustrative images of particles with various shapes, captured using a Leica FLEXACAM C1, IC90 E, ICC50 W/E camera.
Fibers derived from synthetic textiles have been identified as a significant source of MPs in the environment [38,39,40,41,42,43,44]. These fibrous MPs can be released into environment through various pathways. Airborne fibers, originating from textile shedding (e.g., during use or drying) can be transported to the Bay via stormwater or direct settling onto the water’s surface. Furthermore, the washing of synthetic textiles contributes to the presence of MPs in wastewater, as observed in studies conducted in different locations [38,39,41,45,46,47], and these potentially can be released into the environment through final effluent discharge and the application of biosolids to the land [48,49]. Additionally, fishing and other aquatic industries contribute to fiber pollution. The issue of fiber ball formation is also an important consideration, as it was observed in a sample from South Bay area and is commonly found in the marine environment. A previous case study conducted in Tarragona, Spain, also reported the presence of fiber balls at the sediment bottom, indicating that the primary mechanism for fiber ball formation is aggregation, and once they settle on the seafloor they are expected to continue fragmenting until reaching the nanoscale [10]. These synthetic fiber balls can distort the actual values of fibers and total MPs abundance, as they were counted as a single fiber item due to challenges in separating them and quantifying each individual fiber.
MP pellets were present in the sediment samples; however, their concentration was minimal compared to other morphology types like fibers, fragments, and films, accounting for less than 1%. Due to their low prevalence, they were not categorized separately, but their mention remains significant to draw attention to this specific MPs type. Previous research by Zhu et al. [6] has indicated their utilization in various applications such as personal care products, biomedical research, and water treatment and purification [50,51]. Additionally, it is noteworthy that US federal law implemented the Microbead-Free Waters Act (MFWA) in 2015, aimed at prohibiting the use of plastic microbeads in rinse-off personal care products to prevent their pollution in water bodies [52,53].
In various sediment samples, another prevalent MP fragment type was observed, characterized by a rubbery structure and black color. While our spectroscopic analysis did not definitively determine the chemical composition of these particles, secondary characteristics such as compression, color, and texture strongly suggest that they originate from tire wear. Furthermore, another characteristic that supports the tire components theory is that these particles were more prevalent in the denser fraction, based on visual inspection. Other studies have established a connection between tire wear and the presence of abundant rubber MPs in sediment samples [54]. Modeling studies further indicate that tire wear may rank among the primary sources of MPs globally [55,56]. A previous study of Bay Area stormwater found that nearly half the MPs entering the Bay from this pathway were tire wear particles [7]. Future studies should consider employing complementary techniques such as thermo-extraction desorption gas chromatography mass spectrometry (TED-GC-MS) and pyrolysis-GC-MS methods, which have successfully identified similar particles in previous investigations [57], to provide a more comprehensive understanding of the origins of these particles and their variations in the Bay. This will enable a more accurate assessment of the specific MP sources and potential environmental impacts associated with the different polymer types.

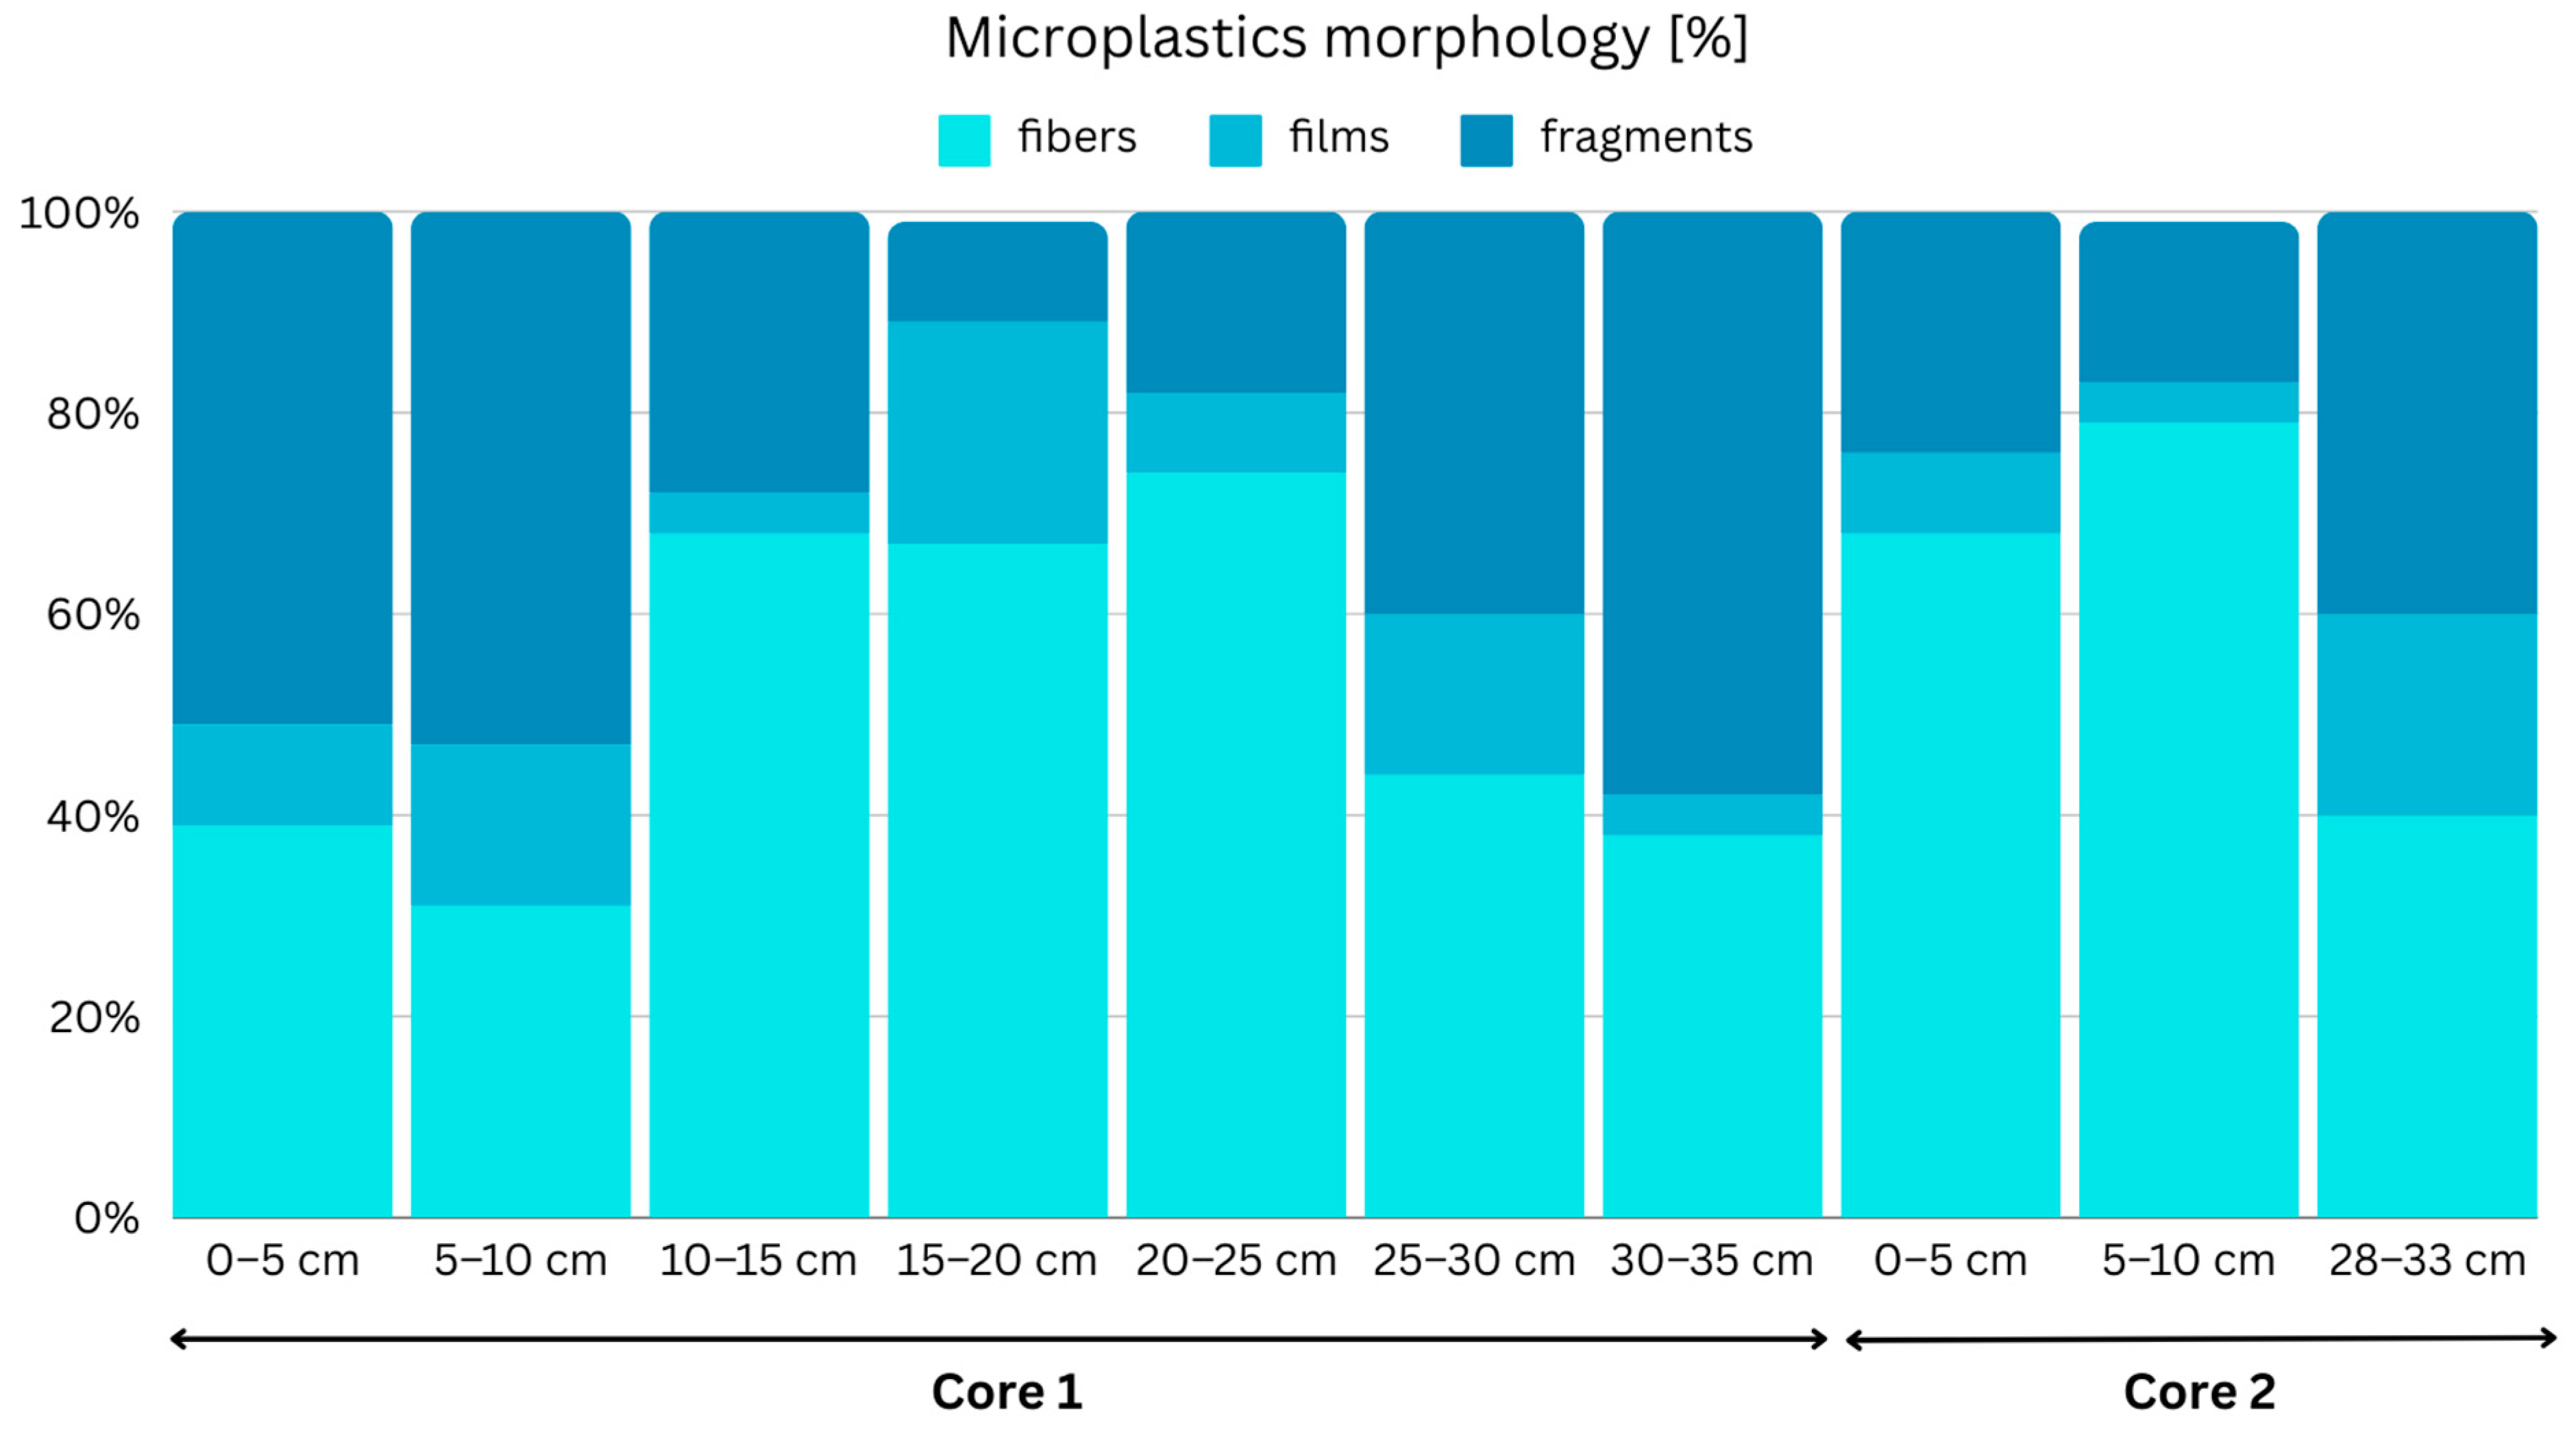
3.2. Microplastics’ Occurrence in Sediment Cores

MPs have been analyzed in sediment cores internationally. However, no previous sediment core MP studies have been conducted in the San Francisco Bay. An analysis of two sediment cores was conducted in the present study. Figure 4 shows the MP concentrations in Core 1 and Core 2. Based on rough estimations, the bottom of Core 2, at a depth of 28–33 cm, likely predates the 1900s. This bottom layer can serve as a reference to validate the methods employed in the present study, as MPs should not be present in significant quantities in the bottom layer unless there are mechanisms present such as bioturbation or other mixing processes that can transport MPs to the bottom or cause potential contamination issues.
MPs were found in all core layers; however, their concentration varied greatly depending on the core depth. An increasing trend was observed from the bottom to top layers, with the exception of two samples from Core 1 (15–20 cm and 20–25 cm) (Figure 4). This trend has also been observed in previous studies. In environments characterized by minimal disturbance (i.e., potential long-term sinks), there seems to be a consistent global pattern of decreasing MP concentrations as the sediment depth increases [58].
Although the hypothesis was that there would be an absence of MPs in the bottom layer of Core 2, based on temporal estimations, several MPs were found, with an average concentration of 0.9 MPs/g dw calculated from laboratory duplicates. Similar findings have been observed in different studies. The study conducted by Xue et al. [59] hypothesized that MPs would be present only up to a depth of 22 cm (corresponding to a deposit from 1933 CE). However, the results revealed MPs extending down to 60 cm (representing a deposit from 1897 CE), suggesting sediment reworking by local invertebrates as the likely cause for this unexpected occurrence. In a separate study by Turner et al. [60], MPs were detected as deep as 50 cm below sediment dating back to 1950 (45 cm versus 95 cm depth). These MP fibers, which were chemically identical to fibers found in more recent layers, provided evidence for the reworking of MPs within the sediment column. Remarkably, the presence of these fibers dating back to the mid-nineteenth century, decades before plastic production began, further supports the notion of the long-term reworking and accumulation of MPs in the sediments.
The surface layers of Core 1, located in the South Bay, exhibited higher MP concentrations compared to Core 2 from the Lower South Bay. This difference in findings can be attributed to the significant influence of Pulgas Creek discharge on sediment Core 1, whereas sediment Core 2 was situated in a comparatively more ambient environment in the Redwood Creek Marina.
In terms of the MPs’ morphology, fibers once again emerged as the predominant shape, followed by fragments and films (Figure 5). This is consistent with multiple other studies that also report that fibers consistently dominate MP compositions, constituting 100% of MPs in certain instances [61]. Similarly, in another study, fibrous MPs were found to be highly prevalent, accounting for over 98% of MPs within different layers of each sediment core [62,63]. However, in contrast to these findings, a relatively small fraction of MPs was identified as fibers (6.7%) in a study by Kukkola et al. [63], which deviates from the majority of the existing literature, where fibers have been recognized as the most common morphology of MPs in shelf environments. In fact, the overall median value reported across 16 studies suggests that fibers comprise approximately 64% of MPs [64]. Fibers emerged as the predominant morphology not only in sediment samples but also within organisms. For instance, in San Francisco Bay, resident mussels and clams displayed fibers as their most dominant morphology, constituting over 96% of all particles observed [20].

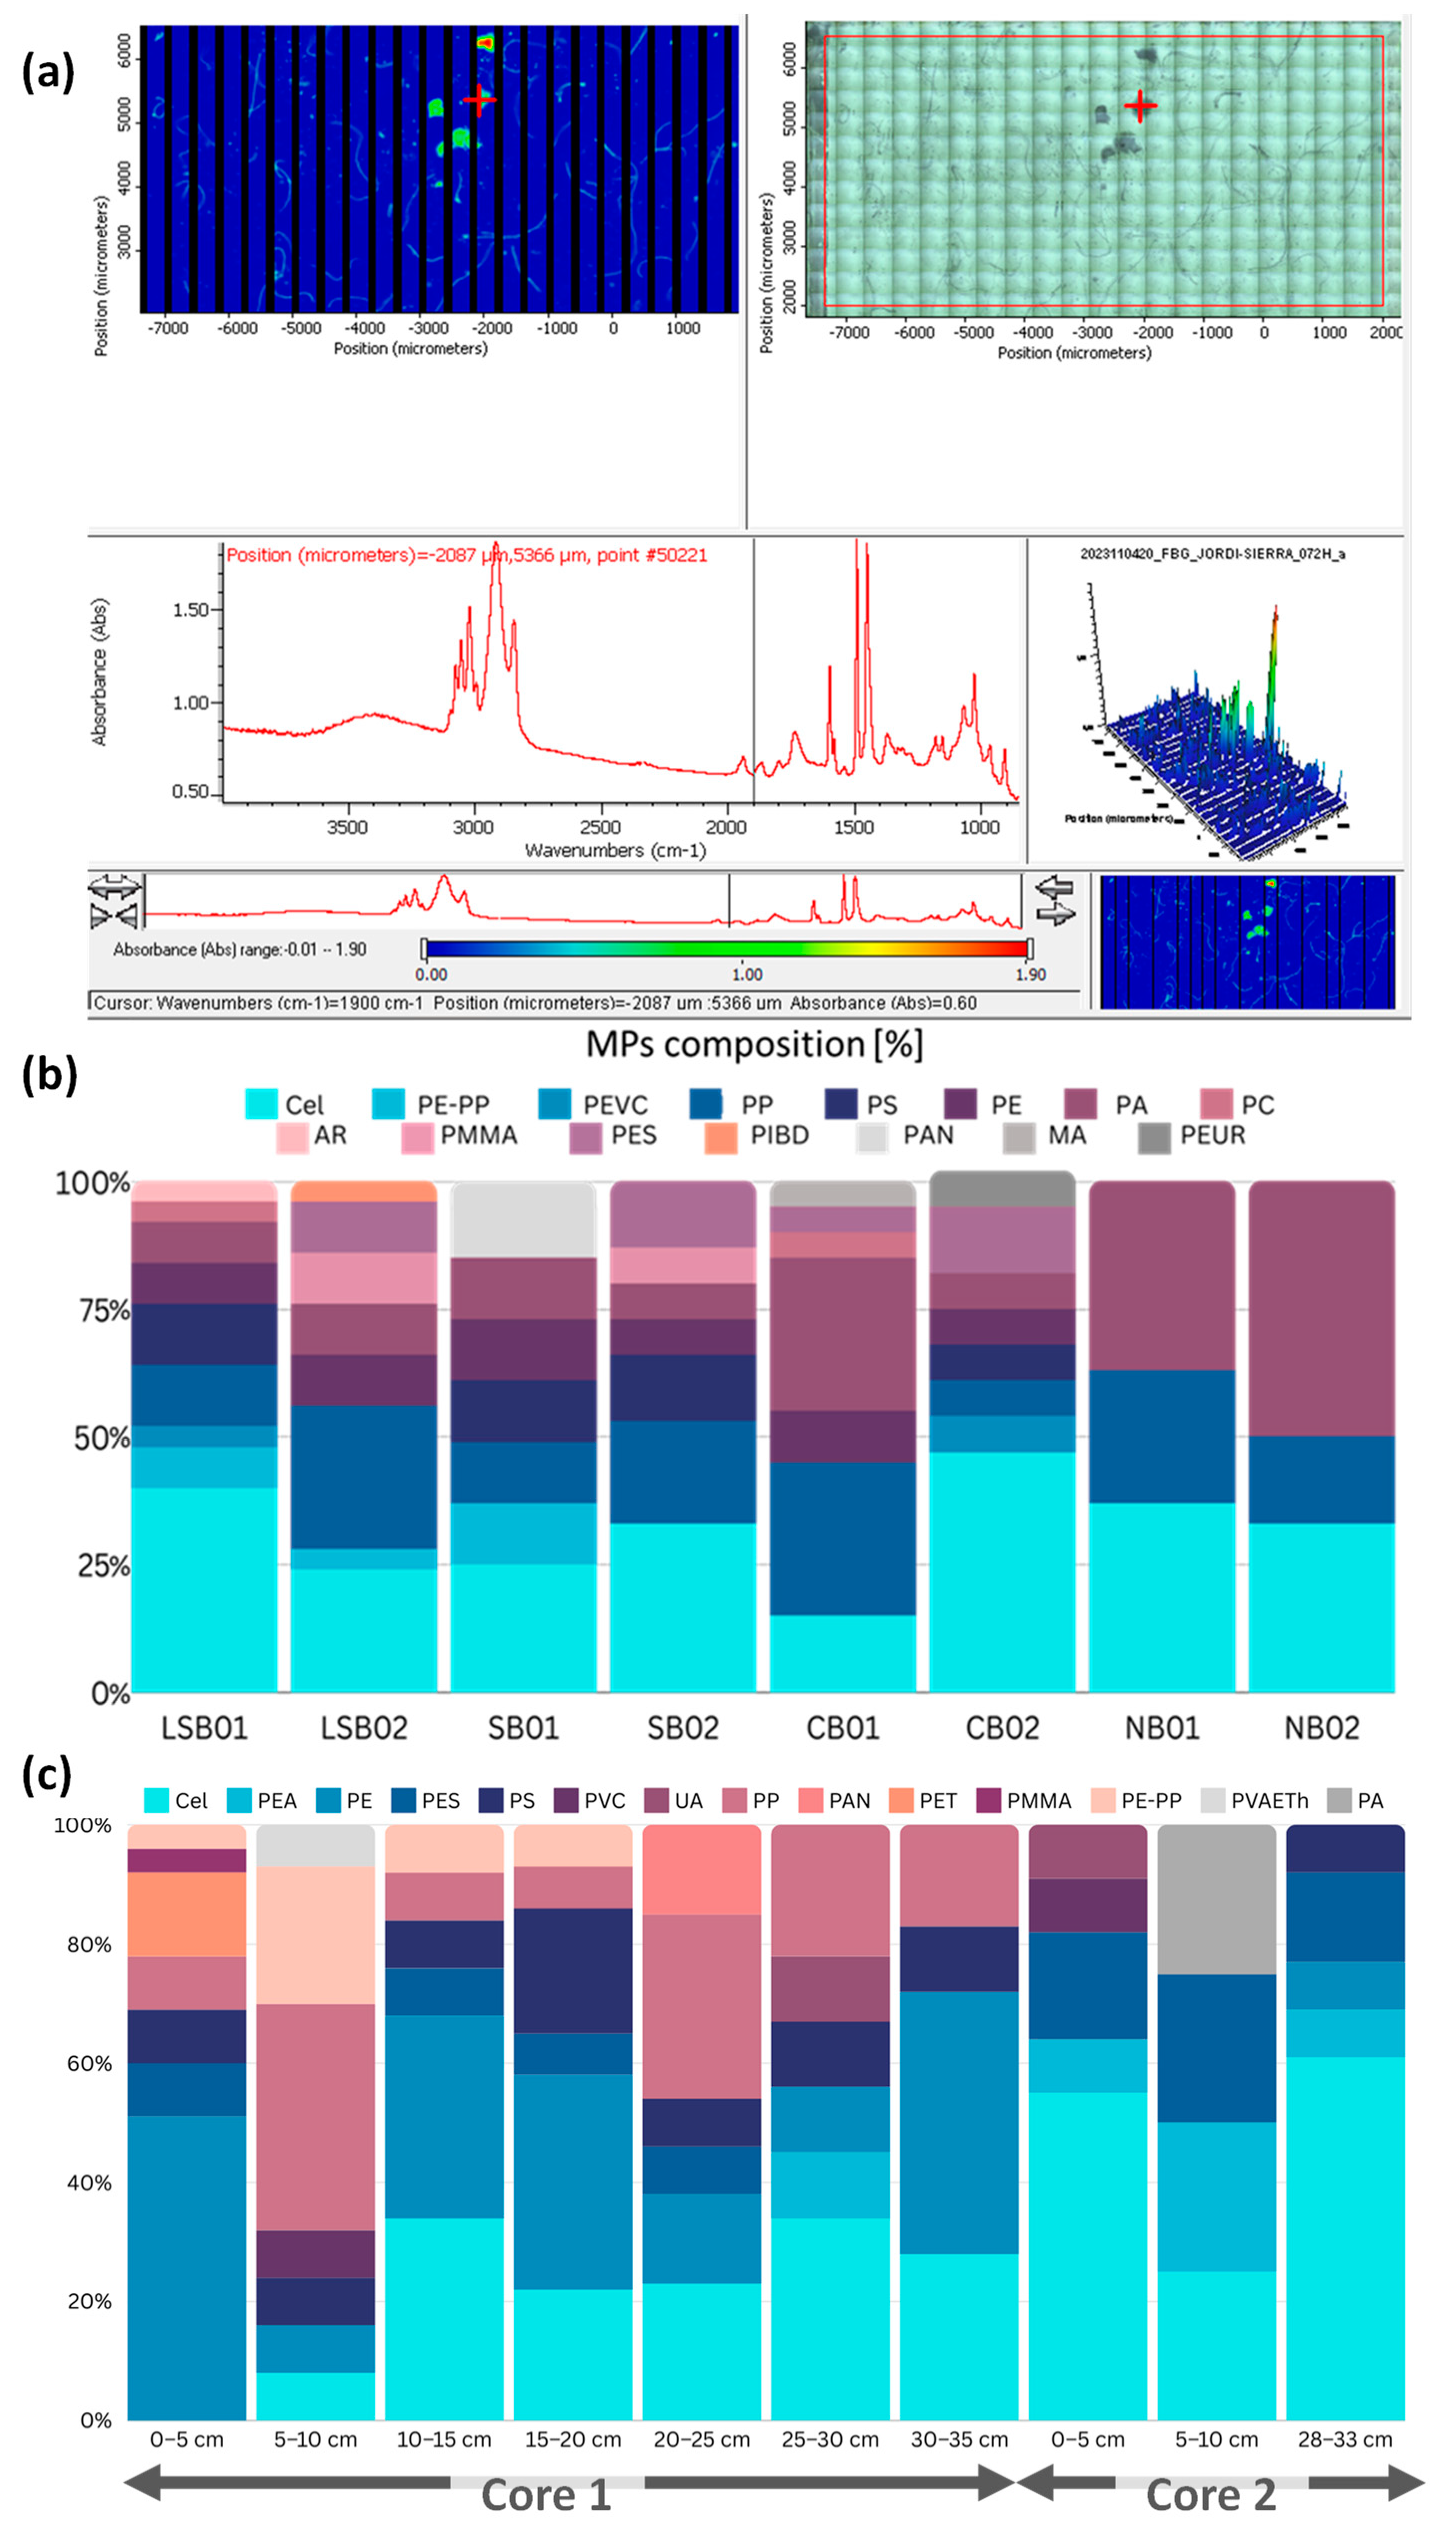
3.3. Polymer Composition of Microplastics Particles

The identification of MPs’ polymer type is crucial for understanding the sources and potential environmental impacts of these particles. For this purpose, in the present study, spectroscopic techniques were employed to analyze the polymer composition of the MPs found in the surface sediments of the Bay. A representative subsample of (250 individual MPs), taking into account different morphologies, colors, and sizes, was extracted for chemical composition analysis, comprising 119 MPs from surface grab samples and 131 MPs from the cores. A successful performance in distinguishing between MPs and other materials was evident as only three particles from the surface grab samples and two particles from the cores were not identified as plastic. Particles were extracted on calcium fluoride slides for an FTIR mapping analysis and total of 19 different polymers were detected (Figure 6 and Figure S4).
For the surface sediment samples, among the analyzed MPs, synthetic cellulose, polypropylene (PP), polystyrene (PS), polyethylene (PE), poly (propylene-ethylene) copolymer (PE-PP), polyamide (PA), and polyester (PES) were identified as the most prevalent polymers. The prevalence of these polymers varied among the samples, with synthetic cellulose ranging from 15 to 47%, PP from 7 to 28%, PS from 0 to 13%, PE from 0 to 12%, PE-PP from 0 to 12%, PA from 7 to 50%, and PES ranging from 0 to 13%.
The core sediment analysis revealed varying proportions of different polymer types, with synthetic cellulose (8–61%), polyethylene acrylate (PEA) (9–25%), PE (8–50%), PS (8–21%), PP (7–38%), and PE-PP (4–23%) emerging as the predominant polymers. As noted previously, tire wear particles are not readily identifiable via spectroscopy, preventing confirmation of the black, rubbery fragments as being derived from tires [65].
An effective strategy for mitigating MP pollution in the environment is to control the release of plastic waste from potential sources of the pollution, thus emphasizing the need to identify the sources of the MPs in sediment [66,67]. Several studies have contributed to the development of MP pollution source analysis systems. These studies highlight the potential of using MPs’ characteristics, such as color, shape, polymer type, and land-use patterns, to trace the pollution source in sediments [68,69,70,71]. A study conducted by Tampang and Viswanathan [68] investigated the main pollution sources of the MPs in sediments from the Miri coast in NW Borneo. Their findings revealed that textiles, food packaging, and plastic containers were the primary sources of PET, PS, and PE MPs, respectively. Wang et al. [71] proposed an analysis system based on the relationship between MP types and their pollution sources reported in previous studies. Wang et al. [70] assessed different polymer types of MPs based on their physical and chemical properties and daily applications, linking them to potential pollution sources. Sambandam et al. [69] analyzed the relationship between polymer types and MP pollution sources in terrestrial and marine environments.
In the present study, we attempted to infer the potential sources of MP pollution, based on previous research. Source identification was based on the consideration of various factors such as morphology, size, and polymer type. These considerations enabled us to identify a list of potential sources of MP pollution, which is presented in Table 2.

4. Conclusions

The study of microplastics (MPs) in marine sediments within the San Francisco Bay Area provides a thorough insight into the distribution, sources, and morphology of the MPs in this highly urbanized and polluted environment. This comprehensive investigation reveals the widespread contamination of microplastics in this urban coastal setting. Variations in concentration observed across different locations and sediment depths highlight the dynamic nature of microplastic distribution. The presence of various microplastic shapes, including fibers, fragments, and films, suggests diverse sources contributing to their pollution. The abundance of fibers, particularly those from synthetic textiles, in both sediments and organisms underscores the necessity for strict control measures throughout the products’ lifecycle. Moreover, the identification of tire wear particles as a significant contributor emphasizes the role of transportation-related activities in microplastic pollution. The persistence of microplastics, even in deep sediment layers, underscores the long-term impacts of pollution and highlights the importance of comprehensive mitigation strategies. This study not only enhances our understanding of microplastic pollution in urban coastal areas but also underscores the urgent need for sustained monitoring and strategic interventions to mitigate its ecological impact.

Supplementary Materials

The following supporting information can be downloaded at https://www.mdpi.com/article/10.3390/environments11050103/s1, Figure S1: Sediment sampling; Figure S2: Microplastics size distribution in surface sediments; Figure S3: FTIR maps for microplastic identification; Figure S4: OMNIC Specta MCS Software for microplastics identification. Table S1: MPs sampling points; Table S2: Total mass analyzed per sample; Table S3: Cross-contamination.

Author Contributions

Conceptualization, L.D.; methodology, N.E.; software, J.S.; formal analysis, L.D.; investigation, L.D.; writing—original draft preparation, L.D.; writing—review and editing, J.R., D.L., J.-S.P., S.G., N.E., M.S. and J.S.; visualization, L.D., J.R.; supervision, J.R., D.L., J.-S.P., S.G., M.S. and J.S. All authors have read and agreed to the published version of the manuscript.

Funding

This research received no external funding. L. Dronjak was granted a the predoctoral fellowship “Martí i Franquès” (2019-PMF-PIPF-80). J. Rovira was supported by a Miguel Servet contract (CP22/00062) funded by Instituto de Salud Carlos III (ISCIII) and cofounded by Fondo Social Europeo Plus (FSE+).

Data Availability Statement

The raw data supporting the conclusions of this article will be made available by the authors on request.

Acknowledgments

The authors extend their gratitude to Pilar Hermo from the Scientific and Technological Centers of the University of Barcelona for creating the IR maps. Additionally, special thanks are extended to DTSC members Robert Ramage and Wayne Halozan for their invaluable support in facilitating the laboratory setup, which made a significant contribution to the overall quality and successful completion of this work. We extend our gratitude to Yeo-Myoung Cho of Stanford University for the sediment core image and to Don Yee from the San Francisco Estuary Institute (SFEI) for the sampling photos.

Conflicts of Interest

The authors declare no conflicts of interest.

References

  1. Rochman, C.M.; Brookson, C.; Bikker, J.; Djuric, N.; Earn, A.; Bucci, K.; Athey, S.; Huntington, A.; McIlwraith, H.; Munno, K.; et al. Rethinking microplastics as a diverse contaminant suite. Environ. Toxicol. Chem. 2019, 38, 703–711. [Google Scholar] [CrossRef] [PubMed]
  2. Hartmann, N.B.; Hüffer, T.; Thompson, R.C.; Hassellöv, M.; Verschoor, A.; Daugaard, A.E.; Rist, S.; Karlsson, T.; Brennholt, N.; Cole, M.; et al. Response to the Letter to the Editor Regarding Our Feature ‘are We Speaking the Same Language? Recommendations for a Definition and Categorization Framework for Plastic Debris’. Environ. Sci. Technol. 2019, 53, 4678–4679. [Google Scholar] [CrossRef]
  3. Morgado, V.; Palma, C.; da Silva, R.J.B. Determination of microplastic contamination levels and trends in vast oceanic sediment areas with uncertainty. Sci. Total Environ. 2023, 884, 163612. [Google Scholar] [CrossRef] [PubMed]
  4. Dris, R.; Gasperi, J.; Saad, M.; Mirande, C.; Tassin, B. Synthetic fibers in atmospheric fallout: A source of microplastics in the environment? Mar. Pollut. Bull. 2016, 104, 290–293. [Google Scholar] [CrossRef]
  5. Ziajahromi, S.; Neale, P.A.; Rintoul, L.; Leusch, F.D.L. Wastewater treatment plants as a pathway for microplastics: Development of a new approach to sample wastewater-based microplastics. Water Res. 2017, 112, 93–99. [Google Scholar] [CrossRef] [PubMed]
  6. Zhu, X.; Munno, K.; Grbic, J.; Werbowski, L.M.; Bikker, J.; Ho, A.; Guo, E.; Sedlak, M.; Sutton, R.; Box, C.; et al. Holistic Assessment of Microplastics and Other Anthropogenic Microdebris in an Urban Bay Sheds Light on Their Sources and Fate. ACS EST Water 2021, 1, 1401–1410. [Google Scholar] [CrossRef]
  7. Werbowski, L.M.; Gilbreath, A.N.; Munno, K.; Zhu, X.; Grbic, J.; Wu, T.; Sutton, R.; Sedlak, M.D.; Deshpande, A.D.; Rochman, C.M. Urban Stormwater Runoff: A Major Pathway for Anthropogenic Particles, Black Rubbery Fragments, and Other Types of Microplastics to Urban Receiving Waters. ACS EST Water 2021, 1, 1420–1428. [Google Scholar] [CrossRef]
  8. Horton, A.A.; Dixon, S.J. Microplastics: An introduction to environmental transport processes. Wiley Interdiscip. Rev. Water 2018, 5, e1268. [Google Scholar] [CrossRef]
  9. Eo, S.; Hong, S.H.; Song, Y.K.; Han, G.M.; Seo, S.; Shim, W.J. Prevalence of small high-density microplastics in the continental shelf and deep sea waters of East Asia. Water Res. 2021, 200, 117238. [Google Scholar] [CrossRef]
  10. Exposito, N.; Rovira, J.; Sierra, J.; Folch, J.; Schuhmacher, M. Microplastics levels, size, morphology and composition in marine water, sediments and sand beaches. Case study of Tarragona coast (western Mediterranean). Sci. Total Environ. 2021, 786, 147453. [Google Scholar] [CrossRef]
  11. Goswami, P.; Vinithkumar, N.V.; Dharani, G. Microplastics particles in seafloor sediments along the Arabian Sea and the Andaman Sea continental shelves: First insight on the occurrence, identification, and characterization. Mar. Pollut. Bull. 2021, 167, 112311. [Google Scholar] [CrossRef] [PubMed]
  12. Niu, L.; Li, Y.; Li, Y.; Hu, Q.; Wang, C.; Hu, J.; Zhang, W.; Wang, L.; Zhang, C.; Zhang, H. New insights into the vertical distribution and microbial degradation of microplastics in urban river sediments. Water Res. 2021, 188, 116449. [Google Scholar] [CrossRef] [PubMed]
  13. Al Nahian, S.; Rakib, R.J.; Haider, S.M.B.; Kumar, R.; Mohsen, M.; Sharma, P.; Khandaker, M.U. Occurrence, spatial distribution, and risk assessment of microplastics in surface water and sediments of Saint Martin Island in the Bay of Bengal. Mar. Pollut. Bull. 2022, 179, 113720. [Google Scholar] [CrossRef] [PubMed]
  14. Deme, G.G.; Ewusi-Mensah, D.; Olagbaju, O.A.; Okeke, E.S.; Okoye, C.O.; Odii, E.C.; Ejeromedoghene, O.; Igun, E.; Onyekwere, J.O.; Oderinde, O.K.; et al. Macro problems from microplastics: Toward a sustainable policy framework for managing microplastic waste in Africa. Sci. Total Environ. 2022, 804, 150170. [Google Scholar] [CrossRef] [PubMed]
  15. Capillo, G.; Savoca, S.; Panarello, G.; Mancuso, M.; Branca, C.; Romano, V.; D’Angelo, G.; Bottari, T.; Spano, N. Quali-quantitative analysis of plastics and synthetic microfibers found in demersal species from Southern Tyrrhenian Sea (Central Mediterranean). Mar. Pollut. Bull. 2020, 150, 110596. [Google Scholar] [CrossRef]
  16. Prokic, M.D.; Radovanovic, T.B.; Gavric, J.P.; Faggio, C. Ecotoxicological effects of microplastics: Examination of biomarkers, current state and future perspectives. TrAC—Trends Anal. Chem. 2019, 111, 37–46. [Google Scholar] [CrossRef]
  17. Hampton, L.M.T.; Brander, S.M.; Coffin, S.; Cole, M.; Hermabessiere, L.; Koelmans, A.A.; Rochman, C.M. Characterizing microplastic hazards: Which concentration metrics and particle characteristics are most informative for understanding toxicity in aquatic organisms? Microplast. Nanoplast. 2022, 2, 20. [Google Scholar] [CrossRef]
  18. Exposito, N.; Rovira, J.; Sierra, J.; Gimenez, G.; Dominga, J.L.; Schuhmacher, M. Levels of microplastics and their characteristics in molluscs from North-West Mediterranean Sea: Human intake. Mar. Pollut. Bull. 2022, 181, 113843. [Google Scholar] [CrossRef] [PubMed]
  19. Ellen MacArthur Foundation. The New Plastics Economy: Rethinking the future of plastics. Ellen MacArthur Found. 2016, 36, 1–120. [Google Scholar]
  20. Klasios, N.; De Frond, H.; Miller, E.; Sedlak, M.; Rochman, C.M. Microplastics and other anthropogenic particles are prevalent in mussels from San Francisco Bay, and show no correlation with PAHs. Environ. Pollut. 2021, 271, 116260. [Google Scholar] [CrossRef]
  21. Sutton, R.; Mason, S.A.; Stanek, S.K.; Willis-Norton, E.; Wren, I.F.; Box, C. Microplastic contamination in the San Francisco Bay, California, USA. Mar. Pollut. Bull. 2016, 109, 230–235. [Google Scholar] [CrossRef] [PubMed]
  22. Sedlak, M.; Sutton, R.; Box, C.; Sun, J.; Lin, D. Sampling and Analysis Plan for Microplastic Monitoring in San Francisco Bay and Adjacent National Marine Sanctuaries FINAL. Mar. Pollut. Bull. 2017, 109, 230–235. [Google Scholar]
  23. Klöckner, P.; Reemtsma, T.; Eisentraut, P.; Braun, U.; Ruhl, A.S.; Wagner, S. Tire and road wear particles in road environment—Quantification and assessment of particle dynamics by Zn determination after density separation. Chemosphere 2019, 222, 714–721. [Google Scholar] [CrossRef]
  24. Kühn, S.; van Werven, B.; van Oyen, A.; Meijboom, A.; Rebolledo, E.L.B.; van Franeker, J.A. The use of potassium hydroxide (KOH) solution as a suitable approach to isolate plastics ingested by marine organisms. Mar. Pollut. Bull. 2017, 115, 86–90. [Google Scholar] [CrossRef] [PubMed]
  25. Löder, M.G.J.; Imhof, H.K.; Ladehoff, M.; Löschel, L.A.; Lorenz, C.; Mintenig, S.; Piehl, S.; Primpke, S.; Schrank, I.; Laforsch, C.; et al. Enzymatic Purification of Microplastics in Environmental Samples. Environ. Sci. Technol. 2017, 51, 14283–14292. [Google Scholar] [CrossRef] [PubMed]
  26. Masura, J.; Baker, J.; Foster, G.; Arthur, C. Laboratory methods for the analysis of microplastics in themarine environment: Recommendations for quantifying synthetic particles in waters and sediments. NOAA Technical Memorandum NOS-OR&R-48. NOAA Tech. Memo. 2015, 1–33. Available online: https://repository.library.noaa.gov/view/noaa/10296 (accessed on 8 May 2024).
  27. Bayo, J.; Olmos, S.; López-Castellanos, J. Microplastics in an urban wastewater treatment plant: The influence of physicochemical parameters and environmental factors. Chemosphere 2020, 238, 124593. [Google Scholar] [CrossRef] [PubMed]
  28. Hidayaturrahman, H.; Lee, T.-G. A study on characteristics of microplastic in wastewater of South Korea: Identification, quantification, and fate of microplastics during treatment process. Mar. Pollut. Bull. 2019, 146, 696–702. [Google Scholar] [CrossRef] [PubMed]
  29. Lares, M.; Ncibi, M.C.; Sillanpää, M.; Sillanpää, M. Occurrence, identification and removal of microplastic particles and fibers in conventional activated sludge process and advanced MBR technology. Water Res. 2018, 133, 236–246. [Google Scholar] [CrossRef] [PubMed]
  30. Dronjak, L.; Exposito, N.; Sierra, J.; Schuhmacher, M.; Florencio, K.; Corzo, B.; Rovira, J. Tracing the fate of microplastic in wastewater treatment plant: A multi-stage analysis of treatment units and sludge. Environ. Pollut. 2023, 333, 122072. [Google Scholar] [CrossRef]
  31. Smith, S.V.; Hollibaugh, J.T. Water, salt, and nutrient exchanges in San Francisco Bay. Limnol. Oceanogr. 2006, 51, 504–517. [Google Scholar] [CrossRef]
  32. Klosterhaus, S.L.; Grace, R.; Hamilton, M.C.; Yee, D. Method validation and reconnaissance of pharmaceuticals, personal care products, and alkylphenols in surface waters, sediments, and mussels in an urban estuary. Environ. Int. 2013, 54, 92–99. [Google Scholar] [CrossRef]
  33. Kerrigan, J.F.; Engstrom, D.R.; Yee, D.; Sueper, C.; Erickson, P.R.; Grandbois, M.; McNeill, K.; Arnold, W.A. Quantification of hydroxylated polybrominated diphenyl ethers (OH-BDEs), triclosan, and related compounds in freshwater and coastal systems. PLoS ONE 2015, 10, e0138805. [Google Scholar] [CrossRef]
  34. Sedlak, M.D.; Benskin, J.P.; Wong, A.; Grace, R.; Greig, D.J. Per- and polyfluoroalkyl substances (PFASs) in San Francisco Bay wildlife: Temporal trends, exposure pathways, and notable presence of precursor compounds. Chemosphere 2017, 185, 1217–1226. [Google Scholar] [CrossRef]
  35. Sutton, R.; Chen, D.; Sun, J.; Greig, D.J.; Wu, Y. Characterization of brominated, chlorinated, and phosphate flame retardants in San Francisco Bay, an urban estuary. Sci. Total Environ. 2019, 652, 212–223. [Google Scholar] [CrossRef]
  36. Bayo, J.; Rojo, D.; Olmos, S. Weathering indices of microplastics along marine and coastal sediments from the harbor of Cartagena (Spain) and its adjoining urban beach. Mar. Pollut. Bull. 2022, 178, 113647. [Google Scholar] [CrossRef]
  37. Bronzo, L.; Lusher, A.L.; Schøyen, M.; Morigi, C. Accumulation and distribution of microplastics in coastal sediments from the inner Oslofjord, Norway. Mar. Pollut. Bull. 2021, 173, 113076. [Google Scholar] [CrossRef]
  38. Browne, M.A.; Crump, P.; Niven, S.J.; Teuten, E.; Tonkin, A.; Galloway, T.; Thompson, R. Accumulation of microplastic on shorelines woldwide: Sources and sinks. Environ. Sci. Technol. 2011, 45, 9175–9179. [Google Scholar] [CrossRef]
  39. Almroth, B.M.C.; Åström, L.; Roslund, S.; Petersson, H.; Johansson, M.; Persson, N.K. Quantifying shedding of synthetic fibers from textiles; a source of microplastics released into the environment. Environ. Sci. Pollut. Res. 2018, 25, 1191–1199. [Google Scholar] [CrossRef]
  40. Henry, B.; Laitala, K.; Klepp, I.G. Microfibres from apparel and home textiles: Prospects for including microplastics in environmental sustainability assessment. Sci. Total Environ. 2019, 652, 483–494. [Google Scholar] [CrossRef]
  41. Hernandez, E.; Nowack, B.; Mitrano, D.M. Polyester Textiles as a Source of Microplastics from Households: A Mechanistic Study to Understand Microfiber Release during Washing. Environ. Sci. Technol. 2017, 51, 7036–7046. [Google Scholar] [CrossRef]
  42. McIlwraith, H.K.; Lin, J.; Erdle, L.M.; Mallos, N.; Diamond, M.L.; Rochman, C.M. Capturing microfibers—marketed technologies reduce microfiber emissions from washing machines. Mar. Pollut. Bull. 2019, 139, 40–45. [Google Scholar] [CrossRef]
  43. Bomgardner, M.M. The great lint migration. CEN Glob. Enterp. 2017, 95, 16–17. [Google Scholar] [CrossRef]
  44. Pirc, U.; Vidmar, M.; Mozer, A.; Kržan, A. Emissions of microplastic fibers from microfiber fleece during domestic washing. Environ. Sci. Pollut. Res. 2016, 23, 22206–22211. [Google Scholar] [CrossRef]
  45. Mintenig, S.; Int-Veen, I.; Löder, M.; Primpke, S.; Gerdts, G. Identification of microplastic in effluents of waste water treatment plants using focal plane array-based micro-Fourier-transform infrared imaging. Water Res. 2017, 108, 365–372. [Google Scholar] [CrossRef]
  46. Murphy, F.; Ewins, C.; Carbonnier, F.; Quinn, B. Wastewater Treatment Works (WwTW) as a Source of Microplastics in the Aquatic Environment. Environ. Sci. Technol. 2016, 50, 5800–5808. [Google Scholar] [CrossRef]
  47. Wolff, S.; Kerpen, J.; Prediger, J.; Barkmann, L.; Müller, L. Determination of the microplastics emission in the effluent of a municipal waste water treatment plant using Raman microspectroscopy. Water Res. X 2019, 2, 100014. [Google Scholar] [CrossRef]
  48. Nizzetto, L.; Bussi, G.; Futter, M.N.; Butterfield, D.; Whitehead, P.G. A theoretical assessment of microplastic transport in river catchments and their retention by soils and river sediments. Env. Sci. Process Impacts 2016, 18, 1050–1059. [Google Scholar] [CrossRef]
  49. Zubris, K.A.V.; Richards, B.K. Synthetic fibers as an indicator of land application of sludge. Environ. Pollut. 2005, 138, 201–211. [Google Scholar] [CrossRef]
  50. Ballent, A.; Corcoran, P.L.; Madden, O.; Helm, P.A.; Longstaffe, F.J. Sources and sinks of microplastics in Canadian Lake Ontario nearshore, tributary and beach sediments. Mar. Pollut. Bull. 2016, 110, 383–395. [Google Scholar] [CrossRef]
  51. Mani, T.; Blarer, P.; Storck, F.R.; Pittroff, M.; Wernicke, T.; Burkhardt-Holm, P. Repeated detection of polystyrene microbeads in the lower Rhine River. Environ. Pollut. 2019, 245, 634–641. [Google Scholar] [CrossRef]
  52. FDA. The Microbead-Free Waters Act: FAQs|FDA; U.S Food and Drug Administration: Silver Spring, MD, USA, 2015. [Google Scholar]
  53. McDevitt, J.P.; Criddle, C.S.; Morse, M.; Hale, R.C.; Bott, C.B.; Rochman, C.M. Addressing the Issue of Microplastics in the Wake of the Microbead-Free Waters Act—A New Standard Can Facilitate Improved Policy. Environ. Sci. Technol. 2017, 51, 6611–6617. [Google Scholar] [CrossRef]
  54. Gray, A.D.; Wertz, H.; Leads, R.R.; Weinstein, J.E. Microplastic in two South Carolina Estuaries: Occurrence, distribution, and composition. Mar. Pollut. Bull. 2018, 128, 223–233. [Google Scholar] [CrossRef]
  55. Boucher, J.; Friot, D. Primary Microplastics in the Oceans: A Global Evaluation of Sources; IUCN: Gland, Switzerland, 2017. [Google Scholar] [CrossRef]
  56. Jan Kole, P.; Löhr, A.J.; Van Belleghem, F.G.A.J.; Ragas, A.M.J. Wear and tear of tyres: A stealthy source of microplastics in the environment. Int. J. Environ. Res. Public Health 2017, 14, 1265. [Google Scholar] [CrossRef]
  57. Eisentraut, P.; Dümichen, E.; Ruhl, A.S.; Jekel, M.; Albrecht, M.; Gehde, M.; Braun, U. Two Birds with One Stone—Fast and Simultaneous Analysis of Microplastics: Microparticles Derived from Thermoplastics and Tire Wear. Environ. Sci. Technol. Lett. 2018, 5, 608–613. [Google Scholar] [CrossRef]
  58. Martin, J.; Lusher, A.L.; Nixon, F.C. A review of the use of microplastics in reconstructing dated sedimentary archives. Sci. Total Environ. 2022, 806, 150818. [Google Scholar] [CrossRef]
  59. Xue, B.; Zhang, L.; Li, R.; Wang, Y.; Guo, J.; Yu, K.; Wang, S. Underestimated Microplastic Pollution Derived from Fishery Activities and ‘Hidden’ in Deep Sediment. Environ. Sci. Technol. 2020, 54, 2210–2217. [Google Scholar] [CrossRef]
  60. Turner, S.; Horton, A.A.; Rose, N.L.; Hall, C. A temporal sediment record of microplastics in an urban lake, London, UK. J. Paleolimnol. 2019, 61, 449–462. [Google Scholar] [CrossRef]
  61. Dong, M.; Luo, Z.; Jiang, Q.; Xing, X.; Zhang, Q.; Sun, Y. The rapid increases in microplastics in urban lake sediments. Sci. Rep. 2020, 10, 848. [Google Scholar] [CrossRef]
  62. Pervez, R.; Wang, Y.H. Microplastic distribution within core sediments of beach and its responses to anthropogenic activities. Mar. Pollut. Bull. 2022, 174, 113256. [Google Scholar] [CrossRef]
  63. Kukkola, A.; Senior, G.; Maes, T.; Silburn, B.; Bakir, A.; Kröger, S.; Mayes, A. A large-scale study of microplastic abundance in sediment cores from the UK continental shelf and slope. Mar. Pollut. Bull. 2022, 178, 113554. [Google Scholar] [CrossRef] [PubMed]
  64. Harris, P.T. The fate of microplastic in marine sedimentary environments: A review and synthesis. Mar. Pollut. Bull. 2020, 158, 111398. [Google Scholar] [CrossRef]
  65. Baensch-Baltruschat, B.; Kocher, B.; Stock, F.; Reifferscheid, G. Tyre and road wear particles (TRWP)—A review of generation, properties, emissions, human health risk, ecotoxicity, and fate in the environment. Sci. Total Environ. 2020, 733. [Google Scholar] [CrossRef]
  66. Sarkar, B.; Dissanayake, P.D.; Bolan, N.S.; Dar, J.Y.; Kumar, M.; Haque, N.; Mukhopadhyay, R.; Ramanayaka, S.; Biswas, J.K.; Tsang, D.C.; et al. Challenges and opportunities in sustainable management of microplastics and nanoplastics in the environment. Environ. Res. 2022, 207, 112179. [Google Scholar] [CrossRef]
  67. Yu, J.; Ma, X. Exploring the management policy of marine microplastic litter in China: Overview, challenges and prospects. Sustain. Prod Consum. 2022, 32, 607–618. [Google Scholar] [CrossRef]
  68. Tampang, A.M.A.A.; Viswanathan, P.M. Occurrence, distribution and sources of microplastics in beach sediments of Miri coast, NW Borneo. Chemosphere 2022, 305, 135368. [Google Scholar] [CrossRef]
  69. Sambandam, M.; Dhineka, K.; Sivadas, S.K.; Kaviarasan, T.; Begum, M.; Hoehn, D.; Sivyer, D.; Mishra, P.; Murthy, M.R. Occurrence, characterization, and source delineation of microplastics in the coastal waters and shelf sediments of the central east coast of India, Bay of Bengal. Chemosphere 2022, 303, 135135. [Google Scholar] [CrossRef]
  70. Wang, C.; Zhao, J.; Xing, B. Environmental source, fate, and toxicity of microplastics. J. Hazard. Mater. 2021, 407, 124357. [Google Scholar] [CrossRef]
  71. Wang, J.; Liu, X.; Li, Y.; Powell, T.; Wang, X.; Wang, G.; Zhang, P. Microplastics as contaminants in the soil environment: A mini-review. Sci. Total Environ. 2019, 691, 848–857. [Google Scholar] [CrossRef] [PubMed]
  72. Dris, R.; Gasperi, J.; Mirande, C.; Mandin, C.; Guerrouache, M.; Langlois, V.; Tassin, B. A first overview of textile fibers, including microplastics, in indoor and outdoor environments. Environ. Pollut. 2017, 221, 453–458. [Google Scholar] [CrossRef] [PubMed]
  73. Hartline, N.L.; Bruce, N.J.; Karba, S.N.; Ruff, E.O.; Sonar, S.U.; Holden, P.A. Microfiber Masses Recovered from Conventional Machine Washing of New or Aged Garments. Environ. Sci. Technol. 2016, 50, 11532–11538. [Google Scholar] [CrossRef] [PubMed]
  74. Slaughter, E.; Gersberg, R.M.; Watanabe, K.; Rudolph, J.; Stransky, C.; Novotny, T.E. Toxicity of cigarette butts, and their chemical components, to marine and freshwater fish. Tob. Control 2011, 20, i25–i29. [Google Scholar] [CrossRef] [PubMed]
  75. McKeen, L.W. Introduction to Use of Plastics in Food Packaging. In Plastic Films in Food Packaging: Materials, Technology and Applications; William Andrew Publishing: New York, NY, USA, 2013. [Google Scholar] [CrossRef]
  76. Sommer, F.; Dietze, V.; Baum, A.; Sauer, J.; Gilge, S.; Maschowski, C.; Gieré, R. Tire abrasion as a major source of microplastics in the environment. Aerosol. Air Qual. Res. 2018, 18, 2014–2028. [Google Scholar] [CrossRef]
  77. Edil, T.B. A Review of Environmental Impacts and Environmental Applications of Shredded Scrap Tires. In Proceedings of the International Workshop on Scrap Tire Derived Geomaterials—Opportunities and Challenges, IW-TDGM 2007, 2008, Yokosuka, Japan, 23–24 March 2007. [Google Scholar]
  78. Eunomia. Investigating Options for Reducing Releases in the Aquatic Environment of Microplastics Emitted by (But Not Intentionally Added in) Products; Eunomia: Bristol, UK, 2018. [Google Scholar]
  79. Lassen, C.; Hansen, S.F.; Magnusson, K.; Hartmann, N.B.; Jensen, P.R.; Nielsen, T.G.; Brinch, A. Microplastics: Occurrence, Effects and Sources of Releases to the Environment in Denmark—Welcome to DTU Research Database; Danish Environmental Protection Agency: Copenhagen, Denmark, 2015. [Google Scholar]
  80. Vogelsang, C.; Lusher, A.; Dadkhah, M.E.; Sundvor, I.; Umar, M.; Ranneklev, S.B.; David, E.; Sondre, M. Microplastics in Road Dust—Characteristics, Pathways and Measures; REPORT SNO. 7526-2020; Norsk Institutt for Vannforskning: Oslo, Norway, 2020. [Google Scholar]
Figure 1. Sampling points in the San Francisco Bay Area.
Environments 11 00103 g001
Figure 2. Pretreatment protocol for microplastic extraction.
Environments 11 00103 g002
Figure 3. Microplastics found in different sediment samples, scale bar 0.5 mm ((A) fragment; (B) films; (C) pellets; (D) pellet; (E) fibers; (F) film; (G) fiber ball; (H) fragment; (I) fragments and film).
Environments 11 00103 g003
Figure 4. Concentrations of MPs in Core 1 (Pulgas Creek) and Core 2 (Redwood Marina) (Core 2 is 2 cm shorter than Core 1, placing its bottom layer within the depth range of 28–33 cm).
Environments 11 00103 g004
Figure 5. MP morphology percentages in core samples.
Environments 11 00103 g005
Figure 6. Advanced software (OMNIC Specta MCS Software (v. 4.1)) for identification of microplastics (a) and polymer composition of surface grab samples (b) and core sediment samples (c): synthetic cellulose (Cel); PE-PP (poly(ethylene-propylene) copolymer); PEVC (polyethylene-vinyl chloride); PP (polypropylene); PS (polystyrene); PE (polyethylene); PA (polyamide); PC (polycarbonate); AR (alkyd resin); PMMA (polymethyl methacrylate); PES (polyester); PIBD (polyisobutadiene); PAN (polyacrilonitrile); MA (methan alkyd); PEUR (polyether urethane); PEA (polyethyl acrylate); PVC (polyvinyl chloride); UA (urethane alkyd); PVAETH (Poly vinyl acetate–ethanol 3:1).
Environments 11 00103 g006
Table 1. Microplastics’ concentration (MPs/g dw) and morphology (%) in different surface sediment samples.
Sample IDLocationMPs Concentration
(MPs/g dw)
MPs Morphology (%)
FibersFilmsFragments
LSB01Lower South Bay11.965.49.225.4
LSB02Lower South Bay9.765.314.220.5
SB01South Bay6.762.812.324.9
SB02 South Bay9.268.77.723.6
CB01Central Bay4.367.78.124.2
CB02Central Bay3.770.28.521.3
NB01North Bay (River site)2.381.610.87.6
NB02North Bay (River site)2.184.713.51.8
Table 2. Possible pollution sources.
SourceCommon PolymersParticle CharacteristicsReferences
Textile-Related SourcesAcrylic; nylon; polyesterfiber; fiber ball[38,39,40,41,44,72,73]
Fishing Area Ropes/Lines/NetPolypropylene; Polyacrylonitrile; Polyvinylchloride; Polyamidefiber[71]
Cigarette FiltersCellulose acetate fiber; fiber ball[74]
Single-Use Bags and WrapsPolyethylene; Polypropylenefilm[75]
Microbeads Used in Water Softening
and Purification as well as Other
Medical and Industrial Processes
Polystyrenepellet[50,51]
Personal Care ProductsPolyethylene; Polypropylene; Polyethylene terephthalate; polystyrenepellet[71]
Tire Particles and Other Recycled Tire Material Synthetic (styrene-butadiene) rubber; natural (isoprene) rubber; Polyurethanefragment[56,76,77,78,79]
Road Markings (Thermoplastic)Styrene copolymer; Ethylene/vinyl acetate
Copolymer (EVA); nylon
fragment[80]
Disclaimer/Publisher’s Note: The statements, opinions and data contained in all publications are solely those of the individual author(s) and contributor(s) and not of MDPI and/or the editor(s). MDPI and/or the editor(s) disclaim responsibility for any injury to people or property resulting from any ideas, methods, instructions or products referred to in the content.

