Article

The Case for Carbon Capture and Storage Technologies

1
Department of Agricultural Food and Resource Economics, School of Environmental and Biological Sciences, Rutgers University, New Brunswick, NJ 08901, USA
2
School of Arts and Sciences, Rutgers University, New Brunswick, NJ 08901, USA
*
Author to whom correspondence should be addressed.
Environments 2024, 11(3), 52; https://doi.org/10.3390/environments11030052
Submission received: 14 January 2024 / Revised: 29 February 2024 / Accepted: 5 March 2024 / Published: 8 March 2024
(This article belongs to the Topic CO2 Capture and Renewable Energy)

Abstract

:
In this paper, we use the literature to help us better understand carbon capture costs and how these estimates fare against those of avoided costs, focusing on bioenergy carbon capture and storage (BECCS), carbon capture and storage (CCS), as well as direct air capture technologies. We approach these questions from a meta-analysis perspective. The analysis uses meta-analysis tools while applying them to numerical rather than statistical studies. Our analysis shows that avoided costs are, on average, 17.4% higher than capture costs and that the carbon intensity of the feedstock matters: the estimates for coal-based electricity generation capture costs are statistically smaller than those for natural gas or air. From a policy perspective, the literature suggests that the costs of CCS are like the 45Q subsidy of USD 50 per metric ton of carbon captured.

1. Introduction

One hundred ninety nations participated in COP27; the UN climate change conference was held at Sharm El Sheikh, Egypt, from 6 to 18 November 2022 [1]. COP27 was the 27th time nations gathered under the UN convention, which concluded with a historical decision to establish and operationalize a loss and damage fund [2]. The participating members agreed to compensate vulnerable nations for “loss and damage” caused by climate-induced disasters. This is a continuation of the COP26 meeting in Glasgow, where nations agreed that global warming requires drastic measures to significantly reduce the world’s carbon footprint and greenhouse gas (GHG) emissions. COP28 further emphasized the “loss and damage” theme, a meeting that concluded with a need for a transition underpinned by deep emissions cuts and scaled-up finance.
Multiple solutions are proposed to achieve a meaningful impact and yield a significant decline in the stock of GHGs, from the broad deployment of renewable technologies such as wind and solar to the adoption of energy-efficient building codes. However, one principle remains vital to any attempt by humanity to alleviate global warming successfully—carbon-negative technologies. These technologies will become even more pertinent once the world reaches low emissions levels and these technologies compete with other mitigation strategies. Once reaching that stage, the question will be whether it is cheaper to reduce anthropogenic emissions via renewables or is more efficient to introduce technologies that reduce emissions (i.e., carbon-negative emissions).
What do carbon removal technologies entail? Carbon neutrality, or “net zero”, suggests that CO2 released into the atmosphere is balanced by an equivalent amount of CO2 being removed. Thus, carbon-negative technology requires removing more CO2 from the atmosphere than it emits. To this end, the Intergovernmental Panel on Climate Change (IPCC) Special Report on Global Warming of 1.5 °C, published in late 2018 [3], had most pathways analyzed assuming using carbon removal technologies to achieve net-negative emissions after 2050.
Some carbon removal technologies are nature-based, using nature (e.g., afforestation) or enhancing nature’s ability to sequester carbon (e.g., through soil), while others are technological-based solutions. This work focuses on the latter group of technologies. The negative emission technologies (NET) solutions include bioenergy with carbon capture and storage (BECCS) and direct air capture (DAC), which—as the name suggests—involves the capture of CO2 directly from the atmosphere. In pathways limiting global warming to 1.5 °C with limited or no overshoot, the IPCC [3] found that agriculture, forestry, and land-use measures could remove between 1 billion and 11 billion metric tons of CO2 annually by 2050. On the other hand, the potential amount of CO2 removal from BECCS ranged from zero to 8 billion metric tons per year. To put this in context, global energy-related CO2 emissions were 33 billion metric tons in 2018.
This paper focuses on carbon capture and avoided costs, reported in the literature surveying three technologies: CCS, BECCS, and DAC. Its aim is to better understand the economic viability of these technologies. To this end, we next present the various carbon capture technologies and discuss their importance (Section 2.1). We turn to the data in Section 2.2. Section 2.3 discusses this paper’s systematic approach to exploring the benefits of technology-based carbon dioxide removal technologies through a meta-analysis. Section 3 presents the results, and Section 4 concludes.

2. Materials and Methods

Before delving into the methods and data, a few definitions are provided.

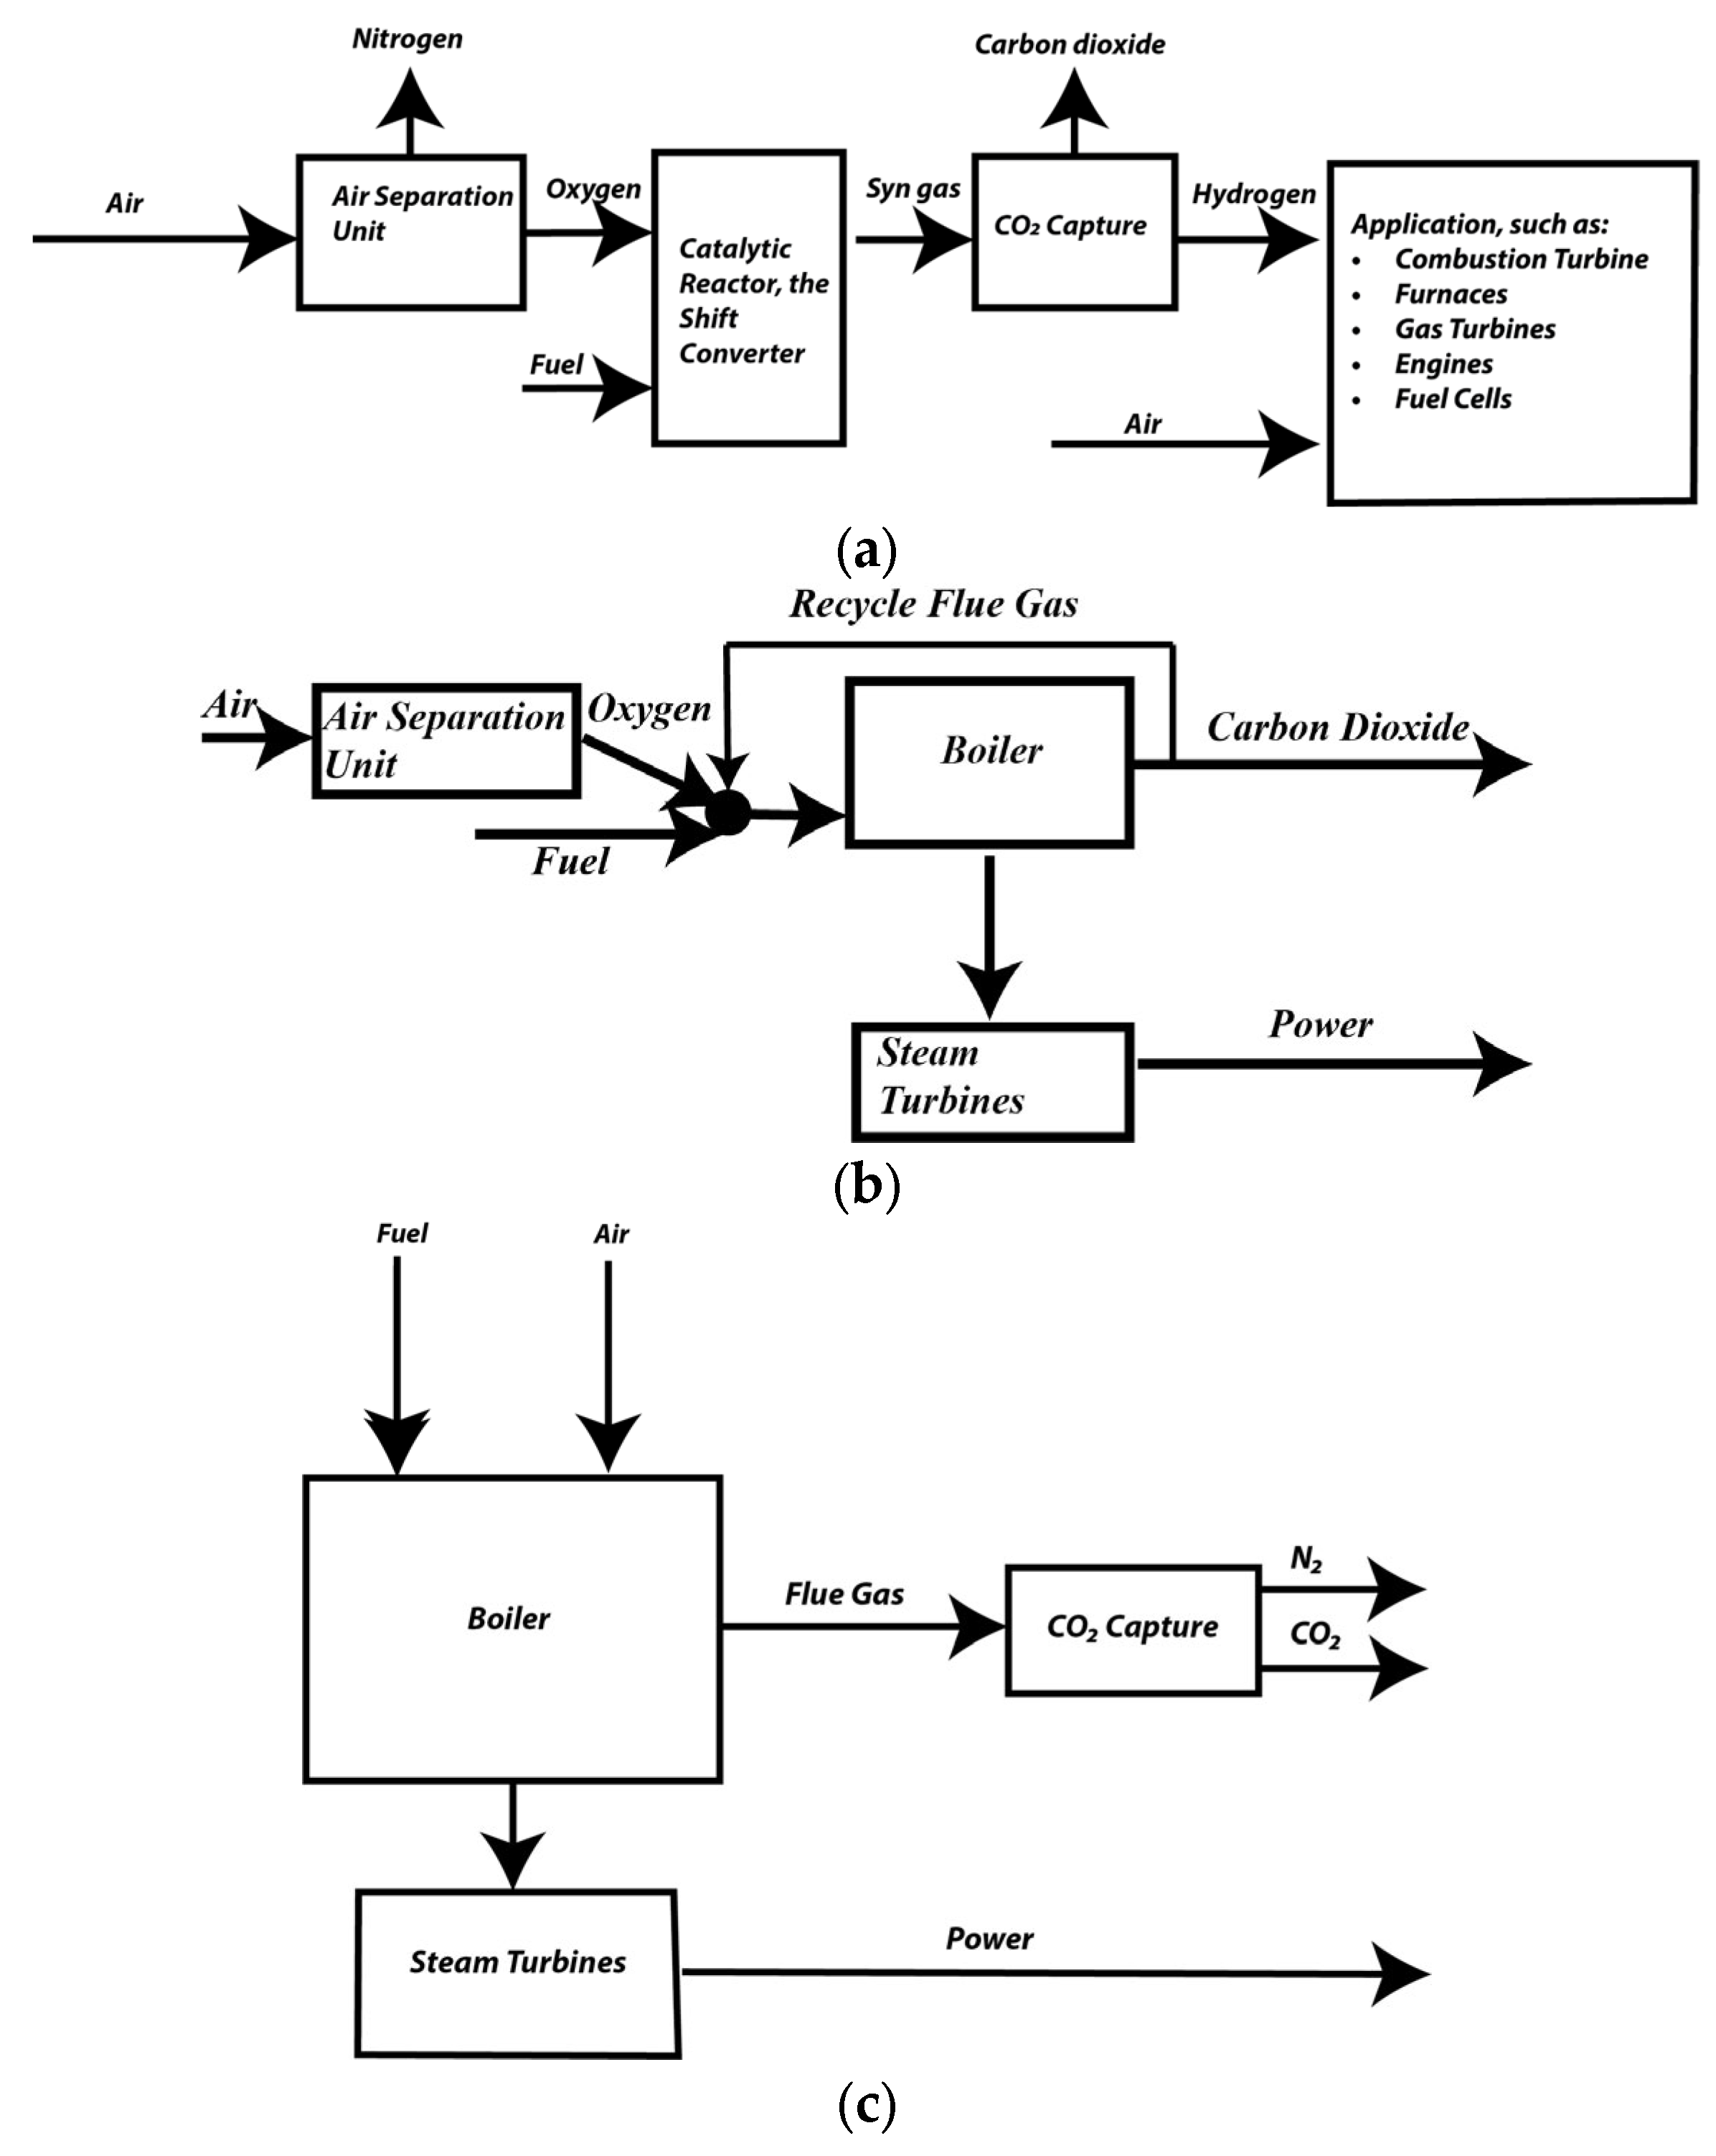
2.1. Carbon Capture Technologies

Carbon sequestration can significantly reduce CO2 emissions into the atmosphere and is essential to any climate mitigation scheme. The geological storage includes the capture, liquefaction, transport, and injection of CO2 deep into the Earth [3,4,5].
How can we capture carbon from smokestacks? The existing literature suggests three primary forms of capturing carbon: pre- and post-combustion capture and oxyfuel combustion.
The literature associates the lowest capital costs with pre-combustion. At the same time, the projects surveyed by the literature report that the most efficient method of capturing carbon is post-combustion, which can be achieved at an efficiency rate higher than 90%. The oxyfuel combustion technology is the costliest (in terms of capital costs). However, one must transition away from the numerical models and assess large-scale facilities to arrive at more definite conclusions regarding efficiency and costs. Turning innovative ideas from early-stage research into full-scale projects can be challenging. This process often presents a range of technical and managerial obstacles that can make implementation more complicated than initially anticipated. As a result, the full-scale outcome may only sometimes be as successful as the literature suggests.
Pre-combustion capture (Figure 1a) involves reacting a fuel with oxygen to give mainly a “synthesis gas (syngas)” or “flue gas” composed of carbon monoxide (CO) and hydrogen (H) [6]. Oxyfuel (Figure 1b) uses oxygen for the combustion of primary fuel to produce flue gas [7]. And finally, post-combustion (Figure 1c) captures CO2 from the flue gas in the power plants [8].
In geologic carbon sequestration, usually CO2 is pressurized on-site until it becomes a liquid and then transported via pipelines and injected into porous rock formations in geologic basins [9]. CO2 may be injected into coal seams, old oil wells (to increase yield), stable rock strata, or saline aquifers [10,11,12,13,14].
This work focuses on three alternative carbon capture and storage technologies. However, before delving into the empirical analysis, we wanted to mention an alternative and promising supply chain path that replaces carbon storage, namely, carbon utilization. Carbon utilization, different from carbon storage, implies carbon is recycled and reused, thus generating value-added products. Although at the R&D stages, carbon can be used to produce cement and used in buildings and can also be used with hydrogen production [15,16,17]. Today’s most widely utilized carbon is in enhanced oil recovery projects. However, carbon can also be used to grow algae, which can then be converted into various products, including chemicals and fuels, soil supplements, fish and animal feed, and nutritional food supplements.

2.2. The Data

We searched for the various studies by using the following key terms in Google Scholar during 2022: bioenergy carbon capture and storage (BECCS), carbon capture and storage (CCS), and direct air capture (DAC). This resulted in a sample of 50 papers and 345 observations (Table 1). When considering only those papers that provided the costs of the technologies, a smaller subset of these papers is retained for use in subsequent analysis. Table 2 summarizes papers explicitly mentioning transportation and storage costs.
Each ‘observation’ is a unique estimation of the cost of a power plant equipped with CCS technology. Costs were consolidated into a smaller set of costs by converting each observation to 2016 US dollars and metric tons (MT). Units of power and energy showed more consistency across studies; hence, the most used units for each parameter were in turn utilized for the data.
This procedure was used to create a panel dataset with two outcome variables, each representing two ways of conveying CCS costs for power plants. What follows is a discussion of these variables, beginning first with the subset of the independent variables used and continuing with a review of the cost variables. This ends with a review of the CCS technology clusters studied via the analysis.
The covariate variables include the levelized cost of electricity (LCOE) and plant capacity, two parameters provided in multiple forms across the literature. LCOE is a measure of the lifetime cost of a power plant divided by energy production, while plant capacity denotes the plant’s electricity capacity expressed in megawatts. These parameters are present in a large volume of observations, making them useful in determining to what extent CCS costs are related to idiosyncratic qualities unique to certain facilities. The remaining parameters found relay similar information about the plant, revealing aspects of its cost or physical structure, which point to factors possibly influencing actualized CCS costs.
The categorical variables we look at are feedstock, point of capture (PC), and currency. Feedstock allows us to indicate the type of fuel that the plant we study utilizes (e.g., coal, natural gas), while PC is a means of indicating how CCS systems capture carbon (i.e., pre- or post-combustion capture, oxy-combustion capture). Currency indicates whether original costs were reported in US dollars or euros, and technology sorts the observations by the kind of application of CCS used (CCS, BECCS, and DAC).
The two outcome variables our analyses focus on are capture cost and avoided cost. The capture cost represents the amount paid to catch CO2 released from the plant of interest. All observations pertaining to this type of cost were directly obtained from papers, with the application of unit conversions for the purpose of standardizing being the only alterations. Avoided cost in the context of CCS usually represents money that would have otherwise been spent on upgrading or constructing power plants utilizing fossil fuels or other non-renewables and cleaning up CO2 released by such alternatives [12]. Formally, avoided cost “compares a plant with CCS to a ‘reference plant’ without CCS, and quantifies the average cost of avoiding a ton of atmospheric CO2 emissions while still providing” ([51], page 182) 1 MWh of electricity. This cost is helpful for policymakers as it better expresses the value provided by CCS technologies and the trade-offs for not utilizing them. As the negative effects from carbon emissions are expected to amplify over time with the progression of climate change, it is unsurprising that the literature also shows an upward trend for this type of cost over time.
Due to how avoided costs are defined, obtaining numbers representing the costs of different steps and aspects of CCS energy generation along the supply chain enables one to approximate such values even if these costs are not reported. A total of 17 studies, amounting to a slight majority of papers in the sample reporting costs, contained ‘implicit’ avoided cost data. The first method used to obtain implicit avoided costs is widely used. Specifically, we consider avoided costs to be the sum of capture, transportation, and storage costs. Each price represents the amount paid for three distinct services used to prevent the release of CO2, hence approximating the avoided cost. The other method is based on our observation of government cap costs expressed by a large volume of papers. Specifically, if one knows a certain carbon tax must be necessarily charged to incentivize wide-scale adoption of CCS operations, along with the price of operating the power plant subject to the tax. If at a particular tax level, energy producers augment their operations with CCS, this represents the point at which they are indifferent between producing electricity with CCS or without (i.e., the ‘reference plant’). The application of both methods increased the total number of unique observations by 110, with 88 coming from the application of the second method.

2.3. Methodology

We use meta-analysis to discern what the literature says about the costs of CCS and use an analytical framework closely mirroring those used in [52]. Specifically, we treat each scenario from a paper as an “observation” and each paper as an “individual”. These assumptions enable us to encapsulate the model in the form of panel data and employ statistical tools to better understand the cost structure of CCS technologies. We allow intercepts to vary across papers to account for differences in methodology between studies. So then, for p, s, n ∈ N, where p is paper, s is scenario, and n is total number of independent variables, the costs yps, which are the dependent variables, are explained by a series of independent variables {1, x1ps, …, xnps} whose intercepts vary across papers.
y p s = β 0 , p + β 1 x 1 p s + . . . + β n x n p s + ε p s
In Equation (1), the error is simply the difference between the actual value observed and the estimated value for the dependent variable.
ε p s = y p s E [ y p s | x p s ]
We are interested in seeing how differences in technologies impact the cost estimates provided in the literature. Hence, we are concerned with the difference in reported costs within technologies and the average cost reported across technologies, the latter of which serves as our base case. So, we denote y ¯ as the average cost and use yps to denote the cost of the technology of interest. The difference in costs is given by the following equation:
Δ y p s = y ¯ y p s
To account for suspected heteroscedasticity caused by correlation between dependent variables, we run both the White and Breusch–Pagan (BP) tests. Each tests the same null hypothesis, thus giving greater support for the possibility of codependence between dependent variables if both tests find it present. If we find that we reject H0 in both cases, this implies that there is a correlation between the error terms of different dependent variables. This requires utilizing a Seemingly Unrelated Regression (SUR).
For the sake of stating our procedure conveniently, abstracting out the indices for independent variables and scenarios is necessary. Notation is defined, allowing for succinct reference to a simplified form of Equation (1).
x ^ p s = 1 , x 1 p s , , x n p s
β ^ i = β 0 , p , β 1 , , β n
y p s = β ^ p x ^ p s T + ε p s
It is important here to note that the ability to achieve the form of Equations (4)–(6) are dependent on what x ^ p s T and β ^ p are defined to be. Following the same line of reasoning, we can stack these equations by scenario and paper to abstract out all indices. Redefining β ^ p and x ^ p s T allows us to “drop” an index. Subsequently, stacking the equations on paper allows us to then rewrite the equation without indices, which is needed for us to state the SUR assumption neatly.
Next, following Zellner’s method [53], we stack the equations on paper. To follow this, X and β need to be transposed prior to reversing their order. Variables X ^ , Y ^ , and ζ ^ refer to the respective stacks of independent and dependent variables and error terms obtained following the above steps.
Y ^ = X ^ β ^ + ζ ^
To satisfy the assumption of a correlation of errors between dependent variables, the assertion of certain conditions for these values is necessary. Hence, for k, hp and u, vs for k h and u v , all the conditions necessary for the SUR model can be summarized as follows.
E ε k , u , ε k , v | X ^ = 0
E ε k , u , ε h , v | X ^ 0

3. Results

Applying meta-analysis methods to numerical simulations and techno-economic analysis yielded valuable insight into CCS technology costs. First, like the indicated prices of wind, solar, and the smart grid [54], the research suggests the literature overestimates the CCS costs and that actual costs are likely lower than foretold. The mean cost estimates reported in the literature suggest a significant effect of existing policies on the adoption and diffusion of CCS technologies.
In arriving at these conclusions, we present a summary statistic about the nature of the data used in our analysis. Then, we apply the methodology section to the data and identify the factors that significantly affect capture and storage costs.

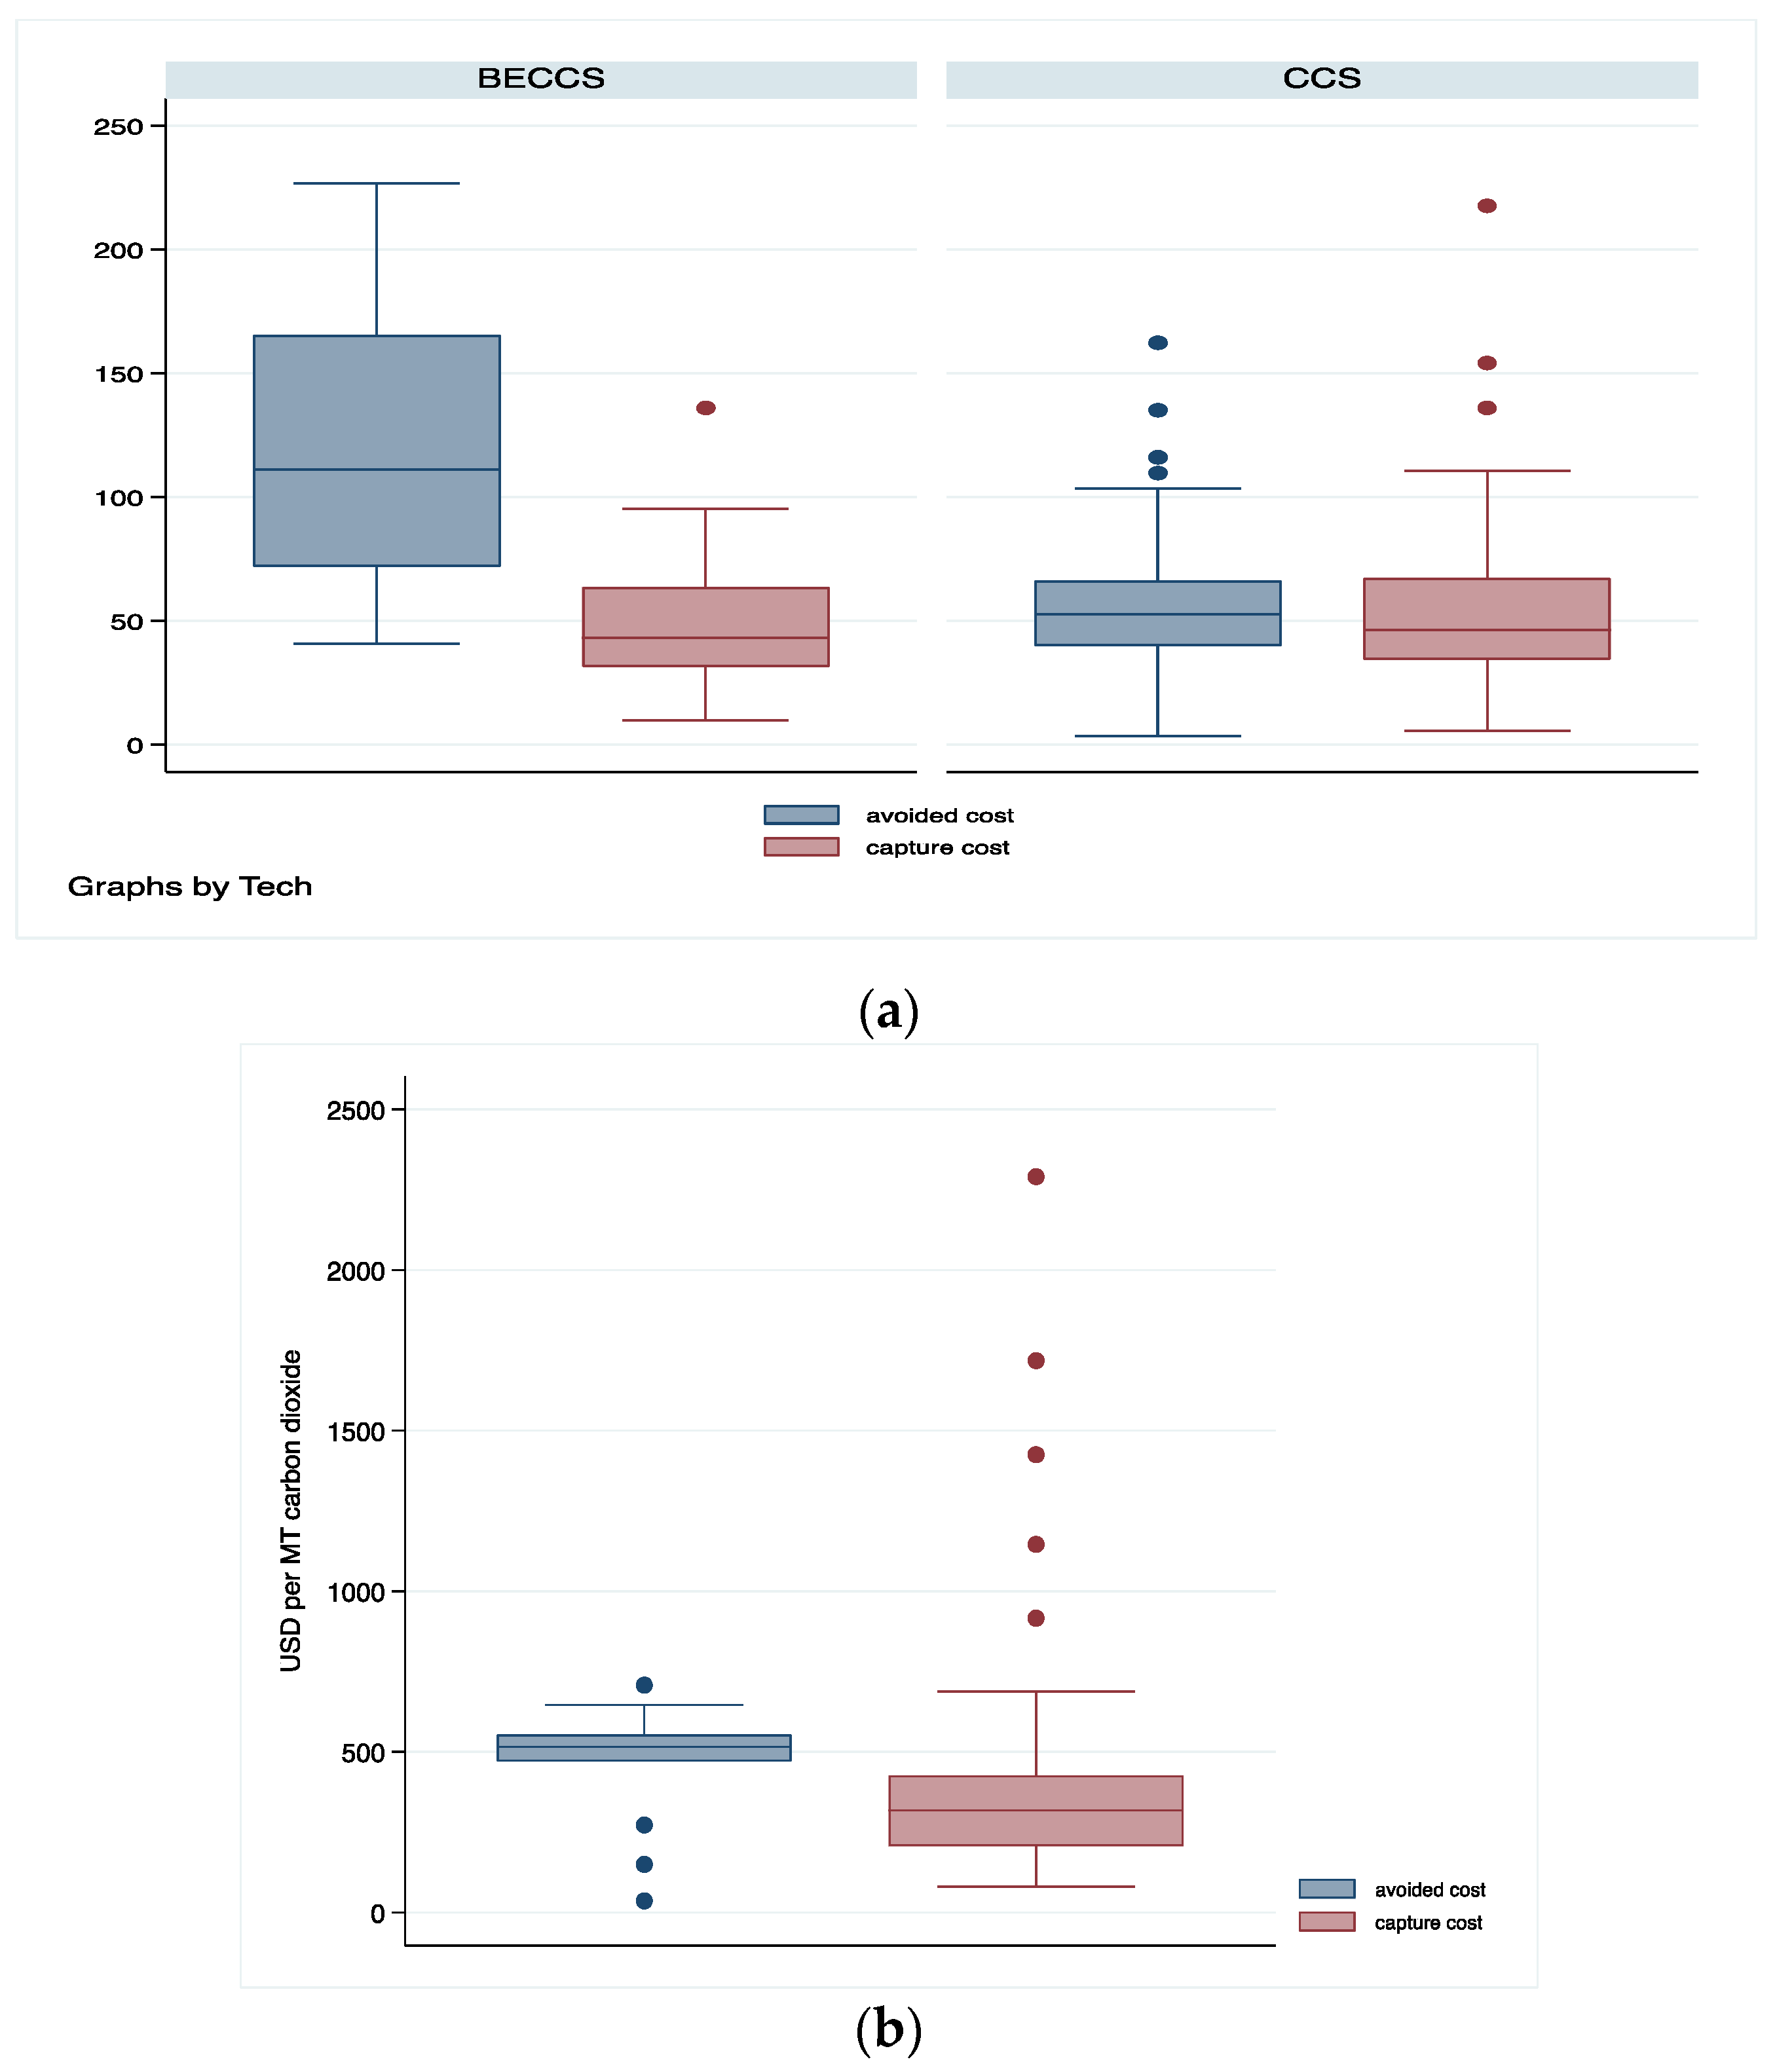
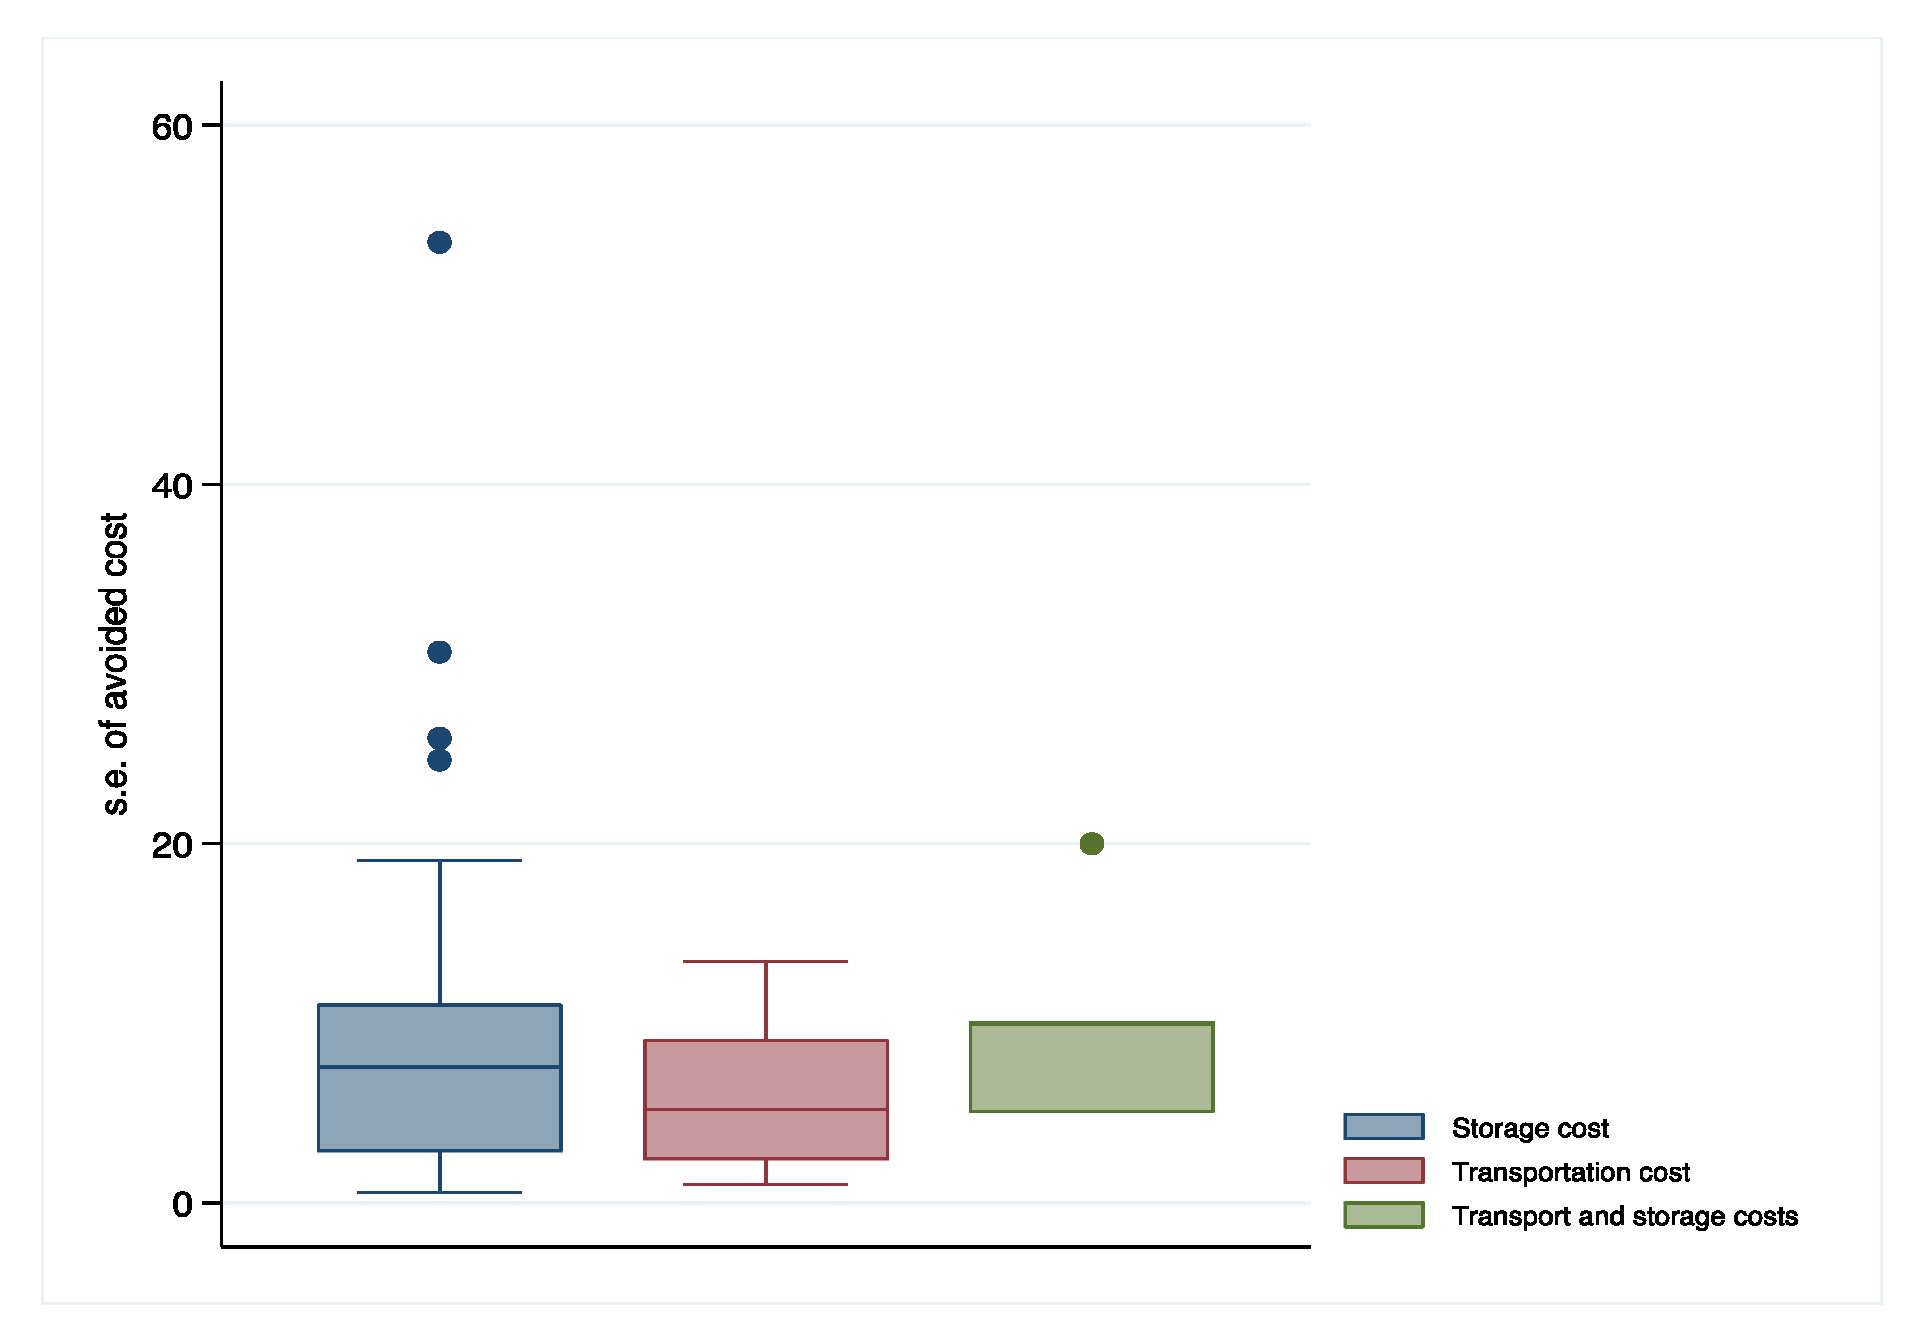
3.1. Summary Statistics

The papers provided a variety of economic costs associated with the CCS technologies, primarily in the form of avoided, captured, storage, and transportation costs.
Avoided costs compares a plant with CCS to one without CCS and uses the comparison to quantify the costs of avoiding a unit of CO2 emissions while providing the same unit of electricity across the two plants [51]. Such a comparison captures the full costs of capturing and sequestering CO2, thus avoiding a ton of CO2 in the atmosphere.
Figure 2 shows a box plot representing the distribution of avoided costs across three technologies. Because of significant cost differences, CCS and BECCS (Figure 2a) are separated from DAC (Figure 2b). To this end, the standard deviations of the CCS and BECCS scenarios are 23.28 and 55.41, respectively, for avoided costs. The standard deviations of avoided costs for DAC are substantially more significant at 194.05. The greater variation witnessed in the DAC cluster is expected owing to the different assumptions disparate studies have on the concentration of CO2 present at the sites where the technology is utilized. The variation in CO2 suggests the reader should be cautious when reaching conclusions when comparing DAC costs across papers. The empirical analysis did not support the inclusion of these measurements in the regression, an outcome that might be the product of the small number of observations for the DAC technology. This variation is appropriate when diverse settings and locations where DAC may be applied are accounted for. In addition, the small number of papers modeling DAC likely also contributed to the distribution of the DAC cost figures. However, the maximum and minimum do reach values that need clarification, irrespective of the technology studied, whereby the average capture cost is less than the average avoided cost (Table 3). Perhaps more striking is the sparsity of avoided costs provided for BECCS, accompanied by large standard deviations. It is striking precisely because of the great reliance of climatic models on the wide-scale utilization of BECCS to make a carbon-negative energy and economic regime viable; however, estimates provided by the literature are paltry.
CCS, in contrast, takes up most of the avoided cost observations. To be exact, 82.63% of all avoided cost observations, or 138 of 167 avoided cost observations across all technology groups. The tight range between the first quartile (equal to USD 32.5 per ton of CO2) and the third quartile (equal to USD 76 per ton of CO2) of USD 43.5 per ton of CO2 can be observed, while two outliers reporting costs of USD 150 per ton of CO2 and USD 180 per ton of CO2 can also be seen. These last two costs were obtained from the same report, whose author overviewed some disparate CCS cost estimates in the CCS technology literature [18]. The maximum cost in the dataset, excluding the outliers, was USD 143 per ton of CO2. At the same time, two papers contained six observations that interestingly found single-digit avoided costs for CCS technology.
Though one must be cautious in attributing reasons for this visible range, it can be noted that the distance between the median (equal to USD 46 per metric ton of CO2) and the first quartile is less than half that between the median and the third quartile—the distribution is skewed toward lower costs. Studies posting more significant avoided cost numbers appear to have more disagreement, possibly owing to different methods of calculating avoided costs. A noticeable trend can also be found in the data, with avoided costs for CCS generally rising with each passing year.
Capture costs follow a trend similar to certain aspects of the avoided cost data, as can be seen in Figure 3. Though there are several differences that are important to note. Firstly, the reader’s attention should be drawn to the wide distribution of DAC capture costs. It should be noted that the outlier cost of USD 2525 per ton of CO2 [25] makes the distributions of the remaining technologies appear greatly reduced. Secondly, BECCS notably has 14 observations. The literature on BECCS reflects interest amongst researchers due to the technology’s potential to manage climate change in an economically viable manner, as indicated by several climatic models (e.g., IMPACT [55] and WITCH [56]). Besides the DAC cluster, BECCS had the largest distribution of costs, ranging from USD 25 per metric ton of CO2 to a high of USD 190 per metric ton of CO2. All data for BECCS capture costs pertained to biomass energy plants, with variation in capture costs possibly caused by varying plant efficiencies [50].
The subsequent cluster, CCS, again contains a plethora of observations. Though the distribution had a large overall range of USD 184.4 per metric ton of CO2 (when discounting the outliers), the interquartile range was markedly smaller, at USD 43.66 per metric ton of CO2. The three observations found to be outliers were obtained from the same paper containing the outliers for CCS avoided cost [18]. This finding corroborates those researchers’ view that CCS is a relatively expensive technology.
Finally, DAC shows the characteristically high costs seen for avoided costs, and its explanation is similar, though subtly different. The high avoided cost reflects that collecting CO2 directly from the air is significantly expensive. The significant capture costs show that utilizing DAC is expensive since it operates by collecting CO2 directly from the air [48]. Considering the outlier, the highest capture cost found in this category was USD 2525 per metric ton of CO2, while the lowest was USD 18 per ton of CO2. The interquartile range for this group was also extensive, at USD 383 per ton of CO2.
The sample from the body of literature also contained information on the cost of the major components of CCS. Other technology clusters, such as BECCS, needed to have these specific component-wise costs because interest in such costs—here narrowly construed to mean the number of papers discussing the price of BECCS—has only recently been piqued. However, owing to the similarity of the transportation and storage processes between CCS and BECCS, these costs may closely resemble those that may come for BECCS [38].
The median cost for each storage and transportation and the combination of storage and transportation costs are USD 11 per metric ton of CO2, USD 6 per ton of CO2, and USD 9 per ton of CO2, respectively. The median for the combined category, including storage and transportation costs, was USD 9 per metric ton of CO2, showing that the individual storage and transportation cost categories are more significant than the combined category. The higher costs obtained for the storage and transportation category resulted from all the estimates coming from a paper [20], distinct from those from which the broken-down costs for each storage and transportation category were taken. Costs vary depending on the reservoir’s location, depth, and size used to store captured CO2. The remaining two outliers come from a paper published in 2004 [26] by an author who gives various estimates that are dependent (sensitive) on locations utilized for CO2 storage.
Impressively, the transportation costs group contains many outliers. Many of these are obtained from one paper [42] and are represented by the same point at the top (USD 30 per metric ton of CO2). The data from recent papers are sparser. Thus, how transportation costs change over time is still being determined. However, newer cost estimates appear generally consistent with older estimates. Some of these costs include the characteristics of pipelines that transport CO2 for storage and even where carbon is stored (i.e., offshore, depleted oil wells on land, etc.) [14].

3.2. Meta-Analysis

Each of the papers analyzed by this study aimed to answer roughly the same question: How much does CCS (or related technologies) cost? Thus, the usefulness of meta-analysis to obtain an answer to this general yet pertinent question is apparent. Multiple cost estimates were obtained from dozens of papers, so a satisfactory answer for the cost of CCS technologies must also consider the effect each study has on the observations obtained.
Most of the continuous data in the sample are specific to the studies they originate from. This is because different authors use divergent measures to gauge the cost of various CCS technologies. Hence, though significant regressions were found with two or more continuous regressors, most attempted models included data from only a subset of papers, and the population containing non-empty values of interest was found to be minute.

3.2.1. Models

We first identified statistically significant and continuous variables using Bayesian model averaging (BMA) and weighted-average least squares (WALS) tests. Model averaging is a statistical technique that helps account for model uncertainty when analyzing data. Rather than relying on just one model, model averaging averages results over multiple plausible models based on the observed data. Model averaging can be used to estimate model parameters and predict new observations to avoid overly optimistic conclusions. It is particularly useful when there are several plausible models and no definitive reason to choose one over the others. BMA provides a principled way to identify important predictors and evaluate the sensitivity of the results to various assumptions. It also provides optimal predictions in the log-score sense. On the other hand, the WALS method uses a statistical framework to fit a linear regression model with uncertainty about the choice of explanatory variables. This technique provides a coherent method of inference on the regression parameters by taking explicit account of uncertainty due to both estimation and model selection steps. The method uses a Bayesian estimator that relies on preliminary orthogonal transformations of the auxiliary regressors and their parameters.
For each test, the set of auxiliary variables must be coterminous with the categorical variables. If a particular categorical variable appeared in the output with t ≥ 1, and 0 μ σ , μ + σ , this was interpreted to mean that a robust model includes this variable [57,58]. Although numerous specifications were evaluated, Table 4 depicts the most inclusive and robust specification. When assessing capture costs, energy feedstock, period of analysis, and price of electricity are key. However, the number of authors should also be controlled when assessing avoided costs, although energy feedstock should still be included in the empirical model. The outcome seems to suggest that although capturing costs go down with time, the increase in the number of authors yields higher costs—the coefficient modeling time (i.e., period in our model) is statistically insignificant at a 10% significance level. While most of the calculations for capture costs focus on the publication period, many studies on avoided costs focus on future periods. Although data suggest learning and that the cost of capturing carbon declines with time, reports with more authors per paper focus more on avoided costs and suggest otherwise. To this end, existing literature suggests similar biases exist in assessing wind, solar, and the smart grid [54]. Most articles and reports underestimate learning and the decline in cost over time.
Besides the high level of significance associated with each of the estimates in each regression, several surprising results can be seen. The positive relationship between capture cost and power efficiency is peculiar, as one might expect that more efficient energy operations would necessitate fewer inputs, resulting in a lower carbon output. However, this may be explained by higher transportation and storage costs levied due to the plant’s distance from designated carbon reservoirs or the nature of carbon transportation systems. In the latter case, one can speculate that the infrequent discharge of CO2 for storage is charged at a premium. However, due to the lack of studies providing transportation costs, capture costs, and power efficiency, it is not easy to make a concrete assessment.
Avoided cost is calculated as the sum of several costs, including capture cost, making the difference between the models initially concerned. More precisely, avoided cost is calculated as the sum of capture, transportation, and storage costs. However, the subsets of the original data used in each regression are completely disjointed when grouped on paper. This is assuring in the sense that model differences may be explained by differences in methodology used. The added fact that each paper whose observations were utilized in the regressions exclusively reported one but not both avoided or capture costs appears to implicitly add support to this notion. Clear documentation of how calculations were derived was not provided in most studies, begging for further investigation into possible methodological differences.
The differences between the data used to determine the capture costs and the (constructed) avoided costs might have influenced the analysis result and the effect of electricity prices on these costs. Since these costs are frequently reported independently in the literature, we have had to rely on proxies to estimate the avoided costs. We have made every effort to address this problem and provide accurate estimates. However, we must acknowledge that the available data are sometimes limited.

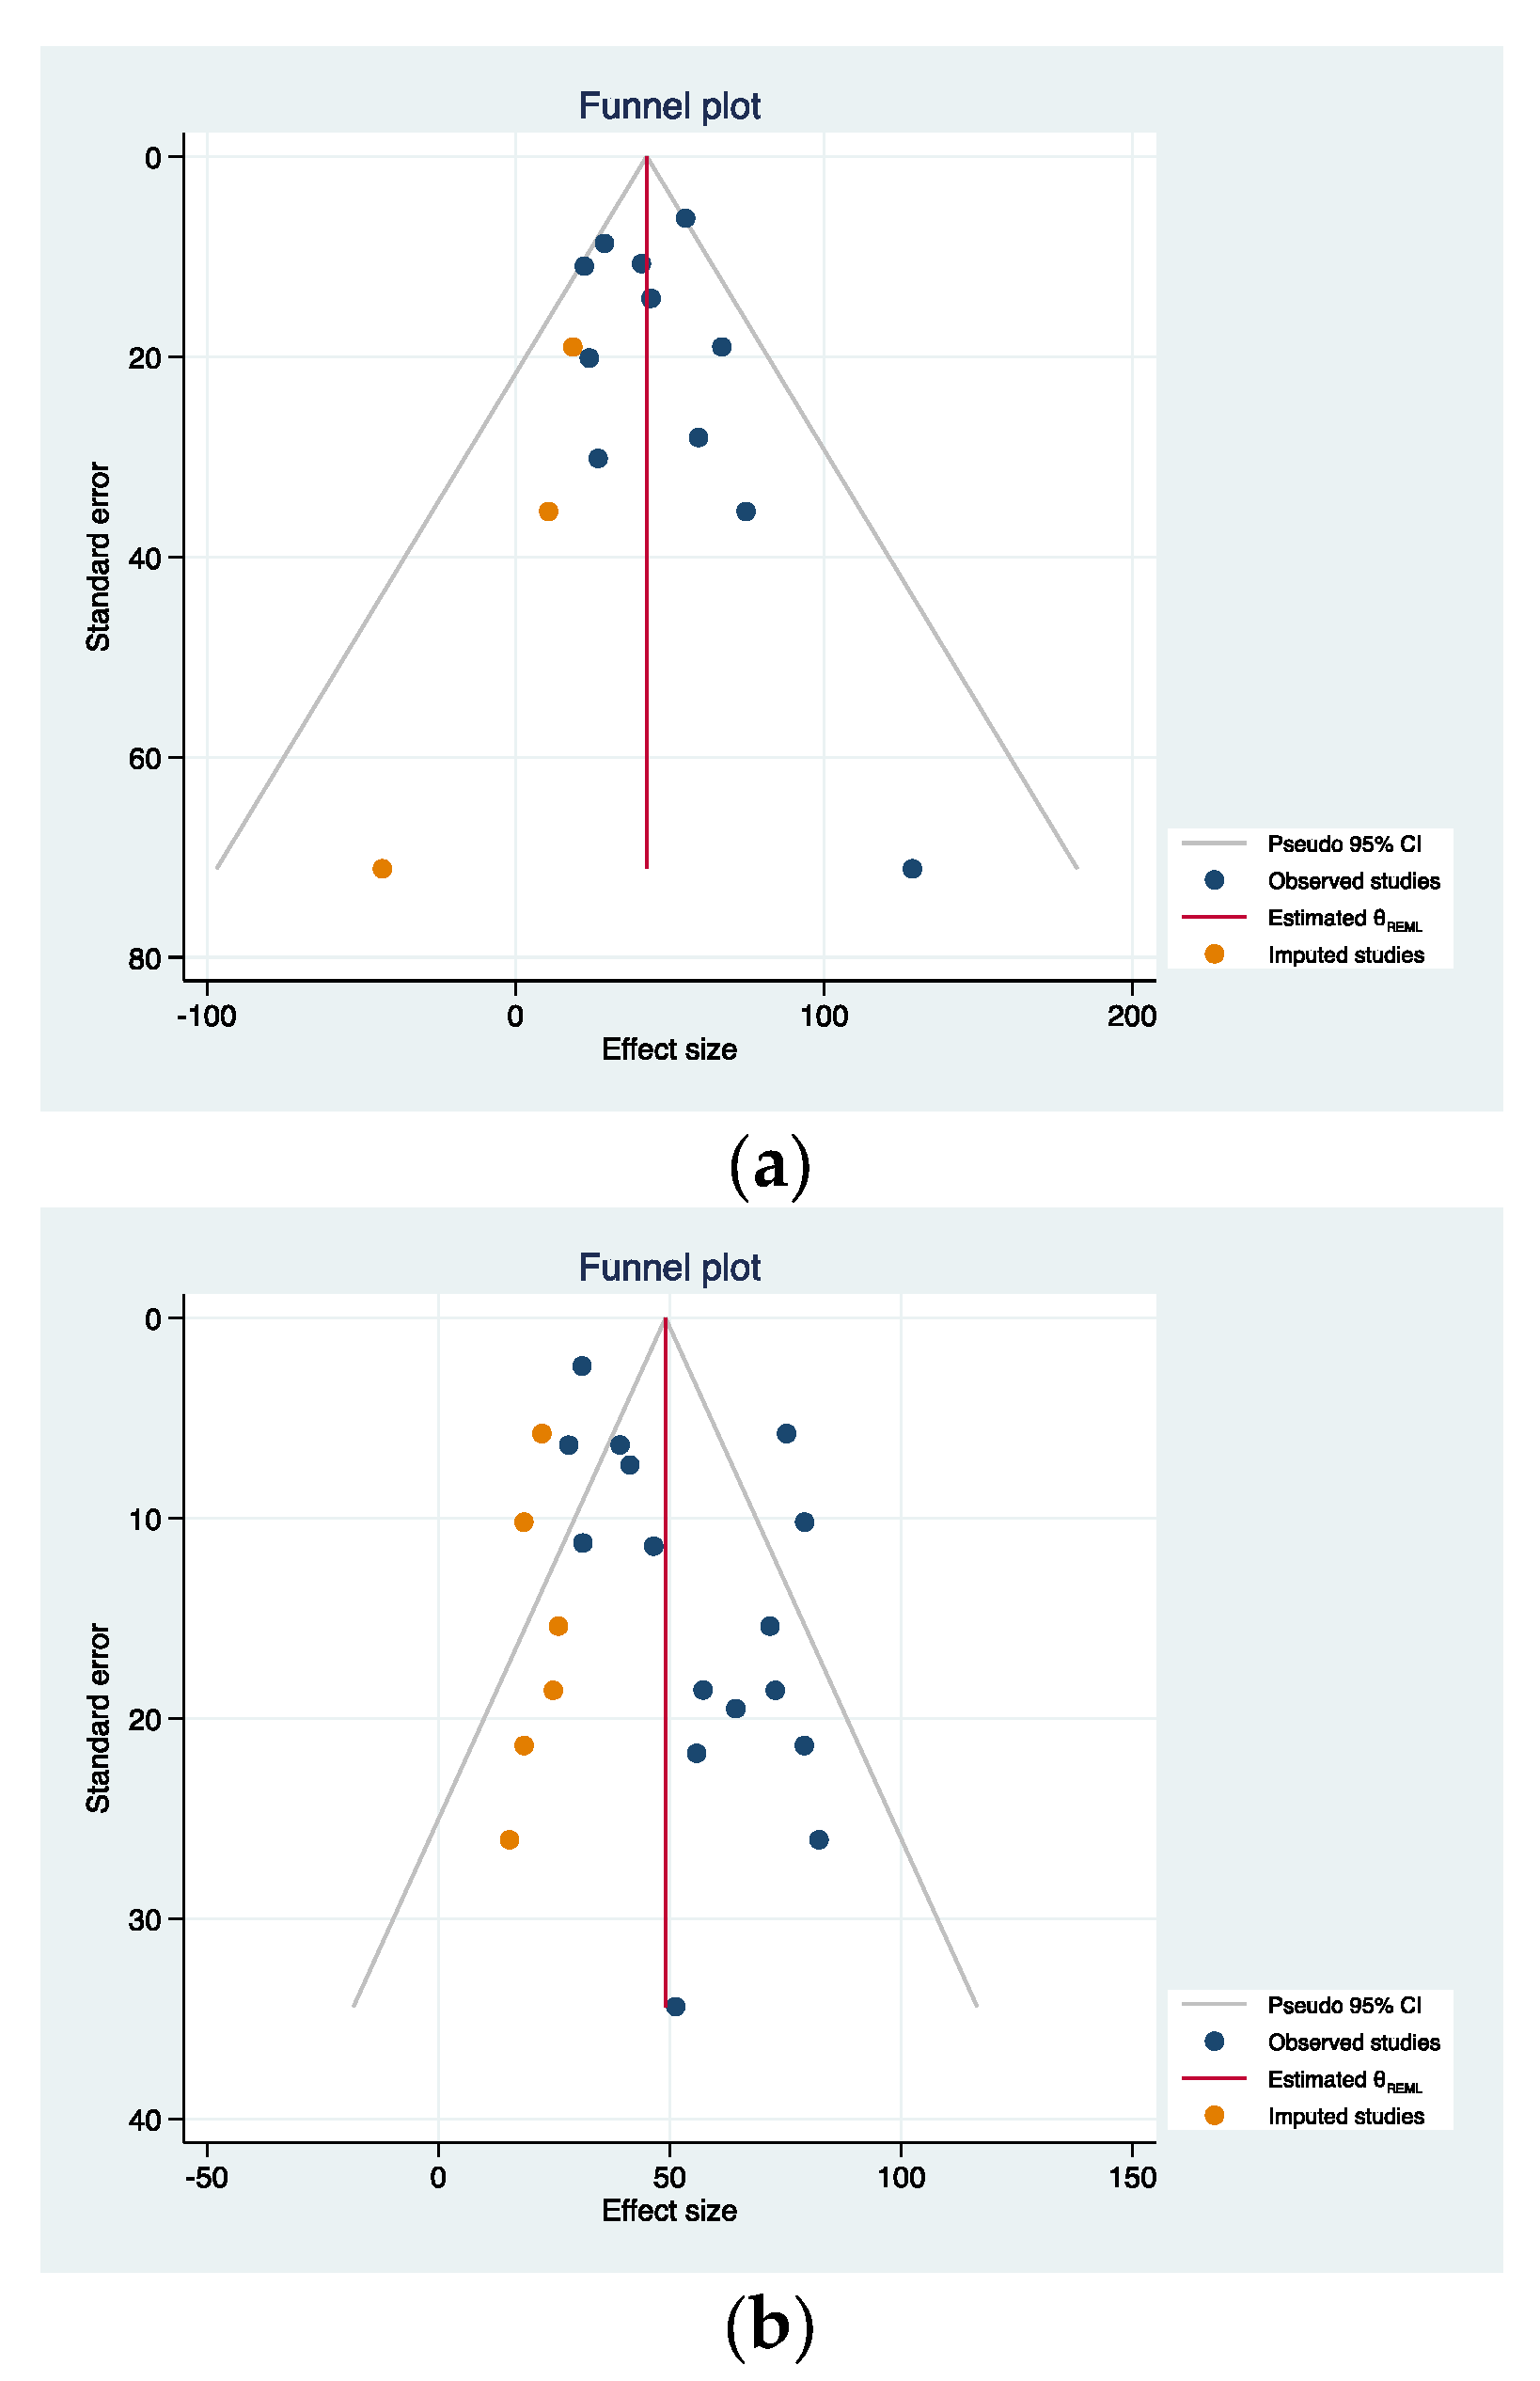
3.2.2. Small Sample Biases

Next, we investigated the presence of publication bias, focusing on CCS. To this end, we use a funnel plot, which consists of a scatter plot of the effect sizes of the individual scenarios on the horizontal axis against a measure of study precision (the standard deviation of the outcomes within the study) on the vertical axis. In addition, we employ the trim-and-fill method, which adjusts for publication bias in funnel plots. The analysis suggests no publication biases when focusing on the capture costs (Figure 4a). The reader can confirm that studies with lower precision (higher standard deviation) are scattered more widely at the bottom of the plot, forming the broader part of the funnel. As precision increases, points cluster more closely near the overall estimate at the top of the plot. On the other hand, avoided costs do suggest higher levels of uncertainty regarding the estimates (Figure 4b). Similar conclusions are drawn for CCS, and the results are also confirmed using the Egger and the Galbraith tests for small-sample biases.

3.2.3. The Estimated Effects

The trim-and-fill analysis suggests a capture cost of USD 42.59, with a 95% confidence interval of [39.66,45.51] (Table 5).
When correcting publication biases using non-parametric trim-and-fill analysis, the estimated transportation and storage effects are USD 5.48 and USD 4.57, respectively. These estimates are consistent with the avoided costs (calculated as the sum of capture, transportation, and storage costs). When modeling avoided costs, the overall estimated avoided cost, focusing on coal and biomass, is USD 49.04 (Table 6). It is interesting to note that the US 45Q policy yields a subsidy of USD 50 per metric ton of carbon sequestered.

4. Discussion

The various carbon capture technologies aim to mitigate climate change by capturing CO2 emissions from industrial processes and power generation, preventing emissions from being released into the atmosphere, and then storing it in geological formations underground or reusing CO2 in other production processes. The primary goal of these technologies is to reduce the concentration of CO2 in the atmosphere.
Through the focus on capture and avoided costs, we tried to understand the implications of implementing carbon capture technologies, and the costs of the technologies vary depending on the specifics. We borrowed tools from meta-analysis to assess biases in the numerical estimates and to quantify the overall estimated average costs suggested by the literature. In addition to the capture costs, we surveyed the transportation, storage, and avoided costs discussed in the literature.
According to the analysis, the capture costs comprise over 80% of the total carbon capture and storage cost, estimated to be around 42.6 US dollars based on the trim-and-fill analysis. The study also indicates that these costs decrease over time and that the type of feedstock used—coal, natural gas, or air—and electricity prices heavily influence their level. After adjusting for biases using non-parametric approaches, the literature reports avoided costs of around USD 50, the subsidy provided through 45Q for every metric ton of carbon sequestered. Yet, while there is vast potential, there is also significant uncertainty regarding the deployment and commercialization of various carbon-sequestering technologies, including those specializing in BECCS technologies [59].
In addition, the meta-analysis suggests no significant publication biases and supports the robustness of these estimates. The analysis suggests heterogeneity in estimates may result from using different geological structures for CO2 storage. That is, on top of variations in feedstock used or electricity prices, the structure of the CO2 supply chains yields variations in cost estimates. Although outside this paper’s scope, the supply chain’s end outcome likely significantly affects the viability of the specific carbon capture process. While usage generates additional revenues, storage results in higher costs. This likely impacts avoided costs and may yield murkier outcomes. Work in this area identified the value chains of waste-to-energy power plants and the high-value-added products that build on the CO2 stream generated during power generation [60], as well as other uses [16].

Author Contributions

Conceptualization, G.H.; methodology, G.H. and V.A.; software, G.H. and V.A.; formal analysis, G.H. and V.A.; data curation, V.A. and G.H.; writing—original draft preparation, V.A.; writing—review and editing, G.H.; visualization, G.H. and V.A.; supervision, G.H.; funding acquisition, G.H. All authors have read and agreed to the published version of the manuscript.

Funding

The author thanks NIFA/USDA (grant number 2022-67023-36404) and multi-hatch NC1034 for financial support.

Data Availability Statement

The collected data collected, and the code used for the analysis are available upon request from the corresponding author.

Acknowledgments

The authors thank the participants at the MAER-Net Colloquium (2022) for their contribution to the paper. Any mistakes that remain are solely the authors’ responsibility.

Conflicts of Interest

The authors declare no conflicts of interest.

References

  1. United Nation, Climate Action COP28. Available online: https://www.un.org/en/climatechange/un-climate-conferences (accessed on 21 December 2023).
  2. United Nation, Climate Action COP27. Available online: https://www.un.org/en/climatechange/cop27 (accessed on 20 December 2023).
  3. IPCC. Global Warming of 1.5 °C. An IPCC Special Report on the Impacts of Global Warming of 1.5 °C above Pre-Industrial Levels and Related Global Greenhouse Gas Emission Pathways, in the Context of Strengthening the Global Response to the Threat of Climate Change, Sustainable Development, and Efforts to Eradicate Poverty; Masson-Delmotte, V., Zhai, P., Pörtner, H.-O., Roberts, D., Skea, J., Shukla, P.R., Pirani, A., Moufouma-Okia, W., Péan, C., Pidcock, R., Eds.; Cambridge University Press: Cambridge, UK; New York, NY, USA, 2018; p. 616. [Google Scholar] [CrossRef]
  4. Lal, R. Enhancing crop yields in the developing countries through restoration of the soil organic carbon pool in agricultural lands. Land Degrad. Dev. 2006, 17, 197–209. [Google Scholar] [CrossRef]
  5. Ajayi, T.; Gomes, J.S.; Bera, A. A review of CO2 storage in geological formations emphasizing modeling, monitoring, and capacity estimation approaches. Pet. Sci. 2019, 16, 1028–1063. [Google Scholar] [CrossRef]
  6. Theo, W.L.; Lim, J.S.; Hashim, H.; Mustaffa, A.A.; Ho, W.S. Review of pre-combustion capture and ionic liquid in carbon capture and storage. Appl. Energy 2016, 183, 1633–1663. [Google Scholar] [CrossRef]
  7. Yadav, S.; Mondal, S.S. A review on the progress and prospects of oxy-fuel carbon capture and sequestration (CCS) technology. Fuel 2022, 308, 122057. [Google Scholar] [CrossRef]
  8. Chao, C.; Deng, Y.; Dewil, R.; Baeyens, J.; Fan, X. Post-combustion carbon capture. Renew. Sustain. Energy Rev. 2021, 138, 110490. [Google Scholar] [CrossRef]
  9. Munkejord, S.T.; Hammer, M.; Løvseth, S.W. CO2 transport: Data and models—A review. Appl. Energy 2016, 169, 499–523. [Google Scholar] [CrossRef]
  10. Benson, S.M.; Hepple, R.; Apps, J.; Tsang, C.F.; Lippmann, M. Lessons Learned from Natural and Industrial Analogues for Storage of Carbon Dioxide in Deep Geological Formations; No. LBNL-51170; Lawrence Berkeley National Lab. (LBNL): Berkeley, CA, USA, 2002.
  11. Klara, S.; Beecy, D.; Kuuskraa, V.; DiPietro, P. Economic benefits of a technology strategy and R&D program in carbon sequestration. In Proceedings of the Greenhouse Gas Control Technologies—6th International Conference, Kyoto, Japan, 1–4 October 2002; pp. 1089–1094. [Google Scholar]
  12. Baines, S.J.; Worden, R.H. Geological Storage of Carbon Dioxide; Special Publications; Geological Society: London, UK, 2004; Volume 233, pp. 1–6. [Google Scholar]
  13. Gale, J. Why Do We Need to Consider Geological Storage of CO2; Special Publications; Geological Society: London, UK, 2004; Volume 233, pp. 7–15. [Google Scholar]
  14. Schmelz, W.J.; Hochman, G.; Miller, K.G. Total cost of carbon capture and storage implemented at a regional scale: Northeastern and midwestern United States. Interface Focus 2020, 10, 20190065. [Google Scholar] [CrossRef]
  15. Norhasyima, R.S.; Mahlia, T.M.I. Advances in CO2 utilization technology: A patent landscape review. J. CO2 Util. 2018, 26, 323–335. [Google Scholar] [CrossRef]
  16. Hepburn, C.; Adlen, E.; Beddington, J.; Carter, E.A.; Fuss, S.; Mac Dowell, N.; Minx, J.C.; Smith, P.; Williams, C.K. The technological and economic prospects for CO2 utilization and removal. Nature 2019, 575, 87–97. [Google Scholar] [CrossRef]
  17. Zhang, Z.; Pan, S.Y.; Li, H.; Cai, J.; Olabi, A.G.; Anthony, E.J.; Manovic, V. Recent advances in carbon dioxide utilization. Renew. Sustain. Energy Rev. 2020, 125, 109799. [Google Scholar] [CrossRef]
  18. Al Juaied, M.; Whitmore, A. Realistic Costs of Carbon Capture; No. ETP-DiscussionPaper-2009-08; Energy Technology Innovation Policy Research Group, Belfer Center for Science and International Affairs, Harvard Kennedy School of Government, Harvard University: Cambridge, MA, USA, 2009. [Google Scholar]
  19. Chen, C.; Tavoni, M. Direct air capture of CO2 and climate stabilization: A model-based assessment. Clim. Change 2013, 118, 59–72. [Google Scholar] [CrossRef]
  20. Azar, C.; Lindgren, K.; Larson, E.; Möllersten, K. Carbon capture and storage from fossil fuels and biomass-costs and potential role in stabilizing the atmosphere. Clim. Change 2006, 74, 47–79. [Google Scholar] [CrossRef]
  21. Bhave, A.; Taylor, R.H.; Fennell, P.; Livingston, W.R.; Shah, N.; Mac Dowell, N.; Dennis, J.; Kraft, M.; Pourkashanian, M.; Insa, M.; et al. Screening and techno-economic assessment of biomass-based power generation with CCS technologies to meet 2050 CO2 targets. Appl. Energy 2017, 190, 481–489. [Google Scholar] [CrossRef]
  22. Fuss, S.; Reuter, W.H.; Szolgayová, J.; Obersteiner, M. Optimal mitigation strategies with negative emission technologies and carbon sinks under uncertainty. Clim. Change 2013, 118, 73–87. [Google Scholar] [CrossRef]
  23. Bozzuto, C.R.; Nsakala, N.; Liljedahl, G.N.; Palkes, M.; Marion, J.L.; Vogel, D.; Gupta, J.C.; Fugate, M.; Guha, M.K. Engineering Feasibility and Economics of CO2 Capture on an Existing Coal-Fired Power Plant. Alstom Power Inc., Ohio Coal Development Office, and US DOE NETL (June 2001). Available online: https://discovery.researcher.life/download/article/95dde7604e043968a6c31a750aeb4701/full-text (accessed on 6 August 2022).
  24. Carbo, M.C.; Smit, R.; van der Drift, B.; Jansen, D. Bio energy with CCS (BECCS): Large potential for BioSNG at low CO2 avoidance cost. Energy Procedia 2011, 4, 2950–2954. [Google Scholar] [CrossRef]
  25. House, K.Z.; Baclig, A.C.; Ranjan, M.; Van Nierop, E.A.; Wilcox, J.; Herzog, H.J. Economic and energetic analysis of capturing CO2 from ambient air. Proc. Natl. Acad. Sci. USA 2011, 108, 20428–20433. [Google Scholar] [CrossRef] [PubMed]
  26. Christensen, N.P.; Holloway, S. Geological Storage of CO2 from Combustion of Fossil Fuel. European Union Fifth Framework Programme for Research and Development; Project No. ENK6-CT-1999-00010, Summary Report; Geological Survey of Norway: Trondheim, Norway, 2004.
  27. Edmonds, J.; Luckow, P.; Calvin, K.; Wise, M.; Dooley, J.; Kyle, P.; Kim, S.H.; Patel, P.; Clarke, L. Can radiative forcing be limited to 2.6 Wm−2 without negative emissions from bioenergy and CO2 capture and storage? Clim. Change 2013, 118, 29–43. [Google Scholar] [CrossRef]
  28. Keith, D.W.; Ha-Duong, M.; Stolaroff, J.K. Climate strategy with CO2 capture from the air. Clim. Change 2006, 74, 17–45. [Google Scholar] [CrossRef]
  29. Dooley, J.J.; Dahowski, R.T. Large-scale US unconventional fuels production and the role of carbon dioxide capture and storage technologies in reducing their greenhouse gas emissions. Energy Procedia 2009, 1, 4225–4232. [Google Scholar] [CrossRef]
  30. McLaren, D. A comparative global assessment of potential negative emissions technologies. Process Saf. Environ. Prot. 2012, 90, 489–500. [Google Scholar] [CrossRef]
  31. Finkenrath, M. Cost and Performance of Carbon Dioxide Capture from Power Generation; International Energy Agency: Paris, France, 2011. [Google Scholar]
  32. Gough, C.; Upham, P. Biomass Energy with Carbon Capture and Storage (BECCS): A Review; Working Paper; Tyndall Centre for Climate Change Research: Norwich, UK, 2010; Volume 147. [Google Scholar]
  33. Pacala, S.; Al-Kaisi, M.; Barteau, M.; Belmont, E.; Benson, S.; Birdsey, R.; Boysen, D.; Duren, R.; Hopkinson, C.; Jones, C.; et al. Negative Emissions Technologies and Reliable Sequestration: A Research Agenda; National Academies of Sciences, Engineering, and Medicine: Washington, DC, USA, 2018. [Google Scholar]
  34. Fornell, R.; Berntsson, T.; Åsblad, A. Techno-economic analysis of a kraft pulp-mill-based biorefinery producing both ethanol and dimethyl ether. Energy 2013, 50, 83–92. [Google Scholar] [CrossRef]
  35. Katofsky, R.; Stanberry, M.; Frantzis, L. Achieving Climate Stabilization in an Insecure World: Does Renewable Energy Hold the Key? Final Report; U.S. Department of Energy Office of Scientific and Technical Information: Richland, WA, USA, 2010.
  36. Pielke, R.A., Jr. An idealized assessment of the economics of air capture of carbon dioxide in mitigation policy. Environ. Sci. Policy 2009, 12, 216–225. [Google Scholar] [CrossRef]
  37. Freund, P.; Ormerod, W.G. Progress toward storage of carbon dioxide. Energy Convers. Manag. 1997, 38, S199–S204. [Google Scholar] [CrossRef]
  38. Laude, A.; Ricci, O.; Bureau, G.; Royer-Adnot, J.; Fabbri, A. CO2 capture and storage from a bioethanol plant: Carbon and energy footprint and economic assessment. Int. J. Greenh. Gas Control. 2011, 5, 1220–1231. [Google Scholar] [CrossRef]
  39. Viebahn, P.; Daniel, V.; Samuel, H. Integrated assessment of carbon capture and storage (CCS) in the German power sector and comparison with the deployment of renewable energies. Appl. Energy 2012, 97, 238–248. [Google Scholar] [CrossRef]
  40. Gibbins, J.; Chalmers, H. Carbon capture and storage. Energy Policy 2008, 36, 4317–4322. [Google Scholar] [CrossRef]
  41. Luckow, P.; Wise, M.A.; Dooley, J.J.; Kim, S.H. Large-scale utilization of biomass energy and carbon dioxide capture and storage in the transport and electricity sectors under stringent CO2 concentration limit scenarios. Int. J. Greenh. Gas Control. 2010, 4, 865–877. [Google Scholar] [CrossRef]
  42. Hendriks, C.; Graus, W.; van Bergen, F. Global Carbon Dioxide Storage Potential and Costs; ECOFYS: Utrecht, The Netherlands, 2004; p. 64. Available online: https://www.researchgate.net/profile/Wina-Crijns-Graus/publication/260095614_Global_Carbon_Dioxide_Storage_Potential_and_Costs/links/02e7e52f8a006a9854000000/Global-Carbon-Dioxide-Storage-Potential-and-Costs.pdf (accessed on 13 January 2024).
  43. Herzog, H.J. Scaling up carbon dioxide capture and storage: From megatons to gigatons. Energy Econ. 2011, 33, 597–604. [Google Scholar] [CrossRef]
  44. Herzog, H.J.; Drake, E.M. Carbon dioxide recovery and disposal from large energy systems. Annu. Rev. Energy Environ. 1996, 21, 145–166. [Google Scholar] [CrossRef]
  45. Rhodes, J.S.; Keith, D.W. Engineering economic analysis of biomass IGCC with carbon capture and storage. Biomass Bioenergy 2005, 29, 440–450. [Google Scholar] [CrossRef]
  46. Schmidt, J.; Leduc, S.; Dotzauer, E.; Kindermann, G.; Schmid, E. Cost-effective CO2 emission reduction through heat, power, and biofuel production from woody biomass: A spatially explicit comparison of conversion technologies. Appl. Energy 2010, 87, 2128–2141. [Google Scholar] [CrossRef]
  47. Ramezan, M.; Skone, T.J.; Nsakala, N.Y.; Liljedahl, G.N.; Gearhart, L.E.; Hestermann, R.; Rederstorff, B. Carbon Dioxide Capture from Existing Coal-Fired Power Plants; DOE/NETL Report; National Energy Technology Laboratory: Morgantown, WV, USA, 2007; Volume 401, p. 110907. [Google Scholar]
  48. Socolow, R.; Desmond, M.; Aines, R.; Blackstock, J.; Bolland, O.; Kaarsberg, T.; Lewis, N.; Mazzotti, M.; Pfeffer, A.; Sawyer, K.; et al. Direct Air Capture of CO2 with Chemicals: A Technology Assessment for the APS Panel on Public Affairs (No. BOOK); American Physical Society: Washington, DC, USA, 2011. [Google Scholar]
  49. Riemer, P.W.; Ormerod, W.G. International perspectives and the results of carbon dioxide capture disposal and utilisation studies. Energy Convers. Manag. 1995, 36, 813–818. [Google Scholar] [CrossRef]
  50. Rubin, E.S.; Davison, J.E.; Herzog, H.J. The cost of CO2 capture and storage. Int. J. Greenh. Gas Control. 2015, 40, 378–400. [Google Scholar] [CrossRef]
  51. Rubin, E.S. Understanding the pitfalls of CCS cost estimates. Int. J. Greenh. Gas Control. 2012, 10, 181–190. [Google Scholar] [CrossRef]
  52. Hochman, G.; Zilberman, D. Corn Ethanol and US Biofuel Policy Ten Years Later: A Systematic Review and Meta-Analysis; No. 333-2016-14652; AAEA: Washington, DC, USA, 2016. [Google Scholar]
  53. Zellner, A. An efficient method of estimating seemingly unrelated regressions and tests for aggregation bias. J. Am. Stat. Assoc. 1962, 57, 348–368. [Google Scholar] [CrossRef]
  54. Way, R.; Ives, M.C.; Mealy, P.; Farmer, J.D. Empirically grounded technology forecasts and the energy transition. Joule 2022, 6, 2057–2082. [Google Scholar] [CrossRef]
  55. The IFPRI’s IMPACT Model. Available online: https://www.ifpri.org/project/ifpri-impact-model (accessed on 13 January 2024).
  56. The WITCH Model. Available online: https://www.witchmodel.org (accessed on 13 January 2024).
  57. De Luca, G.; Magnus, J.R. Bayesian model averaging and weighted-average least squares: Equivariance, stability, and numerical issues. Stata J. 2011, 11, 518–544. [Google Scholar] [CrossRef]
  58. Magnus, J.R.; Powell, O.; Prüfer, P. A comparison of two model averaging techniques with an application to growth empirics. J. Econom. 2010, 154, 139–153. [Google Scholar] [CrossRef]
  59. Kemper, J. Biomass and carbon dioxide capture and storage: A review. Int. J. Greenh. Gas Control. 2015, 40, 401–430. [Google Scholar] [CrossRef]
  60. Moioli, S.; De Guido, G.; Pellegrini, L.A.; Fasola, E.; Riva, E.R.; Alberti, D.; Carrara, A. Techno-economic assessment of the CO2 value chain with CCUS applied to a waste-to-energy Italian plant. Chem. Eng. Sci. 2024, 287, 119717. [Google Scholar] [CrossRef]
Figure 1. The three capture technologies. (a) Pre-combustion; (b) oxyfuel; (c) post-combustion.
Environments 11 00052 g001
Figure 2. Distribution of avoided and capture costs over different CCS technologies: (a) CCS and BECCS technologies; (b) DAC technology.
Environments 11 00052 g002
Figure 3. A boxplot for CCS across three cost categories showing the cost variation.
Environments 11 00052 g003
Figure 4. Testing for publication biases using funnel plots: CCS. (a) Capture costs; (b) avoided costs.
Environments 11 00052 g004
Table 1. Citations to sources used in the meta-analysis.
Papers Used under the Alternative Technologies
CCSBECCSDAC
Al Juaied and Whitmore, 2009 [18]Azar et al., 2006 [18]Chen and Tavoni, 2013 [19]
Azar et al., 2006 [20]Bhave et al., 2017 [21]Fuss et al., 2013 [22]
Bozzuto et al., 2001 [23]Carbo et al., 2011 [24]House et al., 2011 [25]
Christensen and Holloway, 2004 [26]Edmonds et al., 2013 [27]Keith et al., 2006 [28]
Dooley and Dahowski, 2009 [29]Fuss et al., 2013 [22]McLaren, 2012 [30]
Finkenrath, 2011 [31]Gough and Upham, 2010 [32]Pacala et al., 2018 [33]
Fornell et al., 2013 [34]Katofsky et al., 2010 [35]Pielke Jr., 2009 [36]
Freund and Ormerod, 1997 [37]Laude et al., 2011 [38]Socolow et al., 2011 [39]
Gibbins and Chalmers, 2008 [40]Luckow et al., 2010 [41]
Hendriks et al., 2004 [42]McLaren, 2012 [30]
Herzog, 2011 [43]Pacala et al., 2018 [33]
Herzog and Drake, 1996 [44]Rhodes and Keith, 2005 [45]
Katofsky et al., 2010 [35]Schmidt et al., 2010 [46]
Ramezan et al., 2007 [47]Schmelz et al., 2020 [48]
Riemer and Ormerod, 1995 [49]
Rubin et al., 2015 [50]
Schmidt et al., 2010 [46]
Socolow et al., 2011 [39]
Viebahn et al., 2012 [51]
Table 2. Citations to sources used in the transportation and sequestration costs meta-analysis.
Transportation CostsSequestration Costs
Christensen and Holloway, 2004 [26]Christensen and Holloway, 2004 [26]
Fornell et al., 2013 [34]Freund and Ormerod, 1997 [37]
Herzog, 2011 [43]Gibbins and Chalmers, 2008 [40]
Laude et al., 2011 [38]Laude et al., 2011 [38]
Luckow et al., 2010 [41]
Table 3. The average reported capture and avoided costs for the CCS, BECCS, and DAC technologies.
Capture Costs
(USD per MT CO2)
Avoided Costs
(USD per MT CO2)
CCS53.2155.26
BECCS49.82115.49
DAC390.47463.36
Table 4. Significant and robust regressions.
Capture CostsAvoided Costs
Variables(1)(2)(3)(4)
BMA modelWALS modelBMA modelWALS model
Energy feedstock1.898 ***1.918 ***1.4038 ***1.3967 ***
(0.218)(0.206)(0.2907)(0.2492)
Capture technology−0.142−0.348 **−0.3433−0.4346 **
(0.220)(0.173)(0.3256)(0.2075)
Number of Authors0.0150.1012.9068 **3.0339 **
(0.049)(0.080)(1.1786)(1.1664)
Period of analysis−5.728 ***−5.919 ***0.24630.6783
(0.852)(0.867)(0.4383)(0.5341)
Price of electricity (USD per kWh)657.037 ***614.623 ***−2.3046−1.6405
(79.592)(78.256)(11.6587)(17.6569)
Constant11,494.699 ***11,887.986 ***−457.0317−1323.8800
(1711.243)(1740.940)(882.1436)(1075.4327)
Observations6767128128
Standard errors in parentheses, *** p < 0.01, ** p < 0.05.
Table 5. Capture costs.
StudiesEffect Size[95% Confidence Interval]
Observed44.74241.76047.724
Observed + imputed42.58639.66245.509
Table 6. Avoided costs.
StudiesEffect Size[95% Confidence Interval]
Observed51.63349.45053.816
Observed + imputed49.04146.60151.481
Disclaimer/Publisher’s Note: The statements, opinions and data contained in all publications are solely those of the individual author(s) and contributor(s) and not of MDPI and/or the editor(s). MDPI and/or the editor(s) disclaim responsibility for any injury to people or property resulting from any ideas, methods, instructions or products referred to in the content.

