Article

Submerged Membrane Bioreactor Configurations for Biological Nutrient Removal from Urban Wastewater: Experimental Tests and Model Simulation

by
Javier A. Mouthón-Bello
1,*,
Oscar E. Coronado-Hernández
2 and
Vicente S. Fuertes-Miquel
3,*
1
Facultad de Ingeniería, Universidad de Cartagena, Cartagena 130014, Colombia
2
Instituto de Hidráulica y Saneamiento Ambiental, Universidad de Cartagena, Cartagena 130001, Colombia
3
Departamento de Ingeniería Hidráulica y Medio Ambiente, Universitat Politècnica de València, 46022 Valencia, Spain
*
Authors to whom correspondence should be addressed.
Environments 2024, 11(11), 260; https://doi.org/10.3390/environments11110260
Submission received: 20 September 2024 / Revised: 7 November 2024 / Accepted: 13 November 2024 / Published: 20 November 2024
(This article belongs to the Special Issue Advanced Research on Micropollutants in Water)

Abstract

:
Pilot-scale experimental measurements and simulations were utilised to evaluate the nutrient removal efficiency of three submerged membrane bioreactor designs. This study compared setups with post- and pre-denitrification processes. A 625 L pilot plant for treating primary effluent provided the operational data necessary for calibrating the activated sludge model, specifically for chemical oxygen demand and nitrogen removal under steady-state flow. Identical influent conditions were maintained for all configurations while varying the sludge retention times (from 5 to 100 d), hydraulic retention times (ranging from 4 to 15 h), return activated sludge flow rates (between 0.1 and 3.0), and aerobic volume fractions (from 0.3 to 1.0). The pilot plant tests showed high COD and ammonia removal (above 90%) but moderate total nitrogen removal (above 70%). The simulation results successfully forecasted the effluent concentrations of COD and nitrogen for each configuration. There were noticeable variations in the kinetic parameters, such as mass transfer coefficients and biomass decay rates, related to the activated sludge model. However, increasing the sludge retention time beyond 20 d, hydraulic retention time beyond 8 h, return activated sludge rates above 2.0, or aerobic volume fractions beyond 0.4 did not significantly enhance nutrient removal. The post-denitrification setup showed a clear benefit in nitrogen removal but required a greater oxygen supply.

1. Introduction

Increasing stringent regulation on wastewater treatment plant (WWTP) effluent has spurred the search for new and improved treatment processes. Traditional biological nutrient removal (BNR) systems rely on activated sludge processes involving anaerobic, anoxic, and aerobic reactors. In the aerobic stage, ammonia is transformed into nitrate, and then into nitrogen gas in the anoxic stage. Phosphorus is released in the anaerobic reactor and taken up during the anoxic and aerobic phases. Even though BNR systems remove nutrients from wastewater, they struggle to achieve strict limits in nutrient discharges. This challenge highlights the need for extensive studies to better understand the behaviour of microbial communities within BNR systems [1].
The combination of BNR with submerged membrane bioreactors (SMBRs) is considered an alternative for new or redevelopment of conventional activated sludge (CAS) plants because it operates at higher biomass concentrations, allowing for a small plant footprint with solid-free effluent [2,3]. This combination can be performed at high sludge retention times (SRTs), which promotes efficient nutrient removal. Nevertheless, some researchers have identified that soluble microbial products (SMPs) released by bacteria during the treatment process are a vital contributor to membrane fouling, which increases operational costs for WWTPs utilising SMBRs due to frequent membrane cleaning [2,4,5,6,7,8,9]. Studies have shown that aerobic membrane bioreactors can operate efficiently at shorter SRT values (10–25 d) without compromising performance, while extended SRTs beyond 40 d offer no additional benefits and may increase membrane biofouling by reducing microbial activity and altering EPS and SMP concentrations [10,11].
Fouling can be minimised by optimising operational parameters such as hydraulic retention time (HRT), organic loading rate (OLR), and SRT [4]. It has been reported that decreasing HRT and increasing SRT lead to reduced levels of SMPs, resulting in lower membrane fouling [3]. Additionally, some researchers have explored various SMBR configurations for BNR systems to increase removal efficiency while keeping membrane fouling low [7,12]. Nevertheless, mathematical modelling of BNR in SMBRs involving SMPs and fouling is a complicated task due to over-parameterisation [2]. Therefore, it is necessary to explore existing simple models and test their ability to adequately simulate BNR using SMBRs.
The mathematical models developed by the IWA are widely recognised as the standard for studying, advancing, and optimising activated sludge systems [13,14]. The most renowned of these is the ASM 1, which outlines the processes of organic matter oxidation and nitrification–denitrification. Stoichiometric and kinetic parameters from conventional activated sludge plants have been applied to design submerged membrane bioreactors. Nevertheless, differences in biokinetic parameters have been observed between conventional activated sludge and submerged membrane bioreactor installations. These differences arise from long SRTs and high concentrations in biomass in SMBRs, which results in changes in the floc structure influence on mass transfer [15,16,17,18] and changes in the microbial population in SMBRs [2,3,4,19,20]. At higher solid retention times, sludge flocs tend to be more compact and physically stable compared to those formed at lower sludge retention times [21]. Research has indicated that floc sizes in submerged membrane bioreactors are generally smaller than in conventional activated sludge systems [22,23]. The size and structure of flocs are key factors in mass transfer, influencing the half-saturation constants of nitrifying organisms [15,22]. Moreover, the lack of grazing organisms in systems operating at high SRTs has been shown to impact microbial population dynamics and contribute to reduced biomass decay [19,24,25,26].
Most studies on SMBRs tend to concentrate on sludge characteristics, nutrient removal efficiency, and membrane performance, often lacking kinetic data. While valuable efforts have been made to provide biokinetic parameters, they have not followed the established framework for biological nutrient removal models (for instance, reference [27]). Despite practical knowledge of using activated sludge and SMBRs for nutrient removal in the process design, significant optimisation potential remains. In this research, a comparison of three distinct configurations for nutrient removal using the submerged membrane bioreactor operation was conducted. Initially, pilot-scale experimental measurements assessed biological nitrogen and phosphorus removal under varying operational conditions. Both pre-denitrification and post-denitrification setups were tested across anaerobic, anoxic, and aerobic zones. The data collected were then used to calibrate a steady-state model, based on an activated sludge model [28], utilising the GPS-X® version 4.0.1 software package from Hydromantis Inc (Hamilton, ON, Canada.). Simulations were subsequently carried out, using the verified model, to comprehensively assess the three configurations under different SRTs, HRTs, RAS rates, and aerobic volume fractions, while maintaining consistent influent wastewater quality. This analysis aims to highlight the factors that most significantly impact SMBR nutrient removal performance, rather than to provide stoichiometric or kinetic parameters for process design.

2. Materials and Methods

2.1. Pilot Plant

The experiments were conducted in an SMBR pilot plant installed at the City of Guelph WWTP (Canada). The pilot plant primarily comprises a rectangular plastic bioreactor with an active volume of 0.5 m3, which could be configured into two or three compartments arranged in series alongside a membrane tank (SMBR) with a 0.125 m3 active volume dedicated to biosolid–liquid separation. The SMBR was configured with dead-end membrane modules (ZW-10®, Zenon Environmental Inc., now part of General Electric, Oakville, ON, Canada) featuring a pore size of 0.2 μm. The plant was fed with primary effluent, and the solid retention time was regulated by removing excess sludge from the SMBR.
Configuration No. 1 mirrors the A2/OTM process, featuring an anoxic/anaerobic/oxic sequence, as concentrated sludge, rich in nitrogen oxides, is returned from the submerged membrane bioreactor to the first stage. Configuration No. 2 is a modified version of the three-stage Bradenpho biological nutrient removal system, where sludge is recycled from the submerged membrane bioreactor to both the anaerobic and anoxic zones [29]. Configuration No. 3 employs a post-denitrification process similar to that outlined in reference [30]. Figure 1 shows the schematic representation in GPS-X, while Appendix A presents sample points employed in this research.
The operational conditions for each configuration are summarised in Table 1.

2.2. Wastewater Characterisation

Applying the ASM 1 to emerging wastewater treatment technologies like SMBRs requires experimental data on activated sludge and wastewater properties. Samples were collected twice weekly from the influent, permeate, and reactor zones across all configurations. Influent characterisation involved measuring TSS, VSS TCOD, SCOD, NH3, nitrogen oxides (NO2 and NO3), TN, TP, SP, and alkalinity. The average results from these measurements across four experiments are summarised in Table 2. These values represent averages calculated from data collected after steady-state conditions were achieved for each configuration. For activated sludge characterisation in each reactor zone, parameters such as MLSS, MLVSS, total and soluble COD, NH3, NO2, NO3, total nitrogen, and phosphate were measured. Most of the analytical techniques used in this work followed Standard Methods [31]. Nitrate was determined with specific HACH kits–Test’NTube–Hach (Loveland, CO, USA), while TN was determined by using a TOC analyser Model TOC-Vcsh − Shimadzu (Kyoto, Japan) coupled with a TNU (TNM-1, Shimadzu).
An initial step in calibrating the ASM 1 involves identifying the various organic components in wastewater: S I , S S , X I , and slowly biodegradable organic matter. Wastewater characterisation was performed according to the methodology outlined in reference [32], as shown in Table 3.

2.3. Calibration Methodology

GPS-X® version 4.0.1 (Hydromantis Inc.) was the software package used for the pilot plant steady-state simulation. A mixed reactor was assumed to be the compartment type for all zones. The submerged membrane bioreactor was modelled as a thoroughly stirred tank reactor, complemented by an external membrane separation process featuring a high recirculation rate (see Figure 1). Moreover, the SMBR was regarded as an ideal biomass separator, eliminating all biomass and debris particles while ensuring no degraded particle substrate remained. Consequently, it was assumed that all particle biomass and substrates were solely removed via the wastage flow.
The model employed for C-O and N-REM was the IAWQ ASM 1 [28]. Calibration was conducted following the stepwise procedure outlined in reference [33] and the BIOMATH protocol described in reference [34], taking into account the available data from the pilot plant. Data collected from the pilot plant were averaged, assuming that this average reflects steady-state conditions. Minor variations in operational parameters and influent characteristics were applied within the ranges reported in Table 1, Table 2 and Table 3 to align with the measured data for inorganic suspended solids and sludge retention time. Since the sludge retention time was fixed according to the mass balance of the pilot plant, the concentration of inert solids in each reactor zone was primarily influenced by the adjustment of the VSS/TSS ratio, the f S I , and RAS. By adjusting the inert COD fraction, the model could accurately predict the soluble chemical oxygen demand in the effluent.
The model was calibrated to match the average concentrations of solids, dissolved oxygen, chemical oxygen demand, and nitrogen compounds in each reactor and the effluent, allowing for the derivation of stoichiometric and kinetic parameters for activated sludge modelling. Both manual and mathematical optimisation techniques can be utilised for model calibration using the GPS-X® software. In this study, a manual calibration approach was adopted. The initial estimates for stoichiometric and kinetic parameters were taken from the default values provided in GPS-X® for the ASM 1. Subsequent adjustments to these parameters during calibration were made to minimise the discrepancies between the predicted and observed values.

2.4. Simulation

Steady-state simulations of the pilot plant’s performance were conducted at a temperature of 20 °C, employing the kinetic and stoichiometric parameters derived from the calibrated steady-state model, with an influent flow rate of 60 L/h and the average influent characteristics presented in Table 4. Additionally, a constant dissolved oxygen concentration of 2.0 mg/L was maintained in the aerobic zone. The nutrient removal efficiency for each configuration was assessed by keeping the operating parameters constant while varying the parameters under investigation within specified ranges. The conditions for each simulation are detailed in Table 5. The aerobic volume fractions utilised were consistent with those applied during the experimental trials, as shown in Table 1.

3. Results and Discussion

3.1. Calibration

Prior to evaluating the performance of the submerged membrane bioreactor pilot plant using the model, the steady-state Activated Sludge Model 1 was calibrated via the GPS-X® software to establish the stoichiometric and kinetic parameters for each configuration. During the calibration process, operational parameters such as sludge recycling, wastage, and influent wastewater characteristics were adjusted to align the predicted concentrations of mixed liquor solids with the observed values. The adjusted values for sludge waste, return activated sludge, and influent characteristics are presented in Table 6. Variations from the average sludge waste and recycling flows were anticipated due to daily short-duration wastage and variability in return activated sludge. COD fractions were estimated once for each pilot trial; therefore, the results in Table 3 should not be regarded as averages for the entire study period. Consequently, modifications were made to the inert fraction of COD to reconcile the available solid data.
After adjusting the MLVSS concentrations, the chemical oxygen demand and nitrogen profiles and effluent quality were utilised to refine the model parameters further. The stoichiometric and kinetic parameters derived from the calibration process of the ASM 1 are summarised in Table A1. The measured and simulated results for Runs No. 1 to 4 are compiled in Table A2, Table A3, Table A4 and Table A5. These tables indicate that the results for suspended solids, ammonia concentrations, and nitrate profiles closely align with the measured data. However, the filtered COD profiles did not correspond well with the measured values. Nearly all chemical oxygen demand was consumed in the first reactor, resulting in denitrification that was reliant on decay reactions and the utilisation of slowly biodegradable substrates. The concentration values for nitrogen oxides were estimated by adjusting the anoxic hydrolysis rate factor and the saturation coefficient for oxygen. Applying separate yields for aerobic and anoxic heterotrophs did not significantly influence the COD or nitrate profiles. Notably, the influent ammonia concentrations for Configurations No. 1 and No. 2 (Runs No. 1 to No. 3) exceeded 40 mg/L. High influent ammonia levels can impact model predictions since the Monod equation may not accurately represent the nitrification kinetics under such conditions [35]. Nevertheless, a close correspondence between the simulated and measured NH3 and nitrate profiles was observed, as detailed in Table A2, Table A3, Table A4 and Table A5.
The initial stoichiometric and kinetic parameters for chemical oxygen demand and nutrient removal were sourced from reference [28] as default values for the Activated Sludge Model 1; it is noteworthy that the most sensitive parameters were selected to minimise the number of modifications during the steady-state calibration process. The parameters adjusted during the steady-state calibration are listed in Table A1. Y H values were derived by fitting the VSS data, with the assumption that the formation of autotrophic biomass in the bioreactor was minimal compared to heterotrophic biomass.
The obtained Y H values were lower than typical values due to the higher sludge retention time tested across all configurations. This phenomenon is attributed to microorganisms primarily utilising available substrates for maintenance purposes [19,36]. Similar yield coefficients for heterotrophic organisms have been reported in SMBR processes [27,36,37].
The decay rate for heterotrophic biomass ( b H ) was found to be lower than the values typically reported for conventional activated sludge processes [38,39]. Research has indicated that the decay rate of heterotrophic bacteria can decrease in the absence of grazing organisms in activated sludge, falling below 0.1 d−1 [38,40]. Conversely, reference [19] found that submerged membrane bioreactor systems are almost devoid of protozoa and metazoans. Hence, the b H values determined for activated sludge from submerged membrane bioreactor systems operated at a high sludge retention time are expected to be lower than those typically used in the ASM 1.
Table A1 also indicates that the decay rates for autotrophic organisms ( b A ) are higher than those generally assumed for the ASM 1. Recent studies have reported b A values significantly higher than those commonly utilised in modelling and design [33]. Decay rates ranging from 0.15 to 0.40 d−1 have been documented when denitrification is incorporated into conventional nitrifying activated sludge systems, accounting for predation effects [25]. The impact of high sludge retention time and complete retention of autotrophic biomass on nitrification rates remains an area of ongoing research due to the widely varying results reported in the literature [33,41,42]. One possible explanation for the elevated decay values is that heterotrophic bacteria may outcompete autotrophic bacteria without predation.
Despite the adjustments made to the μ A , the nitrogen oxide concentration in the effluent did not decrease sufficiently to match the measured data. Consequently, the coefficients K O H   and K O A   needed to be adjusted to accurately predict the profiles of ammonia and nitrogen oxides across the three configurations. The K O H and K O A values presented in Table A1 deviate from typical values, likely due to the specific hydraulic conditions in the submerged membrane bioreactor pilot plant. Submerged membrane bioreactor processes operate at high concentrations of mixed liquor suspended solids, which increase sludge viscosity and alter the oxygen mass transfer rate. Consequently, the simultaneous nitrification and denitrification processes can be affected by limitations in oxygen diffusion within the floc [43]. Significant alterations in oxygen saturation coefficients during the calibration of activated sludge models have also been noted in the literature [22,34,43]. Reference [22] examined the influence of membrane separation and mass transfer on nitrifier kinetics by conducting parallel runs of SMBR and CAS plants. The authors observed substantial differences in the half-saturation constants for oxygen ( K O A ) between the two processes, with an average value of 0.18 gO2/m3 for the submerged membrane bioreactor, which is consistent with the findings of this study. Reference [22] attributed the lower K O A value to the small floc size in the submerged membrane bioreactor, where diffusion resistance can be largely neglected.
The disparities between the generally accepted biokinetic parameters in the Activated Sludge Model 1 and those obtained in this investigation are crucial for the modelling and design of SMBRs. Increasing SRT elevates solid concentration and induces changes in the microbial community within the activated sludge, which are reflected in the stoichiometric and kinetic parameters.

3.2. N-REM Performance

The kinetic and stoichiometric parameters outlined in Table A1 and the influent wastewater characteristics presented in Table 4 were employed to assess the nutrient removal performance of each SMBR process configuration. The impact of sludge retention time on the simulated NH3 and NO3 effluent from all configurations is illustrated in Figure A1. In contrast, the variations in heterotrophic and autotrophic biomass concentrations are shown in Figure A1. The total effluent COD consistently approximates the soluble inert COD value (23 mgCOD/L) since complete solid removal is assumed to occur within the submerged membrane bioreactor. The trends depicted in Figure A2 demonstrate that effluent ammonia levels decrease as the SRT increases for all configurations, stabilising after SRT = 20 d. Figure A2 indicates that increasing the SRT beyond 20 d leads to a slight rise in both heterotrophic and autotrophic biomasses, resulting in no significant improvement in nitrogen removal. Configuration No. 1 exhibits a notable advantage in ammonia nitrogen removal, demonstrating the lowest NH3 effluent at lower sludge retention time values. However, Configurations No. 1 and No. 3 show higher nitrate effluent concentrations, while Configuration No. 2 consistently maintains a NO3 concentration below 1.5 mgN/L.
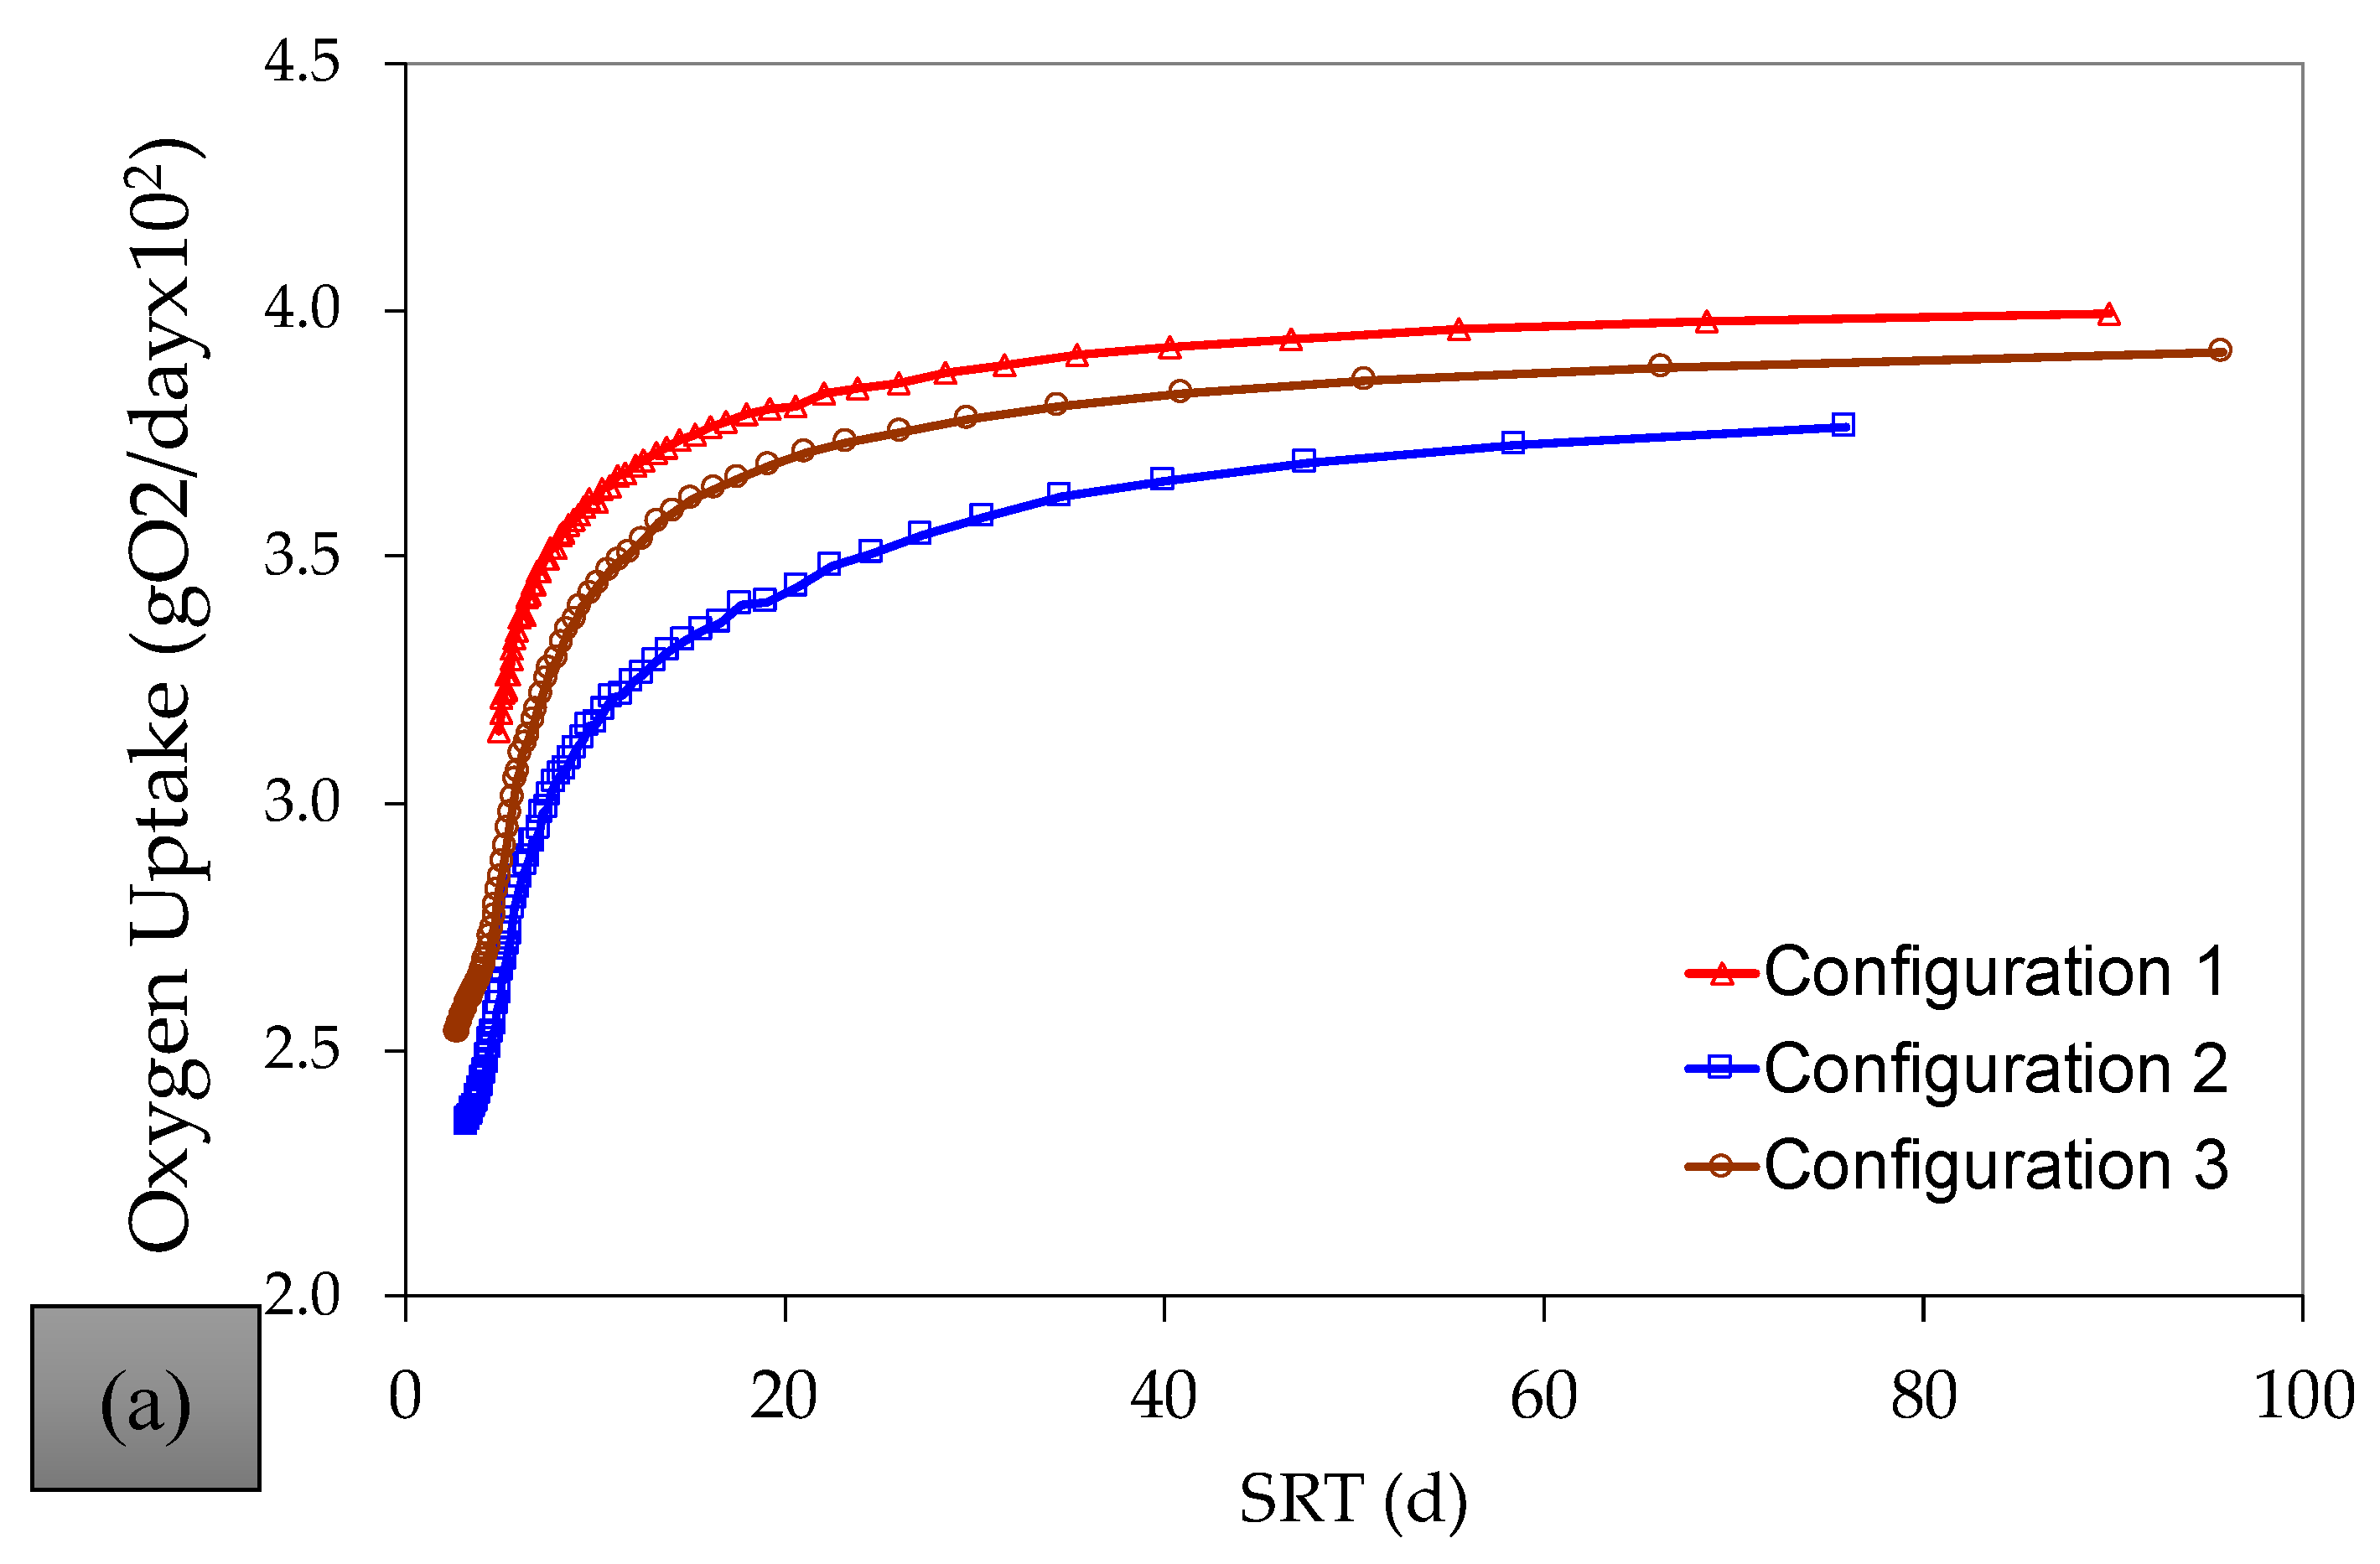
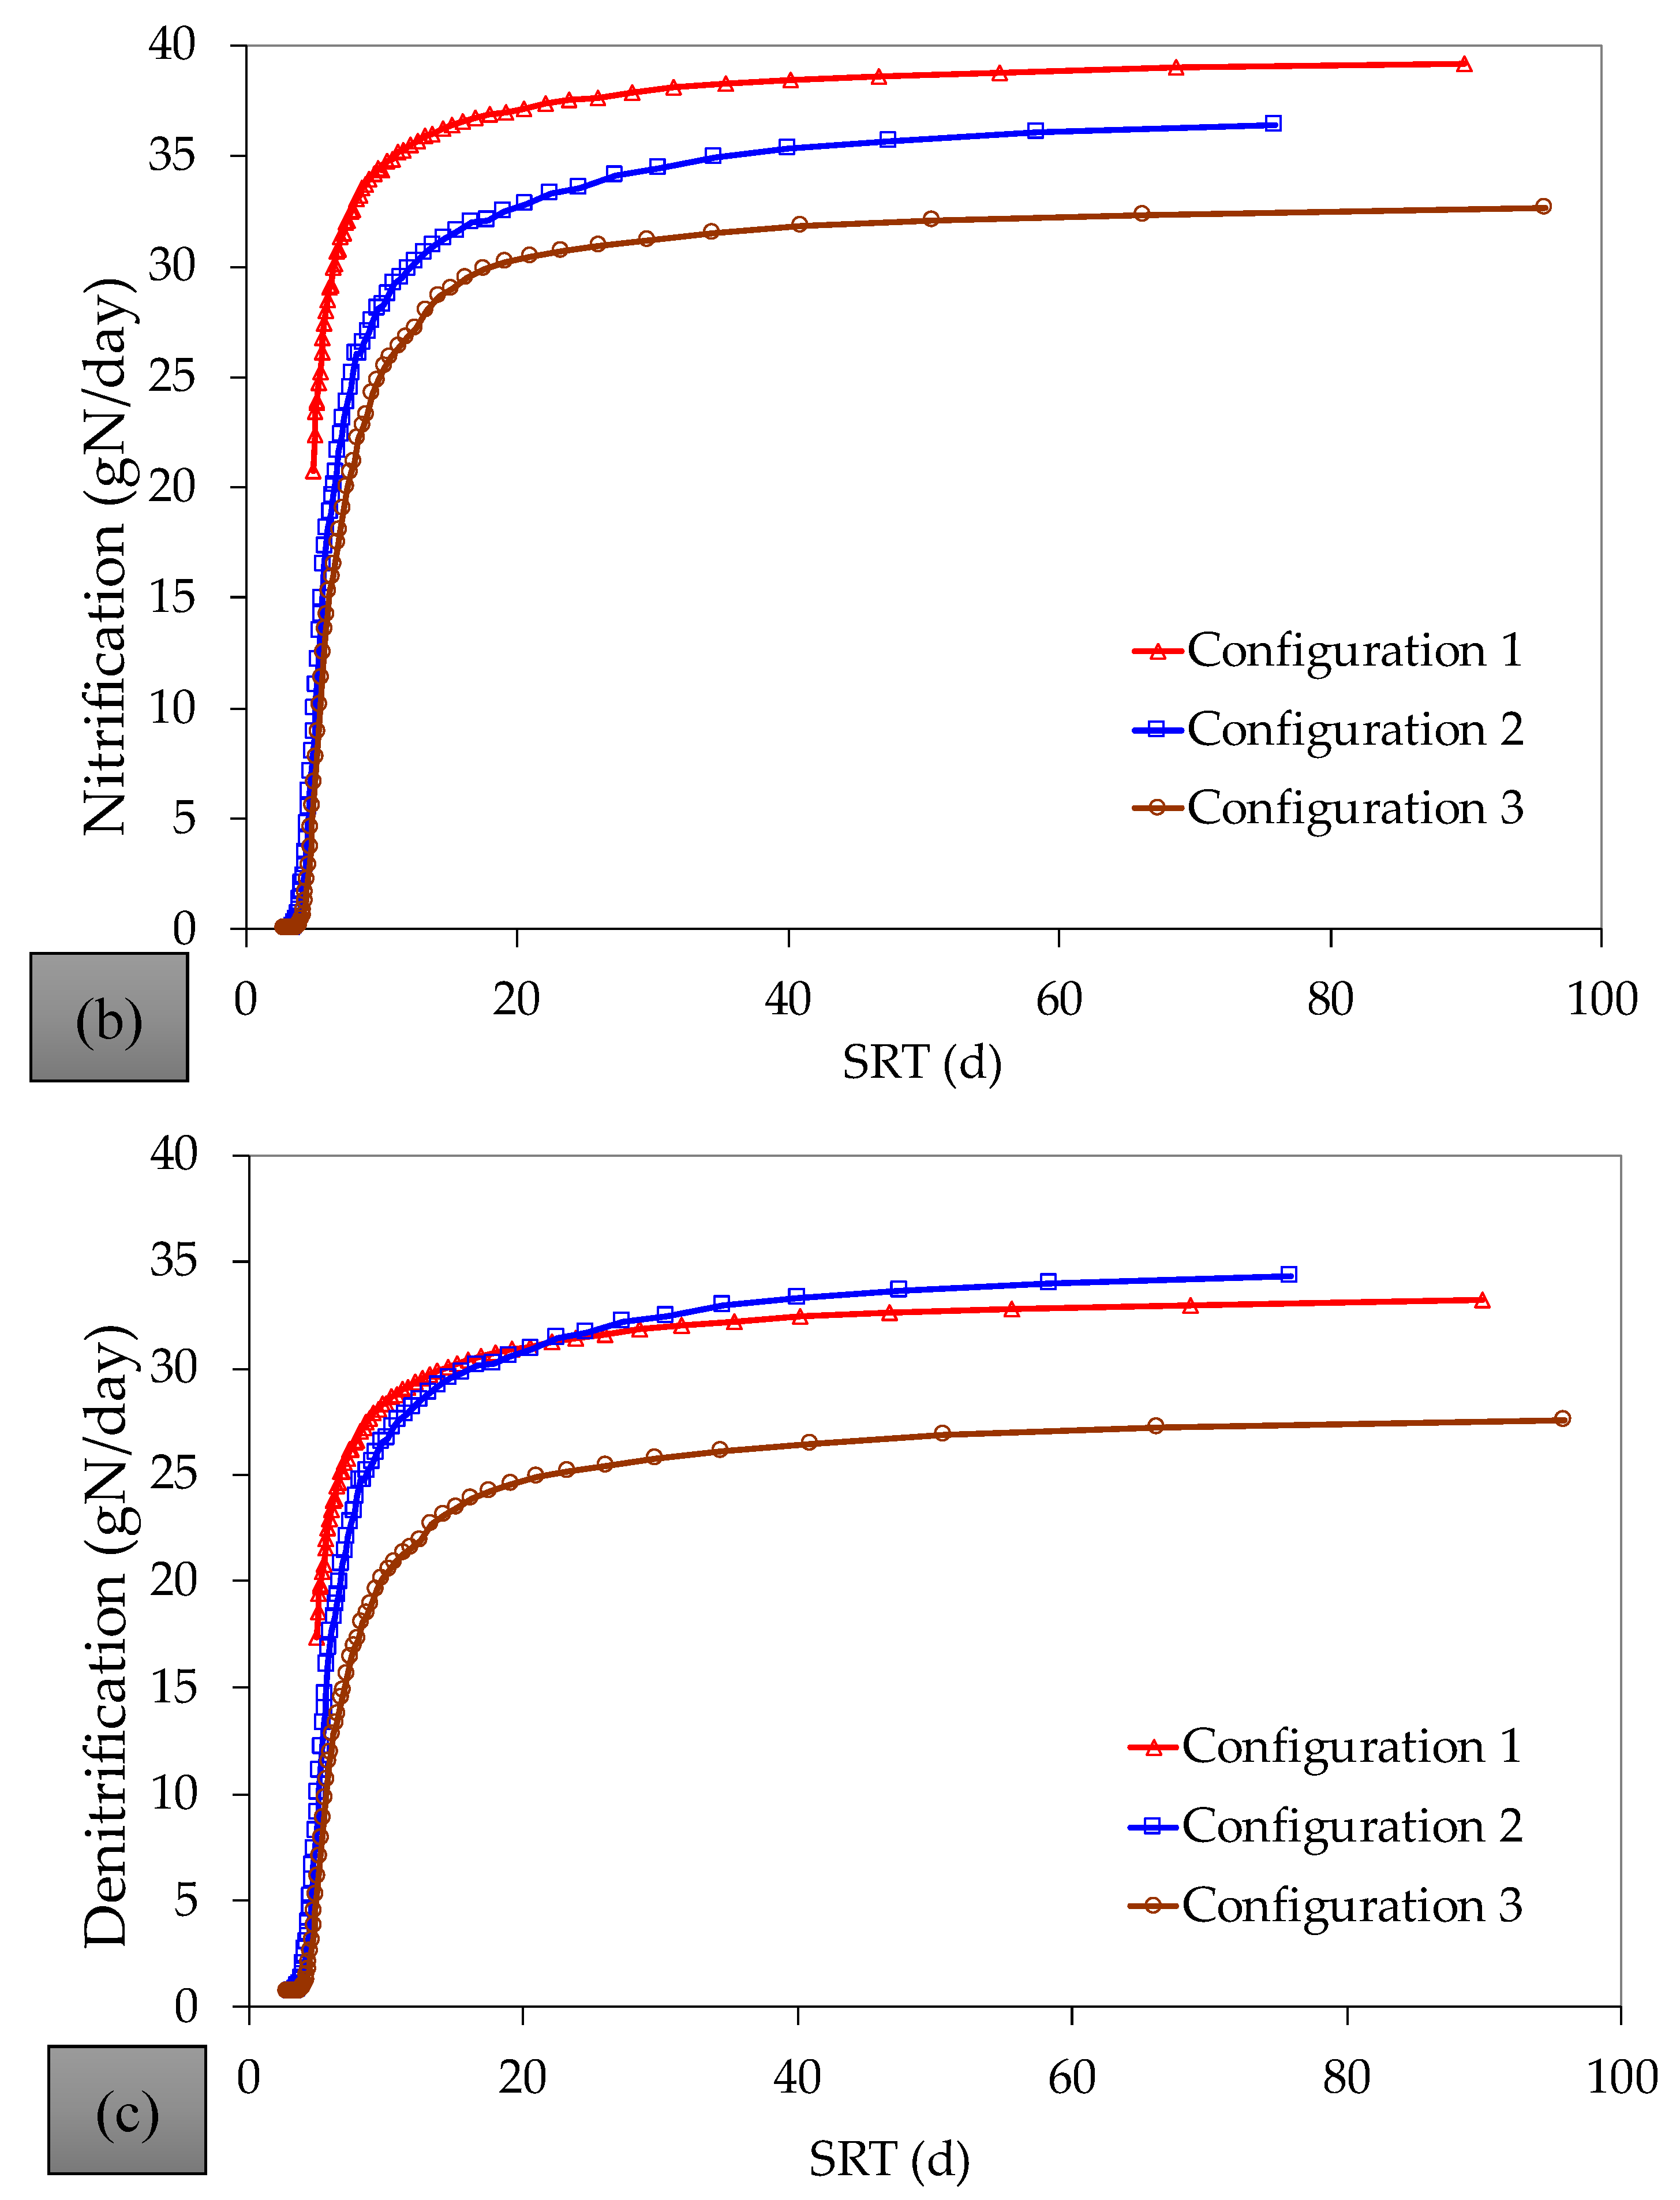
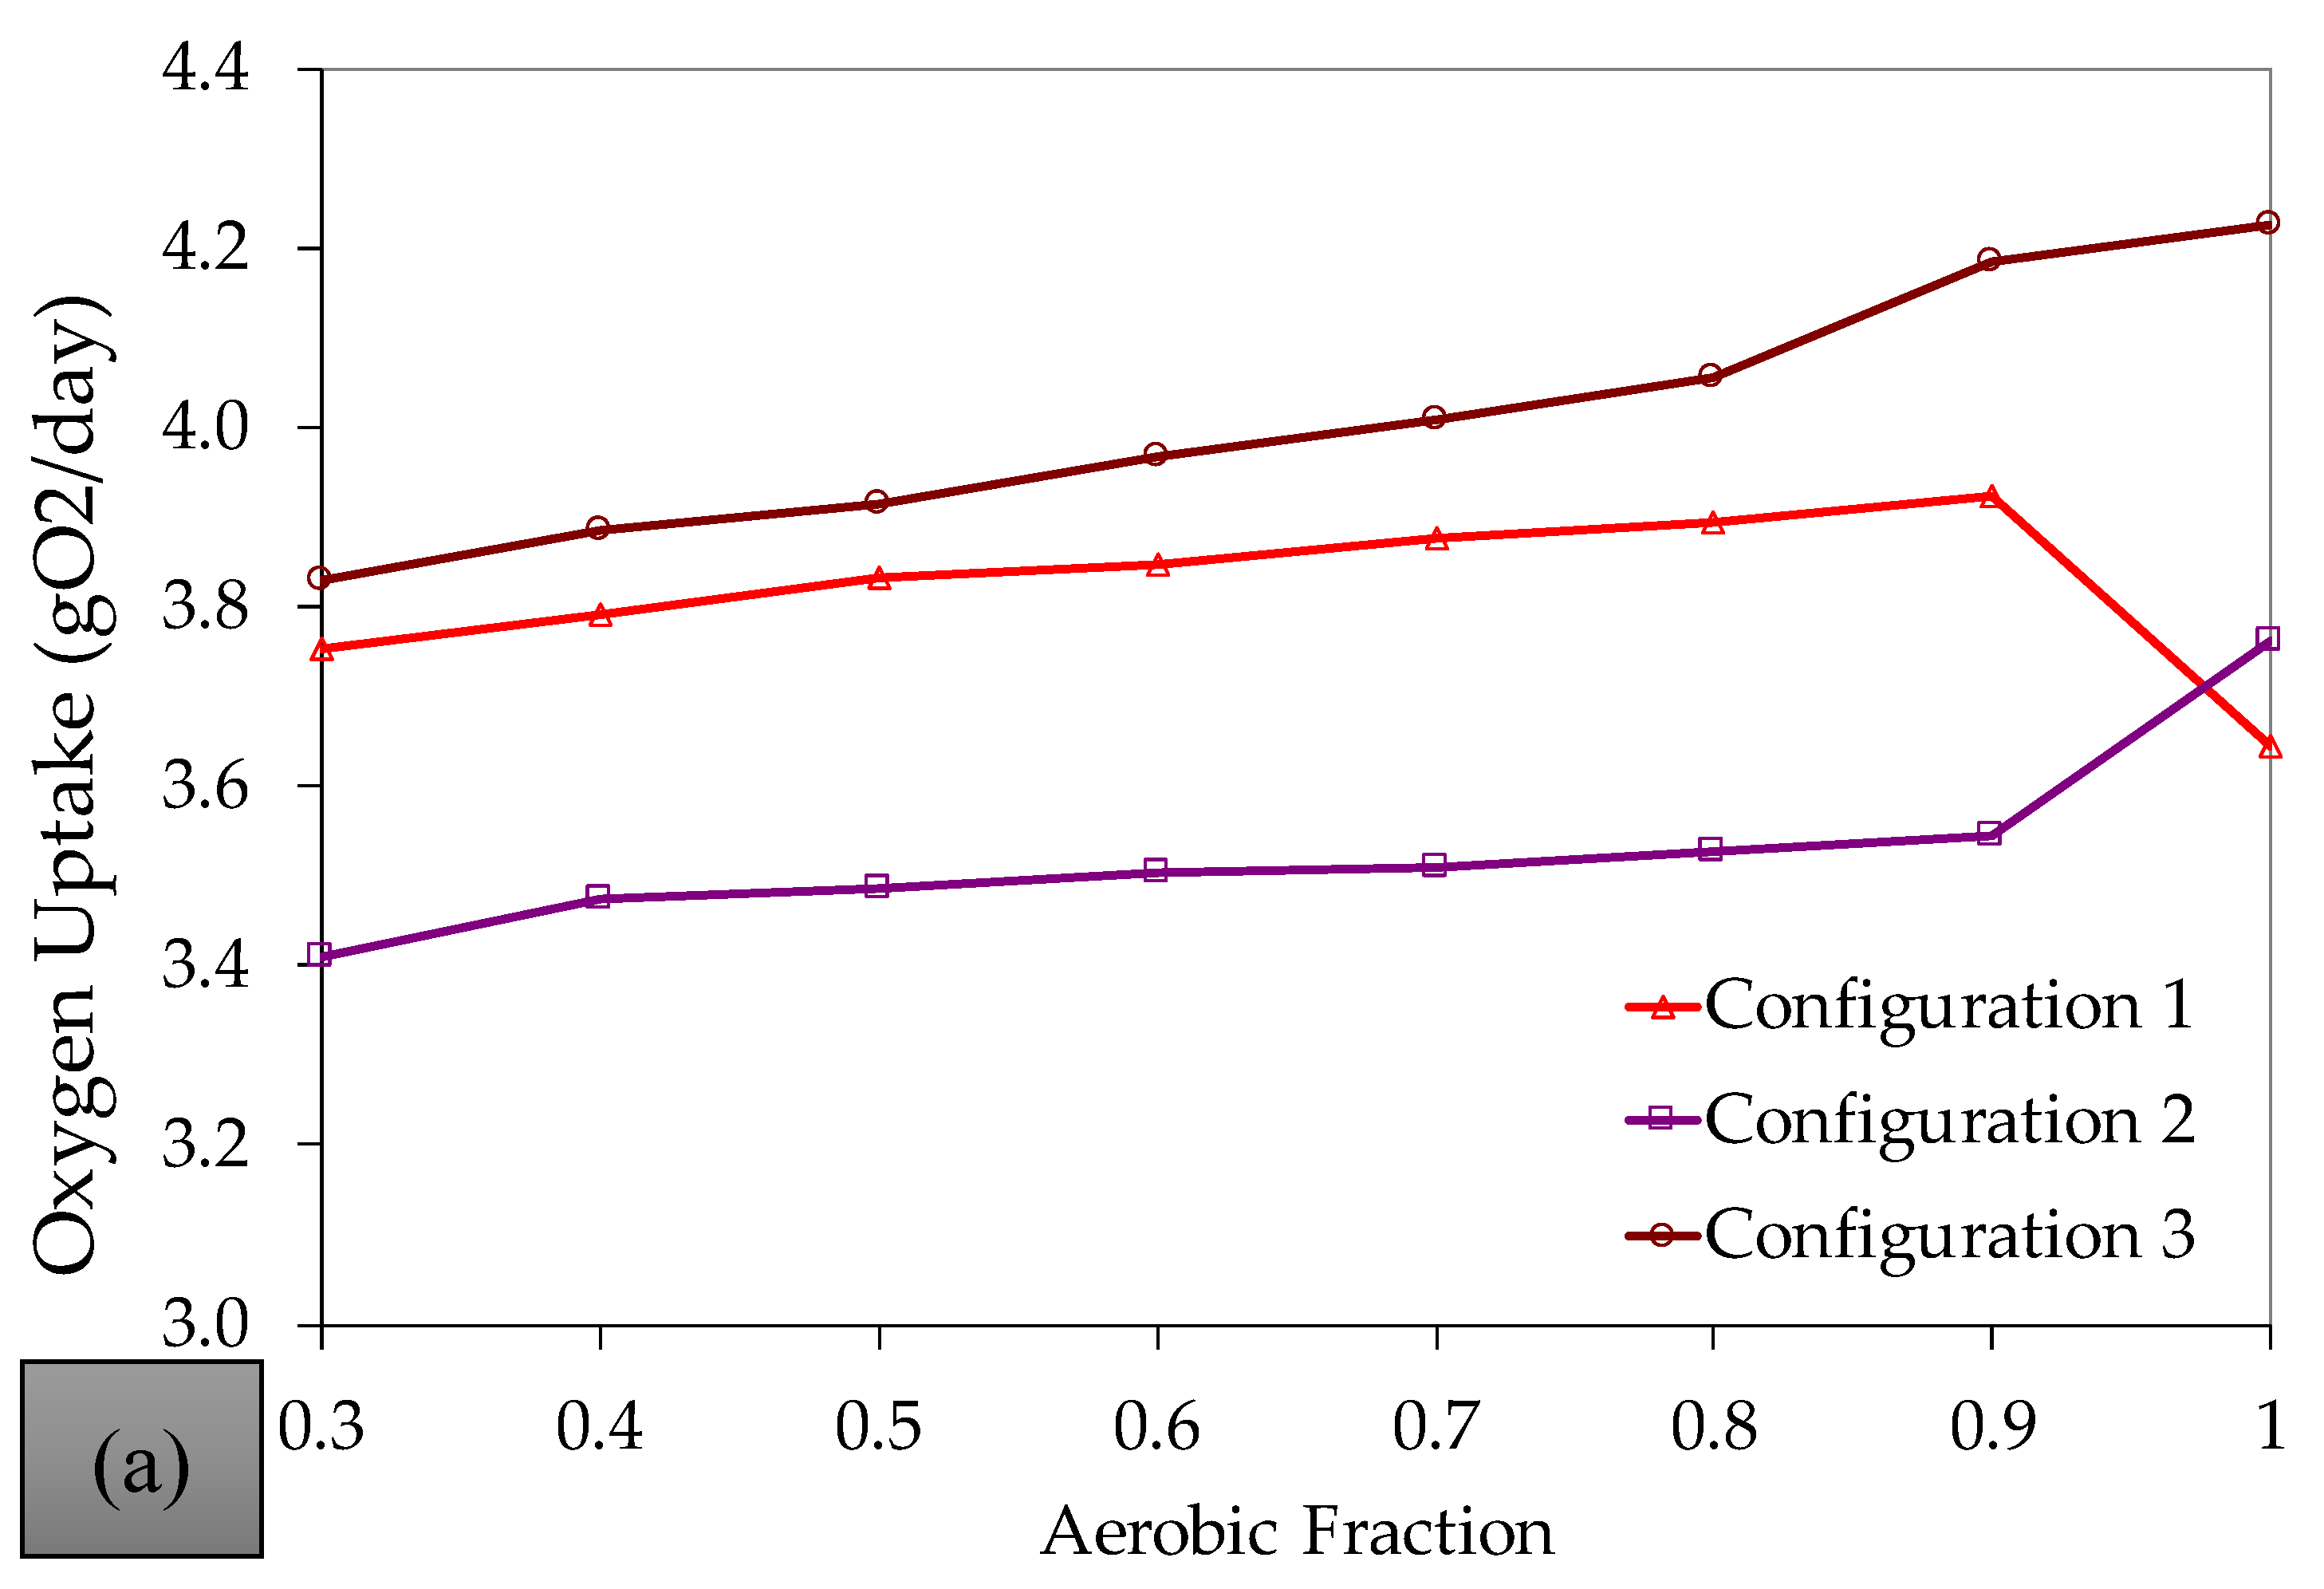
Oxygen uptake during the aerobic process was derived from model simulations. Figure A3 illustrates the variation in oxygen consumption with sludge retention time for all configurations. Oxygen consumption in Configuration No. 2 is approximately 20% lower than in Configurations No. 1 and No. 3. This lower oxygen uptake in Configuration No. 2 can be attributed to nitrate serving as an electron acceptor during organic carbon oxidation, reducing the requirement for DO. Configurations No. 1 and No. 3 exhibit higher oxygen consumption due to the lower sludge production and higher ammonia removal rates. After SRT = 60 d, oxygen uptake becomes similar across the three configurations. The initial differences during short SRT periods are primarily due to variations in the maximum growth rate of autotrophs.
Additionally, Figure A3 highlights the nitrification and denitrification performance. Configuration No. 1 clearly shows the highest NH3 and NO3 removal rates. It is also observed that the nitrification and denitrification rates become nearly constant after SRT = 20 d. Increasing the sludge retention time leads to an accumulation of inert biomass and higher operational costs in SMBRs. If no significant improvements are seen beyond 20 d, this duration should be considered the maximum recommended SRT.
Various studies in the literature support these findings. Yilmaz et al. (2023) [10] found that shorter SRT values (10–20 d) can be employed in aerobic membrane bioreactors without compromising performance. Additionally, other pilot studies identified optimal operating conditions with SRTs ranging between 20 and 25 d [11,44]. Moussa et al. (2005) [45] developed a mathematical model that describes the interactions among heterotrophic and autotrophic bacteria and predators in wastewater treatment. Their validated model indicates that the active biomass peaks at an SRT of 40 d, suggesting that further increases do not enhance performance [45]. Conversely, reference [46] presented a mathematical model predicting membrane biofouling in submerged membrane bioreactor systems, indicating that increased sludge age diminishes microbial activity. The simulation revealed no significant reduction in extracellular polymeric substance (EPS) and soluble microbial product (SMP) concentrations after 20 d of SRT [46]. Comparable observations have been reported in the literature [3,47].
Experimental studies have also corroborated some of these results. Reference [48] explored the effects of sludge retention time (ranging from 3 to 20 d) on organic and nitrogen removal in an anoxic/oxic SMBR for treating domestic wastewater. The authors found that nearly complete organic removal was achieved regardless of sludge retention time, while denitrification performance depended on the operating SRT. Notably, Ng et al. (2006) [48] reported that SRT did not influence nitrification, which contrasts with the model results presented herein. In contrast, other investigations observed that nitrification decreased at a 2 d SRT but remained unaffected at higher sludge retention times when studying the performance of a submerged membrane bioreactor pilot plant treating municipal wastewater at SRTs between 30 and 2 d [23]. Variations in metabolic activities and floc structure are believed to play a significant role in nitrification performance at shorter SRTs [15,23].
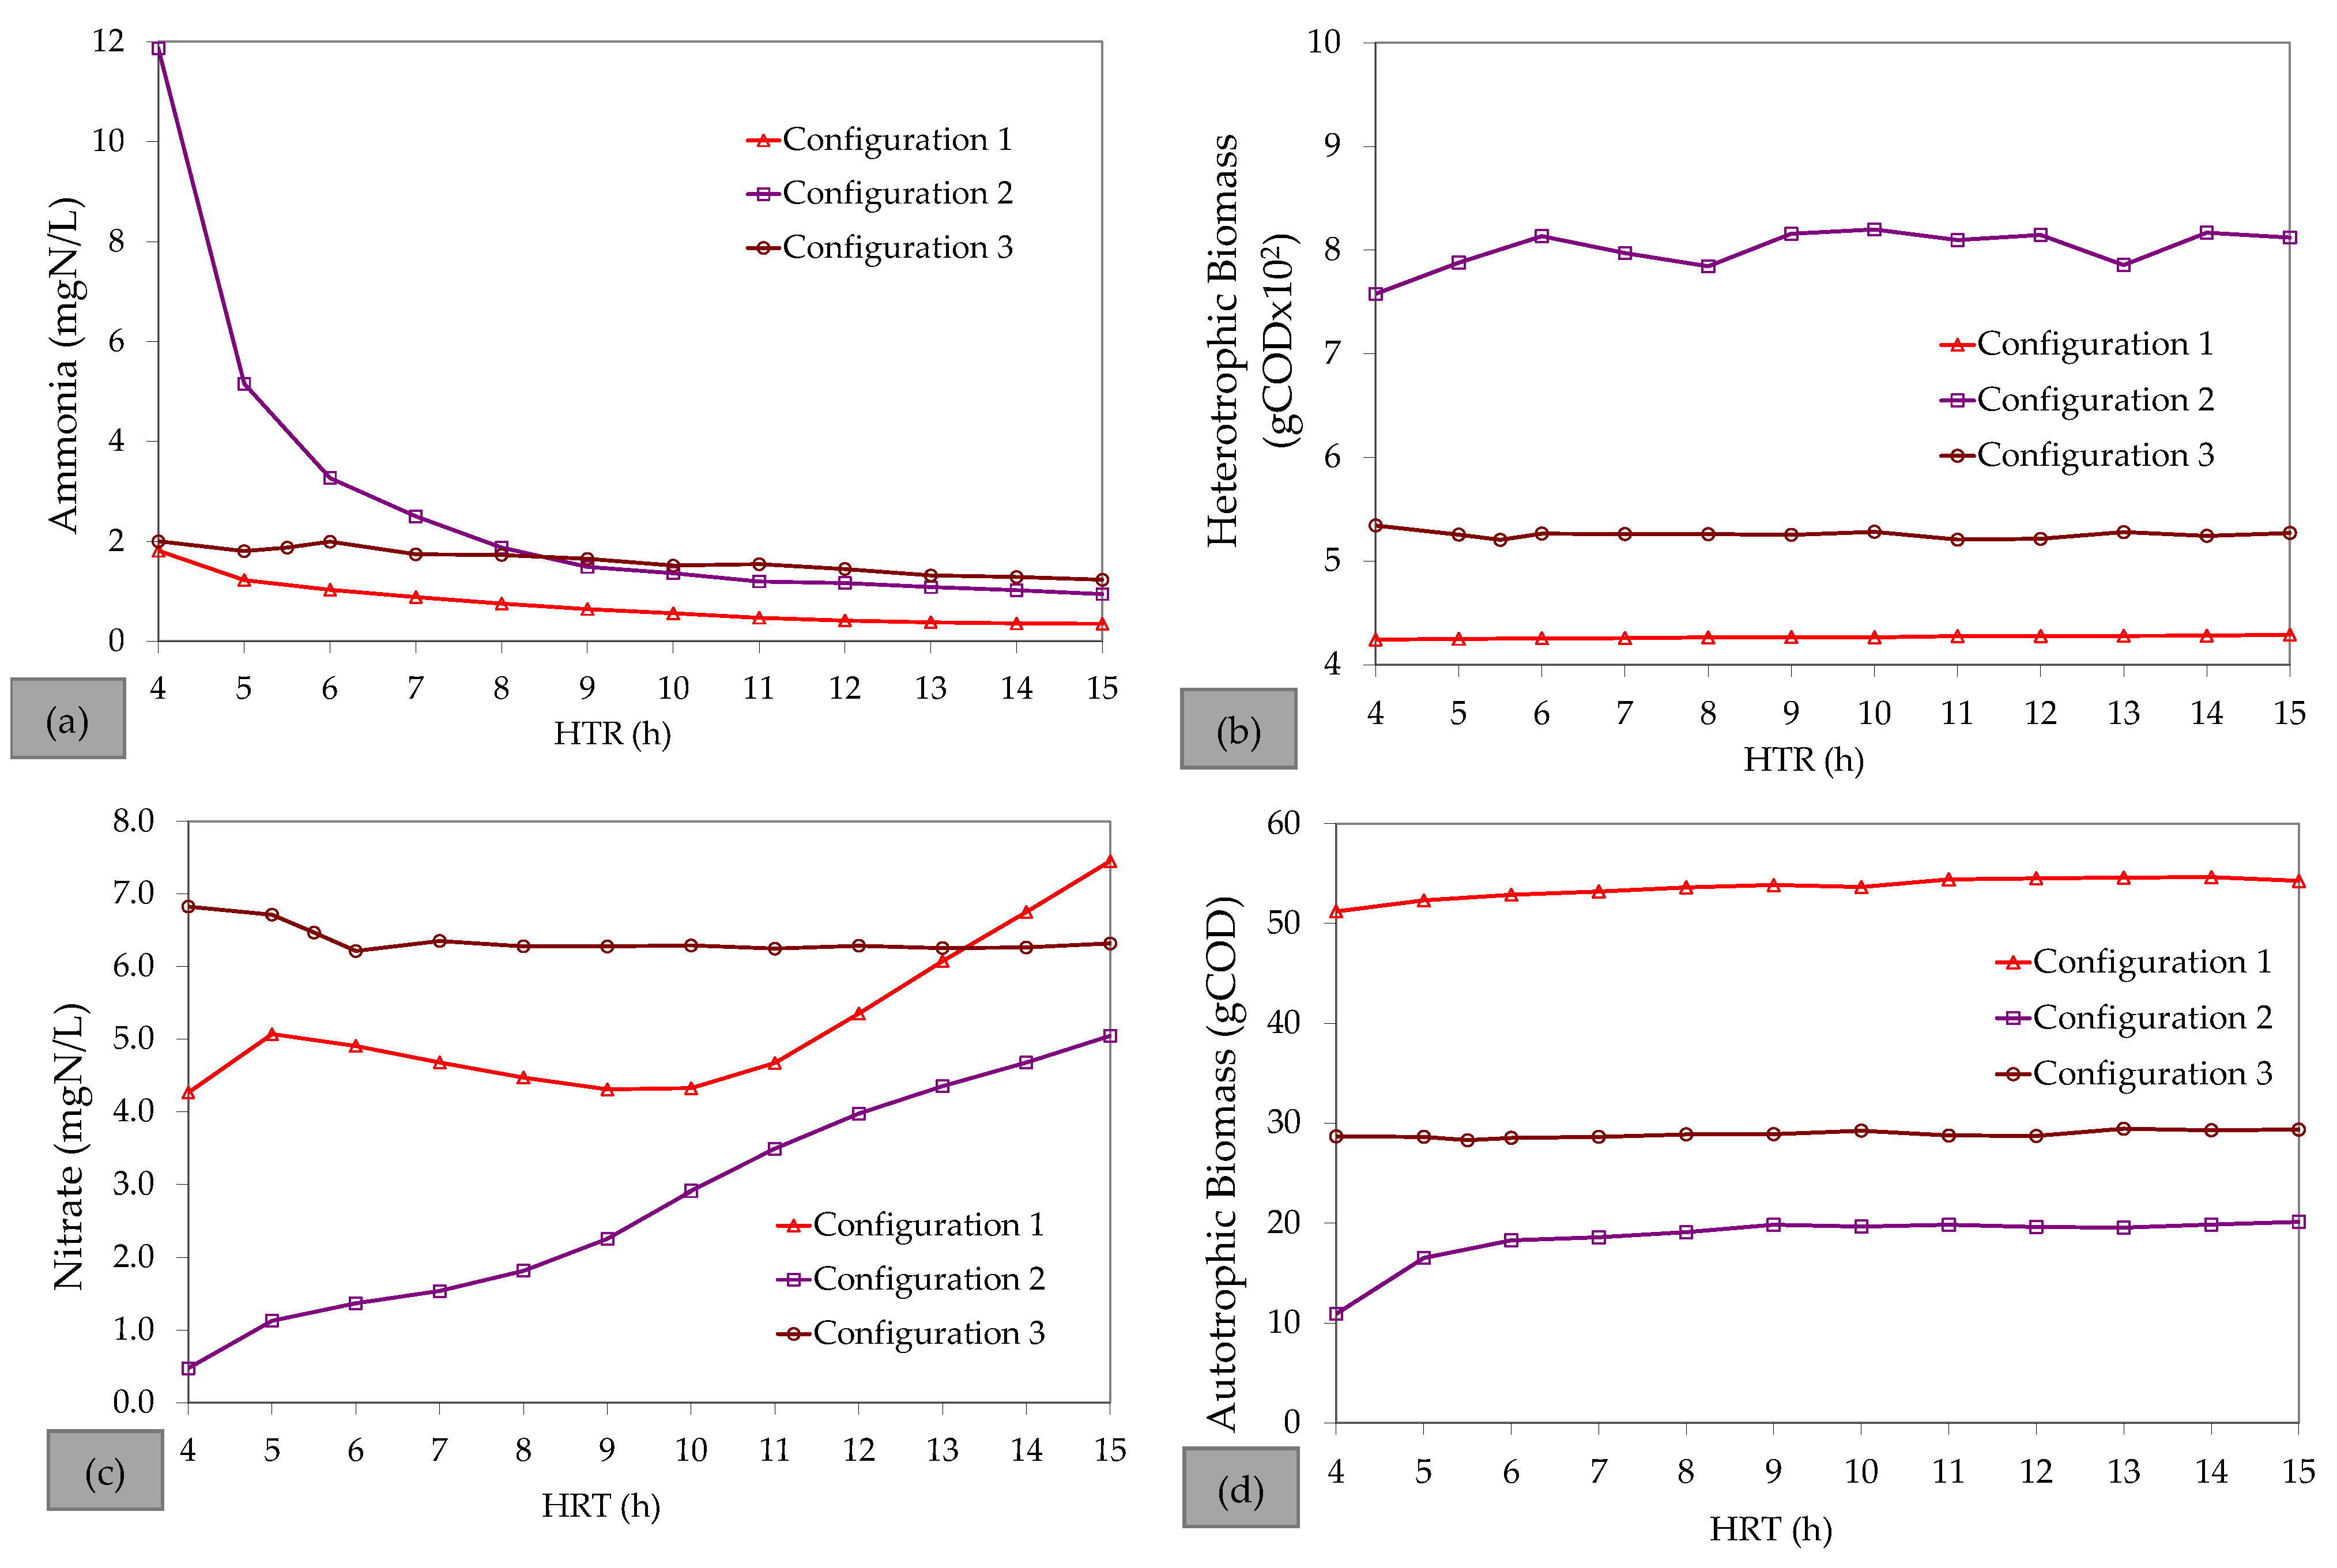
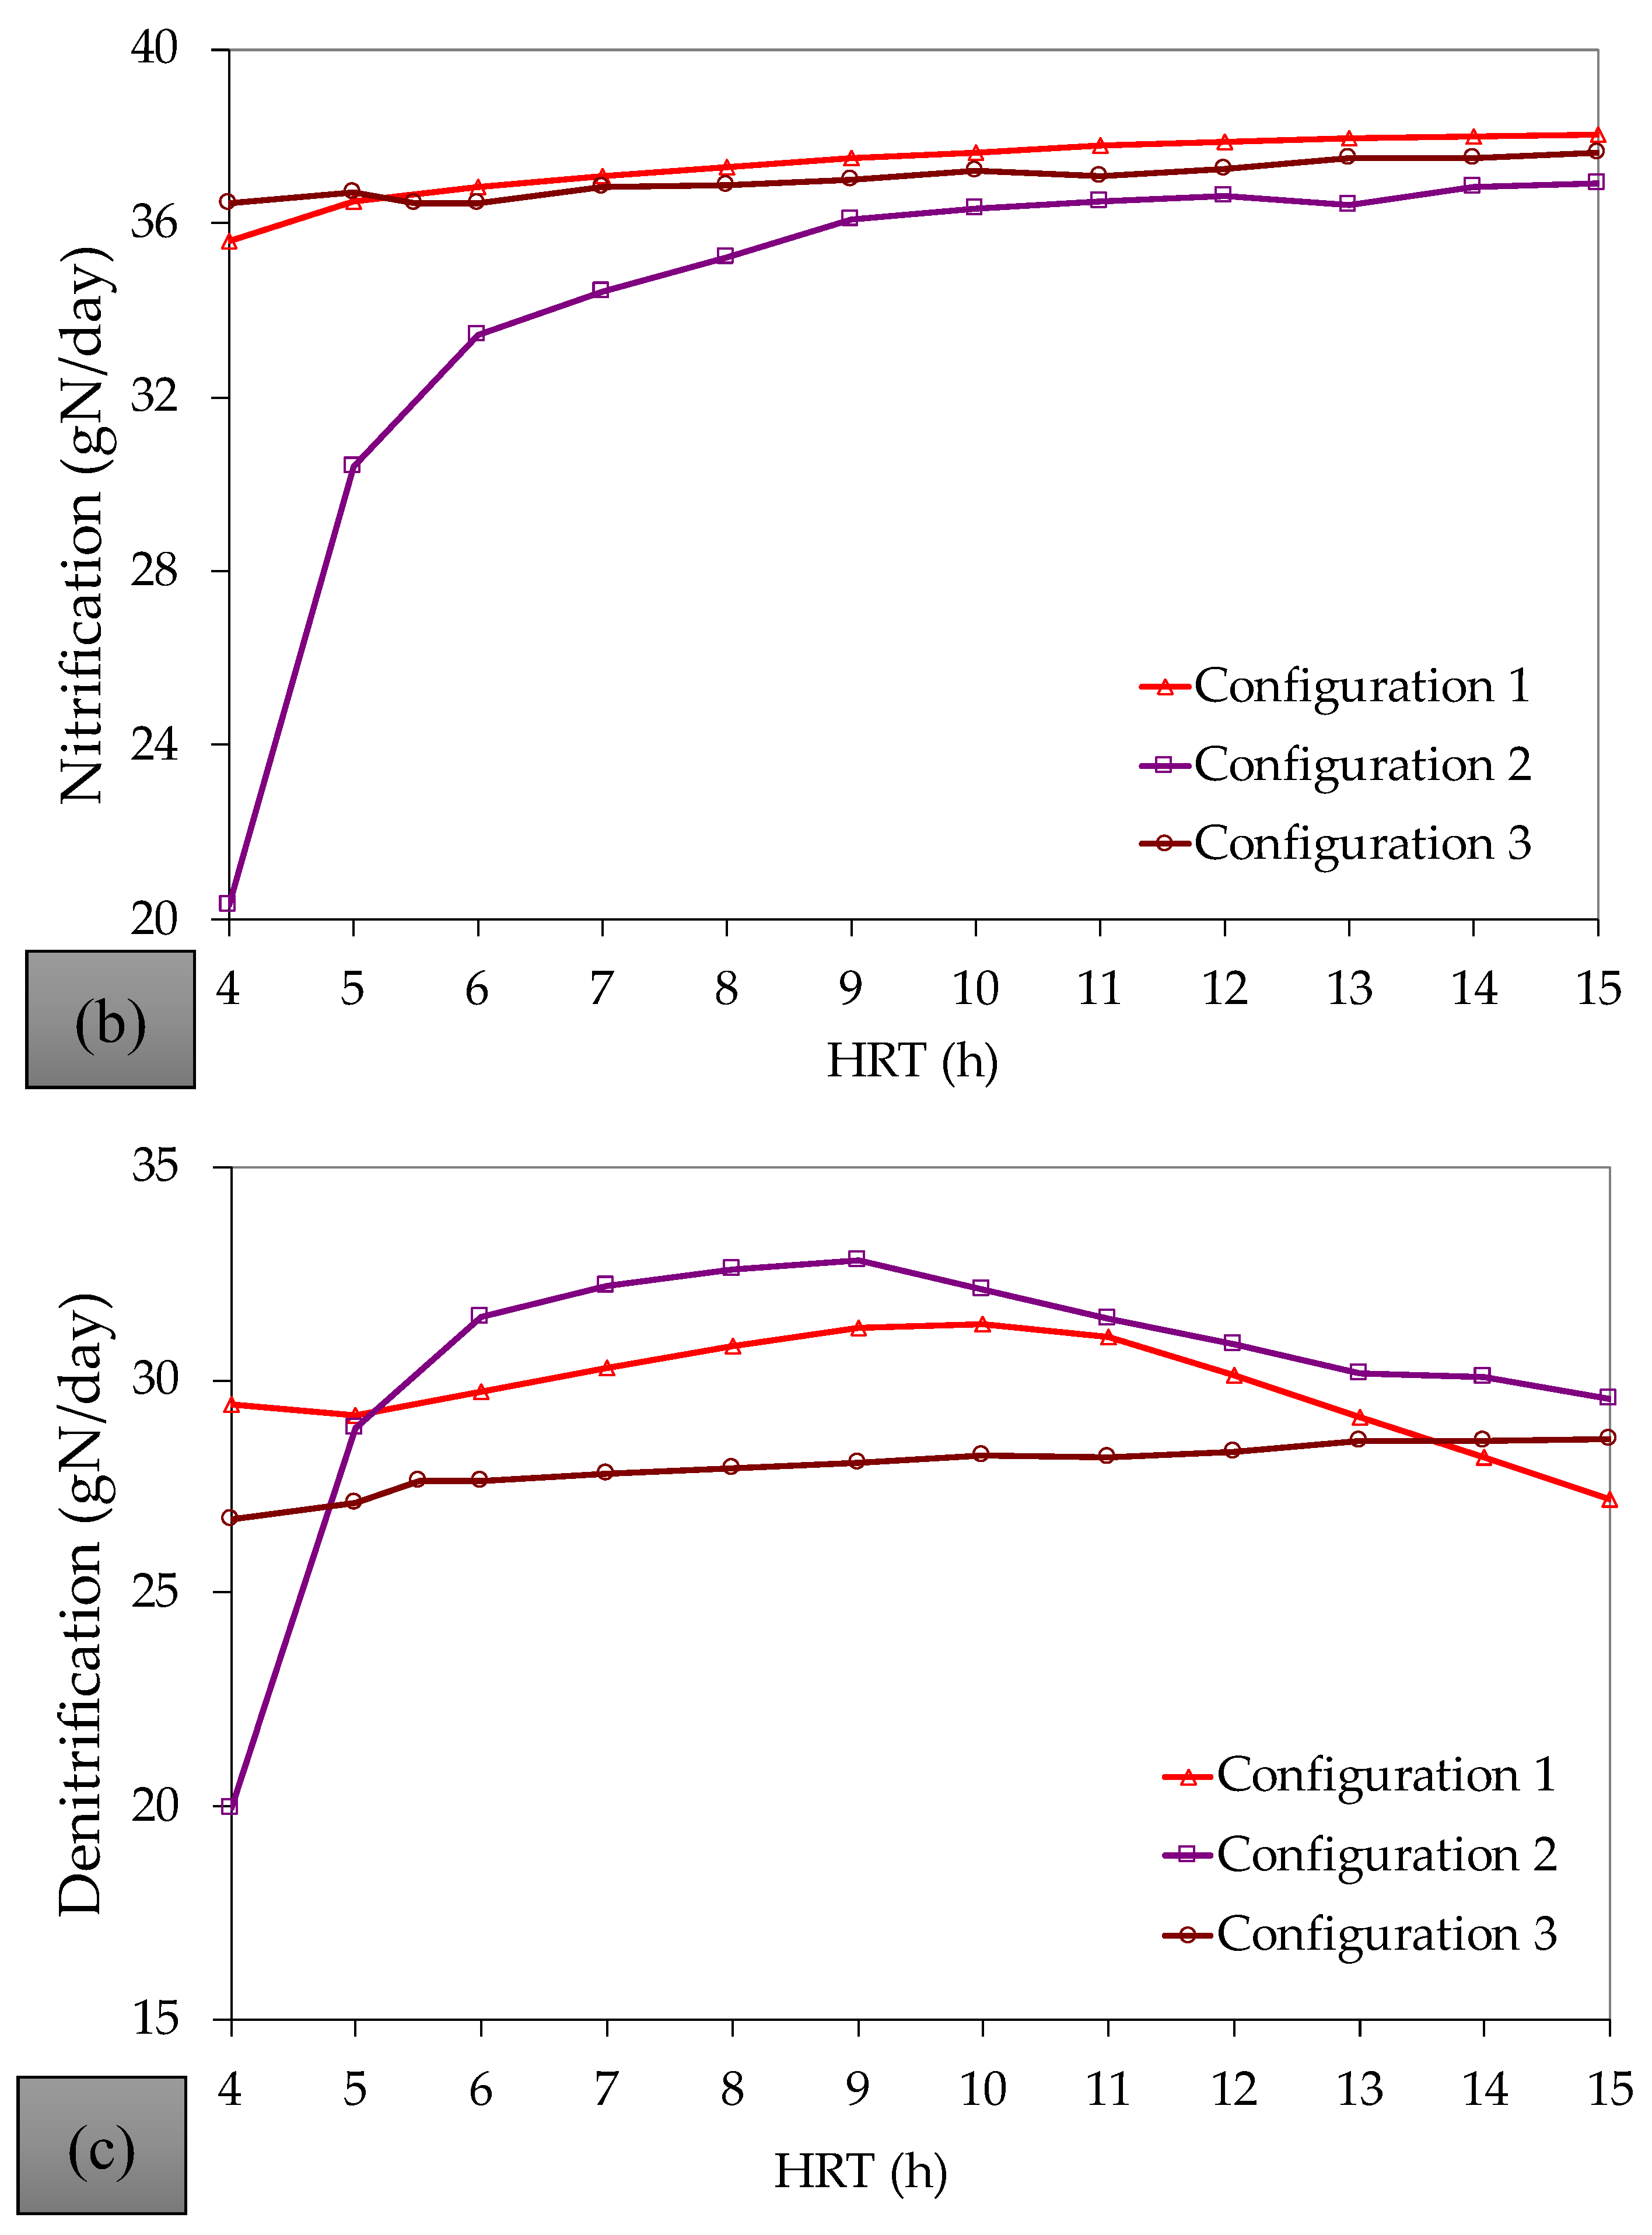
Figure A4 illustrates the impact of hydraulic retention time on nutrient performance across all analysed configurations. With an influent flow rate of 60 L/h and a sludge retention time set to 20 d, hydraulic retention time was increased from 4 to 15 h by adjusting the volumes of each reactor zone accordingly. Figure A4 shows that the total concentrations of heterotrophic and autotrophic biomasses remained unchanged with varying HRTs, with decreasing biomass concentration as HRT increased. Configuration No. 3 exhibited no variation in effluent NH3 and NO3 concentrations with changes in hydraulic retention time. Conversely, Configuration No. 2 demonstrated the most significant reduction in NH3 and increased NO3 effluent concentrations as HRT was increased.
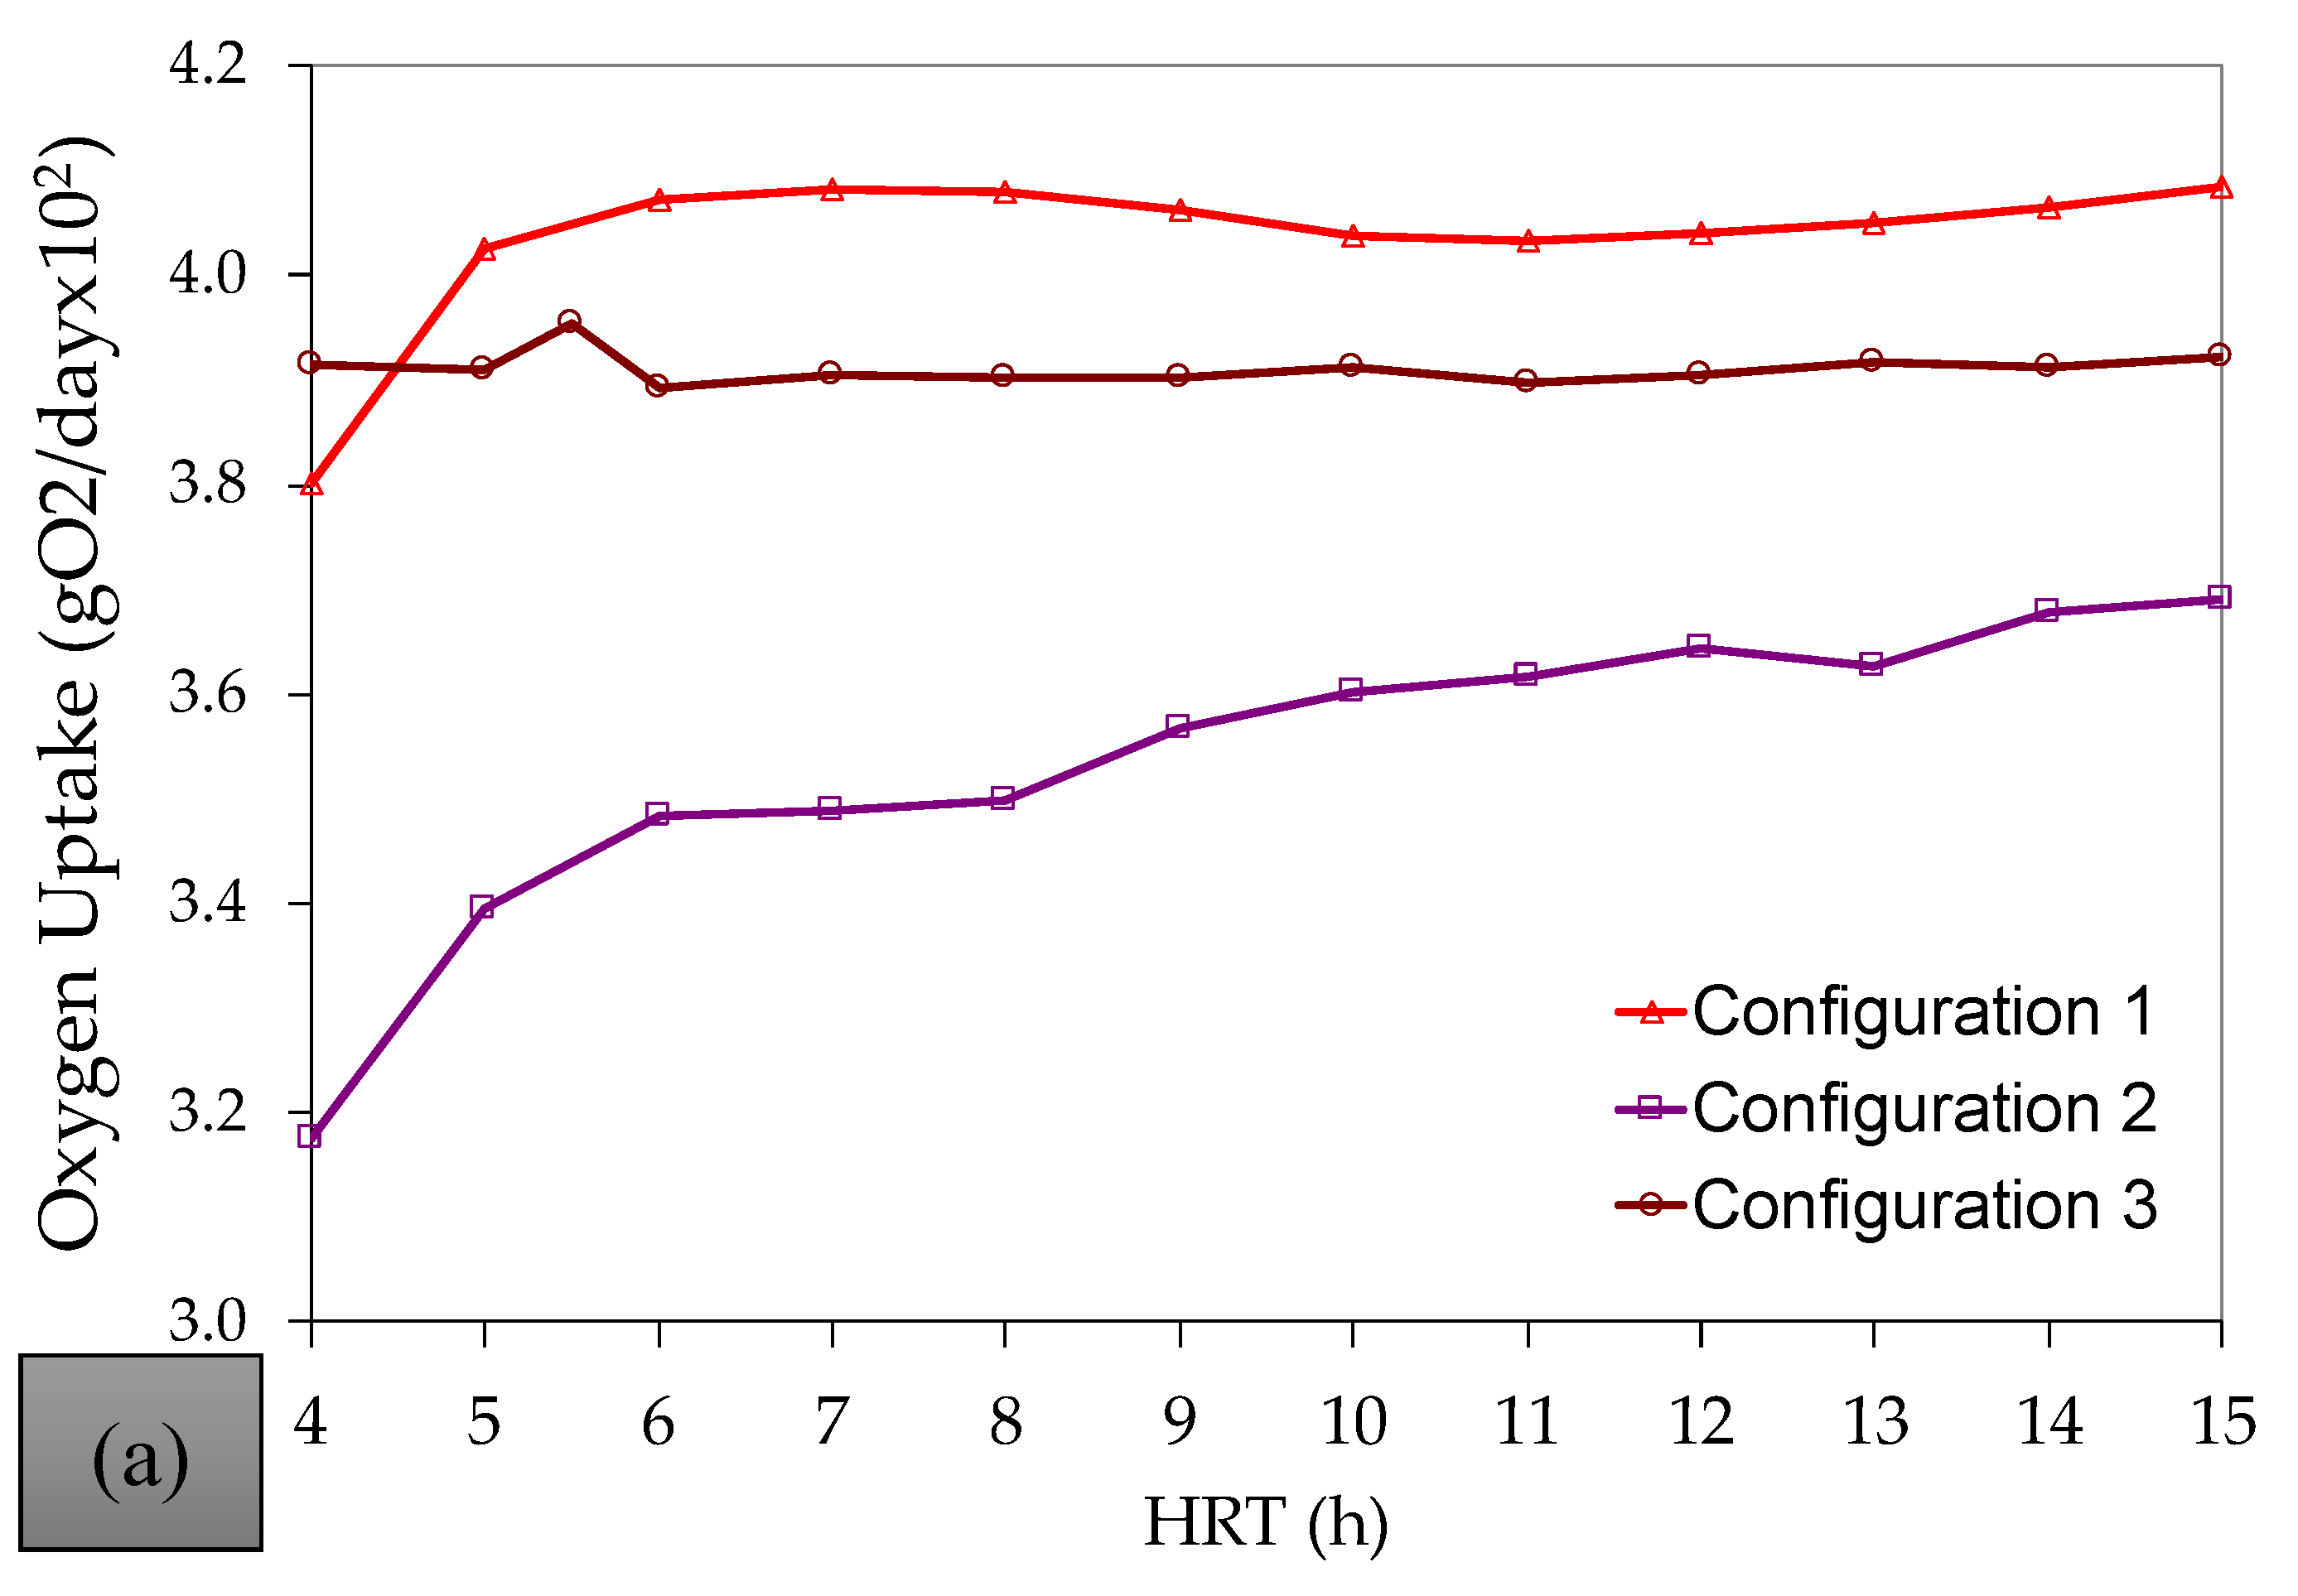
HRT can be optimised based on influent characteristics and reactor arrangements [16,47,49]. Figure A5 illustrates the effects of hydraulic retention time ranging from 4 to 15 h on oxygen uptake, nitrification, and denitrification for Configurations No. 1 to No. 3. Oxygen uptake was higher for Configurations No. 1 and No. 3 due to the presence of an aeration zone before the submerged membrane bioreactor, while Configuration No. 2 displayed lower oxygen consumption. At an HRT of eight hours, the nitrification and denitrification rates were relatively similar across all configurations. Therefore, if no significant improvements are noted by increasing HRT beyond 8 h, this duration should be the upper limit suggested for the analysed configurations.
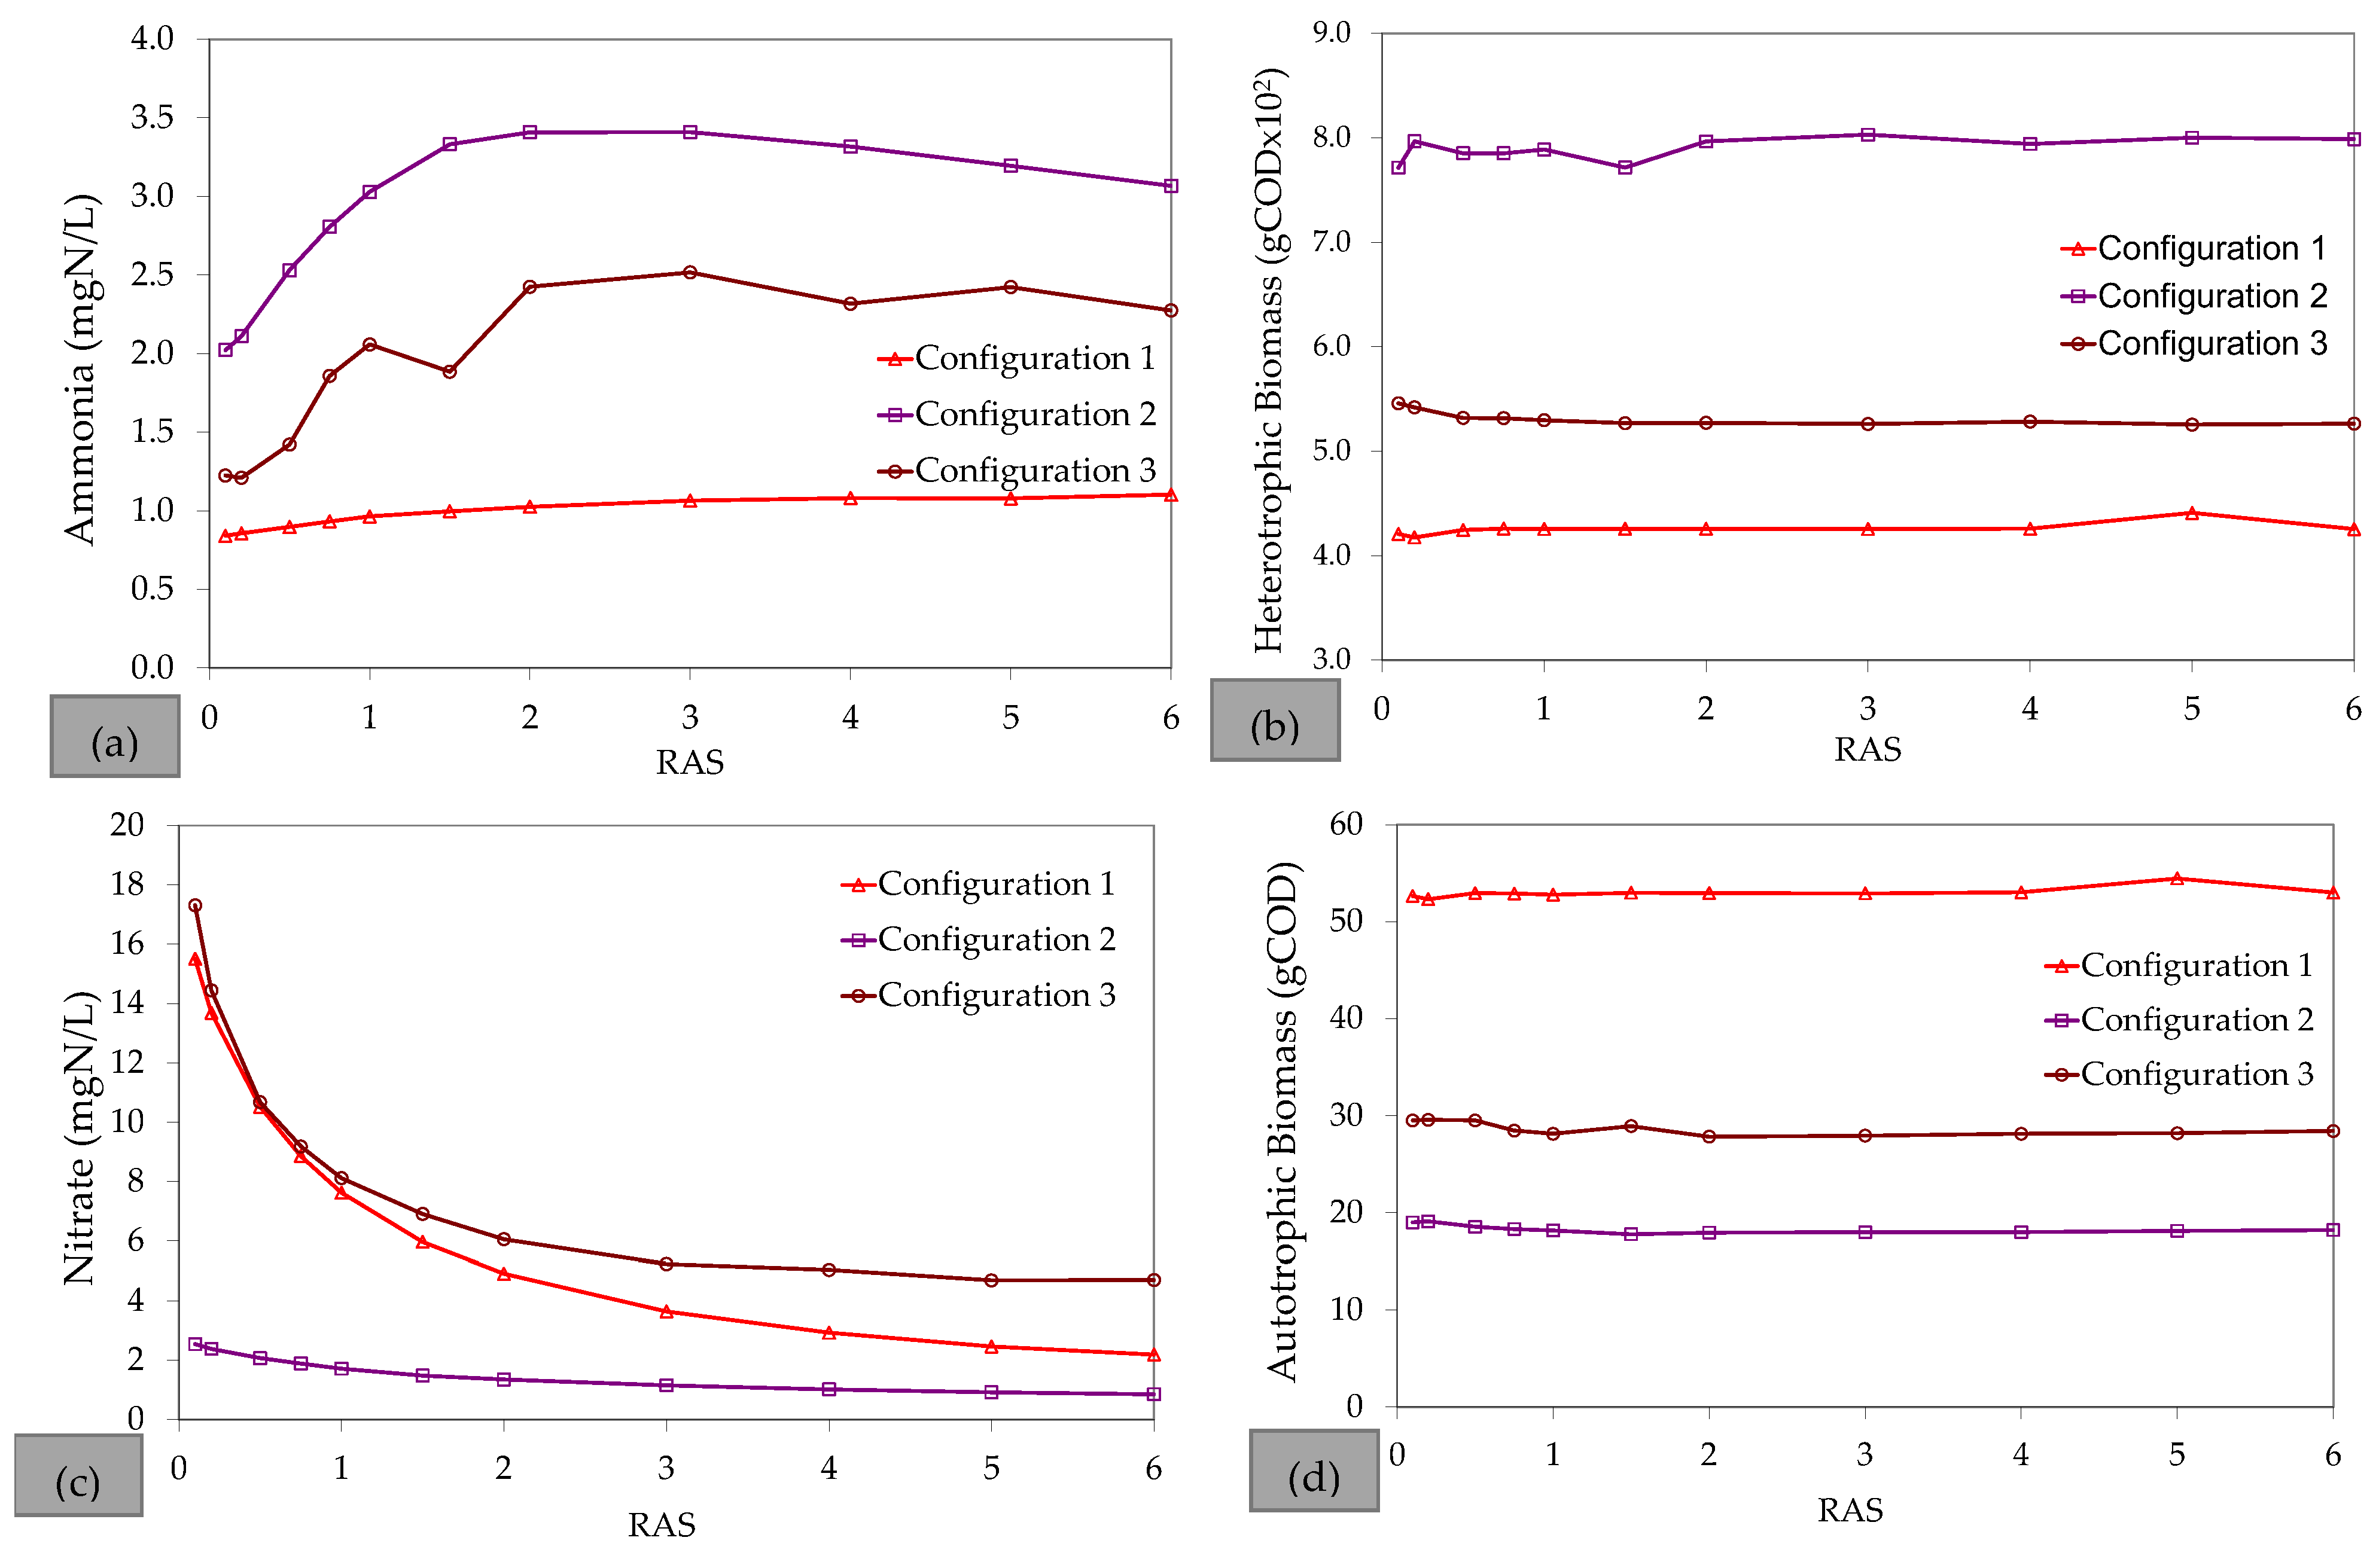
Figure A6 illustrates the effects of RAS from the membrane tank on nutrient performance across the tested submerged membrane bioreactor configurations. With an influent flow rate of 60 L/h, SRT and HRT were set to 20 d and six hours, respectively, maintaining the aerobic volume fraction consistent with that of the pilot plant tests. The return activated sludge flow rate increased from 0.3 to 6 times the influent flow. No changes in total biomass were observed with varying RAS levels, as shown in Figure A6. However, the MLSS concentration profile within the pilot plants did change due to RAS, influencing the effluent concentration. Figure A6 indicates that NH3 effluent remained relatively constant for Configuration No. 1 while increasing with higher RAS values in Configurations No. 2 and No. 3. Ammonia concentrations stabilised for RAS values exceeding 2.0, while nitrate effluent concentrations continued to decrease with increasing RAS. However, at RAS values above 3.0, no significant decrease in NO3 concentration was observed.
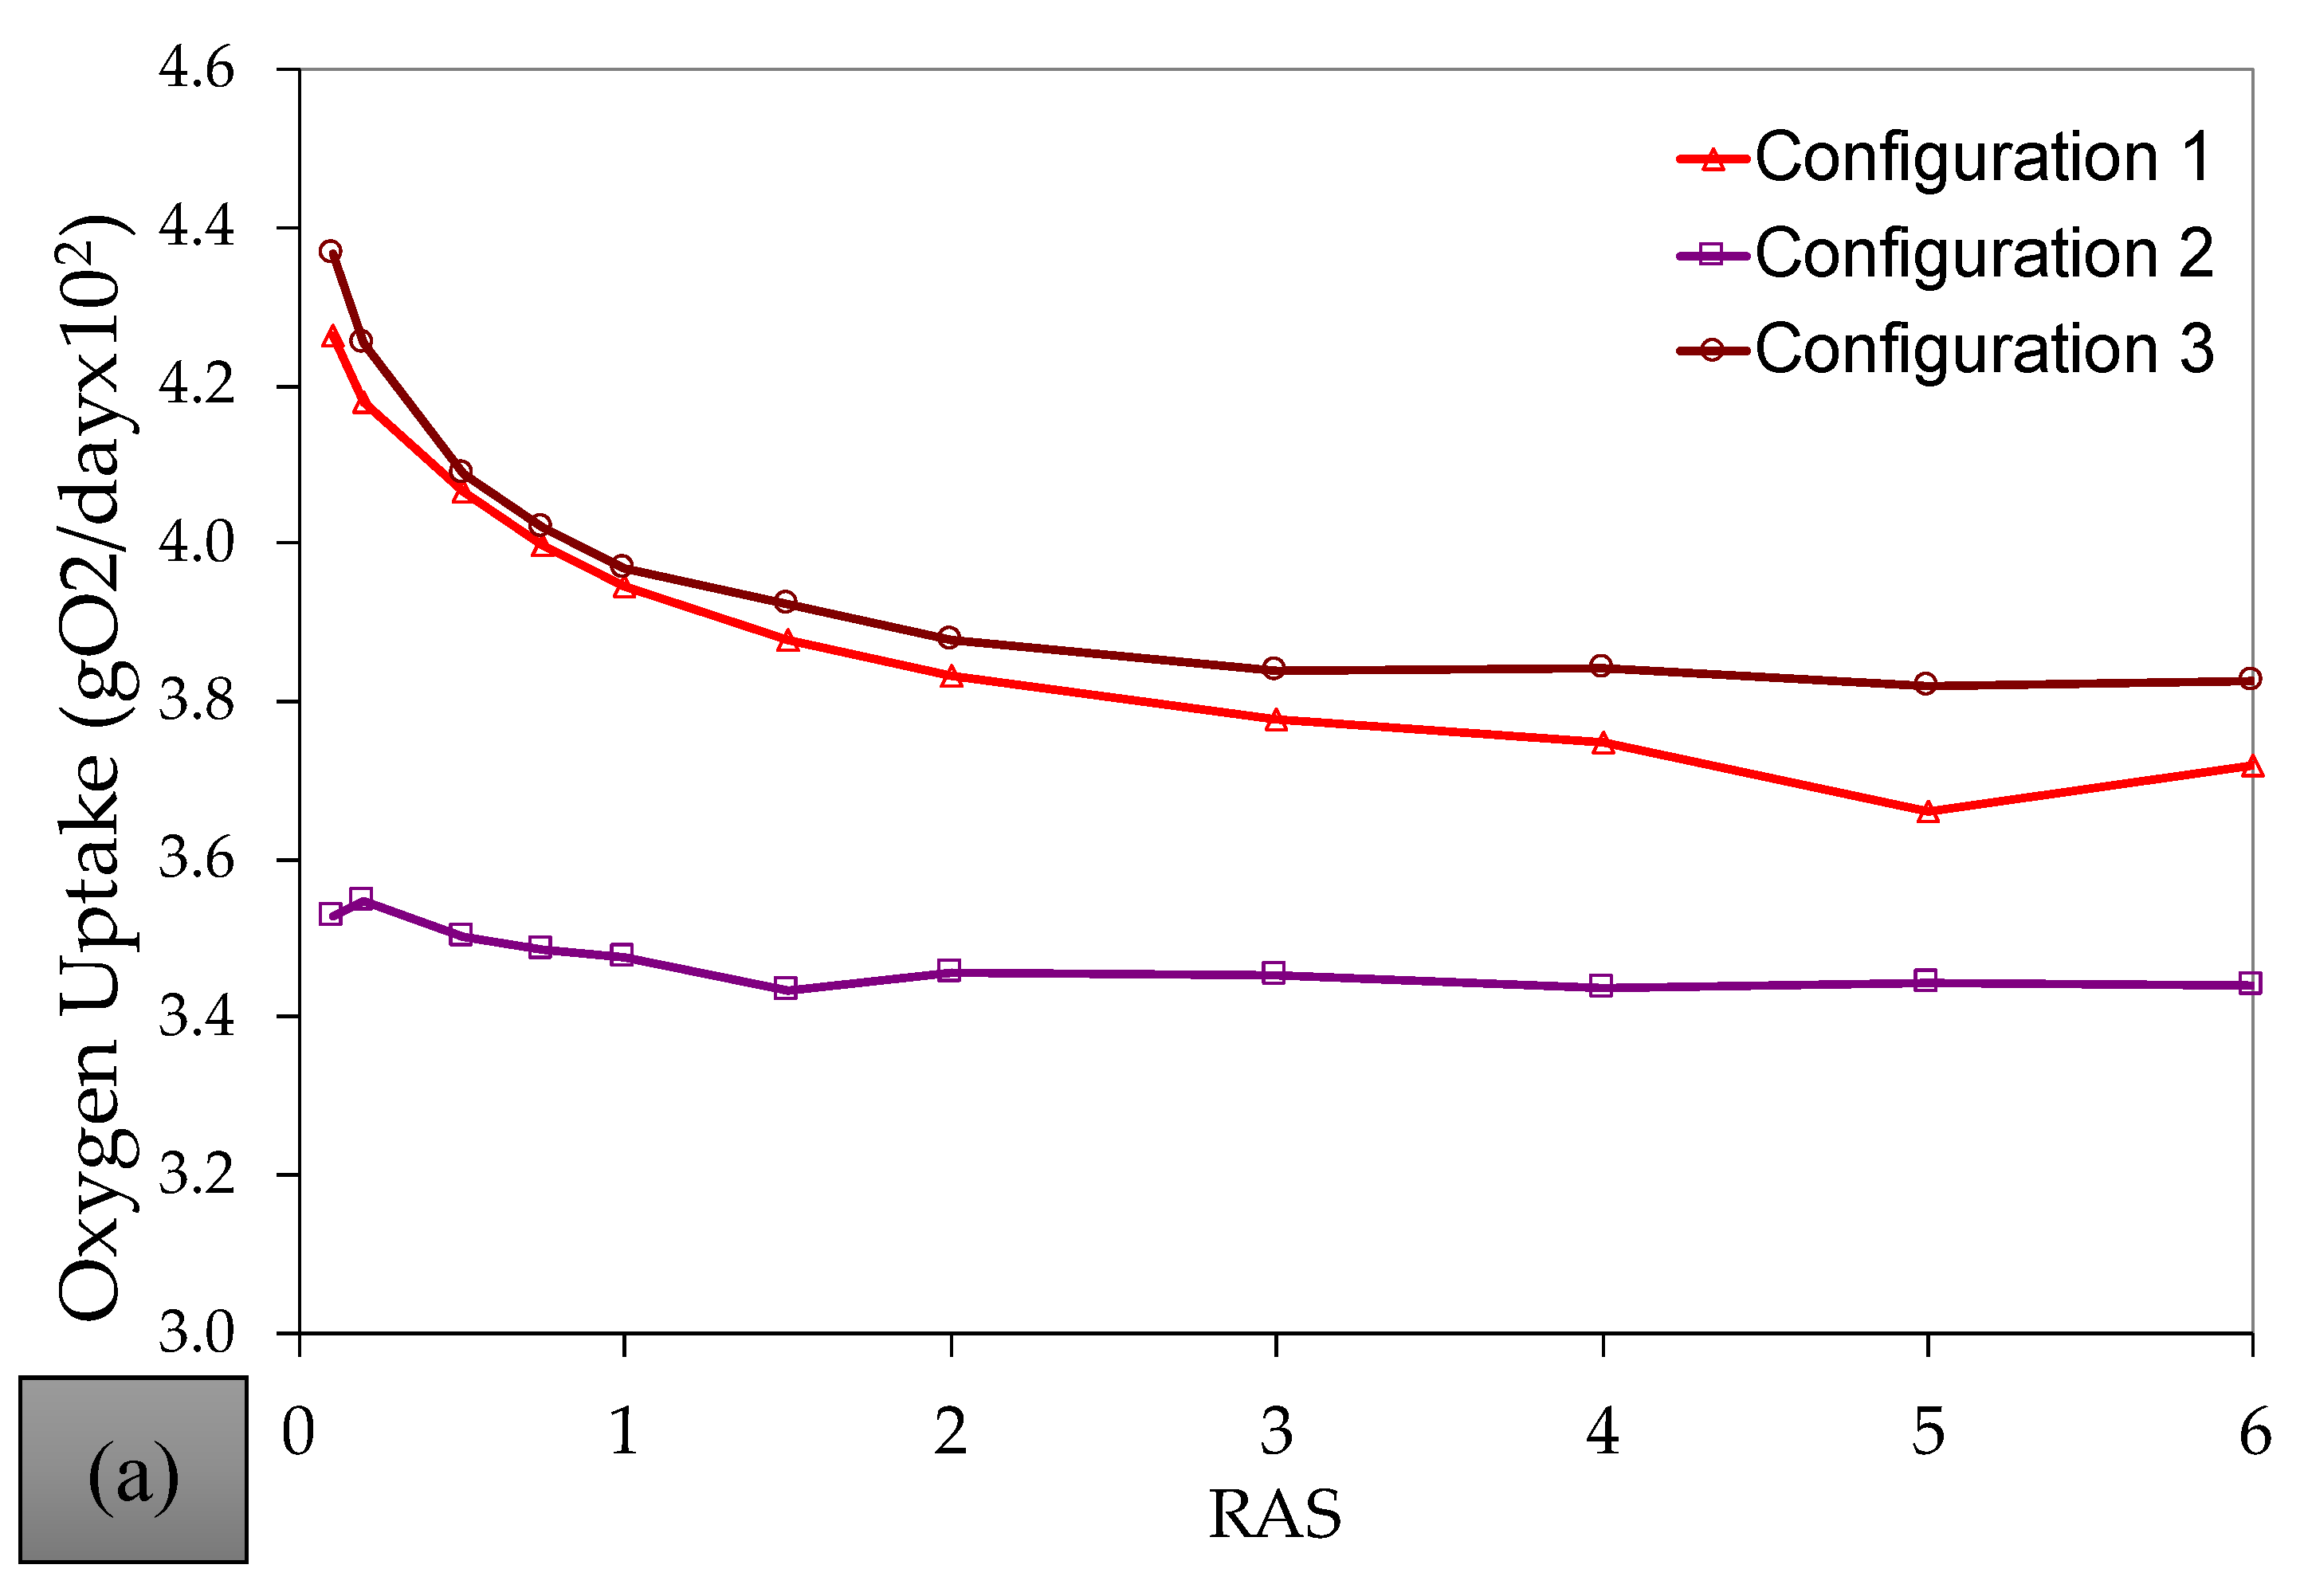
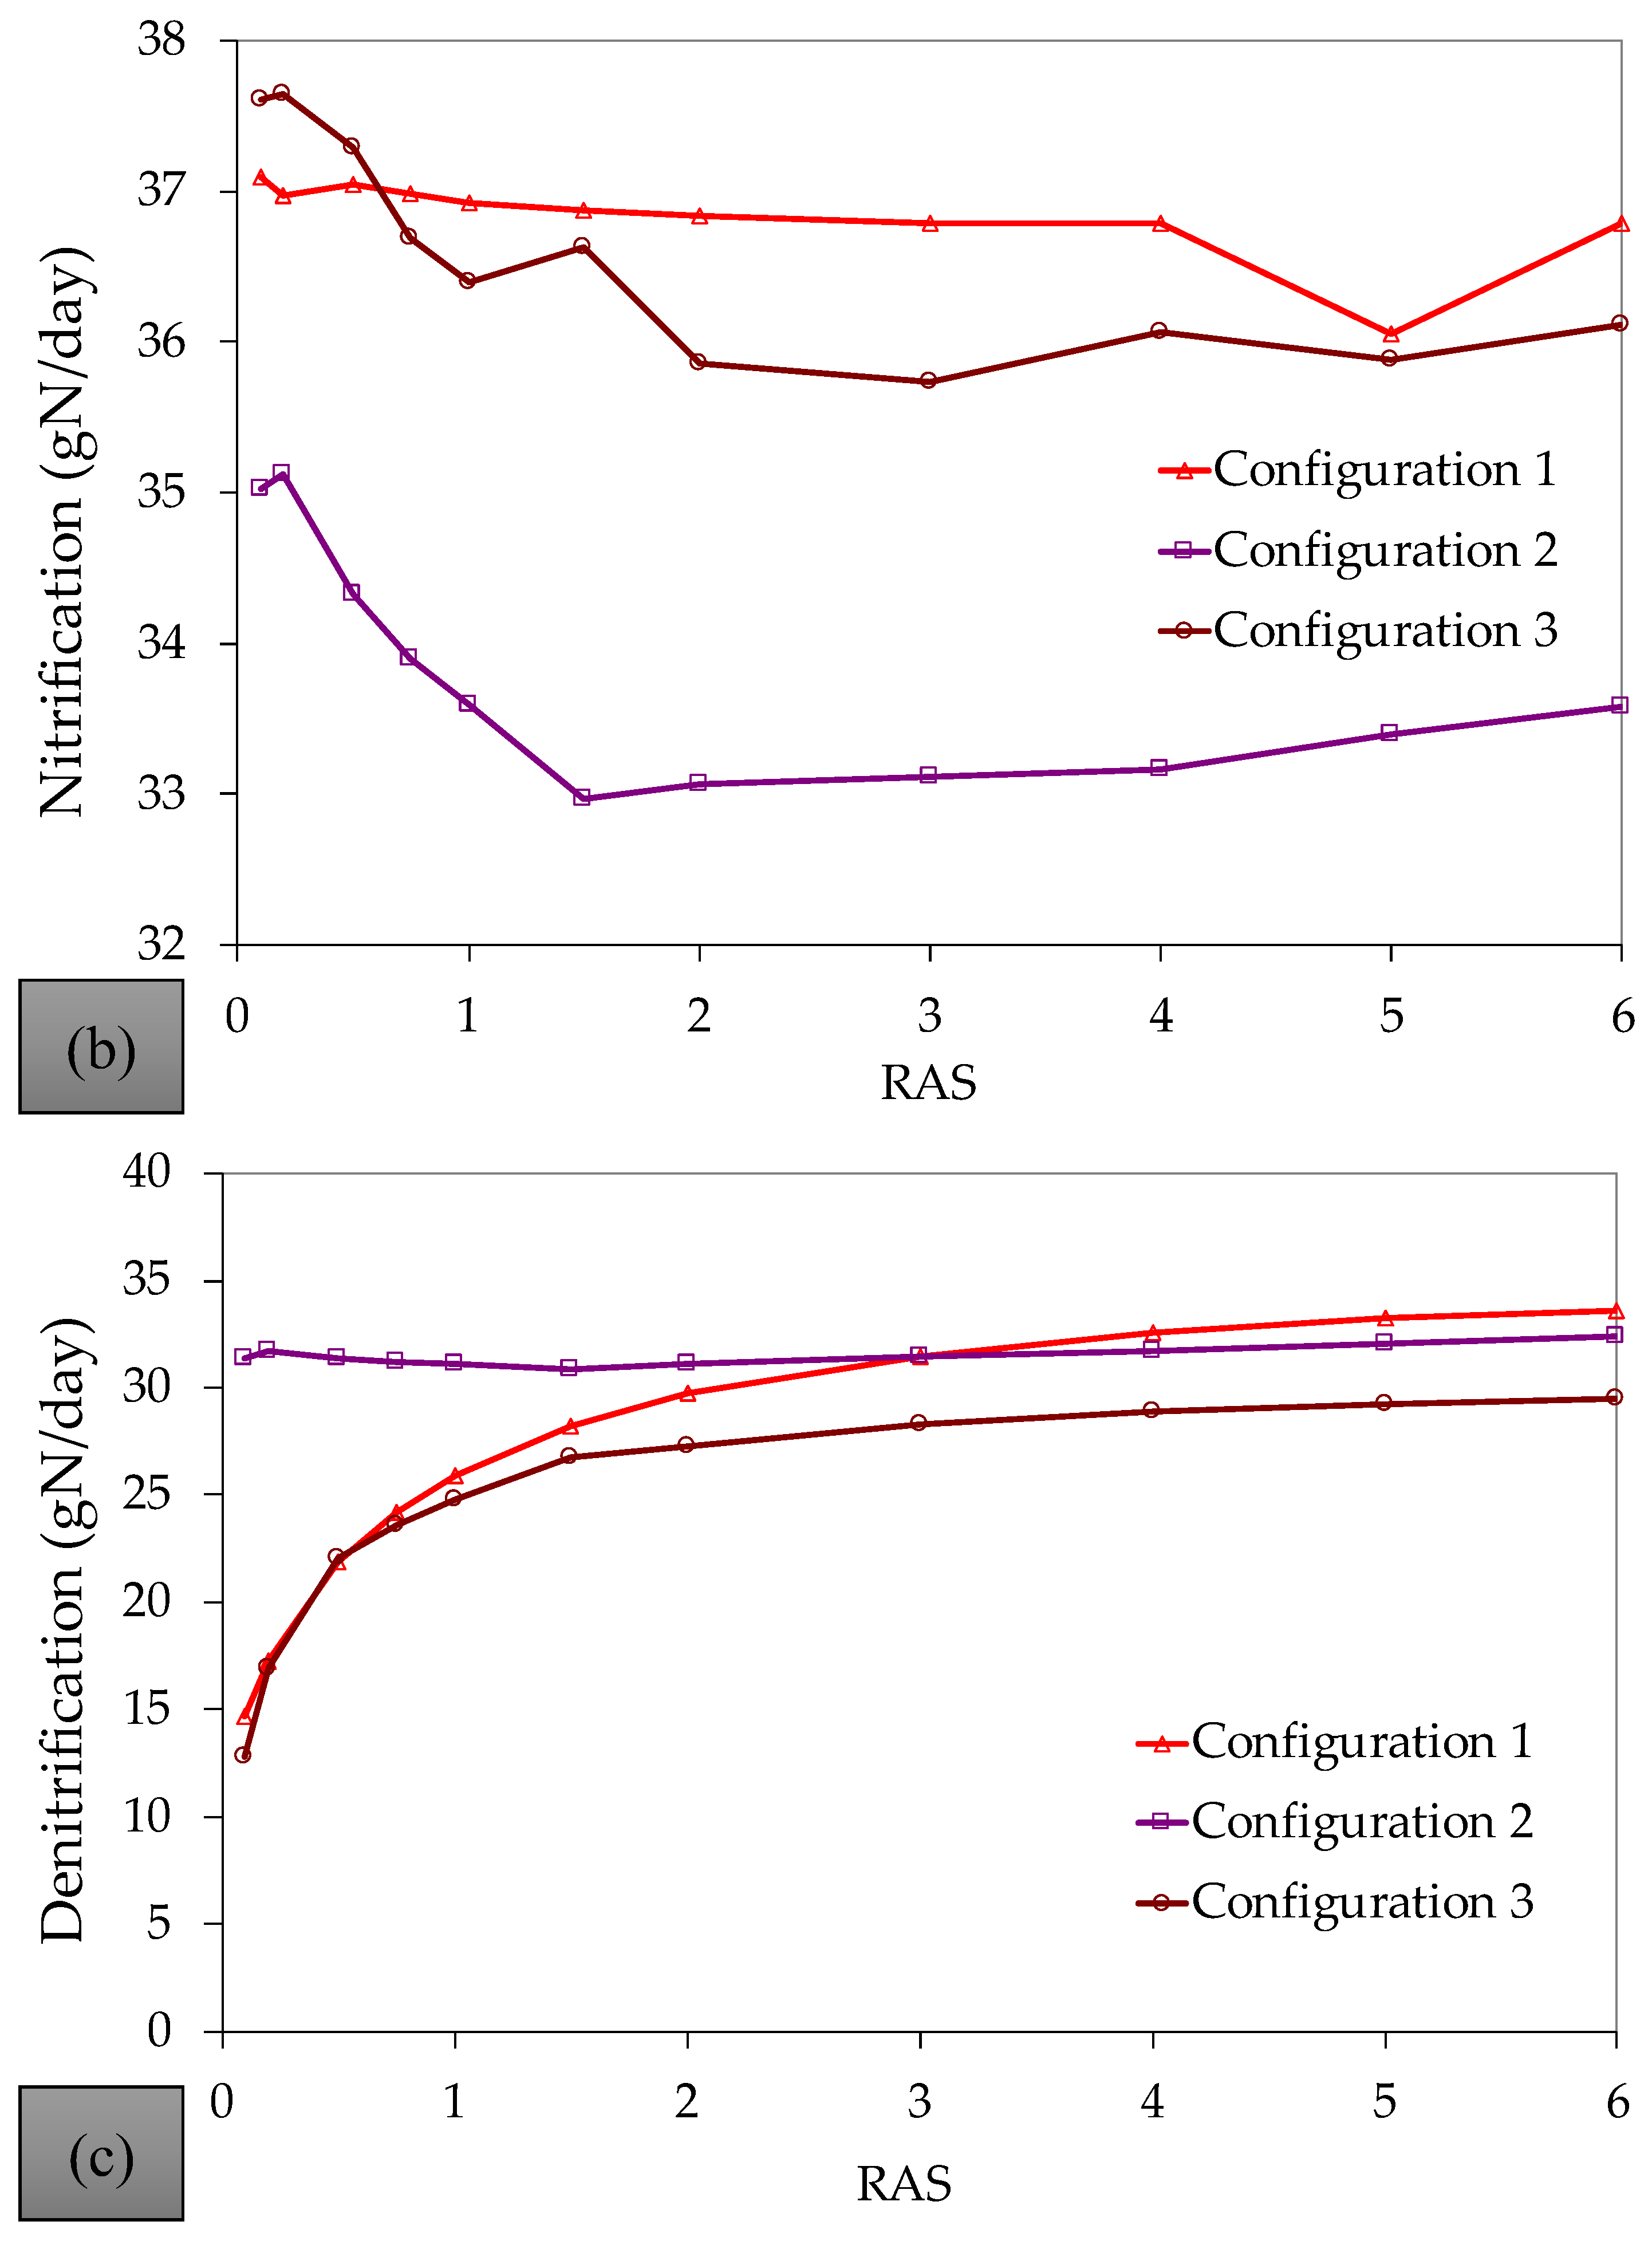
Figure A7 illustrates the variations in oxygen uptake, nitrification, and denitrification in relation to RAS. As depicted in the graphs, increases in RAS above 2.0 had minimal impact on the rates, which remained constant. Therefore, maintaining RAS between two and three is suggested for the analysed configurations.
The effects of aerobic volume fraction on submerged membrane bioreactor nitrogen removal performance were simulated based on the settings outlined in Table 5. The total volume of 0.36 m3 was divided into zones according to the selected aerobic fraction, with the membrane maintained at a minimum volume of approximately 0.3 m3. Sludge wasting was adjusted to achieve a 20-day sludge retention time. Figure A8 shows that the total biomass remained constant regardless of the selected aerobic fraction. As anticipated, increases in the aerobic volume fraction led to decreased effluent NH₃ concentrations. To achieve an effluent ammonia concentration of 2.0 mgN/L, Configuration No. 2 required an aerobic fraction of 0.7, whereas Configurations No. 1 and No. 3 needed 0.3 and 0.4, respectively.
Figure A9 illustrates the variations in oxygen uptake, nitrification, and denitrification rates as a function of aerobic volume fraction. Configurations No. 1 and No. 3 demonstrated a clear advantage in nitrogen removal but required a higher oxygen supply. In contrast, Configuration No. 2 exhibited the lowest oxygen uptake, necessitating an increased aerobic volume fraction to enhance ammonia removal. Overall, oxygen uptake remained relatively stable, while substantial fluctuations in nitrification and denitrification rates were observed when aerobic fraction values fell below 0.4 or exceeded 0.8. Consequently, the optimal operational range for the aerobic volume fraction should be set between 0.40 and 0.80 for all configurations.
It is important to note that this research only explored stoichiometric and kinetic parameters calibrated based on average wastewater and sludge characteristics. Some discrepancies between the measured and simulated data may have arisen due to chemical additions in the wastewater treatment plant and daily variations in sludge wasting. Additionally, the model assumes each reactor zone functions as a thoroughly stirred tank reactor, even though some intermixing occurs between the zones in the pilot plant. Moreover, the yield coefficient was maintained constant while the sludge retention time varied during the simulation, whereas the heterotrophic yield coefficient decreased with increasing SRT, potentially impacting nutrient removal performance. Despite its limitations, this study provides kinetic and stoichiometric parameters for the Activated Sludge Model 1 that are applicable to conventional activated sludge systems.
The findings from this study highlight essential operational and economic considerations for WWTPs using SMBRs. WWTPs can operate at shorter SRTs (10–20 d), preserving high nutrient removal efficiency while lowering membrane fouling, as reported by other researchers [2,3,4]. These circumstances minimise the frequency and expense of chemical cleaning procedures by reducing the buildup of SMPs and EPSs, which are the leading causes of fouling [20]. This improvement increases operational stability and reduces aeration energy consumption, raising the plant’s total cost-efficiency. However, because influent quality and flow rates vary in real-world settings, care must be taken while scaling up SMBR systems. Robust control mechanisms are essential for scalable SMBR systems to modify sludge management, aeration, and recirculation dynamically.

4. Conclusions

The N-REM performance of three distinct submerged membrane bioreactor configurations was assessed through pilot plant tests and computer simulations based on the Activated Sludge Model 1. The submerged membrane bioreactor configurations were operated with a solid retention time ranging from 17 to 53 d, achieving an MLSS concentration of 16 gMLSS/L. Steady-state calibration was conducted to derive the kinetic and stoichiometric parameters necessary for model-based performance evaluation. The model successfully predicted the tested configurations’ MLSS, NH3, and NO3 concentration profiles.
During model calibration, discrepancies were noted between the biomass decay and mass transfer parameters used as default values for conventional activated sludge and submerged membrane bioreactor systems. The literature suggests that a smaller floc size and the absence of grazing organisms may significantly influence the biokinetics of activated sludge in SMBRs. Configuration No. 1 demonstrated consistent ammonia removal, producing a higher nitrate effluent concentration due to the aerobic conditions in the last two reactor zones. Configuration No. 2 exhibited moderate nitrogen removal, characterised by a low bioreactor volume, reduced oxygen requirements, and simplified operation. Configuration No. 3 capitalises on post-denitrification by placing the anoxic reactor downstream of the aerobic zone, effectively reducing the nitrate concentration before recycling it to the anaerobic zone. A drawback of this configuration is its moderate bioreactor volume coupled with higher energy demands for oxygen supply.
For optimal operation across all configurations, it is recommended that SRT values below 20 d, HRT values above six hours, RAS ratios above 2.0, and an aerobic volume fraction between 0.4 and 0.8 are maintained.
The results underscore the critical factors influencing the nitrogen removal performance in SMBRs. Further investigations are warranted to optimise the biological removal process, specifically focusing on the effects of reducing hydraulic retention time, employing multi-stage designs, and enhancing aeration through the addition of more membrane modules.

Author Contributions

Conceptualization, J.A.M.-B., O.E.C.-H. and V.S.F.-M.; methodology, J.A.M.-B.; formal analysis, J.A.M.-B.; investigation, J.A.M.-B.; writing—original draft preparation, J.A.M.-B. and O.E.C.-H.; writing—review and editing, V.S.F.-M. All authors have read and agreed to the published version of the manuscript.

Funding

The first author (J.A.M.-B.) received financial support from CRESTech, a division of the Ontario Centres of Excellence and the Natural Sciences and Engineering Research Council of Canada.

Data Availability Statement

Databases are available in this research.

Acknowledgments

Testing equipment was provided by Zenon Environmental Inc. (Oakville, ON, Canada) and the City of Guelph Wastewater Treatment Plant (Canada). Furthermore, the first author (J.A.M.-B.) extends his gratitude to Colfuturo (Colombia), the International Council for Canadian Studies, and the Universidad de Cartagena (Colombia) for awarding him a scholarship to support his research endeavours.

Conflicts of Interest

The authors declare no conflicts of interest.

Nomenclature

The following abbreviations are employed in this article:
AlkAlkalinity
ASM 1Activated Sludge Model
BNRBiological nutrient removal
b A Decay   rate   of   X A U T (d−1)
b H Rate constant for lysis and decay (d−1)
CASConventional activated sludge
CODChemical oxygen demand
C-OCarbon oxidation
DODissolved oxygen
f S I Inert soluble COD fraction
K s Substrate half-saturation coefficient
K O H Inhibition coefficient for oxygen
K h Hydrolysis rate constant
K O A Saturation coefficient for oxygen
k x Substrate half-saturation coefficient
HRTHydraulic retention time
MLSSMixed liquor suspended solids
MLVSMixed liquor volatile suspended solids
NH3Ammonia
NO2Nitrite
NO3Nitrate
N-REMNitrogen removal
OLROrganic loading rate
RASReturn activated sludge
SCODSoluble chemical oxygen demand
SMBRSubmerged membrane bioreactor
SMPSoluble microbial product
SRTSludge retention time
S I Inert soluble COD
S S Readily biodegradable COD
SPSoluble phosphorus
TCODTotal chemical oxygen demand
TNTotal nitrogen
TNUTotal nitrogen unit
TSSTotal suspended solids
TPTotal phosphorus
VSSVolatile suspended solids
WWTPWastewater treatment plant
X A Autotrophic organisms
X H Heterotrophic organisms
X I Inert particulate matter
X s Hydrolysis of particulate substrate
Y A Yield of autotrophic biomass
Y H Yield coefficient
μ A Maximum   growth   rate   of   X A U T
μ H Maximum growth on substrate
μ Mean
σ Standard deviation
Number of readings
η N O 3 Reduction factor for denitrification

Appendix A

Table A1. Stoichiometric and kinetic parameters of the Activated Sludge Model obtained during the calibration stage for all Runs.
ParameterUnitsDefault
Values
(20 °C)
Run No.
1234
Heterotrophic organisms: X H
Y H gCOD/gCOD0.670.380.400.520.30
μ H day−16.006.006.006.05.00
b H day−10.620.400.200.200.20
K S gCOD/m32025202025
K O H gO2/m30.200.301.003.000.10
Hydrolysis of particulate substrate: X S
K h day−13.003.503.503.503.00
k x gCOD/gCOD0.030.030.030.030.14
η N O 3 -0.400.750.750.750.30
Autotrophic organisms: X A
Y A gCOD/gN0.240.250.250.250.25
μ A day−10.800.500.800.801.00
b A day−10.040.120.400.400.20
K O A gO2/m30.400.200.170.170.15
Table A2. Mean daily results in Configuration No. 1 at T = 20 °C and SRT = 53 d for Run No. 1.
ParameterResults
Z1—AnoxicZ2—AnaerobicZ3—AerobicSMBREffluent
MSMSMSMSMS
TSS (gSS/m3)13,37012,66613,24012,65413,71012,64418,99018,634
VSS (gMLVSS/m3)94269117934891059766909513,48313,399
Inert solids (gSS/m3)39443549389335493944354955075235
CODsol (mg/L)55365131463032293229
NH3 (mgN/L)141398530.60.440.60.44
Nitrogen oxides (mgN/L)1.00.71.00.34.24.37.87.5167.5
DO (mg/L)0.130.060.130.081.01.02.02.3
Note: M—measured value and S—simulated value.
Table A3. Mean daily results in Configuration No. 2 at T = 19 °C and SRT = 17 d for Run No. 2.
ParameterResults
Z1—AnaerobicZ2—AnoxicSMBREffluent
MSMSMSMS
TSS (gSS/m3)474048456660603872307193
VSS (gMLVSS/m3)357037304870464553505532
Inert solids (gSS/m3)117011151790139418801661
CODsol (mg/L)5825592357222622
NH3 (mgN/L)2217107.12.32.41.52.4
Nitrogen oxides (mgN/L)2.43.16.58.313131713
DO (mg/L)0.160.180.220.214.84.5
Note: M—measured value and S—simulated value.
Table A4. Mean daily results in Configuration No. 2 at T = 19 °C and SRT = 36 d for Run No. 3.
ParameterResults
Z1—AnaerobicZ2—AnoxicSMBREffluent
MSMSMSMS
TSS (gSS/m3)9480906311,92011,76413,77014,164
VSS (gMLVSS/m3)647062478060810593409758
Inert solids (gSS/m3)301028163860365944304407
CODsol (mg/L)2527282428242024
NH3 (mgN/L)16168.57.42.133.31.83.3
Nitrogen oxides (mgN/L)0.90.92.93.97.77.49.57.4
DO (mg/L)0.050.140.080.123.93.5
Note: M—measured value and S—simulated value.
Table A5. Mean daily results in Configuration No. 3 at T = 20 °C and SRT = 31 d for Run No. 4.
ParameterResults
Z1—AnaerobicZ2—AerobicZ3-AnoxicSMBREffluent
MSMSMSMSMS
TSS (gSS/m3)67806441937099749610996911,98013,223
VSS (gMLVSS/m3)46204374623067616390675679708958
Inert solids (gSS/m3)22002067320032133300321341004265
CODsol (mg/L)45382824392439242324
NH3 (mgN/L)10114.04.43.03.52.01.10.51.1
Nitrogen oxides (mgN/L)0.50.13.04.64.03.97.06.58.06.5
DO (mg/L)0.060.021.31.20.050.055.14.9
Note: M—measured value and S—simulated value.
Figure A1. Configurations and runs of unit processes: (a) Configuration No. 1—Run 1; (b) Configuration No. 2—Run 2; (c) Configuration No. 2—Run 3; and (d) Configuration No. 3—Run 4.
Environments 11 00260 g0a1
Figure A2. Effect of sludge retention time on simulated: (a) NH3 effluent; (b) total heterotrophic biomass; (c) NO3 effluent; and (d) total autotrophic biomass.
Environments 11 00260 g0a2
Figure A3. Effect of sludge retention time on simulated: (a) oxygen uptake; (b) nitrification; and (c) denitrification.
Environments 11 00260 g0a3aEnvironments 11 00260 g0a3b
Figure A4. Effect of hydraulic retention time on simulated: (a) NH3 effluent; (b) total heterotrophic biomass; (c) NO3 effluent; and (d) total autotrophic biomass.
Environments 11 00260 g0a4
Figure A5. Effect of hydraulic retention time on simulated: (a) oxygen uptake; (b) nitrification; and (c) denitrification.
Environments 11 00260 g0a5aEnvironments 11 00260 g0a5b
Figure A6. Effect of return activated sludge on simulated: (a) NH3 effluent; (b) total heterotrophic biomass; (c) NO3 effluent; and (d) total autotrophic biomass.
Environments 11 00260 g0a6
Figure A7. Effect of return activated sludge on simulated: (a) oxygen uptake; (b) nitrification; and (c) denitrification.
Environments 11 00260 g0a7aEnvironments 11 00260 g0a7b
Figure A8. Effect of aerobic fraction on simulated: (a) NH3 effluent; (b) total heterotrophic biomass; (c) NO3 effluent; and (d) total autotrophic biomass.
Environments 11 00260 g0a8
Figure A9. Effect of aerobic fraction on simulated: (a) oxygen uptake; (b) nitrification; and (c) denitrification.
Environments 11 00260 g0a9aEnvironments 11 00260 g0a9b

References

  1. Arumugham, T.; Khudzari, J.; Abdullah, N.; Yuzir, A.; Iwamoto, K.; Homma, K. Research Trends and Future Directions on Nitrification and Denitrification Processes in Biological Nitrogen Removal. J. Environ. Chem. Eng. 2024, 12, 111897. [Google Scholar] [CrossRef]
  2. Hamedi, H.; Mohammadzadeh, O.; Rasouli, S.; Zendehboudi, S. A Critical Review of Biomass Kinetics and Membrane Filtration Models for Membrane Bioreactor Systems. J. Environ. Chem. Eng. 2021, 9, 106406. [Google Scholar] [CrossRef]
  3. Al-Asheh, S.; Bagheri, M.; Aidan, A. Membrane Bioreactor for Wastewater Treatment: A Review. Case Stud. Chem. Environ. Eng. 2021, 4, 100109. [Google Scholar] [CrossRef]
  4. Mannina, G.; Ni, B.J.; Makinia, J.; Harmand, J.; Alliet, M.; Brepols, C.; Ruano, M.V.; Robles, A.; Heran, M.; Gulhan, H.; et al. Biological Processes Modelling for MBR Systems: A Review of the State-of-the-Art Focusing on SMP and EPS. Water Res. 2023, 242, 120275. [Google Scholar] [CrossRef]
  5. Mannina, G.; Alliet, M.; Brepols, C.; Comas, J.; Harmand, J.; Heran, M.; Kalboussi, N.; Makinia, J.; Robles, Á.; Rebouças, T.F.; et al. Integrated Membrane Bioreactors Modelling: A Review on New Comprehensive Modelling Framework. Bioresour. Technol. 2021, 329, 124828. [Google Scholar] [CrossRef]
  6. Al-Sayed, A.; Hellal, M.S.; Al-Shemy, M.T.; Hassan, G.K. Performance Evaluation of Submerged Membrane Bioreactor for Municipal Wastewater Treatment: Experimental Study and Model Validation with GPS-X Software Simulator. Water Environ. J. 2023, 37, 480–492. [Google Scholar] [CrossRef]
  7. Siagian, U.W.R.; Khoiruddin, K.; Ting, Y.P.; Boopathy, R.; Wenten, I.G. Advances in Membrane Bioreactor: High Performance and Antifouling Configurations. Curr. Pollut. Rep. 2022, 8, 98–112. [Google Scholar] [CrossRef]
  8. Cheng, X.; Xu, K. Evaluation of Autotrophic Process Influencing Extracellular Polymeric Substances in Aerobic Membrane Bieactor with Expanded ASM Model. Sci. Total Environ. 2024, 928, 172207. [Google Scholar] [CrossRef]
  9. Chen, G.-Q.; Wu, Y.-H.; Chen, Z.; Luo, L.-W.; Wang, Y.-H.; Tong, X.; Bai, Y.; Wang, H.-B.; Xu, Y.-Q.; Zhang, Z.-W.; et al. Enhanced extracellular polymeric substances production and aggravated membrane fouling potential caused by different disinfection treatment. J. of Membrane Sci. 2022, 642, 120007. [Google Scholar] [CrossRef]
  10. Yilmaz, T.; Demir, E.K.; Asik, G.; Başaran, S.T.; Çokgör, E.U.; Sözen, S.; Sahinkaya, E. Effect of Sludge Retention Time on the Performance and Sludge Filtration Characteristics of an Aerobic Membrane Bioreactor Treating Textile Wastewater. J. Water Process Eng. 2023, 51, 103390. [Google Scholar] [CrossRef]
  11. Al-Sayed, A.; El-gohary, F.A. Wastewater Remediation by Aerobic Membrane Bioreactor: Effect of Sludge Retention Time on Treatment Performance and Filtration Process. Egypt. J. Chem. 2024, 67, 383–392. [Google Scholar] [CrossRef]
  12. Ma, Q.; Han, F.; Lyu, F.; Yang, X. Municipal Sewage Treatment Technology: A2/O-VMBR Integrated Technology for Municipal Treatment and Improved Pollutant Removal. Water 2023, 15, 1574. [Google Scholar] [CrossRef]
  13. Tiar, S.M.; Bessedik, M.; Abdelbaki, C.; ElSayed, N.B.; Badraoui, A.; Slimani, A.; Kumar, N. Steady-State and Dynamic Simulation for Wastewater Treatment Plant Management: Case Study of Maghnia City, North-West Algeria. Water 2024, 16, 269. [Google Scholar] [CrossRef]
  14. Cheng, H.-H.; Huang, P.-W.; Whang, L.-M. Optimization of Biological Nitrogen Removal in Full-Scale Municipal WWTPs Using Activated Sludge Model Simulation. Chemosphere 2024, 362, 142939. [Google Scholar] [CrossRef]
  15. James, S.N.; Vijayanandan, A. Recent Advances in Simultaneous Nitrification and Denitrification for Nitrogen and Micropollutant Removal: A Review. Biodegradation 2023, 34, 103–123. [Google Scholar] [CrossRef]
  16. Bhattacharya, R.; Mazumder, D. Mathematical Modelling of Simultaneous Nitrification and Denitrification in Biological Reactor Systems—A Review. Int. J. Environ. Sci. Technol. 2023, 20, 8105–8126. [Google Scholar] [CrossRef]
  17. Bai, X.; Hazi, F.; Takacs, I.; Wadhawan, T.; Parker, W.J. A Comprehensive Floc Model for Simulating Simultaneous Nitrification, Denitrification, and Phosphorus Removal. Sci. Total Environ. 2024, 927, 172023. [Google Scholar] [CrossRef]
  18. Bai, X.; McKnight, M.; Neufeld, J.; Parker, W. Simultaneous nitrification, denitrification, and phosphorus removal from municipal wastewater at low temperature. Bioresource Techn. 2023, 368, 128261. [Google Scholar] [CrossRef]
  19. Witzig, R.; Manz, W.; Rosenberger, S.; Krüger, U.; Kraume, M.; Szewzyk, U. Microbiological Aspects of a Bioreactor with Submerged Membranes for Aerobic Treatment of Municipal Wastewater. Water Res. 2002, 36, 394–402. [Google Scholar] [CrossRef]
  20. Van Huynh, V.; Nguyen, M.B.; Saenchan, S.; Truc-Ly, L.-H.; Ueyama, T.; Shirayanagi, S.; Itayama, T. Investigation of Performance in MBR Operated with Low DO for Low C/N Ratio Wastewater. Water Air Soil. Pollut. 2024, 235, 540. [Google Scholar] [CrossRef]
  21. Liss, S.N.; Liao, B.Q.; Droppo, I.G.; Allen, D.G.; Leppard, G.G. Effect of Solids Retention Time on Floc Structure. Water Sci. Technol. 2002, 46, 431–438. [Google Scholar] [CrossRef]
  22. Manser, R.; Gujer, W.; Siegrist, H. Consequences of Mass Transfer Effects on the Kinetics of Nitrifiers. Water Res. 2005, 39, 4633–4642. [Google Scholar] [CrossRef] [PubMed]
  23. Cicek, N.; Macomber, J.; Davel, J.; Suidan, M.T.; Audic, J.; Genestet, P. Effect of Solids Retention Time on the Performance and Biological Characteristics of a Membrane Bioreactor. Water Sci. Technol. 2001, 43, 43–50. [Google Scholar] [CrossRef]
  24. Bertanza, G.; Canato, M.; Laera, G.; Vaccari, M.; Svanström, M.; Heimersson, S. A Comparison between Two Full-Scale MBR and CAS Municipal Wastewater Treatment Plants: Techno-Economic-Environmental Assessment. Environ. Sci. Pollut. Res. 2017, 24, 17383–17393. [Google Scholar] [CrossRef] [PubMed]
  25. Lee, Y. Effects of Environmental Conditions on the Performance of Nitrogen Removal Activated Sludge Systems. Ph.D Dissertation, The University of Manitoba, Winnipeg, MB, Canada, 2004. [Google Scholar]
  26. Petropoulos, P.; Gilbride, K.A. Nitrification in Activated Sludge Batch Reactors Is Linked to Protozoan Grazing of the Bacterial Population. Can. J. Microbiol. 2005, 51, 791–799. [Google Scholar] [CrossRef] [PubMed]
  27. Al-Malack, M.H. Determination of Biokinetic Coefficients of an Immersed Membrane Bioreactor. J. Memb. Sci. 2006, 271, 47–58. [Google Scholar] [CrossRef]
  28. IWA. Task Group on Mathematical Modelling for Design and Operation of Biological Wastewater Treatment (2000). Activated Sludge Models ASM1, ASM2, ASM2D and ASM3; IWA Publishing: London, UK, 2000. [Google Scholar]
  29. Ramphao, M.; Wentzel, M.C.; Merritt, R.; Ekama, G.A.; Young, T.; Buckley, C.A. Impact of Membrane Solid–Liquid Separation on Design of Biological Nutrient Removal Activated Sludge Systems. Biotechnol. Bioeng. 2005, 89, 630–646. [Google Scholar] [CrossRef]
  30. Lesjean, B.; Gnirss, R.; Adam, C. Process Configurations Adapted to Membrane Bioreactors for Enhanced Biological Phosphorous and Nitrogen Removal. Desalination 2002, 149, 217–224. [Google Scholar] [CrossRef]
  31. APHA; AWWA; WEF. Standard Methods for Water and Wastewater Determination; APHA: Washington, DC, USA, 1995. [Google Scholar]
  32. Mouthón-Bello, J.; Zhou, H. Performance of a Submerged Membrane Bioreactor System for Biological Nutrient Removal. Water Environ. Res. 2006, 78, 538–545. [Google Scholar] [CrossRef]
  33. Dold, P.; Jones, R.; Takacs, I. Practical Guide for WWTP Model Calibration and Associated Data Gathering Requirements. In Proceedings of the WEFTEC® 2003 Conference, Los Angeles, CA, USA, 12–16 October 2003. [Google Scholar]
  34. Vanrolleghem, P.; Insel, G.; Petersen, B.; Sin, G.; De Pauw, D.; Nopens, I.; Dovermann, H.; Weijers, S.; Gernay, K. A Comprehensive Model Calibration Procedure for Activated Sludge Models. In Proceedings of the WEFTEC® 2003 Conference, Los Angeles, CA, USA, 12–16 October 2003. [Google Scholar]
  35. Grady Jr, C.L.; Daigger, G.T.; Love, N.G.; Filipe, C.D. Biological Wastewater Treatment; CRC Press: Boca Raton, FL, USA, 2011. [Google Scholar]
  36. Kraume, M.; Bracklow, U.; Vocks, M.; Drews, A. Nutrients Removal in MBRs for Municipal Wastewater Treatment. Water Sci. Technol. 2005, 51, 391–402. [Google Scholar] [CrossRef]
  37. Innocenti, L.; Bolzonella, D.; Pavan, P.; Cecchi, F. Effect of Sludge Age on the Performance of a Membrane Bioreactor: Influence on Nutrient and Metals Removal. Desalination 2002, 146, 467–474. [Google Scholar] [CrossRef]
  38. Henze, M.; Gujer, W.; Mino, T.; Matsuo, T.; Wentzel, M.C.; Marais, G.v.R.; Van Loosdrecht, M.C.M. Activated Sludge Model No.2d, ASM2D. Water Sci. Technol. 1999, 39, 165–182. [Google Scholar] [CrossRef]
  39. Grady, L.; Daigger, G.; Lim, H. Biological Wastewater Treatment; Marcel Dekker Inc.: New York, NY, USA, 1999. [Google Scholar]
  40. Van Loosdrecht, M.C.M.; Henze, M. Maintenance, Endogeneous Respiration, Lysis, Decay and Predation. Water Sci. Technol. 1999, 39, 107–117. [Google Scholar] [CrossRef]
  41. Gasmi, A.; Heran, M.; Elboughdiri, N.; Kolsi, L.; Ghernaout, D.; Hannachi, A.; Grasmick, A. Steady State Modeling of Autotrophic Membrane Bioreactor—A New Approach to Quantify Biomass. Arab. Gulf J. Sci. Res. 2023, 42, 920–941. [Google Scholar] [CrossRef]
  42. Choubert, J.-M.; Racault, Y.; Grasmick, A.; Beck, C.; Heduit, A. Nitrogen Removal from Urban Wastewater by Activated Sludge Process Operated over the Conventional Carbon Loading Rate Limit at Low Temperature. Water SA 2005, 31, 503–510. [Google Scholar] [CrossRef]
  43. Larrea, L.; Irizar, I.; Hildago, M.E. Improving the Predictions of ASM2d through Modelling in Practice. Water Sci. Technol. 2002, 45, 199–208. [Google Scholar] [CrossRef]
  44. Qrenawi, L.I.; Rabah, F.K.J. Studying the Effect of HRT, SRT, and MLSS on Membrane Bioreactor Performance for Wastewater Treatment. Egypt. J. Chem. 2024, 67, 423–437. [Google Scholar] [CrossRef]
  45. Moussa, M.S.; Hooijmans, C.M.; Lubberding, H.J.; Gijzen, H.J.; van Loosdrecht, M.C.M. Modelling Nitrification, Heterotrophic Growth and Predation in Activated Sludge. Water Res. 2005, 39, 5080–5098. [Google Scholar] [CrossRef]
  46. Jang, N.; Ren, X.; Cho, J.; Kim, I.S. Steady-State Modeling of Bio-Fouling Potentials with Respect to the Biological Kinetics in the Submerged Membrane Bioreactor (SMBR). J. Memb. Sci. 2006, 284, 352–360. [Google Scholar] [CrossRef]
  47. Tenore, A.; Vieira, J.; Frunzo, L.; Luongo, V.; Fabbricino, M. Calibration and Validation of an Activated Sludge Model for Membrane Bioreactor Wastewater Treatment Plants. Environ. Technol. 2020, 41, 1923–1936. [Google Scholar] [CrossRef]
  48. Ng, H.Y.; Hermanowicz, S.W. Membrane Bioreactor Operation at Short Solids Retention Times: Performance and Biomass Characteristics. Water Res. 2005, 39, 981–992. [Google Scholar] [CrossRef] [PubMed]
  49. Mannina, G.; Cosenza, A.; Rebouças, T.F. A Plant-Wide Modelling Comparison between Membrane Bioreactors and Conventional Activated Sludge. Bioresour. Technol. 2020, 297, 122401. [Google Scholar] [CrossRef]
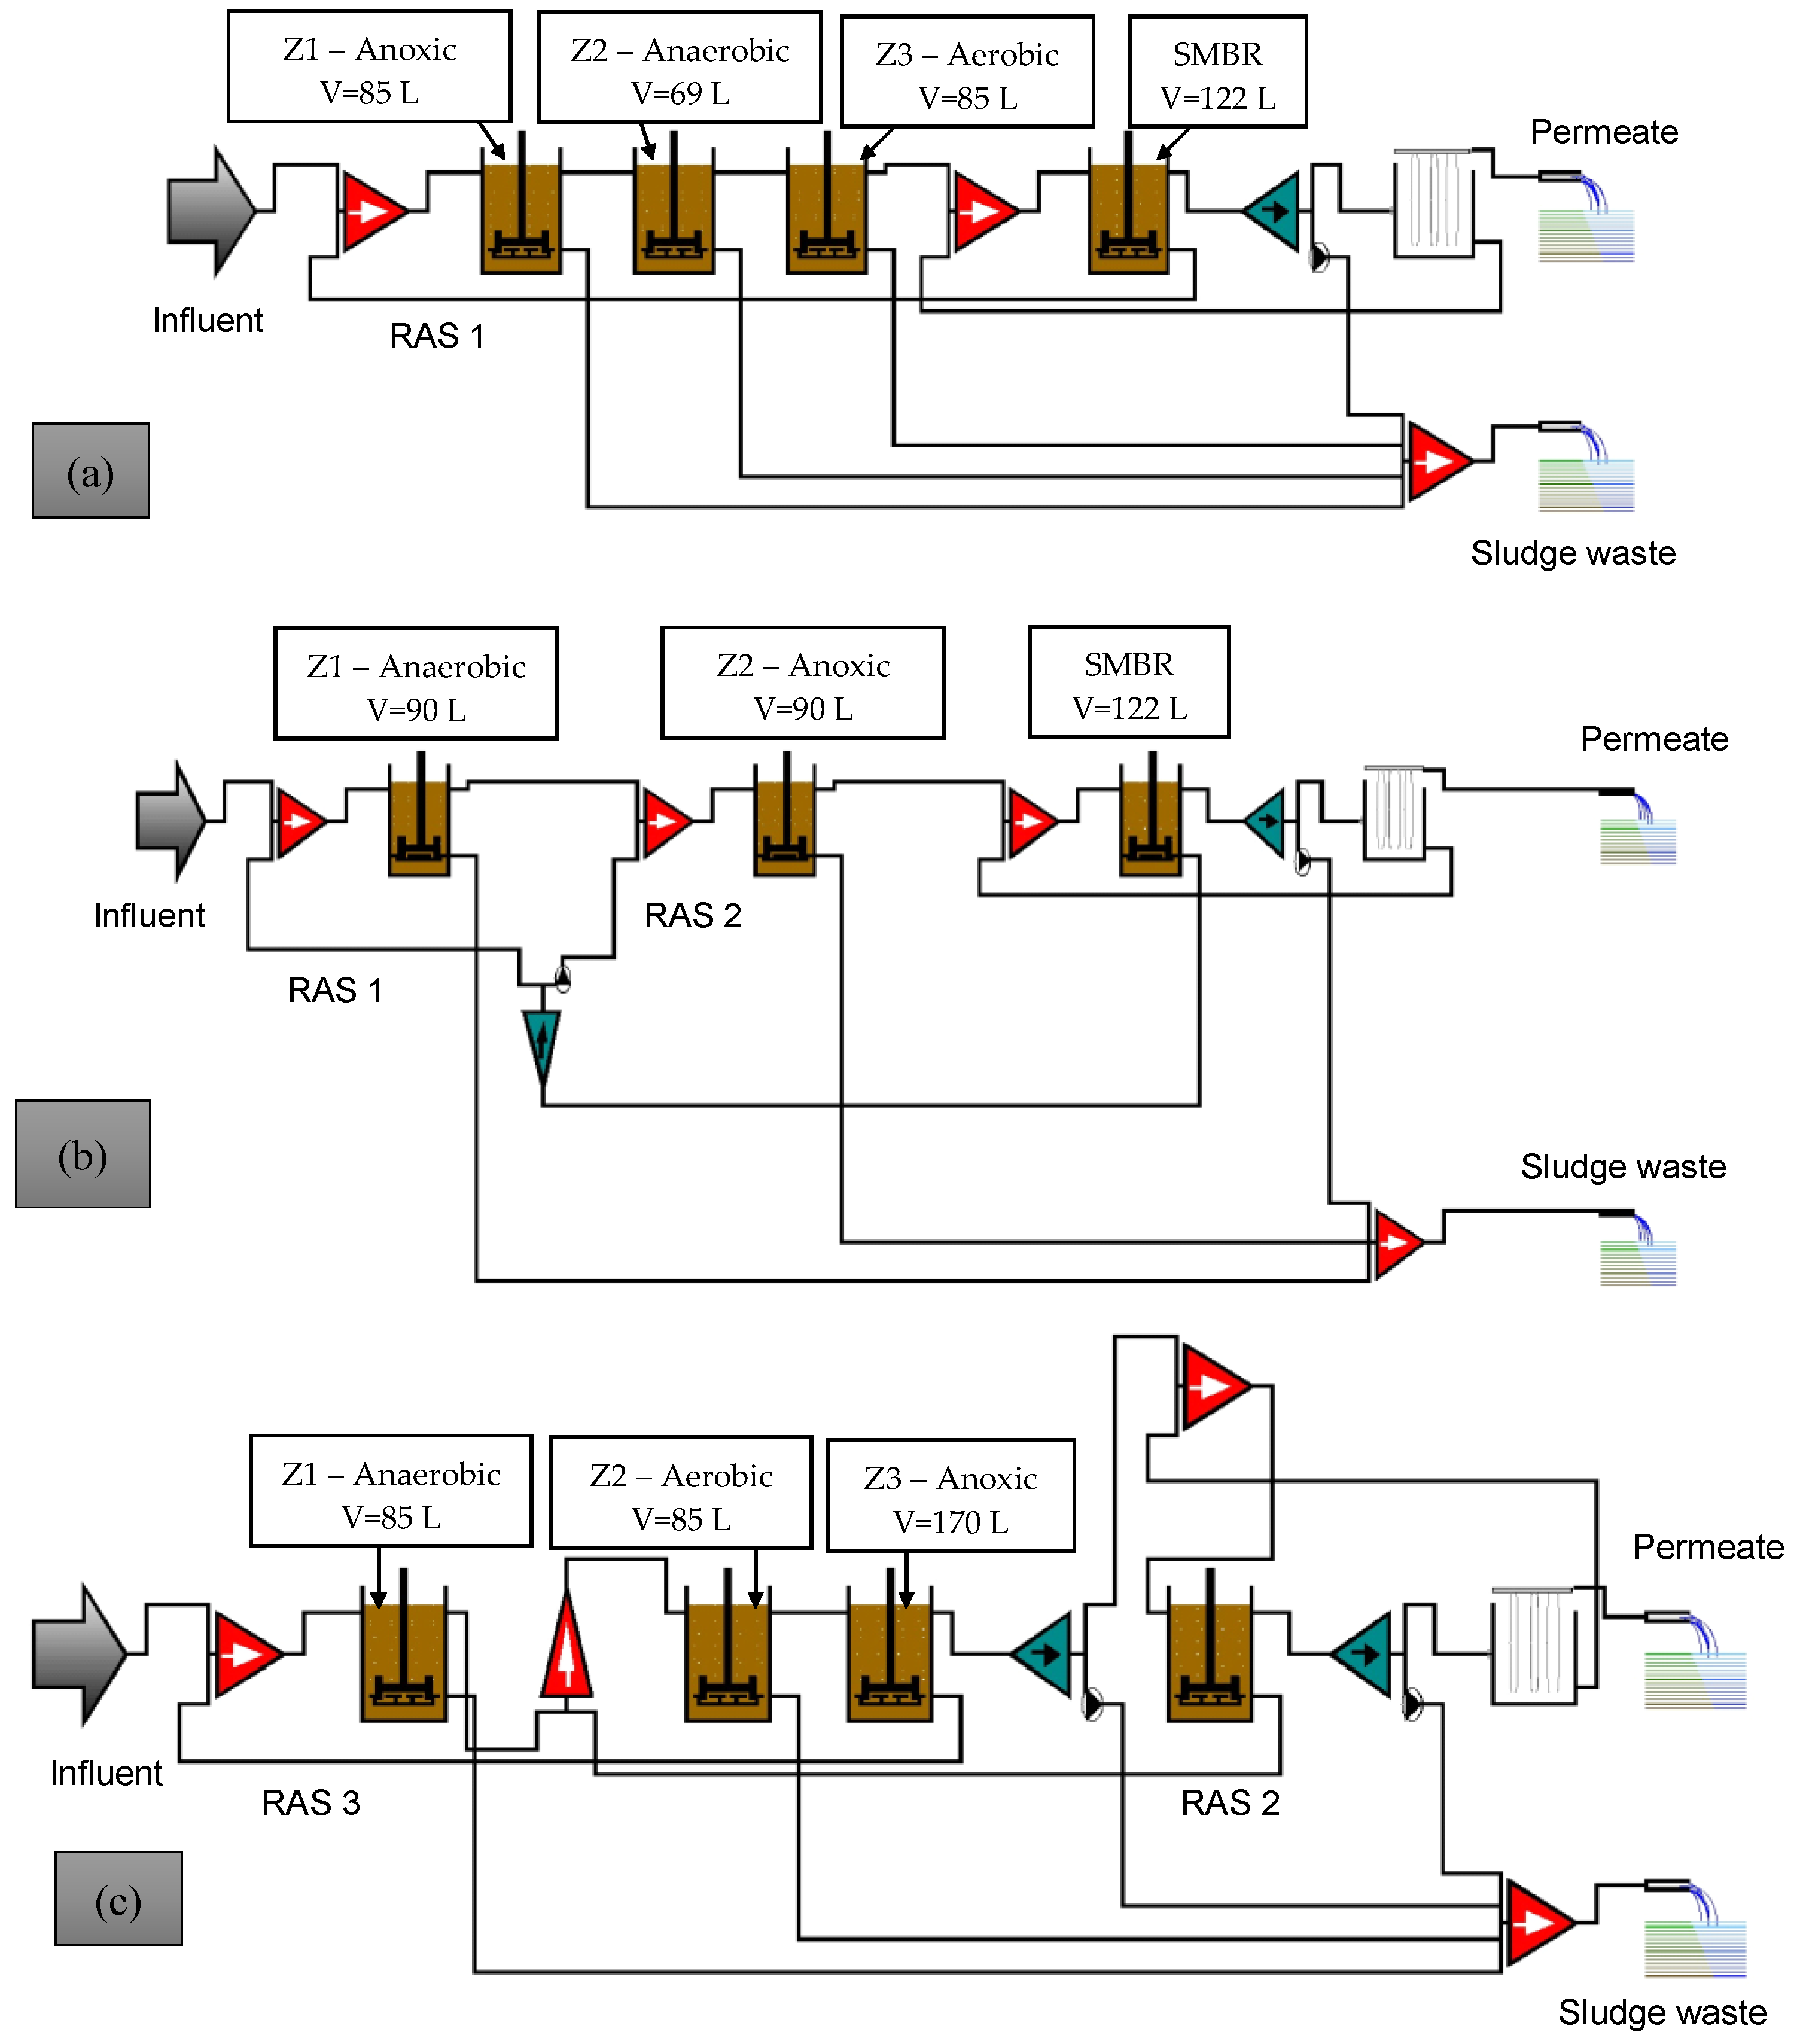
Figure 1. Schematic of the ASM model setup in GPS-X for Configurations (a) No. 1, (b) No. 2, and (c) No. 3.
Environments 11 00260 g001
Table 1. Operating conditions.
ParameterUnitsRun No.
1234
Configuration No. 1223
SRTd53 ± 917 ± 236 ± 931 ± 3
HRTh7.9 ± 0.56.2 ± 0.36.0 ± 0.26.9 ± 0.3
Duration of pilot plant operationd392836472
Influent flowL/h57 ± 748 ± 648 ± 767 ± 3
Total reactor volumeL461302292462
Volume fractions (%)
Anaerobic 37302918
Anoxic 18302937
Aerobic (including SMBR) 45404245
Recycling ratio
RAS 1 3.1 ± 0.71.0 ± 0.31.1 ± 0.3-
RAS 2 -3.2 ± 0.93.1 ± 0.83.0 ± 0.3
RAS 3 ---1.1 ± 0.4
Note: values represent μ ± σ .
Table 2. Influent wastewater composition.
ParameterUnitRun No.
1234
Configuration No. 1223
Temperature°C18.7 ± 4.1 [106]18.6 ± 2.8 [72]22 ± 1.8 [56]20.6 ± 3 [71]
pH 7.5 ± 0.3 [75]7.3 ± 0.2 [60]7.3 ± 0.2 [54]7.5 ± 0.2 [16]
AlkalinitymgCaCO3/L530 ± 58 [22]531 ± 62 [27]474 ± 65 [20]455 ± 47 [25]
TSSg/L0.21 ± 0.07 [21]0.22 ± 0.28 [29]0.28 ± 0.36 [21]0.15 ± 0.04 [24]
VSSg/L0.17 ± 0.06 [21]0.12 ± 0.15 [25]0.17 ± 0.25 [20]0.10 ± 0.04 [24]
CODmg/L371 ± 97 [22]262 ± 73 [29]236 ± 56 [20]320 ± 86 [23]
TNmgN/L62.3 ± 17.8 [27]60.6 ± 14.1 [29]44.1 ± 13.2 [20]39.2 ± 7.3 [24]
NH3mgN/L42.7 ± 11.6 [26]59.5 ± 15.2 [29]40.7 ± 14.5 [20]30 ± 7.9 [25]
NO2mgN/L1.0 ± 0.9 [26]0.48 ± 0.37 [29]0.14 ± 0.28 [20]0.26 ± 0.22 [25]
NO3mgN/L1.8 ± 2.0 [26]0.79 ± 0.96 [29]0.27 ± 1.08 [20]1.50 ± 2.11 [25]
TPmgP/L6.10 ± 1.9 [19]5.6 ± 2.7 [29]5.2 ± 1.8 [20]6.4 ± 2.6 [26]
Soluble nitrogen fraction%88 ± 0.6 [10]92 ± 13 [27]88 ± 29 [16]82 ± 21 [22]
Soluble phosphorous fraction%17 ± 16 [7]21 ± 11 [29]6 ± 4 [20]9 ± 10 [25]
Note: values represent μ ± σ  [ ].
Table 3. Influent COD, nitrogen, and phosphorous fractions.
ParameterRun No.
1234
COD fractions (%)
  • Total soluble
423835.939
  • Inert soluble
9910.39
  • Inert particulate
201912.817
  • Readily biodegradable
332925.430
  • Slowly biodegradable
384351.545
Soluble nitrogen fraction (%)88928882
Soluble phosphorous fraction (%)172169
Notes: values are presented as yielding in percentage.
Table 4. Mean influent characteristics.
ParameterUnitValueFractionValue
Chemical oxygen demandmgCOD/L340VSS/TSS0.78
TKNmgN/L34Total soluble COD fraction0.39
NH3mgN-NH4/L28Inert fraction of soluble COD0.17
Nitrogen oxidesmgN/L0.5Fraction of slow COD0.62
AlkmgCaCO3/L490VFA fraction of soluble COD0.00
TPmgP/L6.0Orthophosphate fraction0.80
SPmgP/L4.0NH₃ fraction1.00
XCOD/VSS1.76
BOD5/BODu0.66
Table 5. Operating parameter conditions for analysing N-REM behaviour.
Variable Operating ParameterSRT
(d)
HRT
(h)
RAS
(L/h)
Aerobic
Fraction
SRT5–1006120Table 1
HRT204–15120Table 1
RAS2066–360Table 1
Aerobic volume fraction2061200.3–1
Table 6. Adjusted operating parameters and influent fractions for Activated Sludge Model 1.
ParameterRun
1234
Flows (L/h)
Sludge waste0.25 (0.27)0.55 (0.51)0.27 (0.27)0.50 (0.47)
RAS 1120 (176)250 (201)230 (202)-
RAS 2-152 (154)147 (149)204 (201)
RAS 3---120 (74)
Influent fractions
XCOD/VSS1.881.881.741.76
Soluble COD0.29
(0.42 ± 0.18)
0.29
(0.38 ± 0.11)
0.33
(0.36 ± 0.12)
0.39
(0.39 ± 0.14)
Inert COD0.25 (0.18)0.25 (0.18)0.31 (0.22)0.17 (0.19)
VSS/TSS0.85 (0.81)0.85 (0.71)0.73 (0.74)0.78 (0.73)
Note: values highlighted in blue colour were measured in pilot plant trials.
Disclaimer/Publisher’s Note: The statements, opinions and data contained in all publications are solely those of the individual author(s) and contributor(s) and not of MDPI and/or the editor(s). MDPI and/or the editor(s) disclaim responsibility for any injury to people or property resulting from any ideas, methods, instructions or products referred to in the content.