Article

Environmental Impact of Wind Farms

by
Mladen Bošnjaković
1,*,
Filip Hrkać
1,
Marija Stoić
1 and
Ivan Hradovi
2
1
Technical Department, University of Slavonski Brod, Trg Ivane Brlić Mažuranić 2, 35000 Slavonski Brod, Croatia
2
Industrial School, E. Kumičića 55, 35000 Slavonski Brod, Croatia
*
Author to whom correspondence should be addressed.
Environments 2024, 11(11), 257; https://doi.org/10.3390/environments11110257
Submission received: 3 September 2024 / Revised: 13 October 2024 / Accepted: 14 November 2024 / Published: 16 November 2024
(This article belongs to the Collection Trends and Innovations in Environmental Impact Assessment)

Abstract

:
The aim of this article is to analyse the global environmental impact of wind farms, i.e., the effects on human health and the local ecosystem. Compared to conventional energy sources, wind turbines emit significantly fewer greenhouse gases, which helps to mitigate global warming. During the life cycle of a wind farm, 86% of CO2 emissions are generated by the extraction of raw materials and the manufacture of wind turbine components. The water consumption of wind farms is extremely low. In the operational phase, it is 4 L/MWh, and in the life cycle, one water footprint is only 670 L/MWh. However, wind farms occupy a relatively large total area of 0.345 ± 0.224 km2/MW of installed capacity on average. For this reason, wind farms will occupy more than 10% of the land area in some EU countries by 2030. The impact of wind farms on human health is mainly reflected in noise and shadow flicker, which can cause insomnia, headaches and various other problems. Ice flying off the rotor blades is not mentioned as a problem. On a positive note, the use of wind turbines instead of conventionally operated power plants helps to reduce the emission of particulate matter 2.5 microns or less in diameter (PM 2.5), which are a major problem for human health. In addition, the non-carcinogenic toxicity potential of wind turbines for humans over the entire life cycle is one of the lowest for energy plants. Wind farms can have a relatively large impact on the ecological system and biodiversity. The destruction of animal migration routes and habitats, the death of birds and bats in collisions with wind farms and the negative effects of wind farm noise on wildlife are examples of these impacts. The installation of a wind turbine at sea generates a lot of noise, which can have a significant impact on some marine animals. For this reason, planners should include noise mitigation measures when selecting the site for the future wind farm. The end of a wind turbine’s service life is not a major environmental issue. Most components of a wind turbine can be easily recycled and the biggest challenge is the rotor blades due to the composite materials used.

1. Introduction

In recent decades, we have been confronted with major climatic changes that affect not only humans but also flora and fauna, i.e., the entire economy. Electrification of the global economy in combination with rapid decarbonisation of the electricity grid is considered a key measure to mitigate climate change, i.e., to cut greenhouse gas emissions (GHG) and keep global warming to less than 2 °C [1]. In this context, the electricity generation sector should make an important contribution by replacing power plants using conventional fuels with power plants using renewable energy sources.
Wind farms have attracted considerable attention as one of the most promising renewable energy sources. During their lifetime, wind turbines produce thirty to fifty times as much energy as they consume [2,3], that is, the average energy payback of 5 to 10 months. Understanding the impact of wind farms on the environment is very important as wind farms, together with photovoltaic systems, are expected to produce over 60% of electricity by 2050 [4]. Wind energy, often declared as a clean and renewable energy source, undoubtedly offers significant advantages over traditional fossil fuels, lowering carbon emissions and relying less on non-renewable energy sources, for example.
It should also be emphasised that the use of wind turbines instead of power plants using conventional fuels contributes to a significant reduction in the emission of PM2.5 particles, which are a major problem for human health, and the emission of other harmful substances. As a result, the non-carcinogenic toxicity potential for humans over the entire life cycle is one of the lowest for wind turbines [5]. Not to mention the reduction in acid rain as a result of pollutant emissions from thermal power plants, which have a very harmful effect on plants, but also on man-made buildings. All this ultimately has a significant economic impact on the economy through reduced investment in the treatment of people, reduced investment in environmental protection and the creation of new jobs related to the design, manufacture of renewable energy installations, assembly and maintenance of these installations.
However, the presence of wind farms and their operation in natural landscapes are not without impact on the environment. This usually refers to wind farms, which include not only a large number of wind turbines, but also infrastructure in the form of access roads, cleared areas, substations and transmission lines, and auxiliary facilities. Environmental impacts include a number of factors, including land take, particularly land for agriculture, disturbance of wildlife habitats, increased availability of land for transport, recreation and tourism, which also affects wildlife, noise pollution during installation, operation and dismantling of wind farms, the effects of shade and flashes, and even changes to the microclimate (e.g., surface temperature) around them. In addition, the installation and maintenance of wind farms can lead to soil degradation and potential impacts on local water resources. The construction of wind farms involves considerable intervention in the soil, including the clearing of vegetation, excavation work and the construction of access roads. These activities can lead to soil compaction, erosion and loss of soil structure. Soil compaction can reduce the soil’s ability to absorb water, leading to increased runoff and erosion. This can also lead to sediment and pollutants entering nearby water bodies and degrading water quality. Wind farms can also lead to a significant reduction in soil moisture, which can further exacerbate soil degradation and affect local vegetation [6,7].
Applying strategies to minimise these risks, such as careful siting and design of turbines and implementation of mitigation measures, can help lower the impact on people and local ecosystems. In some cases, wind farms can be built on brownfields or other unusable land, which can mitigate these issues.
In terms of GHG, the impact on the environment determines the amount and type of materials and energy used in the installation, regular maintenance and end-of-life of the wind turbine, as well as the electricity generated during its lifetime and the origin of the local electricity in the grid that is replaced.
Offshore wind farms also have an impact on flora and fauna. A comprehensive description of these impacts was given by Bennun et al. [8]. According to them, the main impacts of offshore wind farms on the local ecosystem include the risk of mortality due to collisions of birds and bats with the wind turbine, migration due to disturbance (including noise), barrier effects, loss of habitat and indirect impacts at the ecosystem level. They also explain that offshore wind farms can have positive effects on biodiversity under certain circumstances. These include the creation of new habitats, artificial reefs and “fishing reserves”, an effect in which the marine fauna increases due to the exclusion of fishing. Studies in the North Sea confirm such statements [9].
Wind turbines are being built in ever larger dimensions and are becoming ever more efficient [4]. The first factor implies above all a greater height of the tower and a larger diameter of the blades. The wind speed (kinetic energy) increases with the height of the tower [10], and a larger diameter of the blades means a larger amount of captured air. Both directly increase the capacity and performance of the turbine. This also leads to a lower environmental impact per MWh of electricity generated [11]. Technological maturity includes the experience gained over time, which leads to higher efficiency of the design and power generation, as well as improvements in the technology itself, like the application of more effective blade materials [4]. It is estimated that these two factors reduce the environmental impact of wind energy during its lifetime by 14% for every doubling of capacity [11].
In short, understanding all the environmental impacts of wind farms, both among planners, investors and the public, is crucial for the sustainable development of wind energy to ensure that its growth contributes positively to environmental goals and does not provoke protests from local communities.

2. Materials and Methods

The aim of this study is to present the impact of onshore and offshore wind farms on the environment using the latest available data. There are different approaches to this topic. The first approach is to analyse specifically onshore wind farms and offshore wind farms and define the individual human, environmental and ecosystem impacts within these two categories. Another approach would be to systematise the topic according to the type of impact and analyse the human, environmental and ecosystem impact within these categories. The authors have opted for the third approach. This approach systematises the topic as follows:
  • Impacts on the global ecosystem, which includes analysing CO2 emissions and water consumption (water footprint);
  • Impact on people, including the impact on human health, the emission of toxic substances, the impact of noise, the impact of shadows and flashes, the risk of ice flying off the blades, the risk of parts of the blade flying off and the impact on radio waves and air traffic;
  • Impacts on the local ecosystem, including land take, habitat destruction, collisions of animals with the wind farm, noise and vibration impacts;
  • Impacts on the environment in the “end-of-life” phase.
The last chapter can be analysed in conjunction with the previous chapters, but due to the special nature of the topic, the authors have chosen to present it separately.
Key questions were then defined for each substantive unit, which were attempted to be answered. This meant that keywords were defined on the basis of which a search was carried out in various document databases to find answers to the questions posed. Initially, scientific databases such as Web of Science, Scopus, PubMed, Wiley Online Library and others were searched. Some of the information was obtained from articles published in journals from academic publishers such as Elsevier, MDPI, Taylor and Francis, articles from IEEE, articles from international conferences and specialised literature. Some information is taken from reports by the International Renewable Energy Agency, NREL and associations promoting the use of wind energy and environmental protection in Europe, such as WindEurope.
All important data sources for evaluating the impact of wind turbines on the environment are mainly the result of the LCA method (Life Cycle Assessment). The LCA method is a scientifically based technique for assessing the various environmental impacts, human health impacts and resource consumption associated with the life cycle of products, processes or activities. A key feature of the LCA method is its comprehensive approach, sometimes referred to as “cradle-to-grave”. This ensures that all material and energy flows, waste and emissions to air, water or soil are taken into account, from the extraction of raw materials for the manufacture of components to decommissioning at the end of the life cycle. There are two approaches to describing the impact on the environment. The first approach is to present the results using the mean value and/or the mean value factor or the final value approach and/or the final value indicator [12]. More about the LCA method can be found in the COMMISSION RECOMMENDATION (EU) 2021/2279 on the use of environmental footprint measurement methods for measuring and reporting on the environmental performance of products and organisations during their life cycle and in life cycle assessment for policy impact assessment [13,14].
This paper provides a thorough understanding of the problem of the impact of wind farms on the environment and can be an excellent basis for young scientists interested in this area to choose their narrower field of research and make their scientific contribution to it. Precisely because of the volume, there was no space to go into individual problem areas in depth, but the reader is referred to numerous interesting works that deal with individual problems in detail. In analysing the issues relating to land use, the authors have also contributed their own thoughts and calculations.

3. Results and Discussion

The increasing use of wind turbines as a source of “clean” energy is bringing about significant changes for the environment. The positive effects of wind farms on the environment are numerous, but the negative effects should not be overlooked. Wind farms are built both on land and at sea. It is, therefore, important to understand their individual impact on the environment, but also on people in detail, so that the right decisions can be made about the development of future wind farm projects and the application of environmental protection measures where necessary.

3.1. Emission of Greenhouse Gases

The most commonly used method for comparing the CO2-equivalent emissions of different energy systems is the calculation of carbon intensity. This is the total emission of CO2-equivalents during the lifetime of energy systems in relation to their total electricity production (e.g., kg CO2eq/MWh).
The life cycle of a wind turbine can be divided into four phases:
1. Manufacturing the components of a wind turbine;
2. Installation of a wind turbine;
3. Operation of the wind turbine;
4. End of service life.
When applying the life cycle assessment, the quantities of energy and raw materials consumed in each phase are recorded in detail. This includes materials such as concrete, steel, fibreglass, copper and others, as well as the energy consumed to manufacture the components of the wind turbine. The LCA also includes the fuel used by ships and lorries to transport the wind turbine components from the factory to the installation site. For each amount of energy consumed, the amount of CO2 equivalents can be calculated and when added up, the total amount of CO2 equivalents generated during the life cycle of the wind turbine is obtained. The amount of CO2 equivalents is determined by several factors, e.g., the origin of the electricity from the grid used to manufacture the wind turbine components, the technology used to manufacture the components, the method and distance used to transport the components and others. For this reason, the results obtained can vary greatly from one wind farm to another. The results should be reported separately for onshore and offshore wind farms, as the amount of materials and energy used and the amount of energy generated by the wind farms during their lifetime are different. Mello et al. [15], for example, found that offshore wind farms have higher CO2 emission rates than onshore wind farms.
In order to obtain a more comprehensive picture of how large the CO2eq/MWh emissions of wind turbines are, a comparison is made with other energy systems [5,16,17,18]. Figure 1 shows that wind power plants have significantly lower emissions of CO2 equivalents per kWh compared to thermal coal and natural gas power plants and slightly lower emissions compared to Photovoltaic (PV) and Concentrated solar power (CSP) plants. In addition, studies by the United Nations Economic Commission for Europe (UNECE) [5] have shown that wind turbines also have a positive effect on air quality, as they do not emit harmful particles and pollutants.
It should be noted that for coal-fired thermal power plants (Europe), greenhouse gas emissions in the operating phase account for about 87% of total lifetime emissions [5], and that the phase of manufacturing plant components and installing the plant accounts for only about 1% of total greenhouse gas emission. The situation is similar for natural gas-fired thermal power plants (Europe); greenhouse gas emissions in the operating phase account for around 84% of total lifetime emissions [5], and the phase of manufacturing plant components and installing the plant also accounts for around 1% of total greenhouse gas emission.
On the contrary, a full 86% to 90% of CO2 emissions are attributable to the life cycle of the wind turbine, the manufacture of the wind turbine components and the assembly phase. The rest of the emissions come from the transport of the components, the establishment of access roads and ancillary facilities, the operating phase of the wind turbine and the dismantling, recycling and disposal of the components at the end of their service life [15,19]. In the operating phase, greenhouse gases are only emitted during maintenance.
Furthermore, Mello et al. [15] state that the largest amount of CO2 is emitted during the construction of the towers (51%), followed by the construction of the foundations (20%), the construction of the nacelles (16%) and the construction of the wind turbine blades (10%). We can illustrate the quantities involved for a typical 4 MW onshore wind turbine.
The concrete foundation for the wind farm is responsible for a fairly large proportion of the CO2 emissions. Cement, which is an important component in the construction of foundations, causes 5 to 8% of global CO2-equivalent emissions [20,21]. In most cases, an inverted “T” shape is used for the construction of wind turbine foundations. According to the National Renewable Energy Laboratory (NREL), approximately 398.1 tonnes of concrete per MW of wind turbine capacity are required to construct the foundation of an onshore wind farm [22]. Assuming that 1 tonne of concrete corresponds to 2.4 m3, this means that around 398.1/2.4 = 165.9 m3 of concrete is required for the foundation of a 1 MW wind turbine. Assuming an emission of 0.335 tonnes CO2 eq./m3 concrete [23], it follows that a 4 MW wind turbine requires 664 m3 concrete for the foundation and emits 222 t CO2 eq.
In their study, Li et al. [24] propose the use of prefabricated foundations, whose parts are manufactured in the factory with quality control and assembled at the wind turbine site, instead of a foundation that is completely manufactured at the onshore wind turbine site. According to them, the prefabricated foundation reduces the consumption of concrete by 30% and of reinforcement by 13.69% compared to a conventional foundation. It follows that the use of a prefabricated foundation has a good potential to reduce CO2 equivalent emissions, as CO2 emissions are proportional to material consumption. The Palmers Creek wind farm was the first to use a prefabricated spread foundation for one of its wind turbines.
The use of supplementary cementitious materials (SCMs) with the aim of limiting the clinker content of Portland cement is an alternative option [25]. There are a number of SCMs, including fly ash, limestone filler, slag, natural pozzolans and silica, whose addition in appropriate proportions can reduce not only CO2 emissions but also other environmental impacts. However, it should be borne in mind that such concrete may have a slightly lower performance.
Around 66 tonnes of steel per MW are used for a wind turbine tower [22]. Around 264 tonnes of steel are required for a 4 MW wind turbine tower, which corresponds to 504 tonnes of CO2 emissions (1.91 tonnes of CO2 emission per tonne of cast raw steel [26]). The nacelle weighs around 140 tonnes, resulting in the emission of 267.4 CO2 equivalents, and the rotor weighs around 100 tonnes, resulting in the emission of 191 CO2 equivalents.
A typical blade for a 4 MW wind turbine weighs around 14 tonnes. The main materials used in the manufacture of turbine blades are glass fibre and resin (75% of the total weight of the blade). Of these, 60% to 67% are glass fibres and 40% to 33% are resin [27,28]. The material consumption (and thus energy consumption and GHG emissions) in the maintenance phase of wind turbine blades is low and amounts to 1.5 to 4.5% of the mass of the blade. According to Morina et al. [28], the total emissions for a blade with a mass of 14.91 tonnes and an assumed lifetime of 25 years amount to 111.6 t CO2-eq, with transport accounting for 28.9% of emission. It is, therefore, clear that the distance over which the blades are transported can have a significant impact on the total emission of CO2 equivalents. It should also be noted that the use of carbon fibre reinforced plastic reduces the weight of the blades, but increases CO2 emissions by up to 60% compared to the use of glass fibre reinforced plastic.
The transport of rotor blades, towers, generators and other parts of wind turbines usually requires the use of vehicles that mainly use fossil fuels for propulsion. It is assumed that the CO2 footprint during transport is 0.071 kg/MJ [28]. A more detailed analysis of energy consumption and carbon footprint emissions depending on the type of transport and distance can be found in Table 1
It should be noted that most LCA studies for wind farms do not take into account the recycling of rotor blades at the end of their service life. According to the analysis by Pincelli et al. [18], the following results are obtained when different solutions for the disposal of rotor blades at the end of their useful life are considered: 10.8 gCO2eq/kWh for disposal (baseline scenario), 10.3 gCO2eq/kWh for mechanical recycling and 9.7 gCO2eq/kWh for chemical recycling. However, chemical recycling is still at the experimental stage, while mechanical recycling is a mature technology (Yang et al. [29]).
Some manufacturers of wind turbines report significantly lower CO2 emissions. Vestas, for example, states emissions of 4.4 to 6.2 gCO2eq/kWh in its report for 2023 and plans to further reduce CO2 emissions in all phases of the wind farm life cycle [3]. It will therefore come as no surprise if CO2 emissions are many times lower in 2030 and especially in 2040.

3.2. Water Footprint

Water has always been one of the most important resources for life on earth and will remain so. The Organisation for Economic Co-operation and Development (OECD) Environmental Outlook [30] predicts a 55 per cent increase in global water consumption between 2000 and 2050 and that there will be serious water shortages for about 40% of the world’s population that live in river basins (when withdrawals exceed 40 per cent of available supplies). In view of the fact that 9 billion people will be living on Earth by 2050, the urbanisation process, the demand for food and energy and the resulting pressure on the environment will increase. In addition, the predicted deterioration in water quality will increase uncertainty about the future availability of water. All this suggests that we should look for ways to reduce water consumption now.
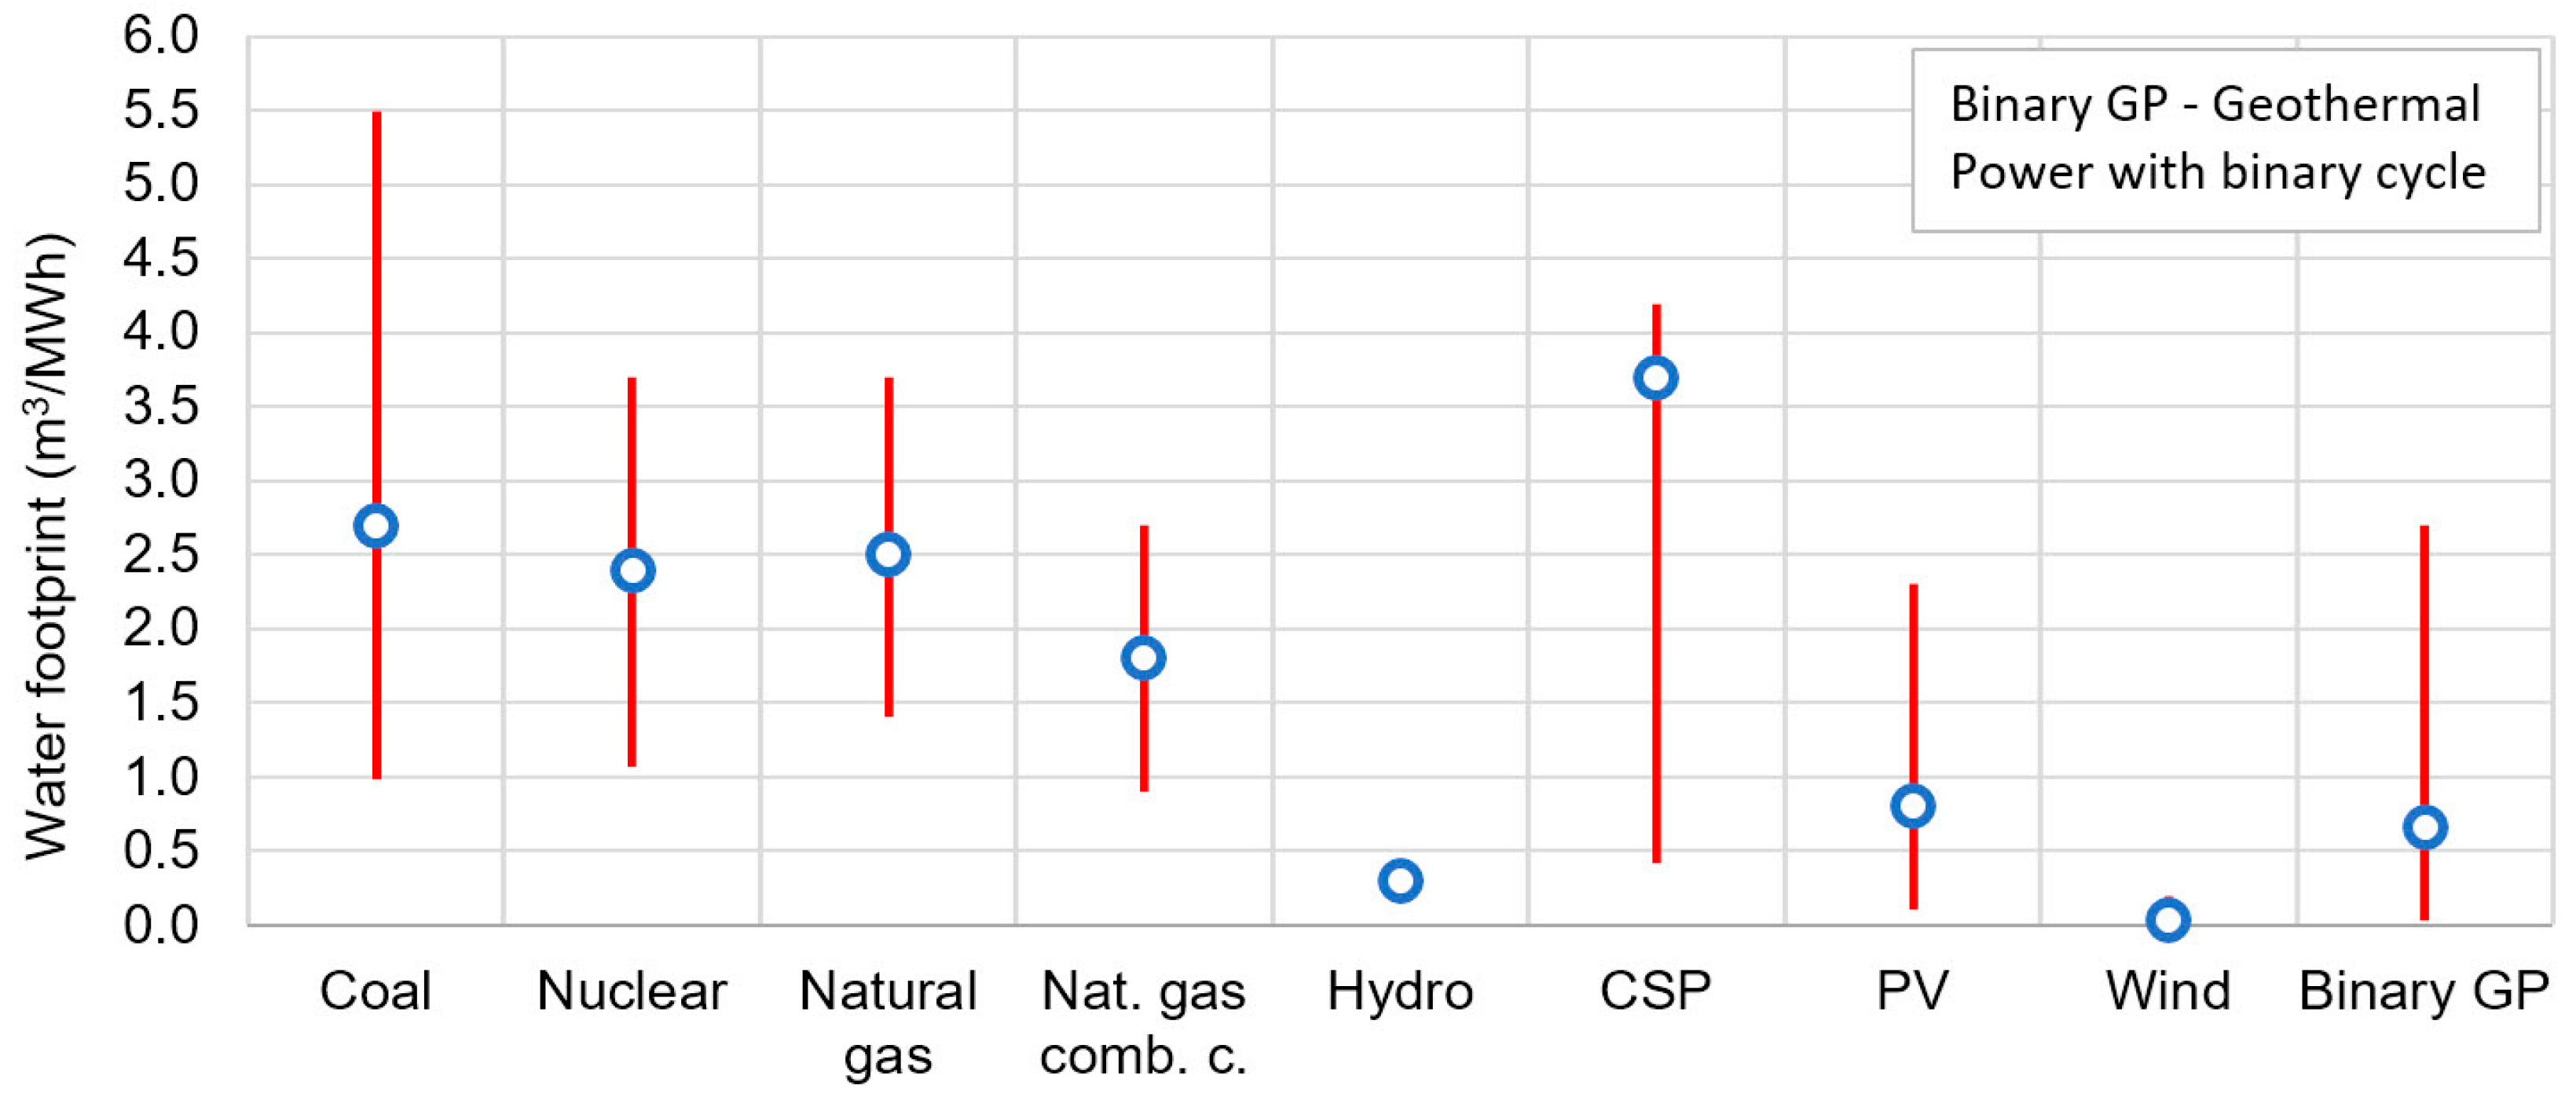
A generally recognised indicator of water consumption in the energy sector is the water footprint (WF), which measures the amount of fresh water consumed in the supply chain per unit of gross electricity generated. This means that, in addition to the operating phase of the plant, the water consumption for the production of the plant components and the water consumption when dismantling the plant at the end of its service life should also be taken into account. Based on the data [5,16,31,32], Figure 2 shows the WF for different power generation technologies. The range of values for each main technology varies and depends on numerous factors, such as the geographical area, the mix of electricity in the grid, the capacity of the plant, the specifics of the technology used and other factors.
Figure 2 does not show (due to the scale) the water footprint of biomass power plants, which is about 85 m3/MWh, with most of the water used for irrigation of perennials. This is about 121 times more than the maximum water consumption of wind farms [33]. The figure shows that the smallest WFs are for wind power plants, run-of-river power plants and photovoltaic power plants. Conventional power plants have a high WF because they use a lot of water to complete the thermodynamic cycle’s condensation phase, while coal-fired power plants require water for fuel cleaning and treatment. CSP power plants also consume large amounts of water for the condensation part of the thermodynamic cycle.
The water consumption of wind farms includes the water consumption during the entire lifetime of the wind farm [33]. The construction process of wind farms includes the construction of the foundations for the towers, the installation of the turbines and the construction of access roads and ancillary facilities. These activities require the use of water to mix concrete, cool the equipment and clean the work areas. Regular maintenance of wind farms, which includes inspection and replacement of parts, may require the use of water to clean and cool the equipment, but this water consumption is negligible. The highest water consumption occurs in the first phase, i.e., during the manufacturing of the wind farm components and their assembly, while the annual water consumption during the operation of the wind farm is negligible. Saidur et al. [34] estimated the specific water consumption of wind turbines in the operation phase to be about 4 L/MWh, which corresponds to about 0.6% of the water consumption in the life cycle of the wind turbine, which amounts to 670 L/MWh. Very similar results were obtained by Jia et al. [35]. They give a value of 640 L/MWh.
According to a 2014 report by the European Wind Energy Association [36], wind energy avoided the consumption of 387 million cubic metres of water in 2012 and is estimated to avoid the consumption of up to 1.57 billion cubic metres of water in 2030, based on calculations based on the EC 2050 Energy Roadmap projections.

3.3. Impact on Humans

3.3.1. Impact on Human Health

Wind energy projects can have a variety of impacts on human health and well-being, including both positive and negative aspects. Positive impacts are most commonly observed through the improvement of air quality (less emission of dust particles). These positive impacts on health and well-being are generally broader and can benefit people living in areas where conventional power generation technologies are less utilised, as wind energy can be substituted regionally. On the other hand, those who live near wind turbines suffer negative health effects from noise and shadow flicker, i.e., workers in the manufacture of wind turbine components, their assembly on site and regular maintenance of the wind turbine [37].
Although wind farms should not cause health problems during operation, residents mention that wind farms near their homes have caused health problems such as migraines, sleep disorders, chronic pain and high blood pressure [38,39].
In the manufacture of components for wind turbines, workers may be exposed to harmful influences, but these influences are not large and are within the usual limits for similar industries. Nevertheless, component manufacturers also endeavour to reduce these influences. For example, to avoid the emission of volatile organic compounds (VOCs) when painting the rotor blades of wind turbines, some companies are switching to low-VOC paints.

Toxicity

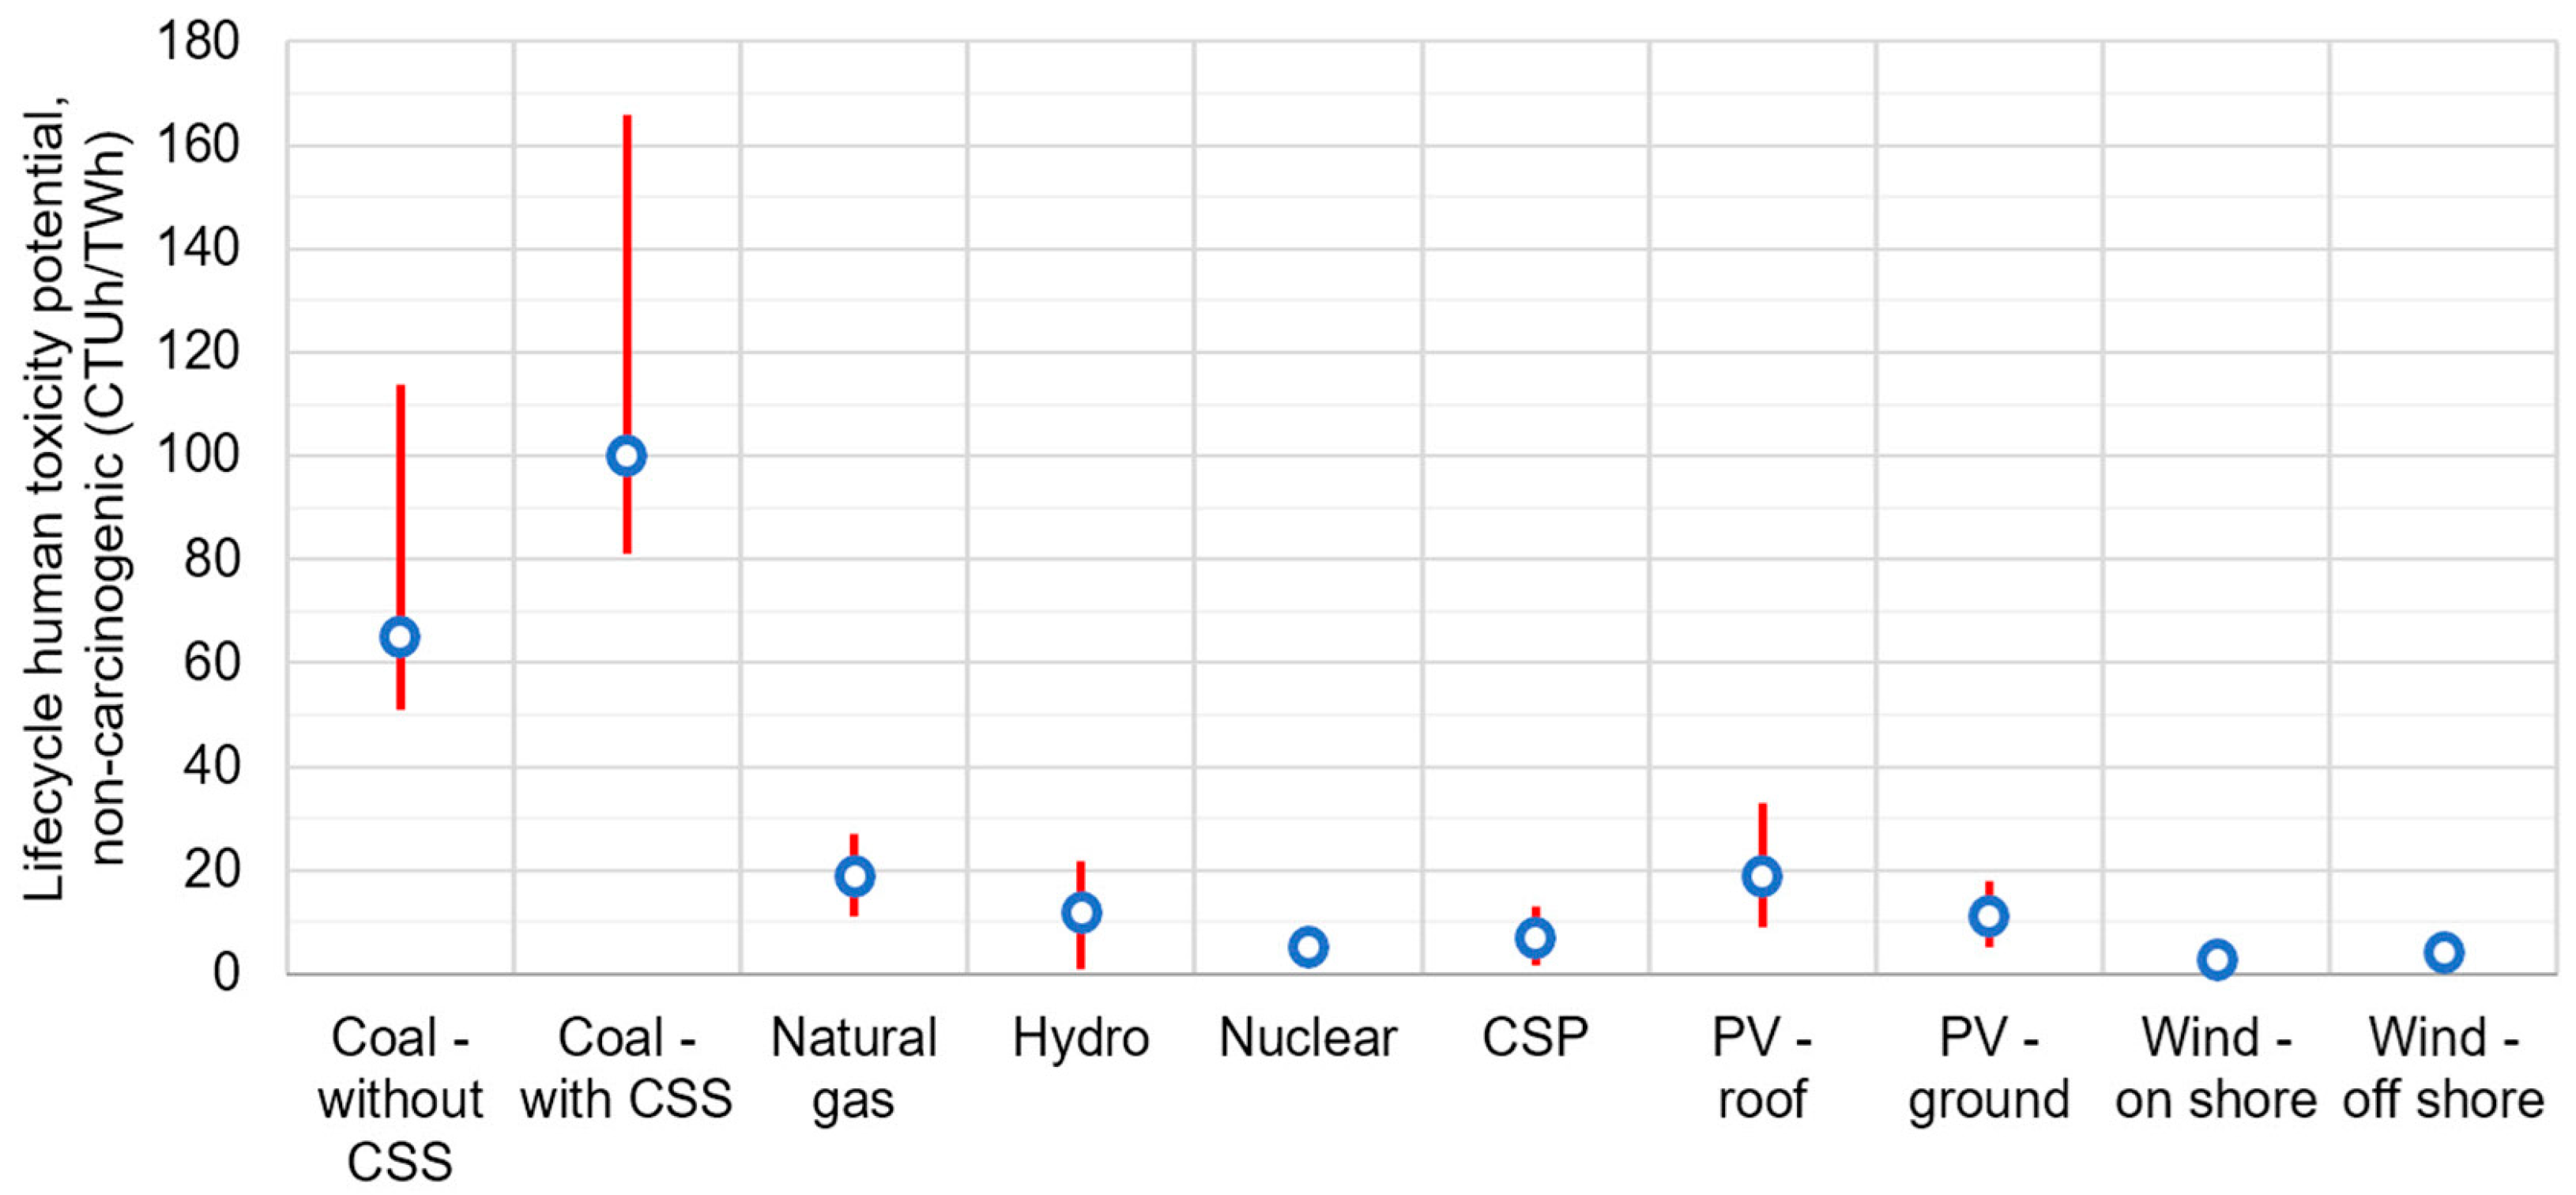
The toxicity of substances to humans can be expressed in different ways and is often expressed in CTUh (Comparative toxic unit for human). This is an impact assessment unit that represents the projected rise in morbidity per mass of chemicals released for the entire human population. Two markers are used to determine human toxicity: non-carcinogenic effects and carcinogenic effects. The substances that have the greatest impact on toxicity are arsenic, mercury, zinc, lead, cadmium and nickel [40]. Toxic chemicals can spread in the environment through various routes and contaminate air, soil and water. These substances can be inhaled through the air, ingested with food or water or absorbed through the skin [41]. Air pollution is one of the most important factors in human toxicity. The most important indicator of non-carcinogenic effects is particulate matter (PM), while heavy metals are the most important indicator of carcinogenic effects. Particulate matter is formed from a mixture of water droplets, dust and various chemical substances.
As far as non-carcinogenic effects are concerned, electricity generation from coal-fired power plants has the highest values [5]. The substance that contributes most to toxicity is arsenic, which is emitted into the air, onto the surface and into the groundwater during coal mining and the processing of coal ash in landfills. It enters the human body through inhalation or through water and food. Mercury, which is between 0.01 and 1.5 g per tonne of coal, also contributes to toxicity [42]. Onshore wind farms have an average of around 3.9 CTUh/TWh and offshore wind farms have an average of around 5.0 CTUh/TWh (Figure 3). Only small hydropower plants with an average of around 1.4 CTUh/TWh are lower [5].
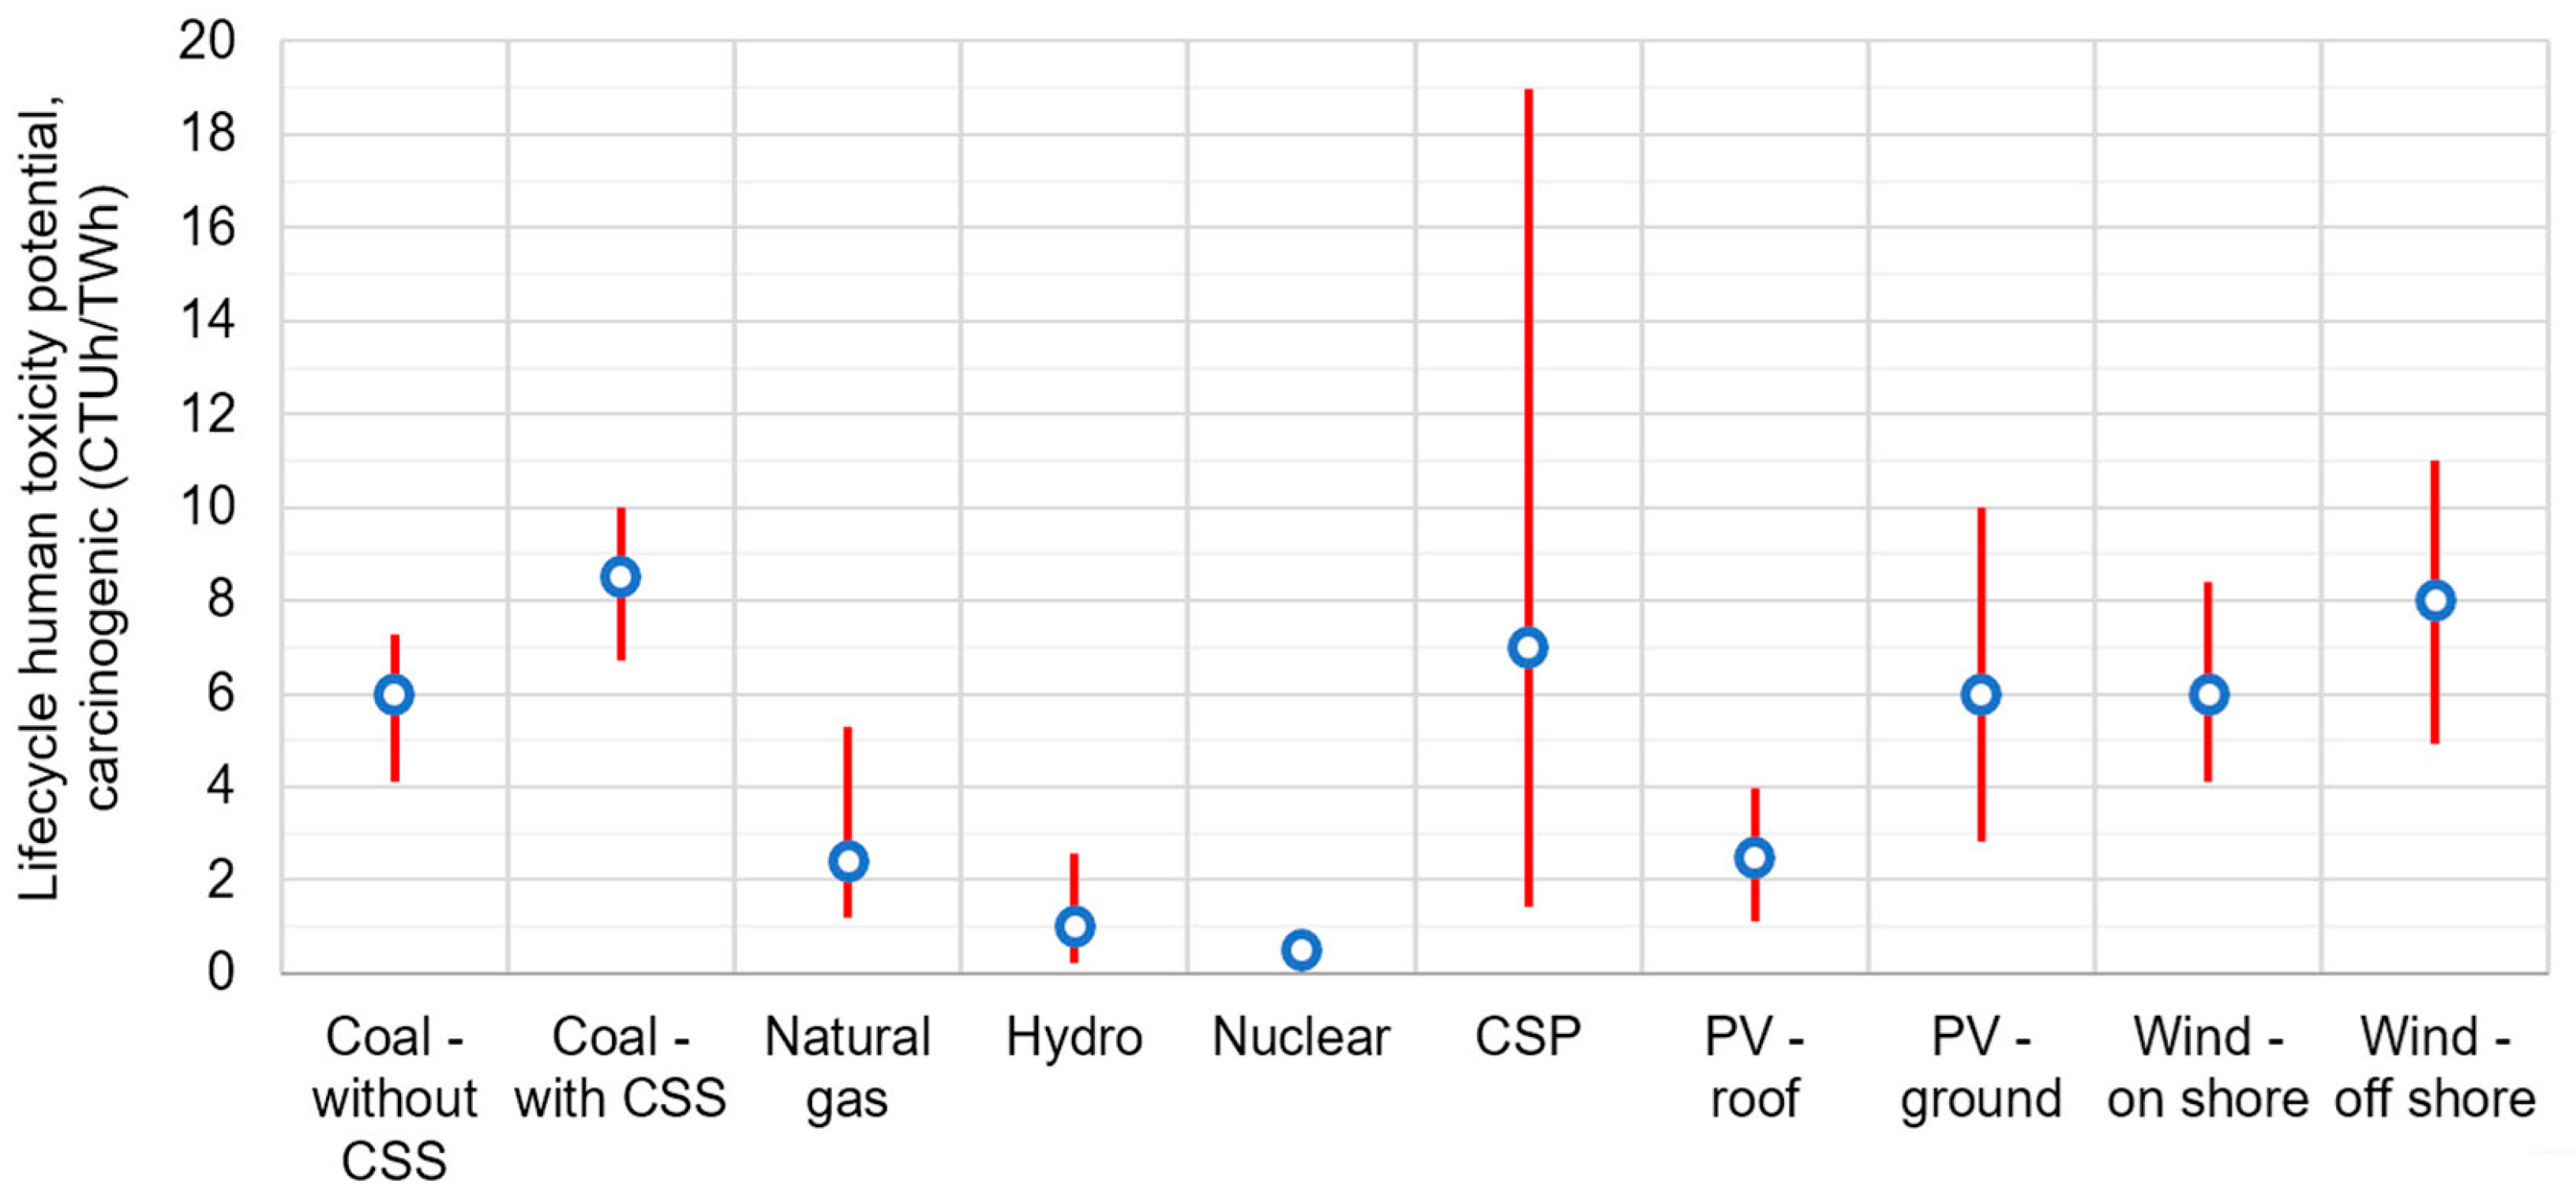
As far as the carcinogenic effects of chromium compounds and polycyclic aromatic hydrocarbons (PAHs) are concerned, mercury compounds and PCDDs + PCDFs (dioxins + furans) have the greatest carcinogenic potential in Europe [40]. The origin of chromium is related to the use of alloy steel and the treatment of slag from electric arc furnaces (landfill), a process that releases about 6 g of Cr(VI) per kg of treated slag into water. Chromium is also released during the combustion of coal, oil and gas. This impact category also includes residual chromium emissions to the air and arsenic (ions) emissions to water from waste treatment operations. Onshore wind farms have an average value of approx. 6.0 CTUh/TWh and offshore wind farms have a slightly higher average value of approx. 7.5 CTUh/TWh (Figure 4) due to the greater use of Zn and Cr for corrosion protection. For comparison, coal-fired power plants have an average value of approx. 5 CTUh/TWh [5].

Noise

Noise refers to unwanted sounds that are perceived as unpleasant, loud or disturbing or that may affect a person’s behaviour in other ways. In technology, noise has the additional connotation of signals that change irregularly over time, while sound refers to meaningful signals.
Aerodynamic and mechanical noise are the two main types of noise that wind turbines emit. Mechanical noise is generated by the various moving components in the nacelle, such as the bearings, gearbox, power electronics, motors to change the pitch or gait of the nacelle, cooling fans and other auxiliary equipment. Tonal noise makes up the majority of mechanical noise, peaks at certain frequencies and is more unpleasant to the human ear than broadband noise. However, mechanical noise can be greatly reduced by adequate shielding of the nacelle, the use of sound-absorbing materials and the damping of vibrations. The interaction between the wind and the blade wall leads to aerodynamic noise.
It can be subdivided into turbulent inflow noise and the inherent noise of the wings [43]. Turbulent inflow noise is broadband noise in the low-frequency spectrum (up to 1000 Hz). Trailing edge noise is the predominant source of noise in wind turbines. It is broadband and has a peak frequency between 500 and 1500 Hz. When the turbine blade rotates at its highest speed, it produces the greatest noise, which normally occurs when the blade moves downwards. The vortex generated by the turbine blades leads to broadband noise, which occurs in the high-frequency range and is the dominant source in this range [44]. This noise is a major contributor to human noise pollution, as the frequency range between 1–4 kHz is the most sensitive to human hearing. There are other mechanisms of aerodynamic noise generation [43], which we will not discuss in detail for reasons of space. The noise level can be influenced by certain changes in the design of the wings [45]. Proposed solutions for noise reduction are as follows:
  • Low-noise blade airfoil design [46];
  • Serration of the back edges of the blade [47];
  • Blade trailing-edge brushes [48];
  • Porous blade surfaces [49];
  • Blade tip shaping (sinusoidal leading edge, edge slots) [50,51];
  • Application of vortex generators on the blades [52];
  • Application of the suction boundary layer to the blades [53].
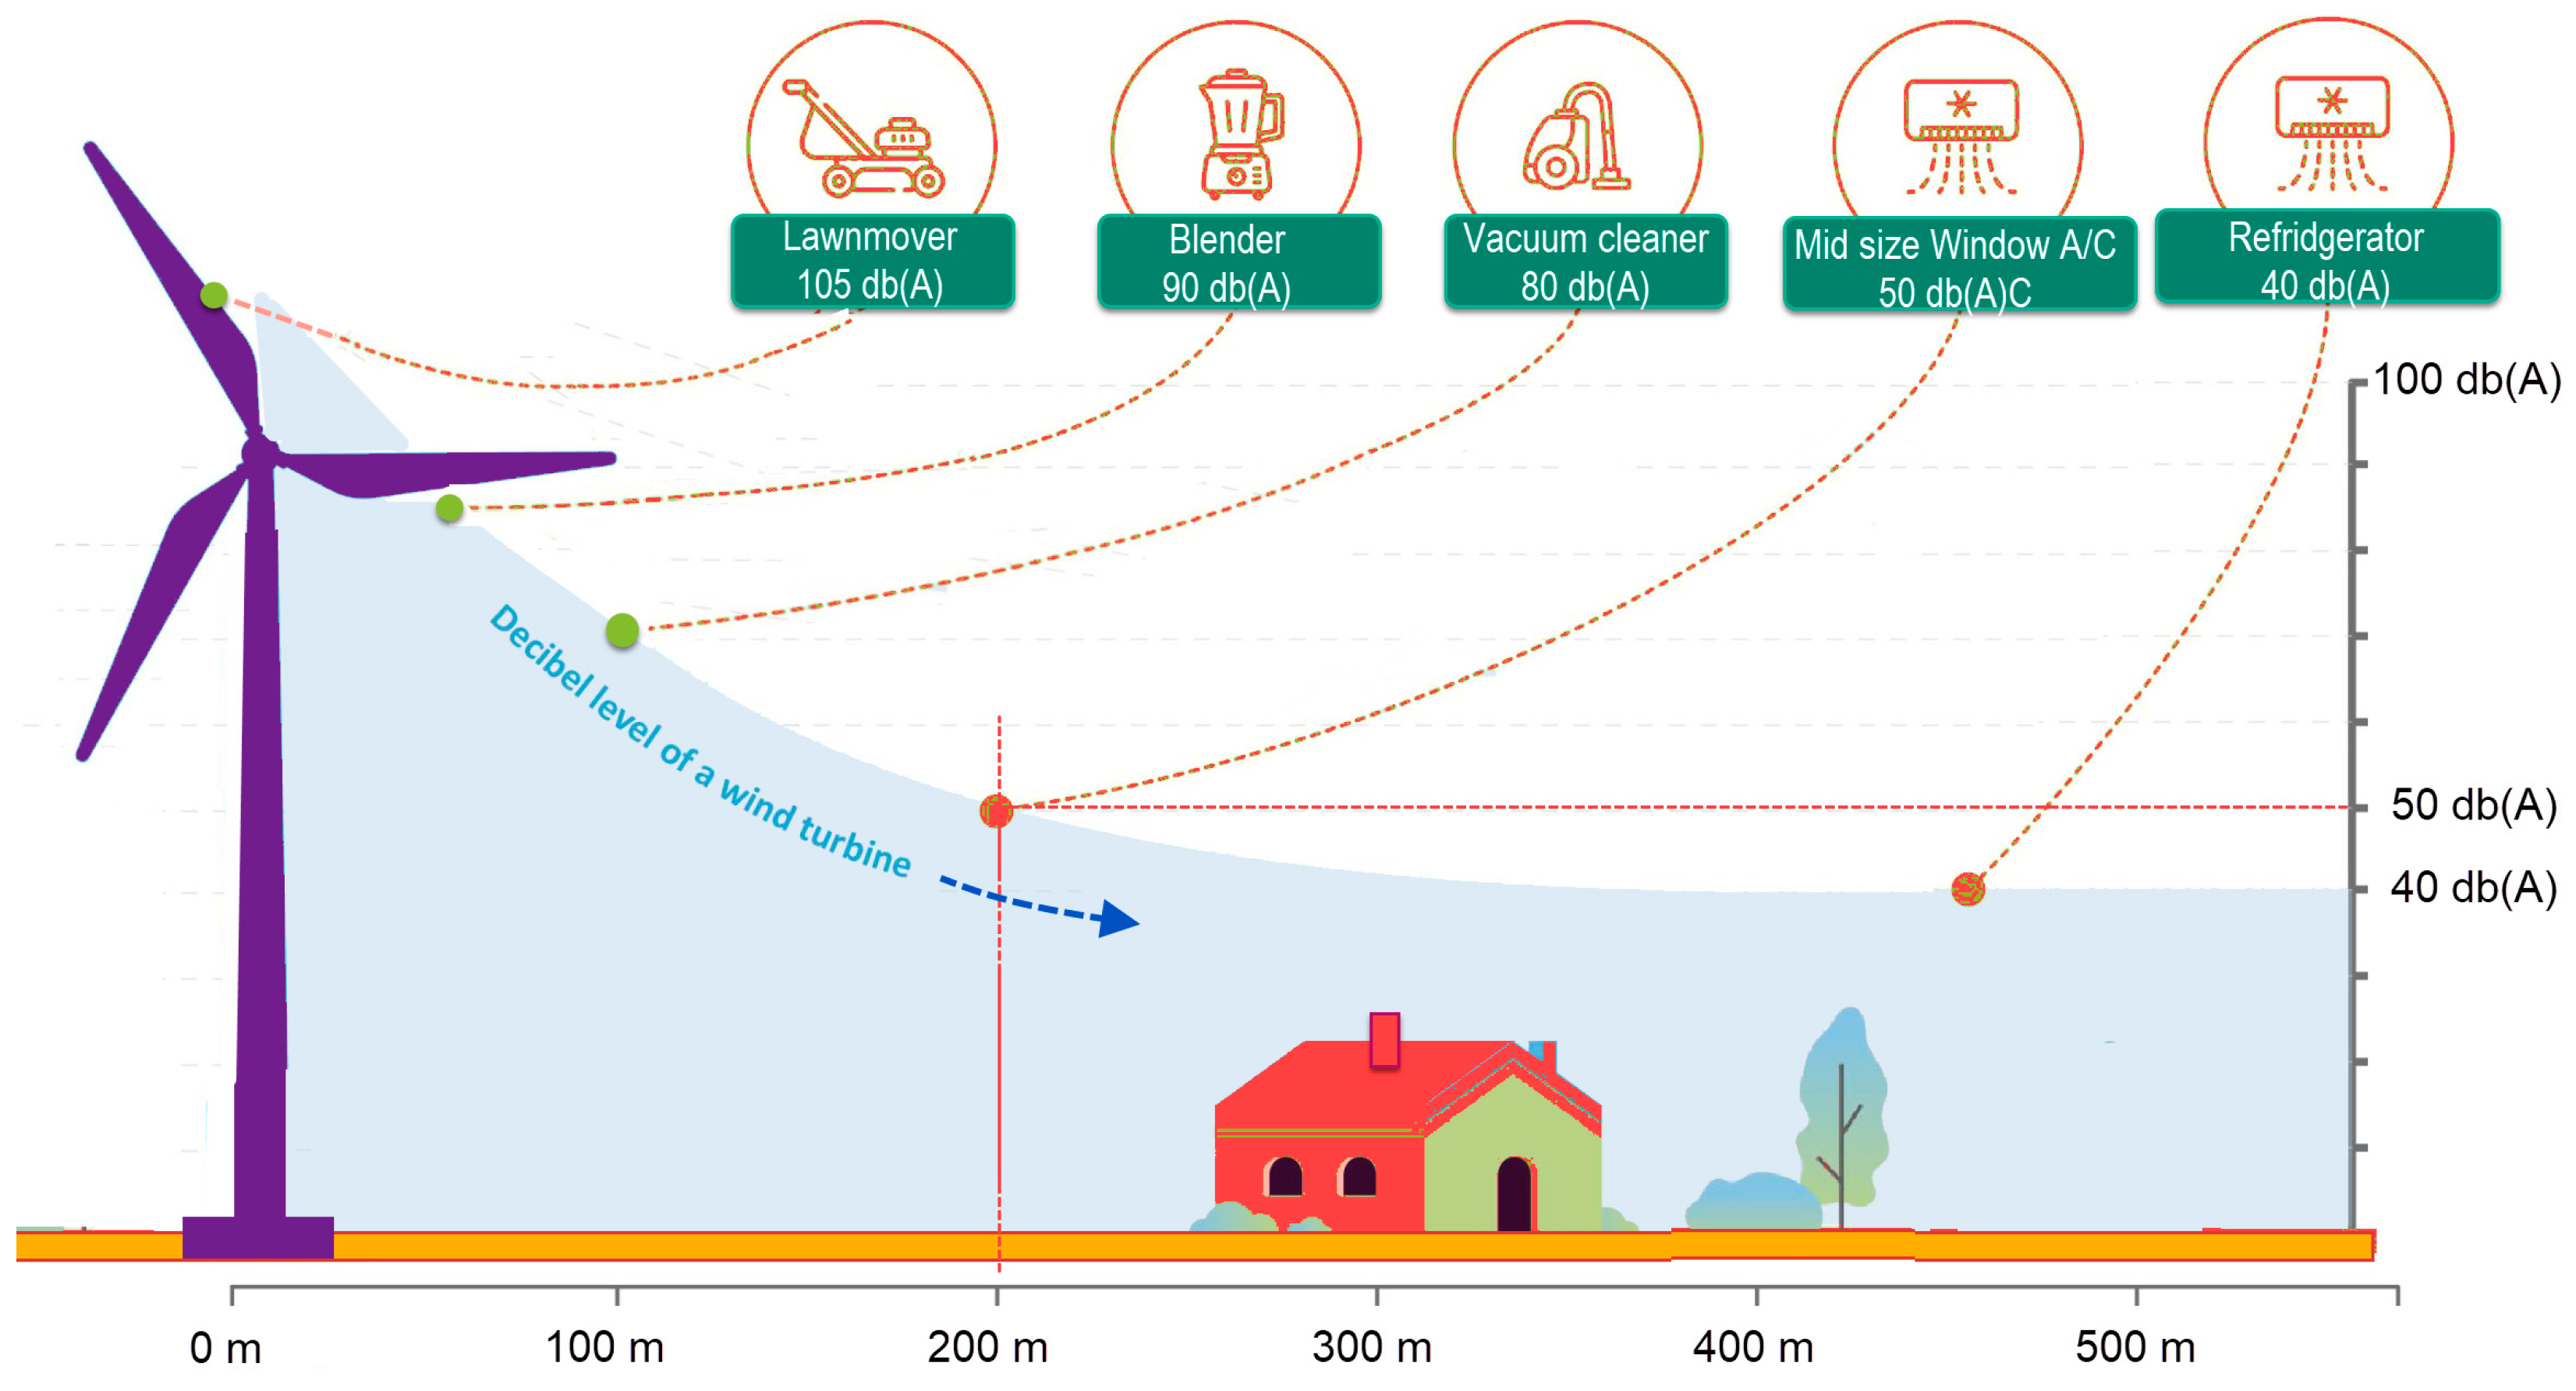
When the wind turbine is commissioned, the noise level in the surrounding area is monitored and it is ensured that it does not exceed the legally permissible limits. This can sometimes mean that wind farms have to limit operation to below the optimum level at night, for example, in order not to exceed the background noise level. In most countries, the noise level in the vicinity of residential buildings must not exceed 50 dB. In this context, Evans et al. [54] have determined the relative noise emissions of wind turbines and the sound propagation over distance for different wind directions. The peak sound level of modern wind turbines is approximately between 103 and 108 dB(A) near the nacelle of the wind turbine and drops to 50 dB(A) at a distance of 200 m, as shown in Figure 5.
According to research by Syed [38], Schmidt et al. [39] and Josimović et al. [55], people believe that wind farms near their homes have caused health problems such as migraines, dizziness, sleep disorders, chronic pain and increased blood pressure. The main cause is the noise from the wind turbines and the flickering lights. A study by Chiu et al. [56] investigated heart rate variability during exposure to low-frequency noise. The noise exposure was between 30.7 and 43.4 dB(A) at a distance of 124–330 m from the wind turbine, which is above the threshold for good sleep quality. The results showed a correlation between the changes in heart rate and noise exposure. The influence of low-frequency noise on sleep was also investigated by Thorsson et al. [57]. Long-term disturbed sleep can contribute to negative health consequences, even if you are not aware of it.
The Canadian Ministry of Health has also investigated the effects of wind turbine noise on human health [58]. The sleep quality of residents within 600 m of the wind farm and of randomly selected residents between 600 m and 10 km from the wind farm was analysed. The wind farm emitted noise from 20 to 46 dB(A). The study discovered no distinction in the quality of sleep between residents close to the wind farm and those residing a few kilometres away.
The permissible noise exposure in the environment is regulated by standards, but these are rarely applied. Some of the noise standards are as follows:
  • ANSI S12.9-2005/Part 4—Quantities and procedures for describing and measuring sound in the environment—Part 4: Noise assessment and prediction of long-term community response [59];
  • ISO 1996-1:2016—Acoustics—Description, measurement and assessment of noise in the environment Part 1: Basic quantities and assessment procedures [60];
  • IEC 61400-11:2012—Wind turbines—Part 11: Acoustic noise measurement techniques [61];
  • NZS6808:2010—Acoustics—Wind power plant noise [62].
Of the standards mentioned, the last two are directly aimed at noise from wind turbines. In Europe, individual countries approach the problem of noise from wind turbines in different ways. To illustrate these differences, it is not enough to compare the noise limits; the calculation method used by each country must also be taken into account. It has been shown that different countries use different sound power levels for the same wind turbine and different formulas for ground attenuation in their noise calculations [63]. Furthermore, some countries regulate not only the permissible noise level but also the distance from residential buildings to wind farms.

Effect of Shadow Flicker

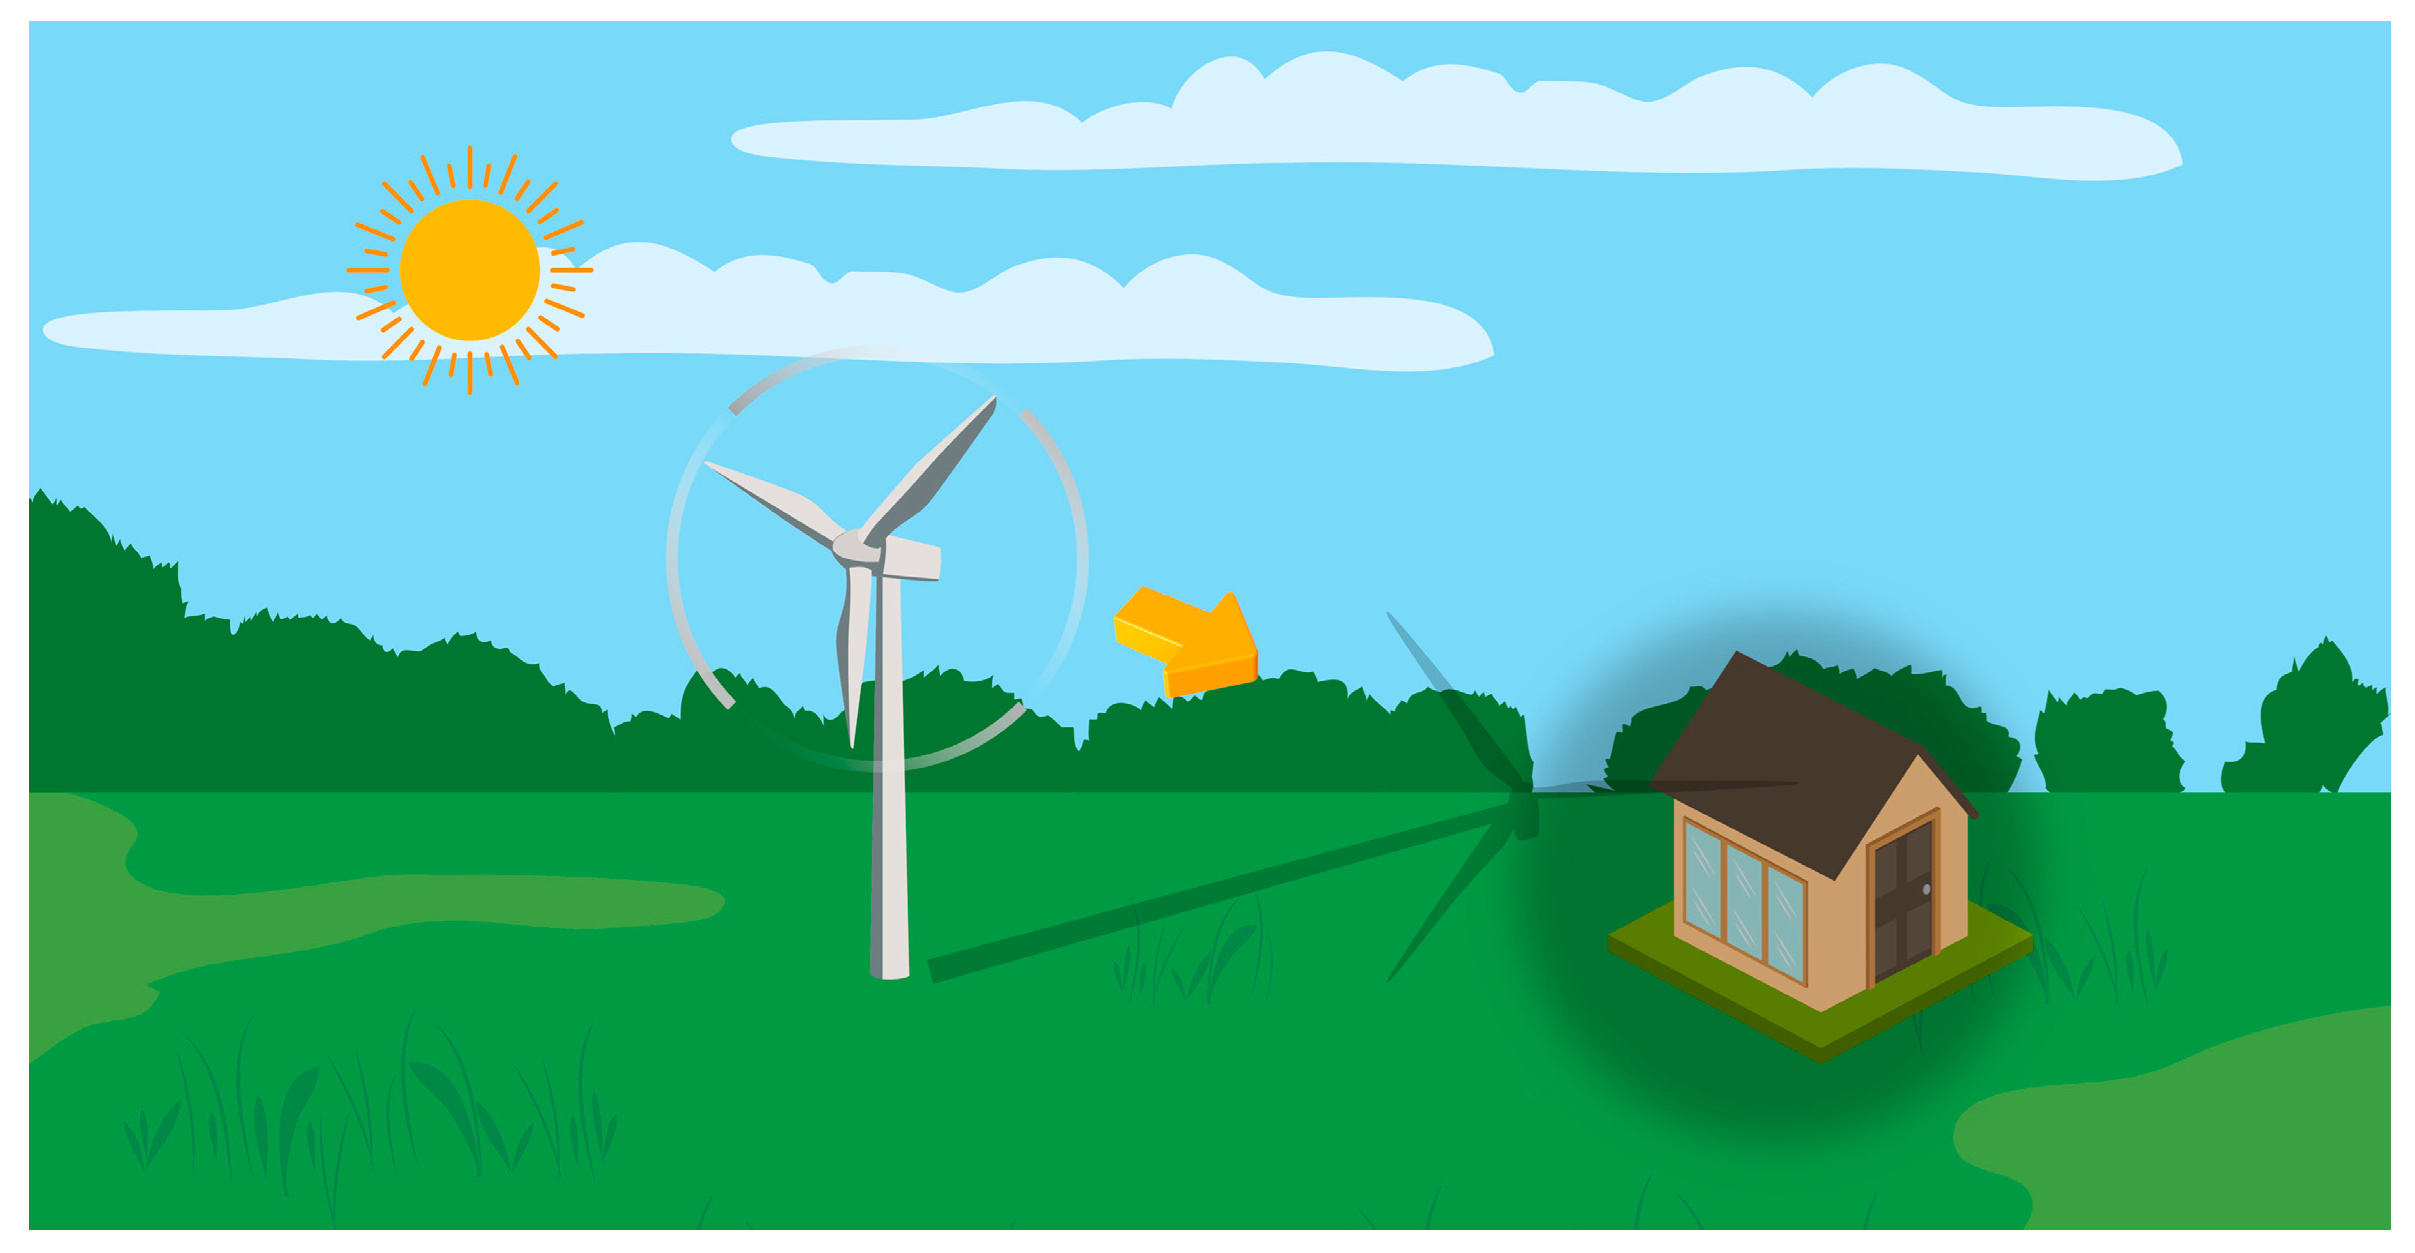
The effect of pulsating light and shadow caused by sunlight passing through the blades of wind turbines is known as shadow flicker (SF) (Figure 6).
This periodic appearance of the shadow at a particular location corresponds to three times the rotational speed of the rotor of a three-bladed turbine. As the intensity of the SF decreases with increasing distance from the wind turbine, it is generally most pronounced in the vicinity of the turbine. When the sun is quite close to the horizon, which is typically in the morning and evening west and east of the turbine, the area where SF occurs is at its highest. Similarly, impact area is generally greater at higher latitudes when the sun spends more time at high zenith angles, i.e., at lower angles to the horizon.
SF is expressed by the number of hours/year or minutes/day at the observed location where SF is present.
Certain mathematical models are used to predict the duration of SF at specific locations near the wind farm. The models calculate the angles of the sun’s position at different times of day and periods of the year at a certain latitude. The height of the turbine, the dimensions of the rotor blades and the existing topography of the surroundings are taken into account. The results of the calculation make it possible to estimate the maximum cumulative number of SF hours per year (or hours per day) at a specific location (possibly with a residential building).
The modelling either assumes the “worst case” (e.g., the turbines are always operating, there are no clouds, the wind direction is constant and the wind direction is such that all turbines are aligned to cast the maximum shadow on the identified receptors) or takes into account the actual factors associated with the meteorology at the site, which is referred to as ‘real by chance’.
Koppen et al. [64] have analysed the regulations for SF in the USA and the EU. In these regulations, the limits for SF are generally set at 30 h/year (and 30 min/day) and this as a potential maximum. If the actual conditions of cloud cover, wind and other influencing factors at the site are taken into account, this results in a maximum of 8 or 10 h per year (and 8 to 10 min per day) of shadow flicker.
Shadow flicker can cause irritation to people if it falls on the window of a residential building. The range of frequencies from 2.5 to 20 Hz is where disruptions can occur. Lindvall et al. [65] define irritation as “a feeling of dissatisfaction associated with a factor or condition that is thought to have a negative effect on a person or group. They also explain that feelings of irritation are not necessarily pathogenic and may or may not lead to negative health outcomes. According to the study by Haac et al. [66], observable factors such as exposure to SF, distance to the nearest turbine and whether or not the respondent moved in after the project was built had a significant impact on perceived SF.
Health Canada conducted a survey of 1238 residents living between 0.25 km and 11.22 km from existing wind turbines. This is one of the largest studies of its type conducted to date [67]. At the lowest exposure to wind turbines (0 to 10 min/day in the worst case), 3.8% of the population felt very disturbed by SF, while of those with the highest exposure (>30 min/day in the worst case), 21.1% were very disturbed by SF.
It is already possible to avoid or at least minimise the impact of SF on land near wind farms by planning the micro-siting and layout of wind farms. In addition, today’s wind turbines have software support and equipment that automatically stop rotor rotation when the allowable duration of SF is exceeded. Switching off the turbines is considered the most important measure for reducing the effects of shadow flicker. Reducing the impact of shadow flicker can also be achieved through various other measures including the following:
  • The presence of covers such as vegetation, terrain and buildings. Shielding between the turbine and the wind farm reduces or eliminates SF;
  • The standard approach is not to erect any objects within a distance of ten rotor diameters, as this is the limit within which significant shadow flicker effects can occur;
  • For new buildings to be constructed, windows should be aligned to minimise the effects of SF.
The glint of the rotor blades is the reflection of sunlight on the rotor blades of wind turbines and can disturb people. Manufacturers of modern wind turbines avoid the potential nuisance of glare by applying an anti-reflective treatment to the rotor blades. For this reason, glare from the blades has not been analysed as an environmental impact.

Danger of Ice Flying off the Blades

Areas with pronounced glaciation are defined as “frozen climate”, i.e., when the measured glaciation lasts more than 1% of the year and the meteorological glaciation lasts more than 0.5% of the year. Measured icing is when ice is present on a surface and meteorological icing is when weather conditions allow ice to form. The types of meteorological icing that affect wind turbines are intra-cloud icing and precipitation-induced icing [68].
Ice build-up on the rotor blades of wind turbines can pose a serious threat to people and objects in the immediate vicinity. It is, therefore, important to assess the dangers associated with ice shards falling and flying from the rotor blades. Icing can also lead to the failure of wind turbines because the structural integrity is impaired. The hazard posed by ice depends on the severity of the icing, the type of icing, the wind, the rotor speed and other environmental conditions. A piece of ice with a weight of 0.2 kg and a density of 500 kg/m3 falling from a height of 30 to 50 m is considered fatal if the impact has a kinetic energy of more than 40 J [68].
According to Scotland Against Spin [69], ice has been reported to have been thrown up to 140 m from the turbine. It also lists 880 cases of icing between 1990 and 2003 in Germany alone.
An analysis of the regulations to reduce the risk of operating wind turbines in cold climates has shown that there are still no precise regulations in many countries. In Norway, the operation of wind turbines in cold weather conditions during the winter months is common, but there is no legal framework regulating the risks of falling and flying ice. In Germany and Sweden, the recommended minimum distance between wind turbines and houses (people) is set at 1.5 × (hub height + rotor diameter) according to the WECO report [68]. At some Canadian turbine sites, warning signs have been put up asking people to stay at least 305 m away from the turbines in icy conditions [69].
Godreau et al. [68] state in a report for the International Energy Agency that in cold climates, ice accumulation on wind turbine blades reduces performance and increases the risk of flying ice, jeopardising the safety of wind turbines, people and other nearby structures.
The capacity of wind energy increases rapidly in regions with a cold climate. Ice formation on the rotor blades can cause the wind turbine to shut down, lose power and damage components. To prevent the build-up of ice on the rotor blades, it is necessary to install an ice sensor in the ice formation monitoring system. Existing ice detection and de-icing technologies are ineffective according to Mada et al. [70], so a significant improvement is required.
In their work, Rekuviene et al. [71] provide a detailed overview of passive and active methods for de-icing and de-icing control and list their advantages and limitations. Passive methods include chemical and biochemical methods as well as colour coatings that either weaken ice adhesion or shift the freezing point of the blade surface. Active methods include the infrared method and microwave hot air generators, the resistance method, the ejection method, the pneumatic method, the water jet method and high-power ultrasonic de-icing. Artificial intelligence has recently been used to predict the icing of rotor blades so that appropriate measures can be taken in good time [72].

Danger of Blade Parts Flying Off

In his article “Root causes and mechanisms of failure of wind turbine blades: overview”, Mishnaevsky [73] examines the causes and mechanisms of deterioration of wind turbine blades. The damage is categorised into surface damage, binder damage and structural damage. Surface damage includes micro-cracks on the surface and coatings caused by erosion, rain, sand or hail or by the impact of small objects. Binder damage includes delamination and defects in the binder. Structural damage includes cracks and fractures in the carbon fibre. The most vulnerable areas of the blades are the tips, transition zones and connecting lines.
The causes and mechanisms for rotor blade failure include manufacturing defects such as air bubbles, delamination and waviness. Mechanical stress caused by wind can lead to bending and cracking. Extreme conditions such as high winds can increase the risk of structural damage. All this can cause the blades to break and their parts to fly off, posing a great danger to people, animals and other objects in the vicinity, including other wind turbines [73]. Parts of the blades can fly slightly less than 700 m away from the wind turbine at normal rotational speeds (70 m/s), while at higher rotational speeds (150 m/s) parts of the blades can reach a distance of up to 2 km [74].
The study by Asian et al. [75] on 240 accidents involving wind turbines from all over the world clearly shows that most accidents are due to natural causes such as strong winds and lightning. Accident statistics for wind turbines from Scotland Against Spin [69] clearly show that the most common wind turbine accident is blade failure, closely followed by fire. A “blade failure” can have a number of causes and can result in either whole blades or parts of blades being thrown from the turbine. A total of 537 separate incidents have been recorded. It has been documented that parts of the blades have travelled up to 1.6 km. In Germany, parts of the blade penetrated the roofs and walls of nearby buildings. For this reason, a law was passed in Germany (Bavaria) in 2016 requiring a minimum of two kilometers to be kept between dwellings or workplaces and wind turbines, and Ireland is considering a similar measure [69].

3.3.2. Impact on Radio Waves and Air Traffic

Offshore wind turbines can interfere with radar systems on board ships and on land as well as radars used to monitor air traffic [76]. Wind farms located near weather radars can cause false echoes that can be misinterpreted as weather phenomena such as precipitation or thunderstorms. The reason for the interference lies in the structure of the turbines, the height of the turbines and the displacement of the rotors, which can reflect radar signals. In addition, telecommunication and data transmission signals can be weakened when wind turbines are in the line of sight (LOS) for radio communications. In general, two types of effects of wind farms on radar systems can occur [77]:
  • Formation of radar shadows behind wind turbines, which can result in lower targets being poorly recognised or not recognised at all. The relatively high frequencies used by the radar are attenuated when the signal passes through the wind farm, i.e., they shorten the range of the radar.
  • Reflection of the radar beams from the wind turbines can lead to false radar targets (false echoes).
Radar systems work by recognising weak reflections that are often in motion. In addition, the rotor blades of wind turbines produce false reflections in the direction of the receivers, causing the radar to misinterpret the signals.
While the wind farm industry is growing rapidly, they are causing serious interference problems in critical civil and military radio systems, degrading radar detection range and increasing the complexity of air surveillance and navigation missions. ATDI has developed HTZ Communications, a leading engineering tool that enables radio frequency (RF) simulations to analyse wind farm interference and mitigate their effects while complying with regulatory safety requirements [78].
Angula et al. [79] analysed the potential impact of wind turbine operation on some telecommunications services that have been shown to be more sensitive to adjacent wind turbines (e.g., terrestrial television, fixed radio links, radio navigation systems, air traffic control and maritime radars), the methodology for assessing these impacts and mitigation measures in case of potential service degradation. Wind farms can also affect military security through missile and aircraft detection problems, as studied by Auld et al. [76].

3.4. Impact on the Ecological System

Understanding the global impact of wind farms on biodiversity and ecosystems is crucial to finding ways for a sustainable energy transition. It should be recognised that climate change has a major impact on ecosystems and that wind farms contribute to climate change mitigation.
The impact of onshore wind farms on the ecosystem consists mainly of land take and habitat destruction. The impacts of wind farms on wild and domesticated terrestrial mammals have been comprehensively analysed by Helldin et al. [80]. For each of the mammal groups analysed, the extent of the individual impacts was estimated in relation to the entire lifetime of the wind turbine.
Watson et al. [81] studied the worldwide effects of offshore wind farms on ecosystem services. They indicate that the impacts of the installation phase of wind farms are predominantly negative (52%), compared to positive impacts (8%) for several fish species (e.g., cod, flounder) and some bird species (e.g., guillemot, fulmar, redfin). The impacts of the working phase can be negative (32%) or positive (34%), depending on the specific conditions of the site. Where offshore wind turbines are installed, the flow of carbon, organic matter and nutrients in and out of wind farms can be significantly improved. For example, Ivanov et al. [82] found in their study that the total flux of organic carbon into the sediment can increase by up to 50% within a 5 km radius of the turbines, with the effect being noticeable up to 30 km away. It should also be noted that more than 86% of the potential impacts of offshore wind farms on the ecosystem are still unknown [81].
Although comprehensive environmental impact assessments are carried out when planning new wind farms in order to avoid the selection of sites with a major impact on the environment, the relatively small number of favourable sites has an increased potential for conflicts of interest given the desirable characteristics of wind energy. In this context, opportunities are being sought to develop measures to reduce these negative impacts for favourable wind farm sites with potentially negative environmental impacts [83].
The IUCN (International Union for Conservation of Nature) has developed guidelines with the aim of providing practical guidance for the planning of solar and wind energy projects by effectively managing risks and improving overall outcomes in terms of biodiversity and ecosystems. The guidelines cover the entire life cycle of project development, using the risk mitigation hierarchy as a clear structure for planning and implementation from the beginning of the process to the end [8].
Finally, according to UNCE [5], the impact of wind turbines on the ecosystem is the lowest compared to other types of power plant.

3.4.1. Land Footprint

The plan for new wind turbine capacity is an important element of national wind energy policies. Special consideration is given to other land users when deciding on sites. Regional and local urban planners have the task of assessing the compliance of the project with existing and planned neighbouring users, the potential negative impact on the overall character of the surroundings, possible disruption to already established communities and the integration of wind farms into the existing landscape. In some countries, spatial plans recommend avoiding specially protected areas, while other areas are already earmarked for potential wind farm development.
Onshore wind farms differ from other sources of electricity because it is possible to use the land between the turbines for other purposes, such as agriculture. This is not possible with coal, gas or nuclear power plants. This means that the occupation and utilisation of land by wind farms are very different.
The minimum area required for the installation of a wind turbine includes the area for the foundation. The equipment required for operation and connection to the grid is usually located at the base of the tower. The central buildings of wind farms usually take up very little space compared to the number of wind turbines.
The diameter of the foundation for today’s 4 MW power plants is 18 to 20 m, which corresponds to an area of 1000 to 1250 m2. If the stated increase in wind turbine output of up to 12 MW is achieved by 2050, the foundation for such a power plant would have a diameter of around 25 m and an area of up to 2000 m2.
The wind turbines in a wind farm must be arranged correctly in order to attain a high degree of efficiency. In order to generate electricity efficiently, wind turbines require a uniform wind flow. Each wind turbine creates turbulence in the area behind and around it. Therefore, the turbines must be far enough apart to avoid the area of turbulence where their efficiency is lower [84]. In addition, turbulence can cause the turbines to vibrate, which increases the wear of the internal machinery and thus shortens the service life of the turbines. Therefore, the distance between wind turbines is an important aspect when planning wind farms. A general rule of thumb for wind farm spacing is that turbines installed upstream or downstream of each other should be at least seven rotor diameters apart. This gives you enough space to disperse turbulence and its influence and create an even wind speed profile. Wind turbines installed side by side can be closer together and should be at least three rotor diameters apart.
When analysing land use, a distinction is often made between two terms: direct impact area and total land area [84]. The direct impact area consists of the land directly occupied by a particular type of wind turbine and associated infrastructure. This includes wind turbine foundations, access and egress roads, power plant and distribution lines, office buildings, monitoring station buildings and storage areas. This may also include the area that is temporarily used during the installation of the turbine. If the turbine is erected in forested areas, additional land must be cleared around each turbine. The immediate impact area of a wind farm is quite small, especially compared to other types of power plants, such as fossil fuel power plants or nuclear power plants.
In general, the total area of a wind farm includes the area within the perimeter surrounding all the turbines of the wind farm. This includes the direct impact area as well as the undisturbed land between the turbines and the buffer zone for residential buildings. Due to the relatively large distance between the turbines, the total land area can be quite large. It is important to bear in mind that the turbines of the wind farm can be installed in the form of a long row, in the form of several irregular rows, parallel rows in rows or as separate power plants. In each of these cases, there is a different land occupancy per installed MW of turbine capacity.
According to the NREL report [84], the average area of direct influence of wind farms is 0.01 ± 0.007 km2/MW of installed capacity, while the average total land area is 0.345 ± 0.224 km2/MW of installed capacity. According to a recent analysis by Harrison-Atlas et al. [85] for power plants in the USA, the average total land area is 0.233 ± 0.286 km2/MW.
Using data from the Wind Europe report for 2023 [86] on the total installed capacity of wind farms by country, the land occupancy of wind farms can be calculated in relation to the area of the country. When researching the available data for wind farms in Croatia, the authors found that the occupied area is slightly above the average of 0.345 km2/MW (almost 0.4 km2/MW), so they assumed that it is better for Europe by a factor of 0.345 km2/MW than the factor given by Harrison-Atlas et al. [85] for the area of the USA.
Figure 7 shows that the Netherlands and Germany will have the largest share of land use in 2023, followed by Denmark and Belgium. These amounts can be assessed as relatively small.
Given the projected growth of renewable energy sources, including wind energy, land acquisition by 2050 could pose some challenges. This could have an impact on the availability of land for other purposes such as agriculture, fishing or nature conservation. The total land area needed for the global onshore capacity of 5044 GW by 2050 is between 1,008,800 km2 and 1,664,520 km2 according to The International Renewable Energy Agency (IRENA) [87]. If we take the data of 0.345 ± 0.224 km2/MW, we arrive at an area of 610,384 km2 to 2,870,036 km2, which is still slightly more than stated in the IRENA report.
If you look at the EU and consider the planned capacity expansions of the individual countries up to 2030 and especially up to 2050, the proportion of the area covered by wind turbines will be more than 10% in some countries, which is a significant proportion. This is particularly true for the Netherlands and Germany, but also for Belgium and Denmark (Figure 7). It is advisable to treat these findings cautiously, as the assumed factor of 0.345 km2/MW may be higher or lower for each country.

3.4.2. Habitat Destruction

The construction of energy plants and wind farms can have a significant impact on the loss of natural habitats (Plumb et al. [88]). This is confirmed by the research of Pearce-Higgins et al. [89], who showed that the installation phase of a wind farm in the UK had a measurable impact on upland bird populations. In this context, Kiesecker et al. [90] calculated the potential loss of key biodiversity areas for 109 countries. Following on from the data from the previous chapter, we emphasise that 3 to 10% of the area of each country is occupied by wind turbines and is threatened in some way by habitat destruction.
The question arises as to what extent the habitats of wild animals are displaced by the installation of wind turbines. Based on 84 studies of onshore wind farms in 22 countries, Tolvanen et al. [91] presented data on the average distance of habitat displacement from the edge of wind farms. The predominant height of wind towers in the studies was 50–99 m. For birds, bats and mammals, habitat displacement accounted for 63%, 72% and 67% of cases, respectively. Cranes, owls and semi-wild reindeer showed consistent habitat displacements of up to 5 km on average. Gallinaceus birds showed movements of up to 5 km on average, but “no movement” was reported in 40 cases. Bats were displaced by an average of up to 1 km in most cases. Waders, birds of prey, sparrows and black-winged stilts moved their habitats by up to 500 m on average.
Furthermore, human-caused forest landscape fragmentation may lead to a rise in the number of predators (Pasanen-Mortensen and Elmhagen [92]). For instance, infrastructure like buildings and maintenance roads could attract fox activity (Hradsky et al. [80,93]), so the risk of predation may be higher near wind farms. Grouse are known to be sensitive to human disturbance (Coppes et al. [94]). Many grouse species are site-loyal and therefore highly vulnerable if their habitat overlaps with areas that are suitable for wind turbine installation, particularly in the absence of another suitable habitat (Braunisch et al. [95]).

3.4.3. Collision with a Wind Farm

The question of the impact of wind farms or energy installations in general on fauna in connection with the power generation phase is complex. The effects on birds and bats are most frequently discussed. Birds can be fatally injured when they come into contact with the blades of wind turbines, but also in the cooling structures of nuclear power plants, transmission and distribution lines and chimneys of fossil fuelled power plants. Indirect bird mortality is linked to starvation in forests destroyed by acid rain, uptake of mercury and heavy metals through contaminated water, but also to climate change on bird migration routes.
The reaction of bats to wind turbines varies depending on the species and location. Bats may avoid turbines or be attracted to them in order to feed in their vicinity. For example, deforestation may drive some bat species away because they lose their roosting and feeding habitats, while for other bat species, the installation of wind turbines creates new habitats because there are more insects to feed on in the vicinity of the wind turbines [96]. Direct causes of bat death at wind turbines are well recognised and include barotrauma (Rollins et al. [97]) and collisions with rotating blades (Horn et al. [98]) or a combination of both.
The potential threats of wind farms to birds are well documented in the literature, for example [99,100]. Research suggests that mortality rates (although they may be relatively high in certain areas) are highly variable and depend on a number of factors such as the bird species, the size and the location of the wind farm and others. Barclay et al. [101] reported a mortality rate of 0.00–9.33 birds per year per turbine and a mortality rate of 0.00–42.7 for bats. According to Sovacool [102], nuclear and wind power plants each cause between 0.3 and 0.4 deaths per GWh of energy generated, while fossil-fuelled power plants cause around 5.2 deaths per GWh of electricity. To reduce avian and bat mortality from wind turbines, various devices and measures are being researched and increasingly demanded by the relevant licencing and environmental protection authorities, non-governmental organisations, the public and wind turbine developers [103]. One of the simplest solutions is to paint one of the rotor blades black to increase visibility. According to a case study, this kind of solution can lower avian mortality by as much as 70% [104].
The selective shutdown of wind farms along the bird migration route using radar is very effective in reducing collision rates (Tomé et al. [105]). Although wind farm downtime accounts for only 0.2–1.2% of the corresponding hours of annual wind farm activity, it still represents a certain loss of income.
Ultrasonic deterrent devices have also been developed to reduce bat mortality in wind farms. The effectiveness of such a device was studied by Weaver et al. [106] in wind farms in South Texas, USA. The results showed that the deterrent devices reduced bat mortality at Lasiurus cinereus and Tadarida brasiliensis by 78% and 54%, respectively.
In a study by Hayes et al. [107], an intelligent throttling concept (restriction of turbine blade rotation at low night-time wind speeds) was analysed to reduce bat mortality and throttling time at a wind farm in the United States. The results of applying this curtailment approach (Turbine Integrated Mortality Reduction, TIMR) showed a significant reduction in mortality for each of the five bat species observed, ranging from 74.2% to 91.4%, with a small reduction in electricity production ≤ 3.2% per year. Slightly lower mortality reduction results were obtained by Rabie et al. [108].
One possible measure to reduce the mortality of birds in collisions with wind turbines is to treat the ground surface near the base of turbines that have a high collision rate. By reducing the vegetation and thus the amount of potential prey, birds of prey are forced to forage in other, less dangerous areas (about 80 m away from the turbines). Pescador et al. [109] carried out studies in central and eastern Spain, where there is a large population of lesser kestrels, using the above-mentioned mitigation measure. Following the implementation of the mitigation strategy, there was a 75% to 100% drop in the number of collisions. These results show that this measure is a simple and cost-effective method that significantly and effectively reduces the number of kestrels colliding with wind turbines.
The problem of birds colliding with offshore wind turbines is becoming increasingly important. Various tests are therefore being carried out to reduce bird mortality. When a bird flies close to turbines, why does it not recognise the danger posed by the turbine and take evasive action in time to avoid collisions? This is an important question because if recognition and perception errors contribute to the danger, then it should be possible to take measures to increase the likelihood of turbines being recognised and avoided.
May et al. [104] tested a mitigation measure based on bird vision and reported a 70% reduction in mortality from collisions with wind turbine blades at an onshore site for a sample of 19 avian species. The aim of Martin and Banks’ research [110] is to apply this experience to offshore wind turbines. It is recommended to enhance the visual contrast of wind turbines by applying achromatic patterns to their pillars and blades. This approach was developed to reduce the susceptibility of birds to collision and works well in a variety of viewing conditions depending on weather and natural light. This ought to enable birds flying at various speeds and visual acuity to recognise wind turbines in good time and avoid collisions.
For protected and sensitive bird species, spatio-temporal data on their distribution, flight altitude and the percentage of time they spend in a particular area (bird sensitivity maps) can be obtained based on GPS tracking of individuals. On this basis, the potential impact of new electrical infrastructure development on the risk of their mortality can be determined (Thaxter et al. [111], Vasilakis et al. [112], Warwick-Evans et al. [113]). Combining sensitivity maps with wind resource data can help planners to optimise the selection of new sites for wind farms and transmission lines by avoiding areas of high sensitivity. Such an approach reduces mitigation costs and provides better results than the classical approach based only on the location of the energy facility (Gauld et al. [114]). Systems are also being developed that use artificial intelligence to recognise endangered bird species in the vicinity of wind turbines and stop the operation of the wind turbine in this case [115].

3.4.4. Noise

Onshore Wind Farm Noise

Noise pollution has a negative impact on wildlife as it disrupts mechanisms that are crucial for their survival [116,117]. According to studies, noise can result in the following:
  • Result in physiological trouble, such as genuine hearing loss [118] or persistently elevated stress hormone levels [119];
  • Be viewed as a direct danger, which would lead to an increase in predatory behavior at the expense of foraging or the departure of the afflicted region, which would result in the loss of habitat [120];
  • Distract attention during foraging and reduce foraging efficiency [117];
  • Interfere with animal communication by reducing the distance from which the signal can be perceived [121] and lowering the quantity of information that can be taken out of the signal, such as the sound of a predator or approaching potential prey [122];
  • Influence the reproductive process. Taubmann et al. [123] reported that noise disturbs grouse up to a distance of 865 m. Increasing turbine noise, turbine visibility, and turbine shadow during the breeding season reduced the likelihood of selecting a breeding site.
The roles that these processes play in determining the effects of noise pollution on different species are not mutually exclusive. Different species respond differently to noise as they have different sensitivities to noise. In general, noise pollution alters animal communities. The effects of noise can contribute to the reduction in biodiversity and also threaten the sustainability of local ecosystems.

Offshore Wind Farm Noise

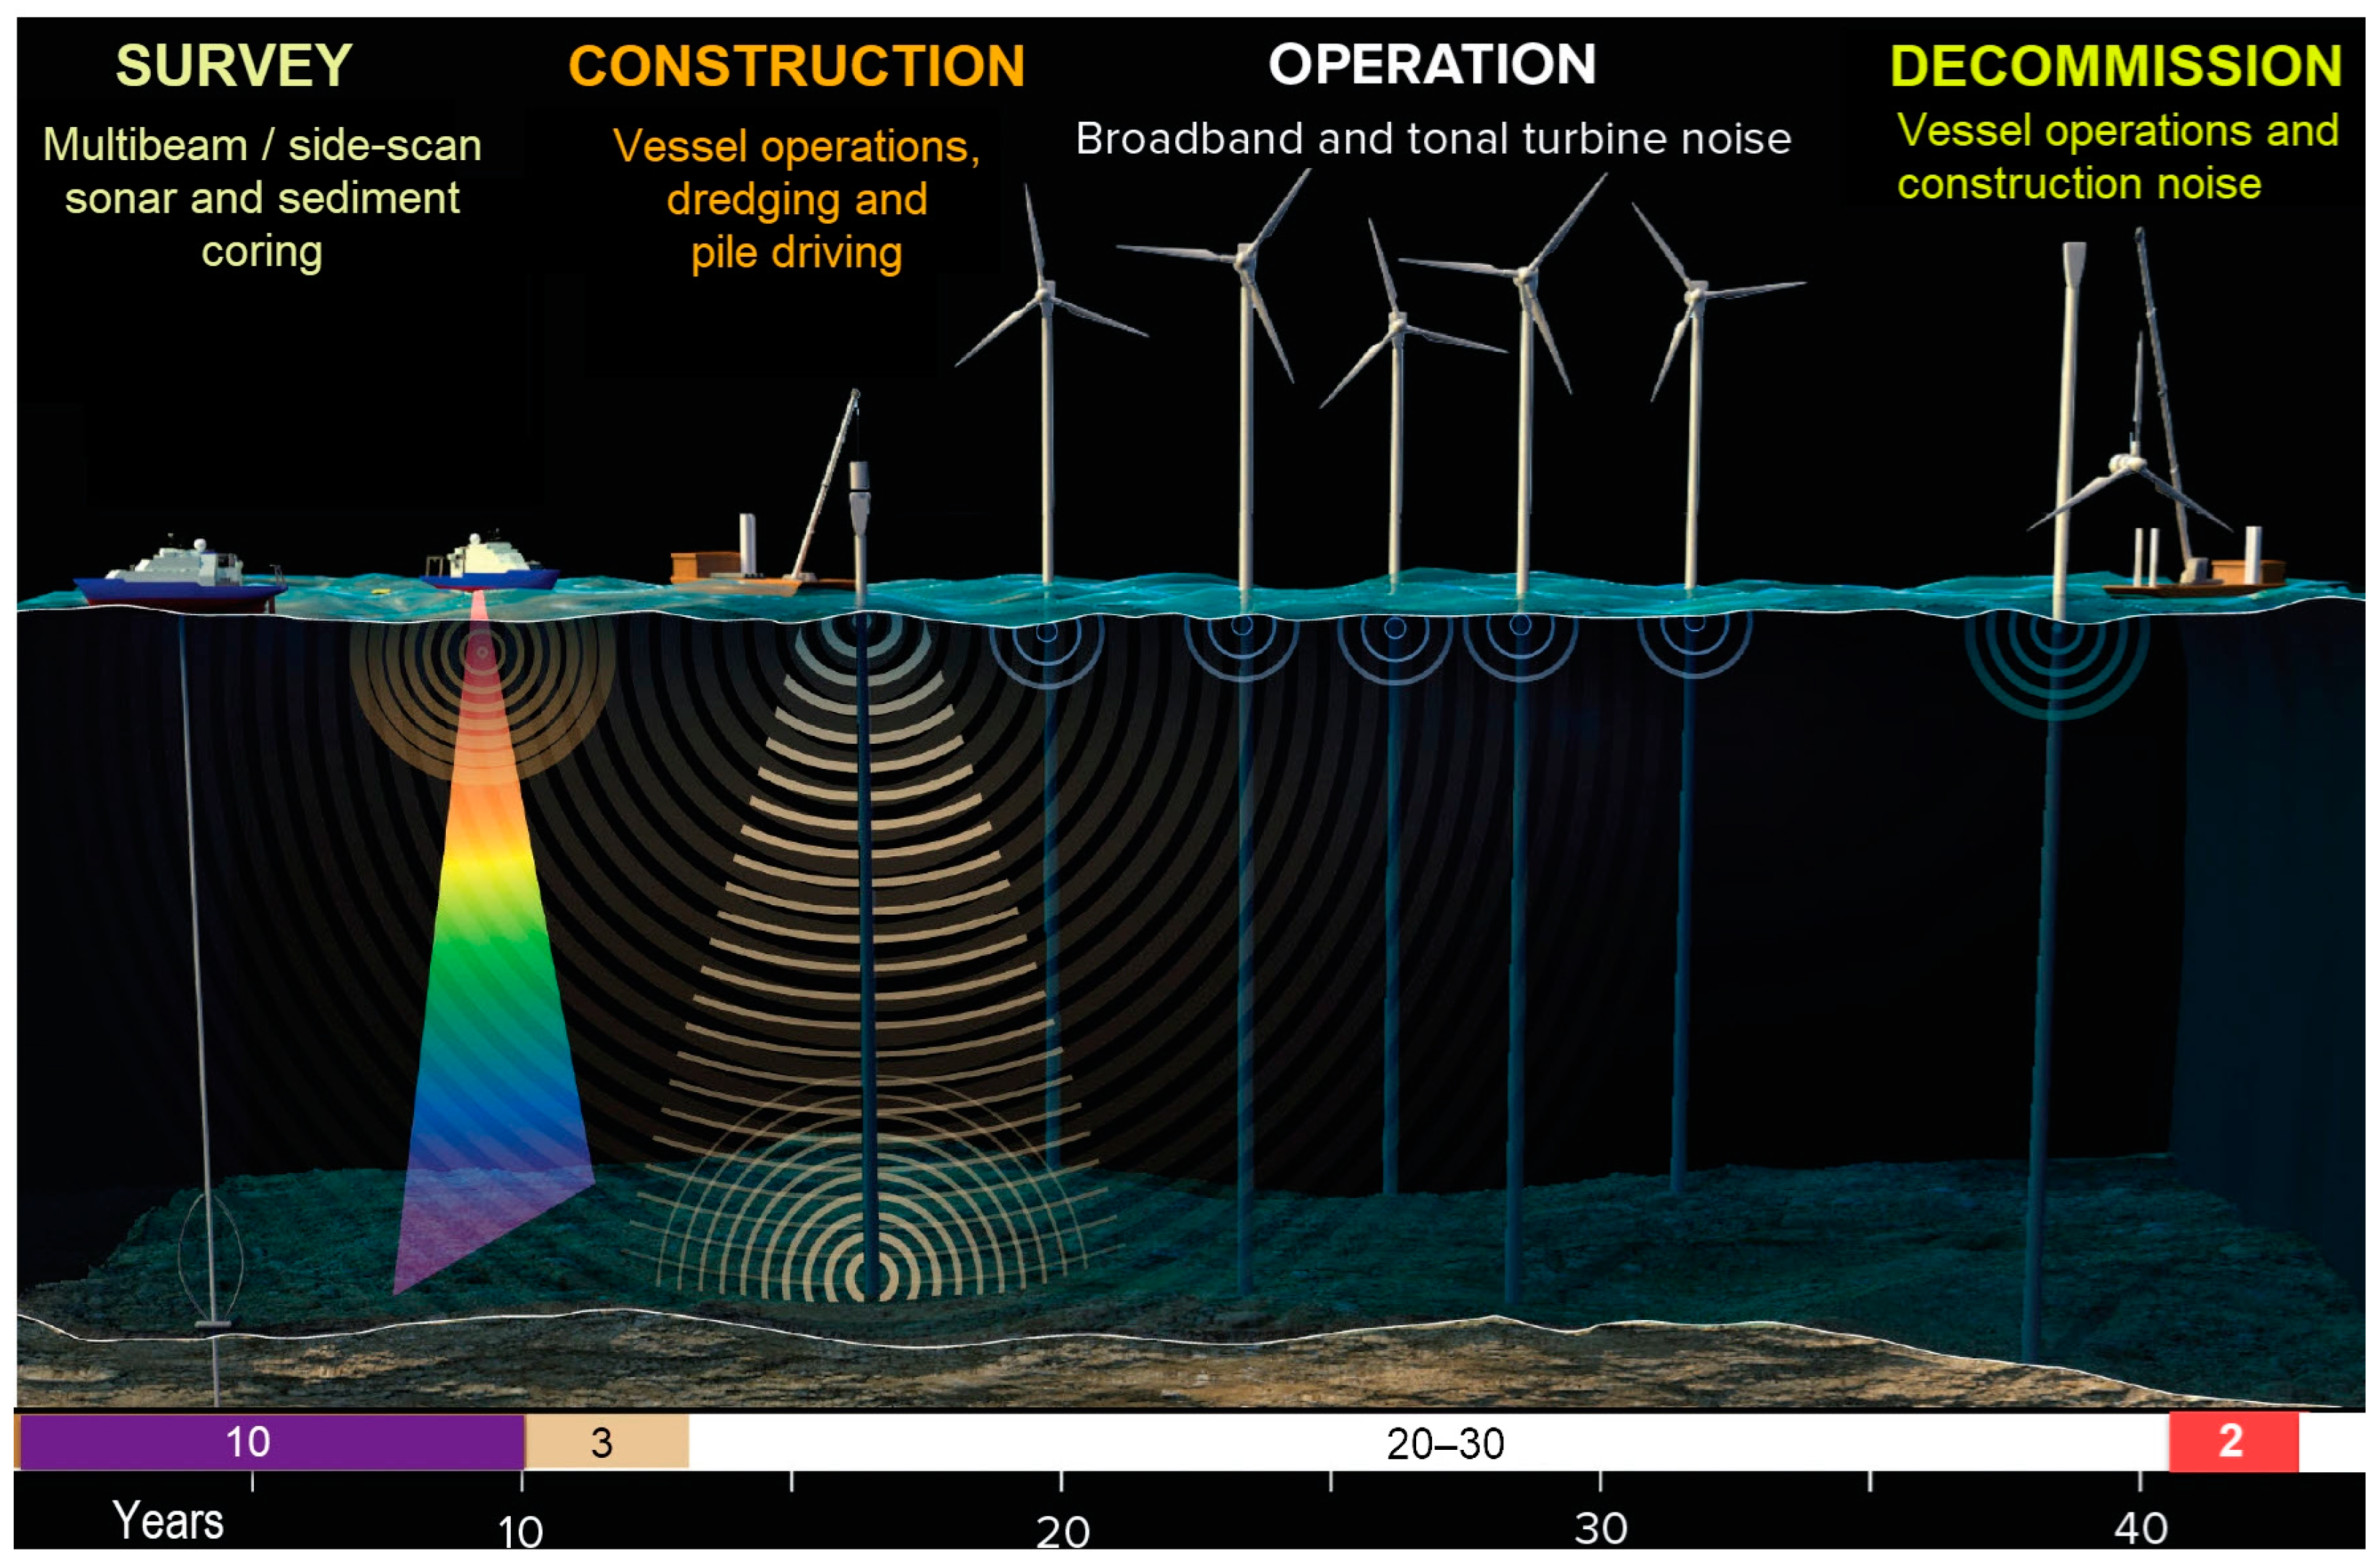
There are four key phases in the development of an offshore wind farm project, each of which generates different noise emissions that have the potential to affect marine life. These phases extend over a longer timeframe and include (Figure 8) [124] the following:
  • Research and site investigation;
  • Construction work;
  • Operations;
  • Decommissioning.
Figure 8. Development of the offshore wind farm project over time [124].
Environments 11 00257 g008
Intensive surveys and mapping of the seabed are usually carried out after the lease has been granted. A comprehensive characterisation of site conditions and habitat type, including water depth, seabed morphology, sediments, subsurface geology and biodiversity, is made possible by a variety of sensors.
Numerous researches have demonstrated how fish behavior is impacted by human noise. In areas where seismic shooting was completed, the catch rates of commercially important species (cod, haddock, blue whiting, and Norwegian herring) decreased, according to two field studies [125,126]. These investigations also indicate that the catch rates of these species increase between 30 and 50 km from the sound source, indicating that the fish avoid the seismically active area.
The effects of offshore wind turbines on wildlife are diverse. Studies on the effects of pile driving noise from wind farm installation on harbour porpoises and seals show that their hearing can be permanently damaged, that they are no longer able to search for food [9], i.e., it drives them away from the wind farms area [127]. The noise nuisance caused by pile driving can be reduced by bubble curtains [128]. Each of the two bubble curtains attenuated the noise between 7 and 10 dB when used separately [129]. The device can be installed up to 200 m away from the pile and is able to recapture most of the energy carried from the ground back into the water column. This noise reduction system was tested during the construction of the Borkum West II offshore wind farm in the North Sea. As the activity of the harbour porpoise depends on the noise level, the operation of the new system reduced the disturbance range of the porpoise by ~90% and allowed its normal activity [130].
Research examining the fatal and long-term consequences of pile driving on various animal species has yielded mixed results, ranging from death to damage to auditory tissue and other organs [131].
For instance, exposure to simulated pile-driving noise caused a variety of damage types in striped hybrid lupins (Morone chrysops/saxatilis) in both large and small-size classes [132]. In terms of hearing damage, striped hybrid perch and Mozambique cichlids (Oreochromis mossambicus) exposed to 960 pile driving signals exhibited barotrauma and damage to hair cells in the inner ear when exposed to the highest levels.
Sea bream (Spondyliosoma cantharus) and sea bass have been found to increase oxygen uptake when exposed to repetitive noise such as pile driving.
Furthermore, it has been shown that loud, impulsive noises can influence sea bass’s primary (cortisol) and secondary (adenylates, glucose, and lactate) reactions at a distance of up to 2000 m from the sound source. The potential consequences of tertiary responses on growth, illness resistance, and fecundity raise concerns if homeostasis is not restored or if the effects recur. Reductions in reproductive fitness and abundance could thus affect population size [133].
The operational noise of an offshore wind farm is generated by the movement of air over the entire structure of the offshore wind farm, including the turbine blades and the hydrodynamic forces of passing waves that cause structural vibrations. Figure 9 shows several paths including the following:
  • The rotor blades generate aerodynamic noise that travels through the air and can pass through the air into the water.
  • The airborne noise is generated by vibrations in the turbine support (tower), the nacelle and the rotor blades, so some of this noise hits the air-water interface.
  • The foundation of the structure is in contact with the seabed and the vibrations of the structure create waves that can propagate along the seabed. These waves transmit the sound that propagates upwards in the water.
  • The structural vibrations are loaded to the lower part of the tower and hit the interface between the turbine and the water. The majority of underwater noise comes from this route.
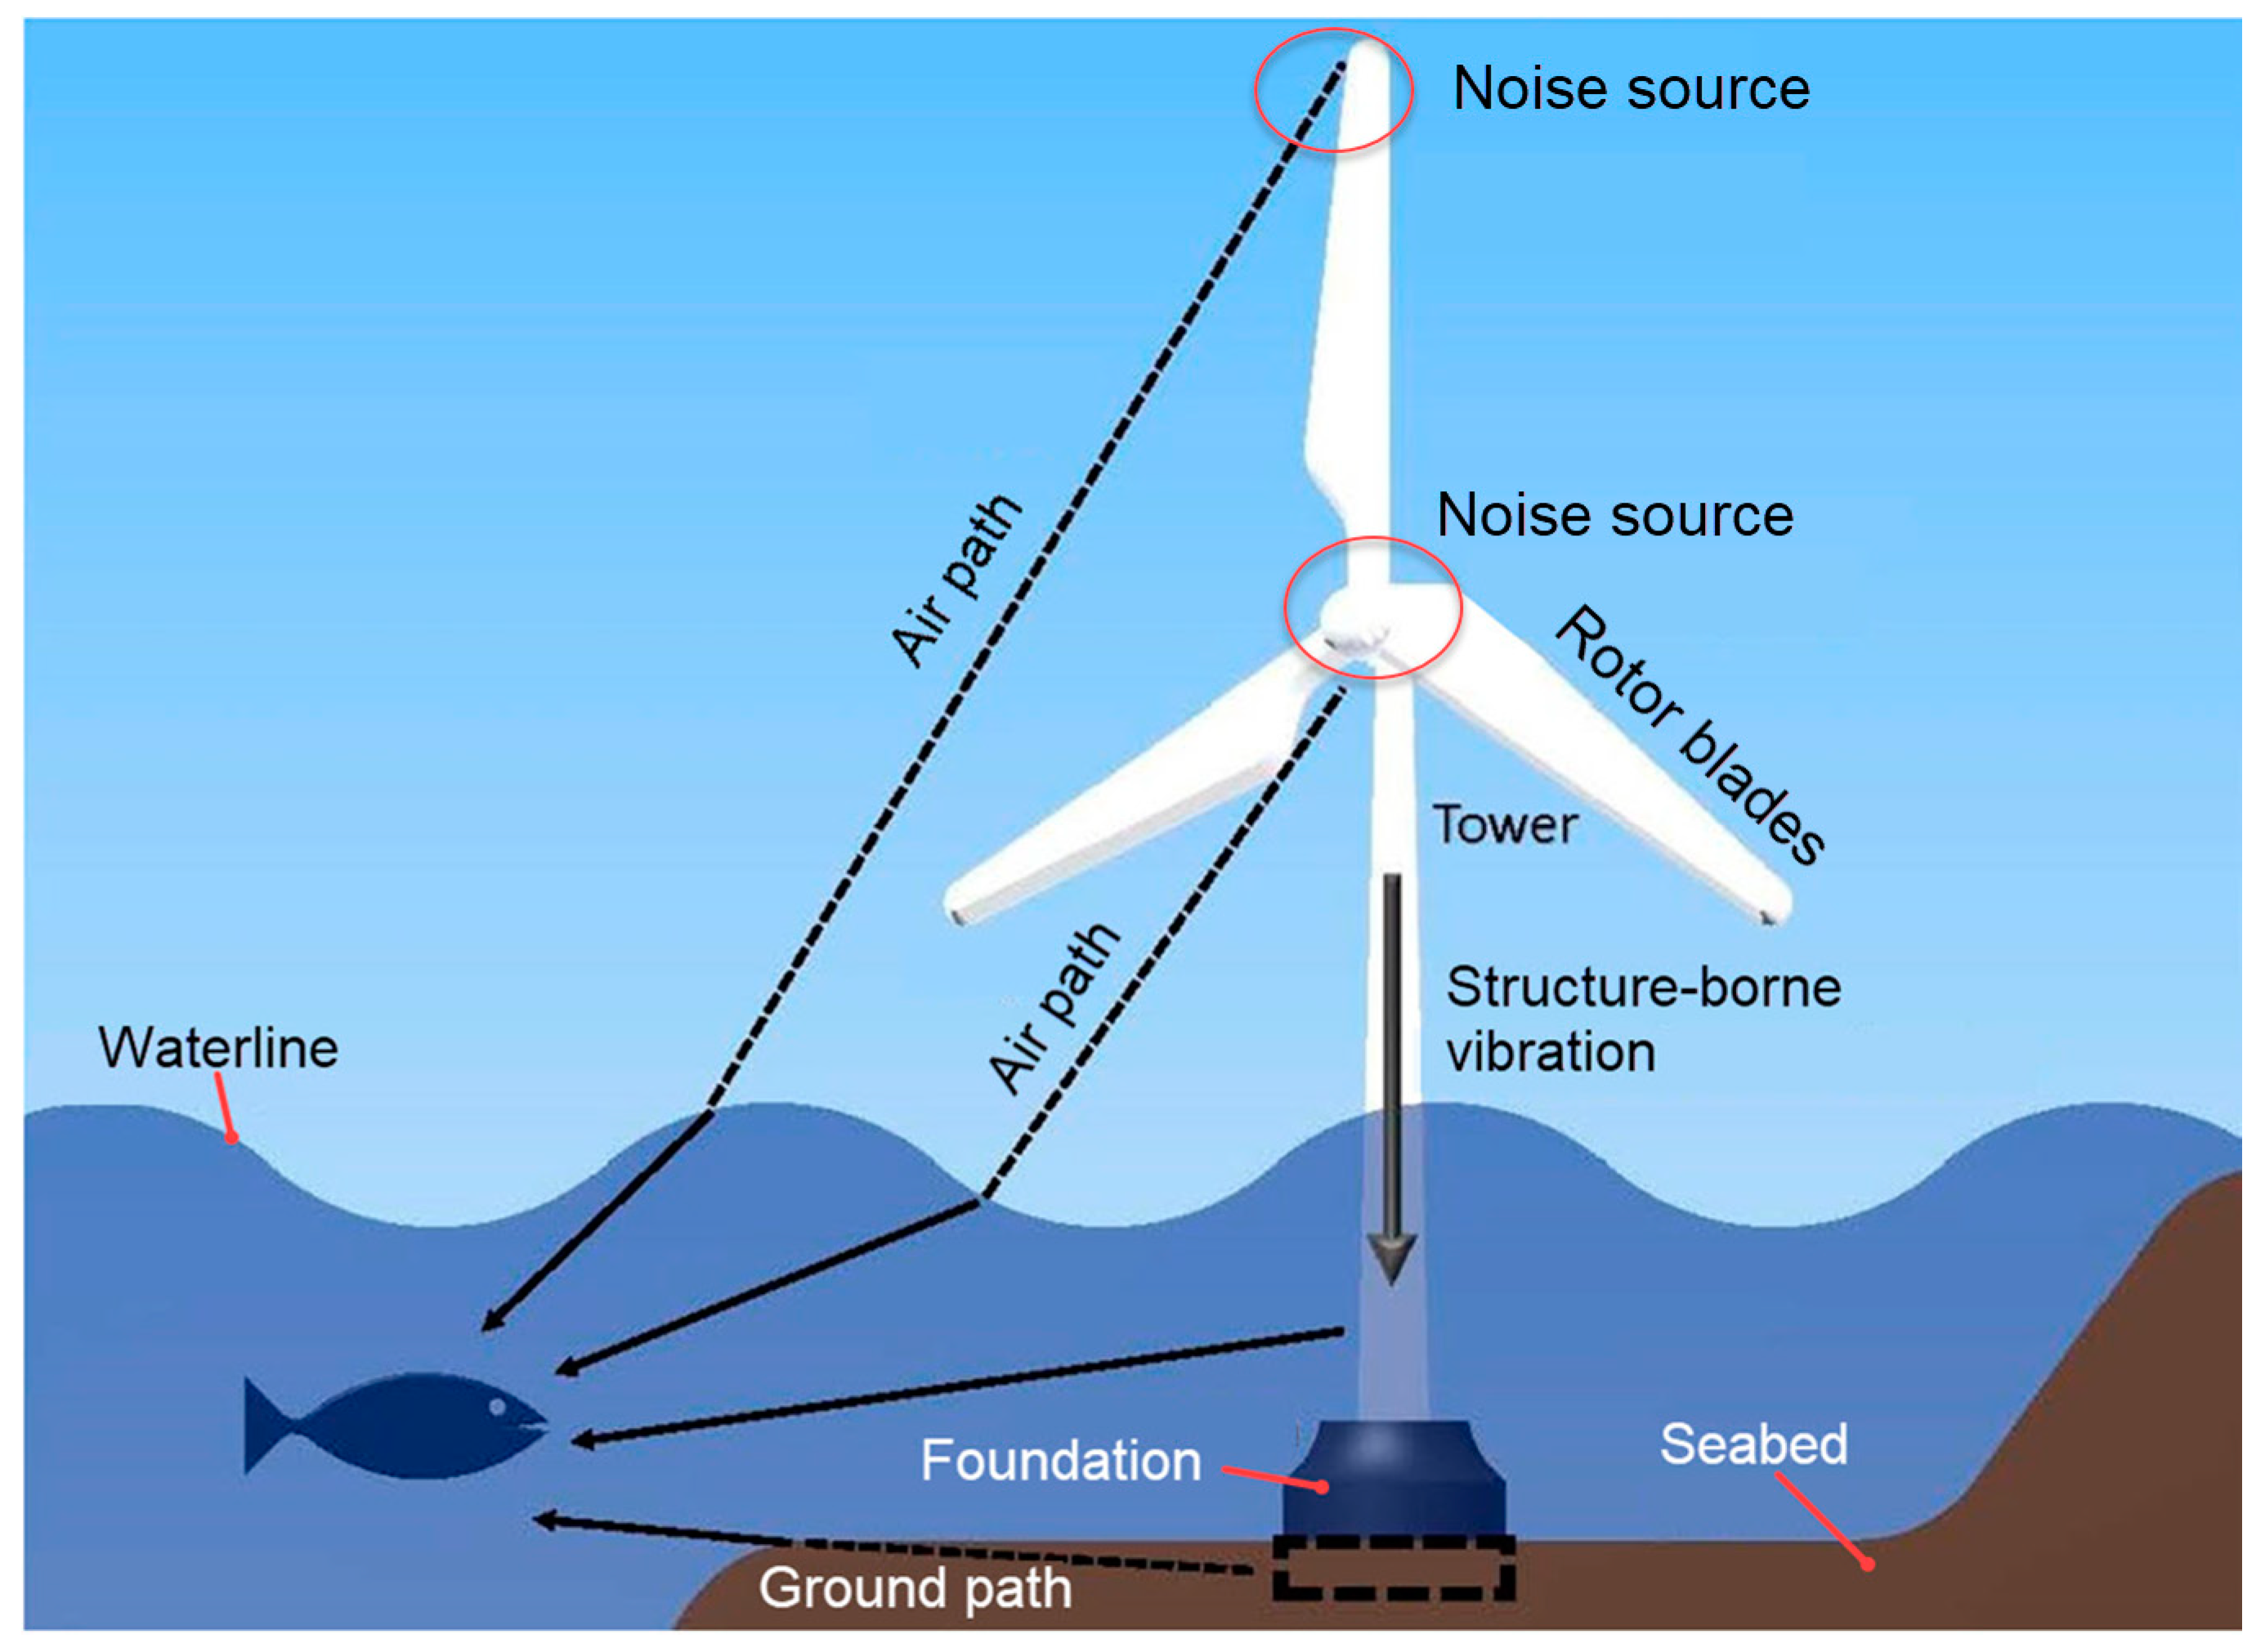
Figure 9. Sound transmission path of an offshore windturbine.
Environments 11 00257 g009
Sound propagates in the sea at a speed of around 1500 m per second, i.e., around five times faster than in the air. Underwater noise from wind turbines can be characterised as a continuous sound source that often has both broadband and tonal components with overtones below 1000 Hz. The wind and rotation speed may affect the frequency of these tones [134].
At a distance of 100 m from the source, the estimated sound pressure level of a turbine is between 105 and 125 decibels per unit pressure [135].
In areas with heavy shipping traffic, wind farms are less perceptible, although tonal components can often be heard several kilometres away. Although the OWF sound source level is comparable to that of a large commercial ship, the wind farm is permanently installed and adds virtually continuously fluctuating noise levels to the environment over many years due to changing wind speed. For this reason, the wind farm is a clear and highly localised source of noise that the local marine fauna cannot avoid. There is a proportional relationship between the size of the turbines and the underwater noise emitted [135]. This relationship is significant since the size of turbines has increased tenfold in the last 30 years and will continue to increase in the future.

3.4.5. Influence of the Electromagnetic Field of Cables in the Sea

The latest research on the impact of offshore wind farms also includes the effects of electromagnetic fields on the marine ecosystem [136]. Electromagnetic fields (EMFs) are generated in the marine environment by underwater power cables. Some animals such as rays, skates and sharks are particularly sensitive to EMFs as they use electromagnetically sensitive sensory systems for orientation, locating conspecifics and buried prey. Cables may be laid in the areas of egg laying, mating, hatching, foraging and migration routes of the species listed and the effects of EMF are still being investigated.

3.4.6. The Effects of Vibrations from Wind Turbines on the Ecological System

The impact of vibrations is one of the aspects to be considered when analysing the impact of wind turbines on the environment. Vibrations are mechanical oscillations that can be caused by the operation of the wind farm and its components. In this chapter, the effects of vibrations on the environment are analysed, taking into account the possible consequences for living beings, structures and the surrounding space.
The source of vibrations in wind farms is the rotating parts of the turbines, such as rotor blades and generators. The rotation of these parts generates periodic vibrations that are transmitted to the ground via the foundations of the wind farm. These vibrations can have a negative impact on the animals in the surrounding area, especially on their sensitive acoustic perception. A study by Estefania Velilla and colleagues from 2021 [137] shows how vibrations from wind farms affect the abundance of earthworms in the soil. The relative intensity of vibrations in the soil was measured and the results showed a decrease in the number of earthworms near the wind turbines, which is considered a negative impact on soil organisms. A decrease in earthworms was found in a radius of about 200 m around the wind turbines, where the noise level decreased by an average of 23 ± 7 dB. Earthworms are considered important engineers of the ecosystem, and interference with their abundance, survival and reproduction can indirectly affect important processes such as water filtration, nutrient cycling and carbon sequestration. In addition, the vibrational noise generated by the wind turbine can mask the vibrational signs of approaching moles, making earthworms in noisy areas more vulnerable to predation (Dominoni et al. [117]).
Offshore wind farms also generate vibrations that propagate across the seabed. Depending on the type of seabed and the structure of the environment, the vibrations can spread over several kilometres. These vibrations disrupt the marine ecosystem. Marine mammals are particularly affected. These animals are driven away from their feeding grounds or breeding grounds, communication between the animals is lost and they deviate from their migration route [138].

3.5. Impact on the Environment in the “End-of-Life” Phase

The effective service life of existing wind farms is between 20 and 25 years, while new wind turbines are designed for a service life of 30 years. Foundations and towers will easily survive this period, while rotor blades, gearboxes, generators and other smaller pieces of equipment may need to be repaired or replaced earlier. Regular maintenance is essential for the longevity of wind turbines, as it allows technical problems to be recognised early and rectified before serious failure occurs [4]. The service life is also influenced by the environmental conditions at the wind turbine site.
When the wind farm reaches the end of its planned lifetime, the investor must decide what to do next: extend the operation of the wind farm, re-power it or decommission it. The decision is influenced by technical, regulatory and economic factors. The advantage of the option to extend the operation of the wind turbine is the lower impact on the ecosystem, the lower carbon footprint and the lower water footprint, as this postpones new construction and installation. However, an equally important advantage of this option is the lower demand for raw materials and key components and the lower intensity of waste generation, which reduces the effort required for recycling.
In order to extend the service life, it is necessary to thoroughly assess the structural integrity of the turbines so as not to jeopardise the safety level and, if necessary, replace damaged parts. A major problem with replacing damaged parts is the lack of spare parts for older models of wind turbines, as new, more efficient turbine models are constantly coming onto the market. Another important aspect that determines the extension of a wind turbine’s service life is the regulatory requirements. The operators (owners) must apply for an extension of the service life [4]. This problem is solved on a country-specific basis, as there is neither an international nor an EU-wide regulation. In Germany, for example, the relevant law allows the service life to be extended by up to 10 years. In addition, the transmission system operators must also grant authorisation for continued operation, as the service lifetime of the grid connections may be limited.
If you do not decide in favour of extending the service life, you have the choice between repowering and decommissioning. There are three options for repowering. Firstly, the tower and foundation can be retained and the old turbine replaced with a new one, but with a lower output and mass. Although the new turbine generates less power, it puts less strain on the tower and foundation, which should lead to a longer service life. However, this option is not very popular. Another option is to place a new turbine with a higher capacity on top of the existing tower and foundation. While this option can generate more power, it is problematic because it puts more stress on the tower and foundation and increases the risk of structural failure or damage. The third option involves replacing the entire turbine, tower and foundation with a completely new, more powerful wind turbine platform. Here, the grid connection, which has to be upgraded, can pose a problem. Repowering is supported in the EU’s REDIII Directive as a good strategy in terms of environmental impact.
Some significant replacement projects are already underway, based on the data that are already available. The Flevoland province of the Netherlands’ Windplan Groen project is one example. There were 98 wind turbines in this area, with a combined capacity of 168 MW. Now, ninety brand-new, more powerful wind turbines with a 500 MW capacity are taking their place [4].
If an extension of the service life or repowering is not technically, legally or financially feasible, the wind turbines are dismantled and removed from the site. The land may be used to fully restore the power supply or to restore the original environmental conditions prior to the original installation of the turbines.
Decommissioned wind turbines can be processed in one of the following four ways: Second-hand market, repurposing, recycling or disposal.
If the turbine is in good technical condition, it can be resold. If it is in need of repair, it may be refurbished and then resold. Even if there is no buyer for the entire turbine, the various elements of the turbine can be sold as used parts. The parts that are remanufactured are mainly main components such as blades, generators, gearboxes and main shafts. This process releases 45% of the CO2 emissions generated during the production of a new component, even when transport-related emissions are taken into account [3]. If the turbine does not eventually end up on the used parts market, individual components of the turbine can be used for another purpose, recycled, incinerated or eventually disposed of in a landfill.
Repurposing is the process of creating new products from components or portions of components such as footbridges, playgrounds, benches, bicycle shelters, etc., which also has a positive impact on the environment as emissions are reduced.
Recycling transforms components through thermal, chemical or mechanical processing into materials that can be used in new products such as generators, cement or new wind turbine blades. This also has a positive impact on the environment, as fewer emissions are produced.
Disposal usually involves landfilling the components, but may also include incineration or leaving the components in place (foundation).
The raw materials used to manufacture a component determine how it can be processed. Other factors, such as local and state regulations, market demand, profitability and the availability of recycling infrastructure, ultimately influence the decision on how the components are processed.
According to the NREL report, wind turbines contain materials such as steel (66–79%), fibreglass, resin or plastic (11–16%), iron or cast iron (5–17%), copper (1%) and aluminium (0–2%) of the total mass, excluding the foundation of the wind farm [139].
Metal components can be recycled easily and cost-effectively using standard technologies. Components made of composite materials (such as rotor blades, nacelle covers and rotor lids) are more difficult to recycle, as emphasised by Majewski et al. [140] and Delaney et al. [141]. They consist of glass or carbon fibres mixed with epoxy resin. At the end of their useful life, composite components are usually disposed of in landfills, regardless of the industry. Mechanical recycling (i.e., shredding or crushing of composite materials) is used in European countries.
The blades of wind turbines are made of composite materials. Recycling composite materials is not easy because separating the resin from other materials is particularly difficult and not yet attractive due to the lack of valuable metals and minerals in the composite material. It is, therefore, not yet an economically attractive business model. For this reason, the blades have so far mostly been disposed of or incinerated. However, landfilling of waste is becoming an increasingly unacceptable practice, especially in Europe. Another alternative to disposal is to incinerate the blades. This can generate heat and electricity, but the energy content is not very high and burning the blades releases hazardous gases that may contain small pieces of glass fibre and dioxins, especially if PVC is used in the blades.
There are various technologies for the recycling of composite blades, but most of these technologies are not yet widely used and are not fully competitive with the source materials. One of the best-known end-of-life options is cement co-processing. In this process, the blades are fired in kilns in which glass fibres can partially replace cementitious raw materials such as silica. The organic part of the composite burns to generate heat, but the problem of hazardous fumes must be solved.
Increasingly larger wind turbine blades require the use of carbon fibre-reinforced polymers, making it necessary to explore cost-effective methods for recycling these materials [142]. Liu and Barlow [143] state that by 2050, the annual waste of rotor blades worldwide will reach 2.9 million tonnes and the cumulative waste will reach 43 million tonnes. Therefore, a sustainable process for the end-of-life management of wind turbines is required to maximise the environmental benefits of wind energy [144].
Recycling could be more successful if cradle-to-cradle were taken into account in the design process. For this reason, the world’s largest turbine manufacturers, such as Siemens Gamesa and Vestas, are investing in the production of blades that can be recycled. This is becoming increasingly important for turbine manufacturers as non-price criteria, including the circular economy, are becoming an integral part of the requirements in wind energy tenders in certain countries, particularly in Europe.

4. Conclusions

Wind farms have become a significant source of renewable energy and have the potential to reduce greenhouse gas emissions into the environment and dependence on fossil fuels. But in order to make sure this technology is used sustainably, it is critical to understand and evaluate its entire environmental impact.
This article analyses all the important aspects of the environmental impact of wind turbines in detail. Research has shown that the average GHG over the life cycle of a wind farm is 11 kg CO2 eq./MWh of electricity generated for onshore wind farms and 14 kg CO2 eq./MWh for offshore wind farms, which is the lowest compared to other energy installations.
During the life cycle of the wind turbine, the specific water consumption during operation is 4 L/MWh, i.e., a total of 670 L/MWh over the entire life cycle. The highest water consumption is recorded during the installation phase of the wind farm. Compared to other energy plants, wind turbines have the lowest water consumption.
Looking at the total area occupied by a wind farm, it can be said that wind farms occupy the largest area after biomass. The average occupancy of the total area is 0.345 ± 0.224 km2/MW of the installed capacity of the wind turbine. In some European countries, wind turbines will even occupy more than 10% of the total land area by 2030, which is a considerable amount, especially considering the destruction of habitats.
Wind farms generate noise that can have harmful effects on humans and animals, especially in the vicinity of the wind farm. Problems noted in humans include insomnia, headaches and the like. For animals, there is a wide range of potential impacts: from possible hearing damage to interference in foraging, predator marking, habitat abandonment and more.
The moving rotor blades of the wind farm can pose a risk of collision and death for birds and bats. The greatest opportunity to reduce the negative impact on biodiversity lies in the spatial planning of wind energy development zones and the optimisation of micro-sites for wind turbines. Careful siting of wind farms away from major migration routes and other sensitive areas can significantly reduce the risk to birds and bats.
It is possible that offshore wind farms support marine life. The foundations of the wind turbines and the sheltered areas of the wind farms are a potential for new habitats and the colonisation of marine life. These habitats in turn attract additional species, which is known as the ‘artificial reef effect’ and leads to a more diverse ecosystem.
The application of artificial intelligence in the detection of endangered bird species near wind turbines, the detection of conditions for icing of rotor blades and the detection of conditions for the occurrence of wind turbine failures contributes greatly to the safety of wind turbine operations and their reduced impact on the environment.
Taking all these aspects into account, LCA analyses show that in addition to low greenhouse gas emissions, wind energy has a number of other advantages, such as very low particulate emissions (no particulate emissions during operation), low water consumption and low pollutant emissions. These positive effects make it an important instrument in the fight against climate change.
When planning wind farm projects and selecting sites, investors and planners should apply the latest methods and technologies listed in this paper to minimise the impact of wind farms on the environment. By this, we primarily mean monitoring bird migration routes, recording bird locations and the duration of their stay, applying technologies to reduce noise during pile driving in offshore wind farms, applying technical solutions to reduce noise from rotor blades, applying methods to limit the flicker effect and others. The aim of this work is also to encourage young scientists and engineers to conduct research in this field and to develop new technical solutions (possibly using artificial intelligence) to further reduce the impact of wind farms on the environment.

Author Contributions

Conceptualization, M.B.; methodology, M.B.; software, I.H. and M.B.; validation, M.B.; formal analysis, M.S.; investigation, M.B., F.H., M.S. and I.H.; data curation, M.B.; writing—original draft preparation, M.B. and I.H.; writing—review and editing, M.B.; visualization, I.H. and M.B. All authors have read and agreed to the published version of the manuscript.

Funding

This research received no external funding.

Data Availability Statement

Data are contained within the article.

Conflicts of Interest

The authors declare no conflicts of interest.

References

  1. Rogelj, J.; Shindell, D.; Jiang, K.; Fifita, S.; Foster, P.; Ginzburg, V.; Handa, C.; Kheshgi, H.; Kobayashi, S.; Kriegler, E.; et al. Mitigation Pathways Compatible with 1.5 °C in the Context of Sustainable Development. In Global Warming of 1.5 °C. An IPCC Special Report on the Impacts of Global Warming of 1.5 °C Above Pre-Industrial Levels and Related Global Greenhouse Gas Emission Pathways, in the Context of Strengthening the Global Response to the Threat of Climate Change; Masson-Delmotte, V., Zhai, P., Pörtner, H.-O., Roberts, D., Skea, J., Shukla, P.R., Pirani, A., Moufouma-Okia, W., Péan, C., Pidcock, R., et al., Eds.; IPCC/WMO: Geneva, Switzerland, 2018; pp. 93–174. [Google Scholar]
  2. Dammeier, L.C.; Loriaux, J.M.; Steinmann, Z.J.N.; Smits, D.A.; Wijnant, I.L.; van den Hurk, B.; Huijbregts, M.A.J. Space, Time, and Size Dependencies of Greenhouse Gas Payback Times of Wind Turbines in Northwestern Europe. Environ. Sci. Technol. 2019, 53, 9289–9297. [Google Scholar] [CrossRef] [PubMed]
  3. Andersen, H.; Martin Smith, H.; Nielsen, A.; Rahbek Nielsen, T.; Rodriguez Diez, J.; Venderby, C.; Pearce, A.; Alsbjerg, T. Vestas Sustainability Report 2023; Vestas: Aarhus, Denmark, 2024; p. 73. [Google Scholar]
  4. Bošnjaković, M.; Katinić, M.; Santa, R.; Marić, D. Wind Turbine Technology Trends. Appl. Sci. 2022, 12, 8653. [Google Scholar] [CrossRef]
  5. United Nations Economic Commission for Europe (UNECE). Carbon Neutrality in the UNECE Region: Integrated Life-Cycle Assessment of Electricity Sources; United Nations Economic Commission for Europe (UNECE): New York, NY, USA, 2022; p. 108. [Google Scholar]
  6. Li, L.; Ma, W.; Duan, X.; Wang, S.; Wang, Q.; Gu, H.; Wang, J. Effects of Wind Farm Construction on Soil Nutrients and Vegetation: A Case Study of Linxiang Wind Farm in Hunan Province. Sustainability 2024, 16, 6350. [Google Scholar] [CrossRef]
  7. Ze, J.; Xiuchun, Y.; Ang, C.; Dong, Y.; Min, Z.; Lunda, W. Localized Eco-Climatic Impacts of Onshore Wind Farms: A Review. J. Resour. Ecol. 2024, 15, 151–160. [Google Scholar] [CrossRef]
  8. Bennun, L.; van Bochove, J.; Ng, C.; Fletcher, C.; Wilson, D.; Phair, N.; Carbone, G. Biodiversity Impacts Associated to Onshore Wind Power Projects, 2021st ed.; Hunziker, D., Ed.; IUCN: Gland, Switzerland; The Biodiversity Consultancy: Cambridge, UK; Gland, Switzerland, 2021; ISBN 978-2-8317-2101-9. (PDF). [Google Scholar]
  9. Science X Studying the Impact of Wind Farms on Animal Species and the Ecology of the North Sea. Available online: https://phys.org/news/2023-01-impact-farms-animal-species-ecology.html (accessed on 24 July 2024).
  10. Liu, B.; Ma, X.; Guo, J.; Li, H.; Jin, S.; Ma, Y.; Gong, W. Estimating Hub-Height Wind Speed Based on a Machine Learning Algorithm: Implications for Wind Energy Assessment. Atmos. Chem. Phys. 2023, 23, 3181–3193. [Google Scholar] [CrossRef]
  11. Caduff, M.; Huijbregts, M.A.J.; Althaus, H.-J.; Koehler, A.; Hellweg, S. Wind Power Electricity: The Bigger the Turbine, The Greener the Electricity? Environ. Sci. Technol. 2012, 46, 4725–4733. [Google Scholar] [CrossRef]
  12. Huijbregts, M.A.J.; Steinmann, Z.J.N.; Elshout, P.M.F.; Stam, G.; Verones, F.; Vieira, M.; Zijp, M.; Hollander, A.; van Zelm, R. ReCiPe2016: A Harmonised Life Cycle Impact Assessment Method at Midpoint and Endpoint Level. Int. J. Life Cycle Assess. 2017, 22, 138–147. [Google Scholar] [CrossRef]
  13. C(2021) 9332 Final; Commission Recommendation on the Use of EF Methods. EU Commission: Brussels, Belgium, 2021; pp. 1–23.
  14. Sala, S.; Reale, F.; Cristóbal-García, J.; Marelli, L.; Rana, P. Life Cycle Assessment for the Impact Assessment of Policies. Life Thinking and Assessment in the European Policies and for Evaluating Policy Options. Jt. Res. Cent. 2016, 53. [Google Scholar] [CrossRef]
  15. Mello, G.; Ferreira Dias, M.; Robaina, M. Wind Farms Life Cycle Assessment Review: CO2 Emissions and Climate Change. Energy Rep. 2020, 6, 214–219. [Google Scholar] [CrossRef]
  16. Bošnjaković, M.; Tadijanović, V. Environment Impact of a Concentrated Solar Power Plant. Teh. Glas. 2019, 13, 68–74. [Google Scholar] [CrossRef]
  17. Bošnjaković, M.; Santa, R.; Crnac, Z.; Bošnjaković, T. Environmental Impact of PV Power Systems. Sustainability 2023, 15, 11888. [Google Scholar] [CrossRef]
  18. Isabella Pimentel Pincelli, J.H.; Brent, A. Developing Onshore Wind Farms in Aotearoa New Zealand: Carbon and Energy Footprints. J. R. Soc. N. Z. 2024, 1–23. [Google Scholar] [CrossRef]
  19. Oebels, K.B.; Pacca, S. Life Cycle Assessment of an Onshore Wind Farm Located at the Northeastern Coast of Brazil. Renew. Energy 2013, 53, 60–70. [Google Scholar] [CrossRef]
  20. Khaiyum, M.Z.; Sarker, S.; Kabir, G. Evaluation of Carbon Emission Factors in the Cement Industry: An Emerging Economy Context. Sustainability 2023, 15, 5407. [Google Scholar] [CrossRef]
  21. Belaïd, F. How Does Concrete and Cement Industry Transformation Contribute to Mitigating Climate Change Challenges? Resour. Conserv. Recycl. Adv. 2022, 15, 200084. [Google Scholar] [CrossRef]
  22. Eberle, A.; Cooperman, A.; Walzberg, J.; Hettinger, D.; Tusing, R.F.; Berry, D.; Inman, D.; Sirnivas, S.; Marquis, M.; Ennis, B.; et al. Materials Used in U.S. Wind Energy Technologies: Quantities and Availability for Two Future Scenarios; National Renewable Energy Laboratory (NREL): Golden, CO, USA, 2023. [Google Scholar]
  23. Khalil, E.A.; AbouZeid, M.N. Computation of the Environmental Performance of Ready-Mix Concrete for Reducing CO2 Emissions: A Case Study in Egypt. Energy Rep. 2023, 9, 144–148. [Google Scholar] [CrossRef]
  24. Li, X.; Hao, H.; Wang, H.; Zhang, L.; Guo, Y.; Lian, J.; Du, Y.; Wang, X.; Zeng, C. Design and Analysis of a New Prefabricated Foundation for Onshore Wind Turbines. Buildings 2024, 14, 193. [Google Scholar] [CrossRef]
  25. Knight, K.A.; Cunningham, P.R.; Miller, S.A. Optimizing Supplementary Cementitious Material Replacement to Minimize the Environmental Impacts of Concrete. Cem. Concr. Compos. 2023, 139, 105049. [Google Scholar] [CrossRef]
  26. Sustainability Performance of the Steel Industry 2004–2022; Worldsteel: Brussels, Belgium, 2023; pp. 1–9.
  27. Morini, A.A.; Ribeiro, M.J.; Hotza, D. Carbon Footprint and Embodied Energy of a Wind Turbine Blade—A Case Study. Int. J. Life Cycle Assess. 2021, 26, 1177–1187. [Google Scholar] [CrossRef]
  28. Liu, P.; Barlow, C.Y. The Environmental Impact of Wind Turbine Blades. IOP Conf. Ser. Mater. Sci. Eng. 2016, 139, 12032. [Google Scholar] [CrossRef]
  29. Yang, J.; Meng, F.; Zhang, L.; McKechnie, J.; Chang, Y.; Ma, B.; Hao, Y.; Li, X.; Pender, K.; Yang, L.; et al. Solutions for Recycling Emerging Wind Turbine Blade Waste in China Are Not yet Effective. Commun. Earth Environ. 2023, 4, 466. [Google Scholar] [CrossRef]
  30. OECD. Water Security for Better Lives; OECD Studies on Water: Paris, France, 2013; p. 173. [Google Scholar]
  31. Mekonnen, M.M.; Gerbens-Leenes, P.W.; Hoekstra, A.Y. The Consumptive Water Footprint of Electricity and Heat: A Global Assessment. Environ. Sci. Water Res. Technol. 2015, 1, 285–297. [Google Scholar] [CrossRef]
  32. Vanham, D.; Medarac, H.; Schyns, J.F.; Hogeboom, R.J.; Magagna, D. The Consumptive Water Footprint of the European Union Energy Sector. Environ. Res. Lett. 2019, 14, 104016. [Google Scholar] [CrossRef]
  33. Jin, Y.; Behrens, P.; Tukker, A.; Scherer, L. Water Use of Electricity Technologies: A Global Meta-Analysis. Renew. Sustain. Energy Rev. 2019, 115, 109391. [Google Scholar] [CrossRef]
  34. Saidur, R.; Rahim, N.A.; Islam, M.R.; Solangi, K.H. Environmental Impact of Wind Energy. Renew. Sustain. Energy Rev. 2011, 15, 2423–2430. [Google Scholar] [CrossRef]
  35. Jia, X.; Klemeš, J.J.; Tan, R.R. Overview of Water Use in Renewable Electricity Generation. Chem. Eng. Trans. 2021, 89, 403–408, SE-Research Articles. [Google Scholar] [CrossRef]
  36. Koulouri, A.; Moccia, J. Saving Water with Wind Energy; The European Wind Energy Association: Etterbeek, Brussels, 2014; p. 20. [Google Scholar]
  37. Abbasi, M.; Monazzam, M.R.; Ebrahimi, M.H.; Zakerian, S.A.; Dehghan, S.F.; Akbarzadeh, A. Assessment of Noise Effects of Wind Turbine on the General Health of Staff at Wind Farm of Manjil, Iran. J. Low Freq. Noise, Vib. Act. Control 2016, 35, 91–98. [Google Scholar] [CrossRef]
  38. SYED, Z. An Israeli Wind Project Draws Scrutiny on Turbines and People’s Health. Available online: https://www.popsci.com/environment/wind-turbines-effects-health/ (accessed on 23 July 2024).
  39. Schmidt, J.H.; Klokker, M. Health Effects Related to Wind Turbine Noise Exposure: A Systematic Review. PLoS ONE 2014, 9, e114183. [Google Scholar] [CrossRef]
  40. Erhart, S.; Erhart, K. Environmental Ranking of European Industrial Facilities by Toxicity and Global Warming Potentials. Sci. Rep. 2023, 13, 1772. [Google Scholar] [CrossRef]
  41. Papai, S.; De Bruyn, S.; Juijn, D.; De Vries, J. The Value of Human Toxicity; CE Delft: Delft, the Netherlands, 2021; p. 119. [Google Scholar]
  42. Wang, S. Near-Zero Air Pollutant Emission Technologies and Applications for Clean Coal-Fired Power. Engineering 2020, 6, 1408–1422. [Google Scholar] [CrossRef]
  43. Deshmukh, S.; Bhattacharya, S.; Jain, A.; Paul, A.R. Wind Turbine Noise and Its Mitigation Techniques: A Review. Energy Procedia 2019, 160, 633–640. [Google Scholar] [CrossRef]
  44. Martens, S.; Bohne, T.; Rolfes, R. Measuring and Analysing the Sound Propagation of Wind Turbines. In Proceedings of the 8th International Conference on Wind Turbine Noise, Lisbon, Portugal, 12–14 June 2019; p. 16. [Google Scholar]
  45. Hansen, C.; Hansen, K. Recent Advances in Wind Turbine Noise Research. Acoustics 2020, 2, 171–206. [Google Scholar] [CrossRef]
  46. Zhu, W.J.; Shen, W.Z.; Sørensen, J.N. Low-Noise Airfoil and Wind Turbine Design. In Wind Turbines; Aissaoui, A.G., Tahour, A., Eds.; IntechOpen: Rijeka, Croatia, 2016. [Google Scholar]
  47. Mathew, J.; Singh, A.; Madsen, J.; León, C.A. Serration Design Methodology for Wind Turbine Noise Reduction. J. Phys. Conf. Ser. 2016, 753, 22019. [Google Scholar] [CrossRef]
  48. Herr, M. Experimental Study on Noise Reduction through Trailing Edge Brushes. In New Results in Numerical and Experimental Fluid Mechanics V; Rath, H.-J., Holze, C., Heinemann, H.-J., Henke, R., Hönlinger, H., Eds.; Springer: Berlin/Heidelberg, Germany, 2006; pp. 365–372. [Google Scholar]
  49. Geyer, T.F.; Schneehagen, E.W.; Herold, G.; Zang, T.; Moreau, D.J. Reduction of Rotor Aerodynamic Noise Using Porous Blade Tips. In Proceedings of the Fortschritte der Akustik—DAGA 2024, Hannover, Germany, 18–21 March 2024. [Google Scholar]
  50. Paruchuri, C.; Joseph, P.; Ayton, L.J. On the Superior Performance of Leading Edge Slits over Serrations for the Reduction of Aerofoil Interaction Noise. In Proceedings of the 2018 AIAA/CEAS Aeroacoustics Conference, Atlanta, Georgia, 25-29 June 2018. [Google Scholar]
  51. Masud, M.H.; Naim-Ul-Hasan; Arefin, A.M.E.; Joardder, M.U.H. Design Modification of Airfoil by Integrating Sinusoidal Leading Edge and Dimpled Surface. AIP Conf. Proc. 2017, 1851, 20048. [Google Scholar] [CrossRef]
  52. Gang, L.; Zhengtao, Z.; Pingguo, Z. Numerical Study on Noise Reduction of Wind Turbine Blade Vortex Generator. IOP Conf. Ser. Earth Environ. Sci. 2019, 358, 022026. [Google Scholar] [CrossRef]
  53. Arnold, B.; Lutz, T.; Krämer, E. Design of a Boundary-Layer Suction System for Turbulent Trailing-Edge Noise Reduction of Wind Turbines. Renew. Energy 2018, 123, 249–262. [Google Scholar] [CrossRef]
  54. Evans, T.; Cooper, J. Influence of Wind Direction on Noise Emission and Propagation from Wind Turbines. In Proceedings of the Acoustics 2012 Fremantle: Acoustics, Development and the Environment, Fremantle, Australia, 21–23 November 2012; Australian Acoustical Society: Fremantle, Australia, 2012; p. 5. [Google Scholar]
  55. Josimović, B.; Bezbradica, L.; Manić, B.; Srnić, D.; Srebrić, N. Cumulative Impact of Wind Farm Noise. Appl. Sci. 2023, 13, 8792. [Google Scholar] [CrossRef]
  56. Chiu, C.-H.; Lung, S.-C.C.; Chen, N.; Hwang, J.-S.; Tsou, M.-C.M. Effects of Low-Frequency Noise from Wind Turbines on Heart Rate Variability in Healthy Individuals. Sci. Rep. 2021, 11, 17817. [Google Scholar] [CrossRef]
  57. Thorsson, P.; Persson Waye, K.; Smith, M.; Ögren, M.; Pedersen, E.; Forssén, J. Low-Frequency Outdoor–Indoor Noise Level Difference for Wind Turbine Assessment. J. Acoust. Soc. Am. 2018, 143, EL206–EL211. [Google Scholar] [CrossRef]
  58. Wind Turbine Noise and Health Study: Summary of Results. Available online: https://www.canada.ca/en/health-canada/services/health-risks-safety/radiation/everyday-things-emit-radiation/wind-turbine-noise/wind-turbine-noise-health-study-summary-results.html (accessed on 28 July 2024).
  59. ANSI S12.9-Part 4-2005; Quantities And Procedures For Description And Measurement Of Environmental Sound—Part 4: Noise Assessment And Prediction Of Long-Term Community Response. Standards Secretariat Acoustical Society of America: New York, NY, USA, 2005.
  60. ISO 1996-1:2016; Acoustics–Description, Measurement and Assessment of Environmental Noise Part 1: Basic Quantities and Assessment Procedures. ISO: Geneva, Switzerland, 2016; p. 47.
  61. IEC 61400-11:2012; Wind Turbines—Part 11: Acoustic Noise Measurement Techniques. International Electrotechnical Commission: Singapore, 2012; p. 58.
  62. NZS 6808:2010; Acoustics—Wind Farm Noise. New Zealand High Commission: Singapore, 2010; p. 48.
  63. Nieuwenhuizen, E.; Köhl, M. Differences in Noise Regulations for Wind Turbines in Four European Countries. In Proceedings of the EuroNoise 2015, Maastricht, The Netherlands, 31 May–3 June 2015; pp. 333–338. [Google Scholar]
  64. Koppen, E.; Gunuru, M.; Chester, A. International Legislation and Regulations for Wind Turbine Shadow Flicker Impact. In Proceedings of the 7th International Conference on Wind Turbine Noise, Rotterdam, The Netherlands, 2–5 May 2017. [Google Scholar]
  65. Lindvall, T.; Radford, E.P. Measurement of Annoyance Due to Exposure to Environmental Factors: The Fourth Karolinska Institute Symposium on Environmental Health. Environ. Res. 1973, 6, 1–36. [Google Scholar] [CrossRef]
  66. Haac, R.; Darlow, R.; Kaliski, K.; Rand, J.; Hoen, B. In the Shadow of Wind Energy: Predicting Community Exposure and Annoyance to Wind Turbine Shadow Flicker in the United States. Energy Res. Soc. Sci. 2022, 87, 102471. [Google Scholar] [CrossRef]
  67. Voicescu, S.A.; Michaud, D.S.; Feder, K.; Marro, L.; Than, J.; Guay, M.; Denning, A.; Bower, T.; van den Berg, F.; Broner, N.; et al. Estimating Annoyance to Calculated Wind Turbine Shadow Flicker Is Improved When Variables Associated with Wind Turbine Noise Exposure Are Considered. J. Acoust. Soc. Am. 2016, 139, 1480–1492. [Google Scholar] [CrossRef] [PubMed]
  68. Godreau, C.; Paquet, Y.; Froidevaux, P.; Krenn, A.; Wickman, H. IEA Wind TCP Task 19 Technical Report Ice Detection Guidelines for Wind Energy Applications; IEA Wind: Paris, France, 2021. [Google Scholar]
  69. Summary of Wind Turbine Accident Data to 30 June 2024. Available online: https://scotlandagainstspin.org/turbine-accident-statistics/ (accessed on 12 August 2024).
  70. Madi, E.; Pope, K.; Huang, W.; Iqbal, T. A Review of Integrating Ice Detection and Mitigation for Wind Turbine Blades. Renew. Sustain. Energy Rev. 2019, 103, 269–281. [Google Scholar] [CrossRef]
  71. Rekuviene, R.; Saeidiharzand, S.; Mažeika, L.; Samaitis, V.; Jankauskas, A.; Sadaghiani, A.K.; Gharib, G.; Muganlı, Z.; Koşar, A. A Review on Passive and Active Anti-Icing and de-Icing Technologies. Appl. Therm. Eng. 2024, 250, 123474. [Google Scholar] [CrossRef]
  72. Chatterjee, J.; Alvela Nieto, M.T.; Gelbhardt, H.; Dethlefs, N.; Ohlendorf, J.-H.; Greulich, A.; Thoben, K.-D. Domain-Invariant Icing Detection on Wind Turbine Rotor Blades with Generative Artificial Intelligence for Deep Transfer Learning. Environ. Data Sci. 2023, 2, e12. [Google Scholar] [CrossRef]
  73. Mishnaevsky, L., Jr. Root Causes and Mechanisms of Failure of Wind Turbine Blades: Overview. Materials 2022, 15, 2959. [Google Scholar] [CrossRef]
  74. Sarlak, H.; Sørensen, J.N. Analysis of Throw Distances of Detached Objects from Horizontal-Axis Wind Turbines. Wind Energy 2016, 19, 151–166. [Google Scholar] [CrossRef]
  75. Asian, S.; Ertek, G.; Haksoz, C.; Pakter, S.; Ulun, S. Wind Turbine Accidents: A Data Mining Study. IEEE Syst. J. 2017, 11, 1567–1578. [Google Scholar] [CrossRef]
  76. Auld, T.; McHenry, M.P.; Whale, J. Options to Mitigate Utility-Scale Wind Turbine Impacts on Defence Capability, Air Supremacy, and Missile Detection. Renew. Energy 2014, 63, 255–262. [Google Scholar] [CrossRef]
  77. TRAFICOM. The Impact of Wind Farms on Radio Systems and the Reduction of Adverse Effects. Available online: https://www.traficom.fi/sites/default/files/media/file/Tuulivoimala_taajuusliite_EN.pdf (accessed on 24 July 2024).
  78. ATDI. Managing the Impact of Wind Farms on Military Communication Systems. Available online: https://atdi.com/military-wind-farm-mitigation-strategies/ (accessed on 24 July 2024).
  79. Angulo, I.; de la Vega, D.; Cascón, I.; Cañizo, J.; Wu, Y.; Guerra, D.; Angueira, P. Impact Analysis of Wind Farms on Telecommunication Services. Renew. Sustain. Energy Rev. 2014, 32, 84–99. [Google Scholar] [CrossRef]
  80. Helldin, J.O.; Jung, J.; Kindberg, J.; Lindberg, N.; Neumann, W.; Olsson, M.; Skarin, A.; Widemo, F. Effects of Wind Power on Terrestrial Mammals—A Synthesis; Swedish Environmental Protection Agency: Stockholm, Sweden, 2012. [Google Scholar]
  81. Watson, S.C.L.; Somerfield, P.J.; Lemasson, A.J.; Knights, A.M.; Edwards-Jones, A.; Nunes, J.; Pascoe, C.; McNeill, C.L.; Schratzberger, M.; Thompson, M.S.A.; et al. The Global Impact of Offshore Wind Farms on Ecosystem Services. Ocean Coast. Manag. 2024, 249, 107023. [Google Scholar] [CrossRef]
  82. Ivanov, E.; Capet, A.; De Borger, E.; Degraer, S.; Delhez, E.J.M.; Soetaert, K.; Vanaverbeke, J.; Grégoire, M. Offshore Wind Farm Footprint on Organic and Mineral Particle Flux to the Bottom. Front. Mar. Sci. 2021, 8, 631799. [Google Scholar] [CrossRef]
  83. Gartman, V.; Bulling, L.; Dahmen, M.; Geißler, G.; Köppel, J. Mitigation Measures for Wildlife in Wind Energy Development, Consolidating the State of Knowledge—Part 1: Planning and Siting, Construction. J. Environ. Assess. Policy Manag. 2016, 18, 1650013. [Google Scholar] [CrossRef]
  84. Denholm, P.; Hand, M.; Jackson, M.; Ong, S. Land-Use Requirements of Modern Wind Power Plants in the United States; National Renewable Energy Laboratory: Golden, CO, USA, 2009. [Google Scholar]
  85. Harrison-Atlas, D.; Lopez, A.; Lantz, E. Dynamic Land Use Implications of Rapidly Expanding and Evolving Wind Power Deployment. Environ. Res. Lett. 2022, 17, 044064. [Google Scholar] [CrossRef]
  86. Costanzo, G.; Brindley, G. Wind Energy in Europe—2023 Statistics and the Outlook for 2024–2030; WindEurope: Brussels, Belgium, 2024. [Google Scholar]
  87. IRENA. Future of Wind: Deployment, Investment, Technology, Grid Integration and Socio-Economic Aspects; International Renewable Energy Agency: Abu Dhabi, United Arab Emirates, 2019; ISBN 9789292601553. [Google Scholar]
  88. Plumb, R.T.; Lautenbach, J.M.; Robinson, S.G.; Haukos, D.A.; Winder, V.L.; Hagen, C.A.; Sullins, D.S.; Pitman, J.C.; Dahlgren, D.K. Lesser Prairie-Chicken Space Use in Relation to Anthropogenic Structures. J. Wildl. Manage. 2019, 83, 216–230. [Google Scholar] [CrossRef]
  89. Pearce-Higgins, J.W.; Stephen, L.; Douse, A.; Langston, R.H.W. Greater Impacts of Wind Farms on Bird Populations during Construction than Subsequent Operation: Results of a Multi-Site and Multi-Species Analysis. J. Appl. Ecol. 2012, 49, 386–394. [Google Scholar] [CrossRef]
  90. Kiesecker, J.; Baruch-Mordo, S.; Kennedy, C.M.; Oakleaf, J.R.; Baccini, A.; Griscom, B.W. Hitting the Target but Missing the Mark: Unintended Environmental Consequences of the Paris Climate Agreement. Front. Environ. Sci. 2019, 7, 151. [Google Scholar] [CrossRef]
  91. Tolvanen, A.; Routavaara, H.; Jokikokko, M.; Rana, P. How Far Are Birds, Bats, and Terrestrial Mammals Displaced from Onshore Wind Power Development?—A Systematic Review. Biol. Conserv. 2023, 288, 110382. [Google Scholar] [CrossRef]
  92. Pasanen-Mortensen, M.; Elmhagen, B. Land Cover Effects on Mesopredator Abundance in the Presence and Absence of Apex Predators. Acta Oecologica 2015, 67, 40–48. [Google Scholar] [CrossRef]
  93. Hradsky, B.A.; Robley, A.; Alexander, R.; Ritchie, E.G.; York, A.; Di Stefano, J. Human-Modified Habitats Facilitate Forest-Dwelling Populations of an Invasive Predator, Vulpes Vulpes. Sci. Rep. 2017, 7, 12291. [Google Scholar] [CrossRef]
  94. Coppes, J.; Ehrlacher, J.; Thiel, D.; Suchant, R.; Braunisch, V. Outdoor Recreation Causes Effective Habitat Reduction in Capercaillie Tetrao Urogallus: A Major Threat for Geographically Restricted Populations. J. Avian Biol. 2017, 48, 1583–1594. [Google Scholar] [CrossRef]
  95. Braunisch, V.; Coppes, J.; Bächle, S.; Suchant, R. Underpinning the Precautionary Principle with Evidence: A Spatial Concept for Guiding Wind Power Development in Endangered Species’ Habitats. J. Nat. Conserv. 2015, 24, 31–40. [Google Scholar] [CrossRef]
  96. Foo, C.F.; Bennett, V.J.; Hale, A.M.; Korstian, J.M.; Schildt, A.J.; Williams, D.A. Increasing Evidence That Bats Actively Forage at Wind Turbines. PeerJ 2017, 5, e3985. [Google Scholar] [CrossRef]
  97. Rollins, K.E.; Meyerholz, D.K.; Johnson, G.D.; Capparella, A.P.; Loew, S.S. A Forensic Investigation Into the Etiology of Bat Mortality at a Wind Farm: Barotrauma or Traumatic Injury? Vet. Pathol. 2012, 49, 362–371. [Google Scholar] [CrossRef]
  98. HORN, J.W.; ARNETT, E.B.; KUNZ, T.H. Behavioral Responses of Bats to Operating Wind Turbines. J. Wildl. Manag. 2008, 72, 123–132. [Google Scholar] [CrossRef]
  99. Erickson, W.P.; Wolfe, M.M.; Bay, K.J.; Johnson, D.H.; Gehring, J.L. A Comprehensive Analysis of Small-Passerine Fatalities from Collision with Turbines at Wind Energy Facilities. PLoS ONE 2014, 9, e107491. [Google Scholar] [CrossRef]
  100. Thaxter, C.B.; Buchanan, G.M.; Carr, J.; Butchart, S.H.M.; Newbold, T.; Green, R.E.; Tobias, J.A.; Foden, W.B.; O’Brien, S.; Pearce-Higgins, J.W. Bird and Bat Species’ Global Vulnerability to Collision Mortality at Wind Farms Revealed through a Trait-Based Assessment. Proc. R. Soc. B Biol. Sci. 2017, 284, 20170829. [Google Scholar] [CrossRef]
  101. Barclay, R.M.R.; Baerwald, E.F.; Gruver, J.C. Variation in Bat and Bird Fatalities at Wind Energy Facilities: Assessing the Effects of Rotor Size and Tower Height. Can. J. Zool. 2007, 85, 381–387. [Google Scholar] [CrossRef]
  102. Sovacool, B.K. The Avian Benefits of Wind Energy: A 2009 Update. Renew. Energy 2013, 49, 19–24. [Google Scholar] [CrossRef]
  103. Voigt, C.C.; Straka, T.M.; Fritze, M. Producing Wind Energy at the Cost of Biodiversity: A Stakeholder View on a Green-Green Dilemma. J. Renew. Sustain. Energy 2019, 11, 63303. [Google Scholar] [CrossRef]
  104. May, R.; Nygård, T.; Falkdalen, U.; Åström, J.; Hamre, Ø.; Stokke, B.G. Paint It Black: Efficacy of Increased Wind Turbine Rotor Blade Visibility to Reduce Avian Fatalities. Ecol. Evol. 2020, 10, 8927–8935. [Google Scholar] [CrossRef] [PubMed]
  105. Tomé, R.; Canário, F.; Leitão, A.H.; Pires, N.; Repas, M. Radar Assisted Shutdown on Demand Ensures Zero Soaring Bird Mortality at a Wind Farm Located in a Migratory Flyway. In Wind Energy and Wildlife Interactions: Presentations from the CWW2015 Conference; Köppel, J., Ed.; Springer International Publishing: Cham, Switzerland, 2017; pp. 119–133. ISBN 978-3-319-51272-3. [Google Scholar]
  106. Weaver, S.P.; Hein, C.D.; Simpson, T.R.; Evans, J.W.; Castro-Arellano, I. Ultrasonic Acoustic Deterrents Significantly Reduce Bat Fatalities at Wind Turbines. Glob. Ecol. Conserv. 2020, 24, e01099. [Google Scholar] [CrossRef]
  107. Hayes, M.A.; Hooton, L.A.; Gilland, K.L.; Grandgent, C.; Smith, R.L.; Lindsay, S.R.; Collins, J.D.; Schumacher, S.M.; Rabie, P.A.; Gruver, J.C.; et al. A Smart Curtailment Approach for Reducing Bat Fatalities and Curtailment Time at Wind Energy Facilities. Ecol. Appl. 2019, 29, e01881. [Google Scholar] [CrossRef]
  108. Rabie, P.A.; Welch-Acosta, B.; Nasman, K.; Schumacher, S.; Schueller, S.; Gruver, J. Efficacy and Cost of Acoustic-Informed and Wind Speed-Only Turbine Curtailment to Reduce Bat Fatalities at a Wind Energy Facility in Wisconsin. PLoS ONE 2022, 17, e266500. [Google Scholar] [CrossRef]
  109. Pescador, M.; Gómez Ramírez, J.I.; Peris, S.J. Effectiveness of a Mitigation Measure for the Lesser Kestrel (Falco Naumanni) in Wind Farms in Spain. J. Environ. Manag. 2019, 231, 919–925. [Google Scholar] [CrossRef]
  110. Martin, G.R.; Banks, A.N. Marine Birds: Vision-Based Wind Turbine Collision Mitigation. Glob. Ecol. Conserv. 2023, 42, e02386. [Google Scholar] [CrossRef]
  111. Thaxter, C.B.; Ross-Smith, V.H.; Bouten, W.; Clark, N.A.; Conway, G.J.; Masden, E.A.; Clewley, G.D.; Barber, L.J.; Burton, N.H.K. Avian Vulnerability to Wind Farm Collision through the Year: Insights from Lesser Black-Backed Gulls (Larus Fuscus) Tracked from Multiple Breeding Colonies. J. Appl. Ecol. 2019, 56, 2410–2422. [Google Scholar] [CrossRef]
  112. Vasilakis, D.P.; Whitfield, D.P.; Schindler, S.; Poirazidis, K.S.; Kati, V. Reconciling Endangered Species Conservation with Wind Farm Development: Cinereous Vultures (Aegypius monachus) in South-Eastern Europe. Biol. Conserv. 2016, 196, 10–17. [Google Scholar] [CrossRef]
  113. Warwick-Evans, V.; Atkinson, P.W.; Walkington, I.; Green, J.A. Predicting the Impacts of Wind Farms on Seabirds: An Individual-Based Model. J. Appl. Ecol. 2018, 55, 503–515. [Google Scholar] [CrossRef]
  114. Gauld, J.G.; Silva, J.P.; Atkinson, P.W.; Record, P.; Acácio, M.; Arkumarev, V.; Blas, J.; Bouten, W.; Burton, N.; Catry, I.; et al. Hotspots in the Grid: Avian Sensitivity and Vulnerability to Collision Risk from Energy Infrastructure Interactions in Europe and North Africa. J. Appl. Ecol. 2022, 59, 1496–1512. [Google Scholar] [CrossRef]
  115. Duerr, A.E.; Parsons, A.E.; Nagy, L.R.; Kuehn, M.J.; Bloom, P.H. Effectiveness of an Artificial Intelligence-Based System to Curtail Wind Turbines to Reduce Eagle Collisions. PLoS ONE 2023, 18, e278754. [Google Scholar] [CrossRef] [PubMed]
  116. Francis, C.D.; Barber, J.R. A Framework for Understanding Noise Impacts on Wildlife: An Urgent Conservation Priority. Front. Ecol. Environ. 2013, 11, 305–313. [Google Scholar] [CrossRef]
  117. Dominoni, D.M.; Halfwerk, W.; Baird, E.; Buxton, R.T.; Fernández-Juricic, E.; Fristrup, K.M.; McKenna, M.F.; Mennitt, D.J.; Perkin, E.K.; Seymoure, B.M.; et al. Why Conservation Biology Can Benefit from Sensory Ecology. Nat. Ecol. Evol. 2020, 4, 502–511. [Google Scholar] [CrossRef] [PubMed]
  118. Kleist, N.J.; Guralnick, R.P.; Cruz, A.; Lowry, C.A.; Francis, C.D. Chronic Anthropogenic Noise Disrupts Glucocorticoid Signaling and Has Multiple Effects on Fitness in an Avian Community. Proc. Natl. Acad. Sci. USA 2018, 115, E648–E657. [Google Scholar] [CrossRef]
  119. Teff-Seker, Y.; Berger-Tal, O.; Lehnardt, Y.; Teschner, N. Noise Pollution from Wind Turbines and Its Effects on Wildlife: A Cross-National Analysis of Current Policies and Planning Regulations. Renew. Sustain. Energy Rev. 2022, 168, 112801. [Google Scholar] [CrossRef]
  120. Ware, H.E.; McClure, C.J.W.; Carlisle, J.D.; Barber, J.R.; Daily, G.C. A Phantom Road Experiment Reveals Traffic Noise Is an Invisible Source of Habitat Degradation. Proc. Natl. Acad. Sci. USA 2015, 112, 12105–12109. [Google Scholar] [CrossRef]
  121. Slabbekoorn, H.; Peet, M. Birds Sing at a Higher Pitch in Urban Noise. Nature 2003, 424, 267. [Google Scholar] [CrossRef]
  122. Rosa, P.; Koper, N. Integrating Multiple Disciplines to Understand Effects of Anthropogenic Noise on Animal Communication. Ecosphere 2018, 9, e02127. [Google Scholar] [CrossRef]
  123. Taubmann, J.; Kämmerle, J.-L.; Andrén, H.; Braunisch, V.; Storch, I.; Fiedler, W.; Suchant, R.; Coppes, J. Wind Energy Facilities Affect Resource Selection of Capercaillie Tetrao Urogallus. Wildlife Biol. 2021, 2021, 1–13. [Google Scholar] [CrossRef]
  124. Mooney, A.; Andersson, M.H.; Stanley, J. Acoustic Impacts of Offshore Wind Energy on Fishery Resources. Oceanography 2020, 33, 82–95. [Google Scholar] [CrossRef]
  125. Engås, A.; Løkkeborg, S.; Ona, E.; Soldal, A. V Effects of Seismic Shooting on Local Abundance and Catch Rates of Cod ((Gadus morhua) and Haddock) (Melanogrammus aeglefinus). Can. J. Fish. Aquat. Sci. 1996, 53, 2238–2249. [Google Scholar] [CrossRef]
  126. Slotte, A.; Hansen, K.; Dalen, J.; Ona, E. Acoustic Mapping of Pelagic Fish Distribution and Abundance in Relation to a Seismic Shooting Area off the Norwegian West Coast. Fish. Res. 2004, 67, 143–150. [Google Scholar] [CrossRef]
  127. van Geel, N.C.F.; Benjamins, S.; Marmo, B.; Nabe-Nielsen, J.; Wittich, A.; Risch, D.; Jameson, D.; Todd, V.L.G.; Todd, I.B.; Cox, S.E.; et al. Spatial Impact of Wind Farm Construction on Harbor Porpoise Detectability. In The Effects of Noise on Aquatic Life: Principles and Practical Considerations; Popper, A.N., Sisneros, J., Hawkins, A.D., Thomsen, F., Eds.; Springer International Publishing: Cham, Switzerland, 2023; pp. 1–24. ISBN 978-3-031-10417-6. [Google Scholar]
  128. Peng, Y.; Jarquin Laguna, A.; Tsouvalas, A. A Multi-Physics Approach for Modelling Noise Mitigation Using an Air-Bubble Curtain in Impact Pile Driving. Front. Mar. Sci. 2023, 10, 1134776. [Google Scholar] [CrossRef]
  129. Dähne, M.; Tougaard, J.; Carstensen, J.; Rose, A.; Nabe-Nielsen, J. Bubble Curtains Attenuate Noise from Offshore Wind Farm Construction and Reduce Temporary Habitat Loss for Harbour Porpoises. Mar. Ecol. Prog. Ser. 2017, 580, 221–237. [Google Scholar] [CrossRef]
  130. Nehls, G.; Rose, A.; Diederichs, A.; Bellmann, M.; Pehlke, H. Noise Mitigation During Pile Driving Efficiently Reduces Disturbance of Marine Mammals. In The Effects of Noise on Aquatic Life II; Popper, A.N., Hawkins, A., Eds.; Springer: New York, NY, USA, 2016; pp. 755–762. [Google Scholar]
  131. Popper, A.N.; Hastings, M.C. The Effects of Anthropogenic Sources of Sound on Fishes. J. Fish Biol. 2009, 75, 455–489. [Google Scholar] [CrossRef]
  132. Casper, B.M.; Halvorsen, M.B.; Matthews, F.; Carlson, T.J.; Popper, A.N. Recovery of Barotrauma Injuries Resulting from Exposure to Pile Driving Sound in Two Sizes of Hybrid Striped Bass. PLoS ONE 2013, 8, e73844. [Google Scholar] [CrossRef]
  133. Debusschere, E.; Hostens, K.; Adriaens, D.; Ampe, B.; Botteldooren, D.; De Boeck, G.; De Muynck, A.; Sinha, A.K.; Vandendriessche, S.; Van Hoorebeke, L.; et al. Acoustic Stress Responses in Juvenile Sea Bass Dicentrarchus Labrax Induced by Offshore Pile Driving. Environ. Pollut. 2016, 208, 747–757. [Google Scholar] [CrossRef]
  134. Sigray, P.; Andersson, M.H. Particle Motion Measured at an Operational Wind Turbine in Relation to Hearing Sensitivity in Fish. J. Acoust. Soc. Am. 2011, 130, 200–207. [Google Scholar] [CrossRef]
  135. Tougaard, J.; Hermannsen, L.; Madsen, P.T. How Loud Is the Underwater Noise from Operating Offshore Wind Turbines? J. Acoust. Soc. Am. 2020, 148, 2885–2893. [Google Scholar] [CrossRef]
  136. Hermans, A.; Winter, H.V.; Gill, A.B.; Murk, A.J. Do Electromagnetic Fields from Subsea Power Cables Effect Benthic Elasmobranch Behaviour? A Risk-Based Approach for the Dutch Continental Shelf. Environ. Pollut. 2024, 346, 123570. [Google Scholar] [CrossRef]
  137. Velilla, E.; Collinson, E.; Bellato, L.; Berg, M.P.; Halfwerk, W. Vibrational Noise from Wind Energy-Turbines Negatively Impacts Earthworm Abundance. Oikos 2021, 130, 844–849. [Google Scholar] [CrossRef]
  138. Sowmiya, S. Mitigation of Underwater Vibration Due to Offshore Wind Turbines. Int. J. Eng. Res. Technol. 2018, 6, 6. [Google Scholar]
  139. Moné, C.; Hand, M.; Bolinger, M.; Rand, J.; Heimiller, D.; Ho, J. 2015 Cost of Wind Energy Review; NREL: Oak Ridge, TN, USA, 2017. [Google Scholar]
  140. Majewski, P.; Florin, N.; Jit, J.; Stewart, R.A. End-of-Life Policy Considerations for Wind Turbine Blades. Renew. Sustain. Energy Rev. 2022, 164, 112538. [Google Scholar] [CrossRef]
  141. Delaney, E.L.; Leahy, P.G.; McKinley, J.M.; Gentry, T.R.; Nagle, A.J.; Elberling, J.; Bank, L.C. Sustainability Implications of Current Approaches to End-of-Life of Wind Turbine Blades—A Review. Sustainability 2023, 15, 2557. [Google Scholar] [CrossRef]
  142. Spini, F.; Bettini, P. End-of-Life Wind Turbine Blades: Review on Recycling Strategies. Compos. Part B Eng. 2024, 275, 111290. [Google Scholar] [CrossRef]
  143. Liu, P.; Barlow, C.Y. Wind Turbine Blade Waste in 2050. Waste Manag. 2017, 62, 229–240. [Google Scholar] [CrossRef]
  144. Jensen, J.P.; Skelton, K. Wind Turbine Blade Recycling: Experiences, Challenges and Possibilities in a Circular Economy. Renew. Sustain. Energy Rev. 2018, 97, 165–176. [Google Scholar] [CrossRef]
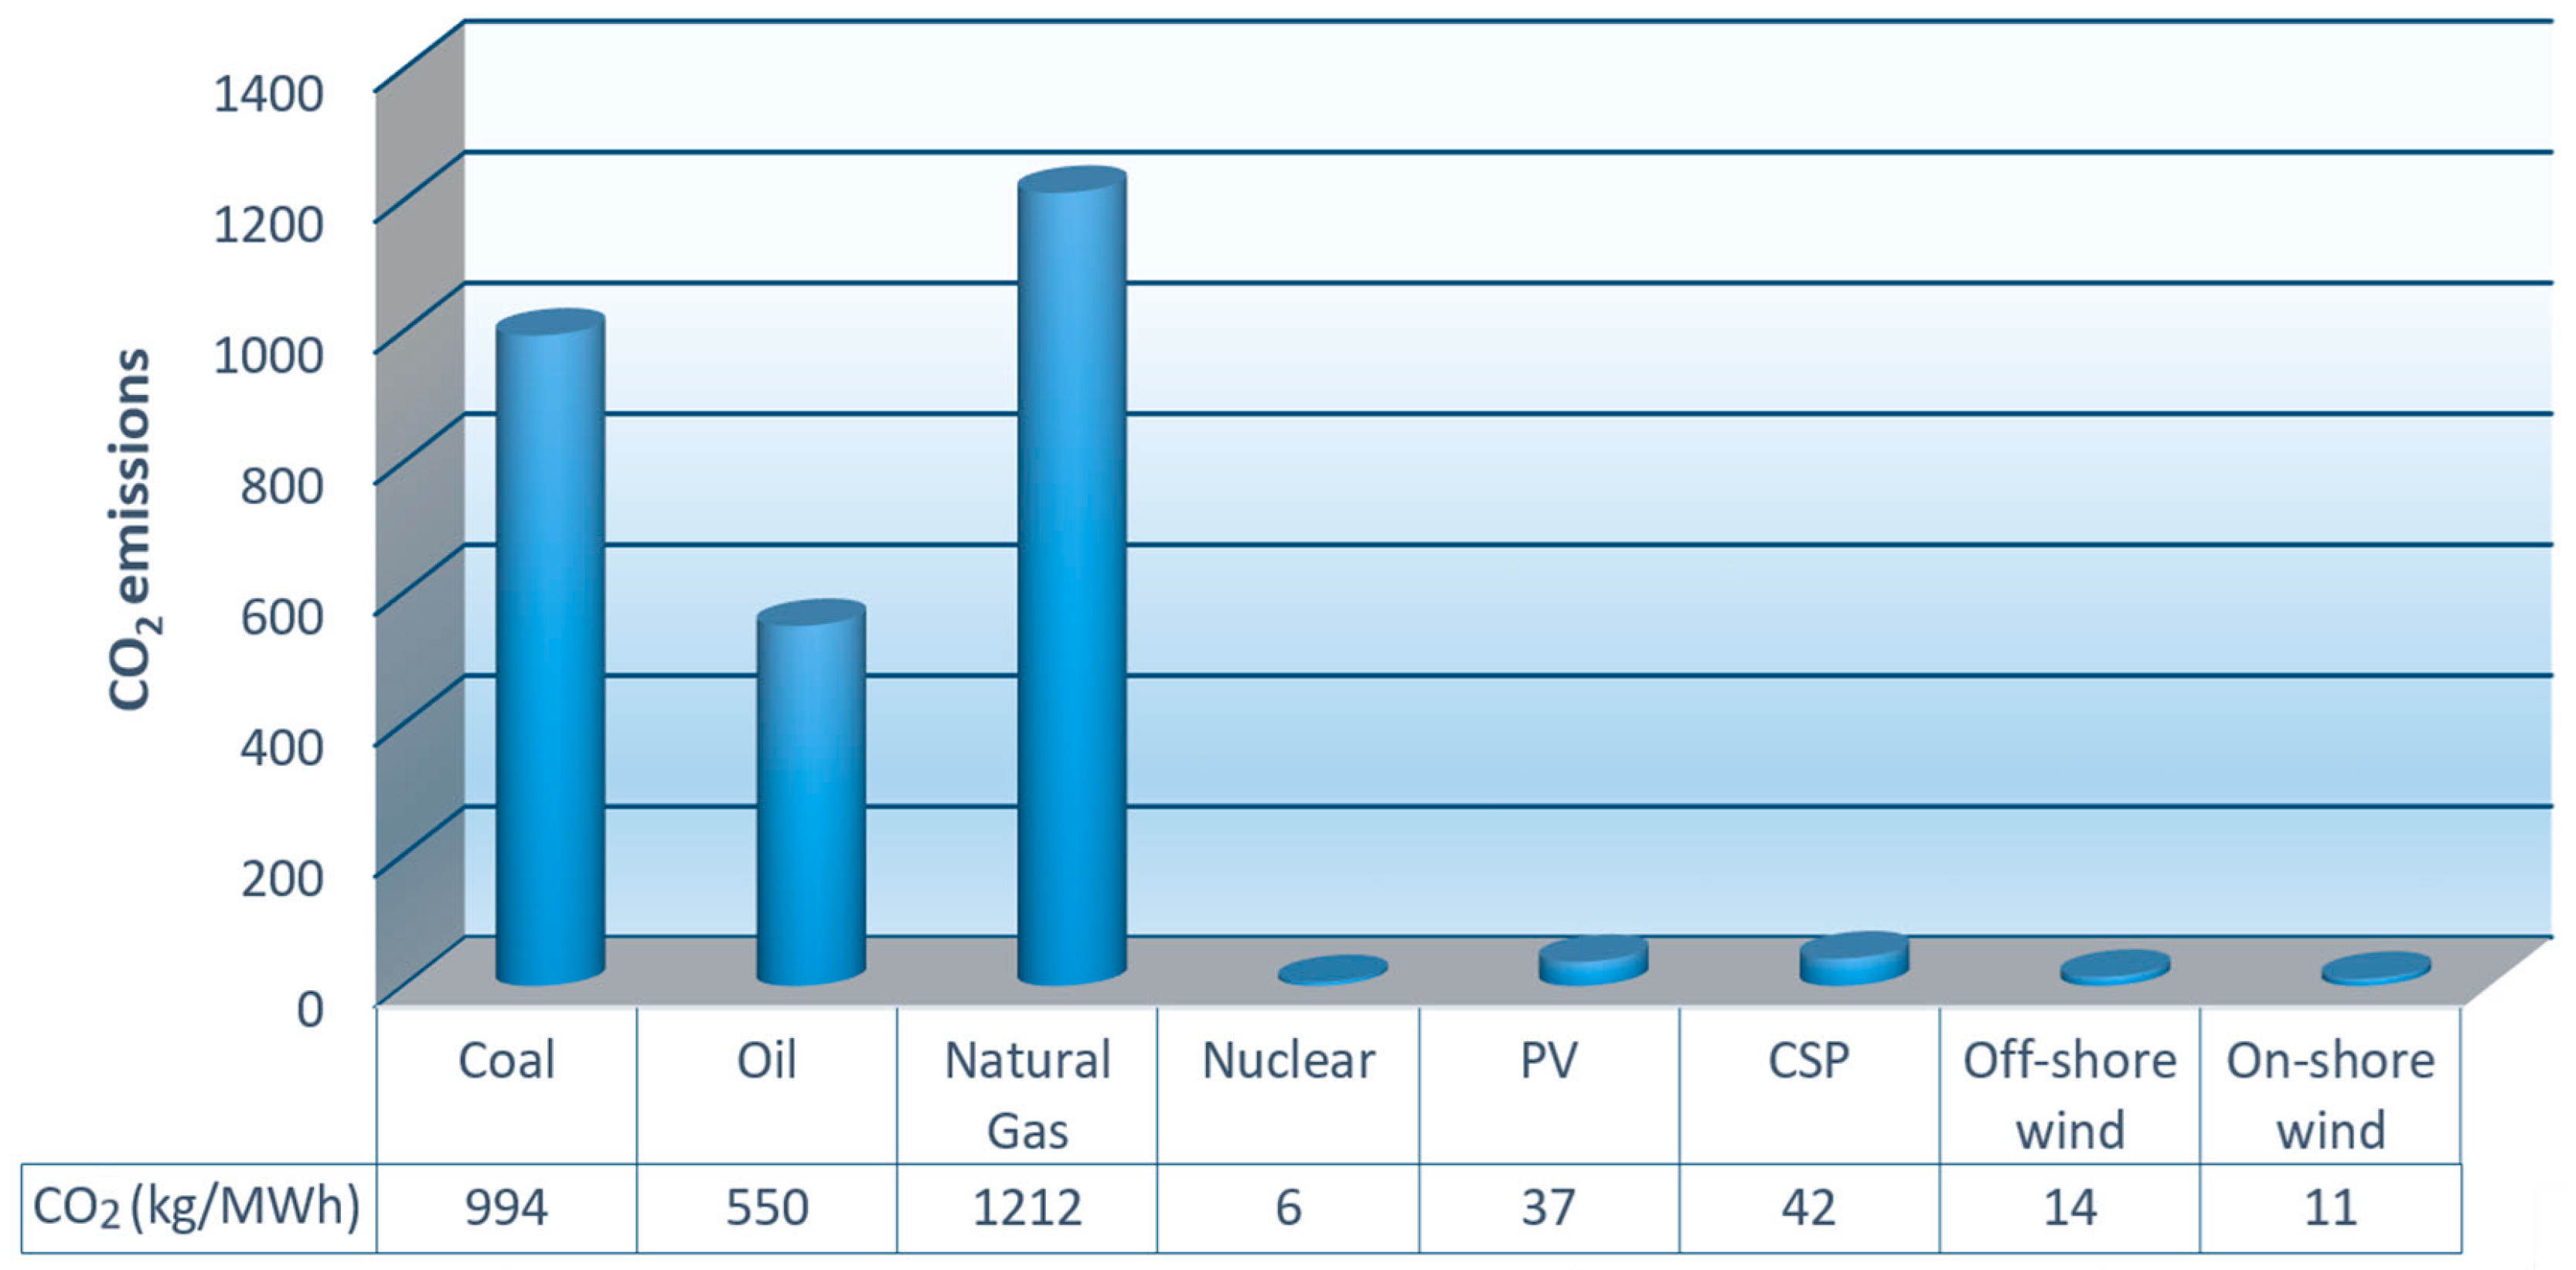
Figure 1. Average emissions of CO2 eq.kg/MWh.
Environments 11 00257 g001
Figure 2. Water footprint for different electricity generation technologies. The red line represents the range and the circle represents the median.
Environments 11 00257 g002
Figure 3. Lifecycle human toxicity potential, non-carcinogenic. The red line represents the range and the circle represents the median.
Environments 11 00257 g003
Figure 4. Lifecycle human toxicity potential, carcinogenic. The red line represents the range and the circle represents the median.
Environments 11 00257 g004
Figure 5. Illustration of the noise level of wind turbines as a function of distance.
Environments 11 00257 g005
Figure 6. Illustration of the flickering shadow effect, with permission of WKC Group.
Environments 11 00257 g006
Figure 7. Share of land used by wind power.
Environments 11 00257 g007
Table 1. Energy consumption and CO2 emissions in the transport of components [28].
Type of TransportEnergy (GJ)CO2 (t)
Transportation via road 200 km2.940.21
Transportation via road 2593 km38.172.71
Sea transport 600 nautical miles1.780.13
Sea transport 13,471 nautical miles39.922.83
Disclaimer/Publisher’s Note: The statements, opinions and data contained in all publications are solely those of the individual author(s) and contributor(s) and not of MDPI and/or the editor(s). MDPI and/or the editor(s) disclaim responsibility for any injury to people or property resulting from any ideas, methods, instructions or products referred to in the content.