
The Impact of War on Heavy Metal Concentrations and the Seasonal Variation of Pollutants in Soils of the Conflict Zone and Adjacent Areas in Mosul City


Abstract
1. Introduction
2. Materials and Methods
2.1. Study Area
- Calcisols: These soils are rich in calcium carbonate and are typically found in arid and semi-arid regions.
- Gypsisols: Characterised by a significant amount of gypsum, these soils are also common in arid areas.
- Vertisols: These are clay-rich soils that expand and contract significantly with moisture changes.
- Fluvisols: Found in floodplains, these soils are influenced by river sediments.
2.2. Measurement Methods
2.3. The Main Use of Heavy Metals in Military Operations
2.4. Assessment of Metal Contamination
2.4.1. Contamination Factor (CF)
2.4.2. Igeo Index
2.4.3. Pollution Load Index (PLI)
3. Results and Discussion
3.1. pH Value
3.2. Electrical Conductivity (E.C.)
3.3. %Salinity
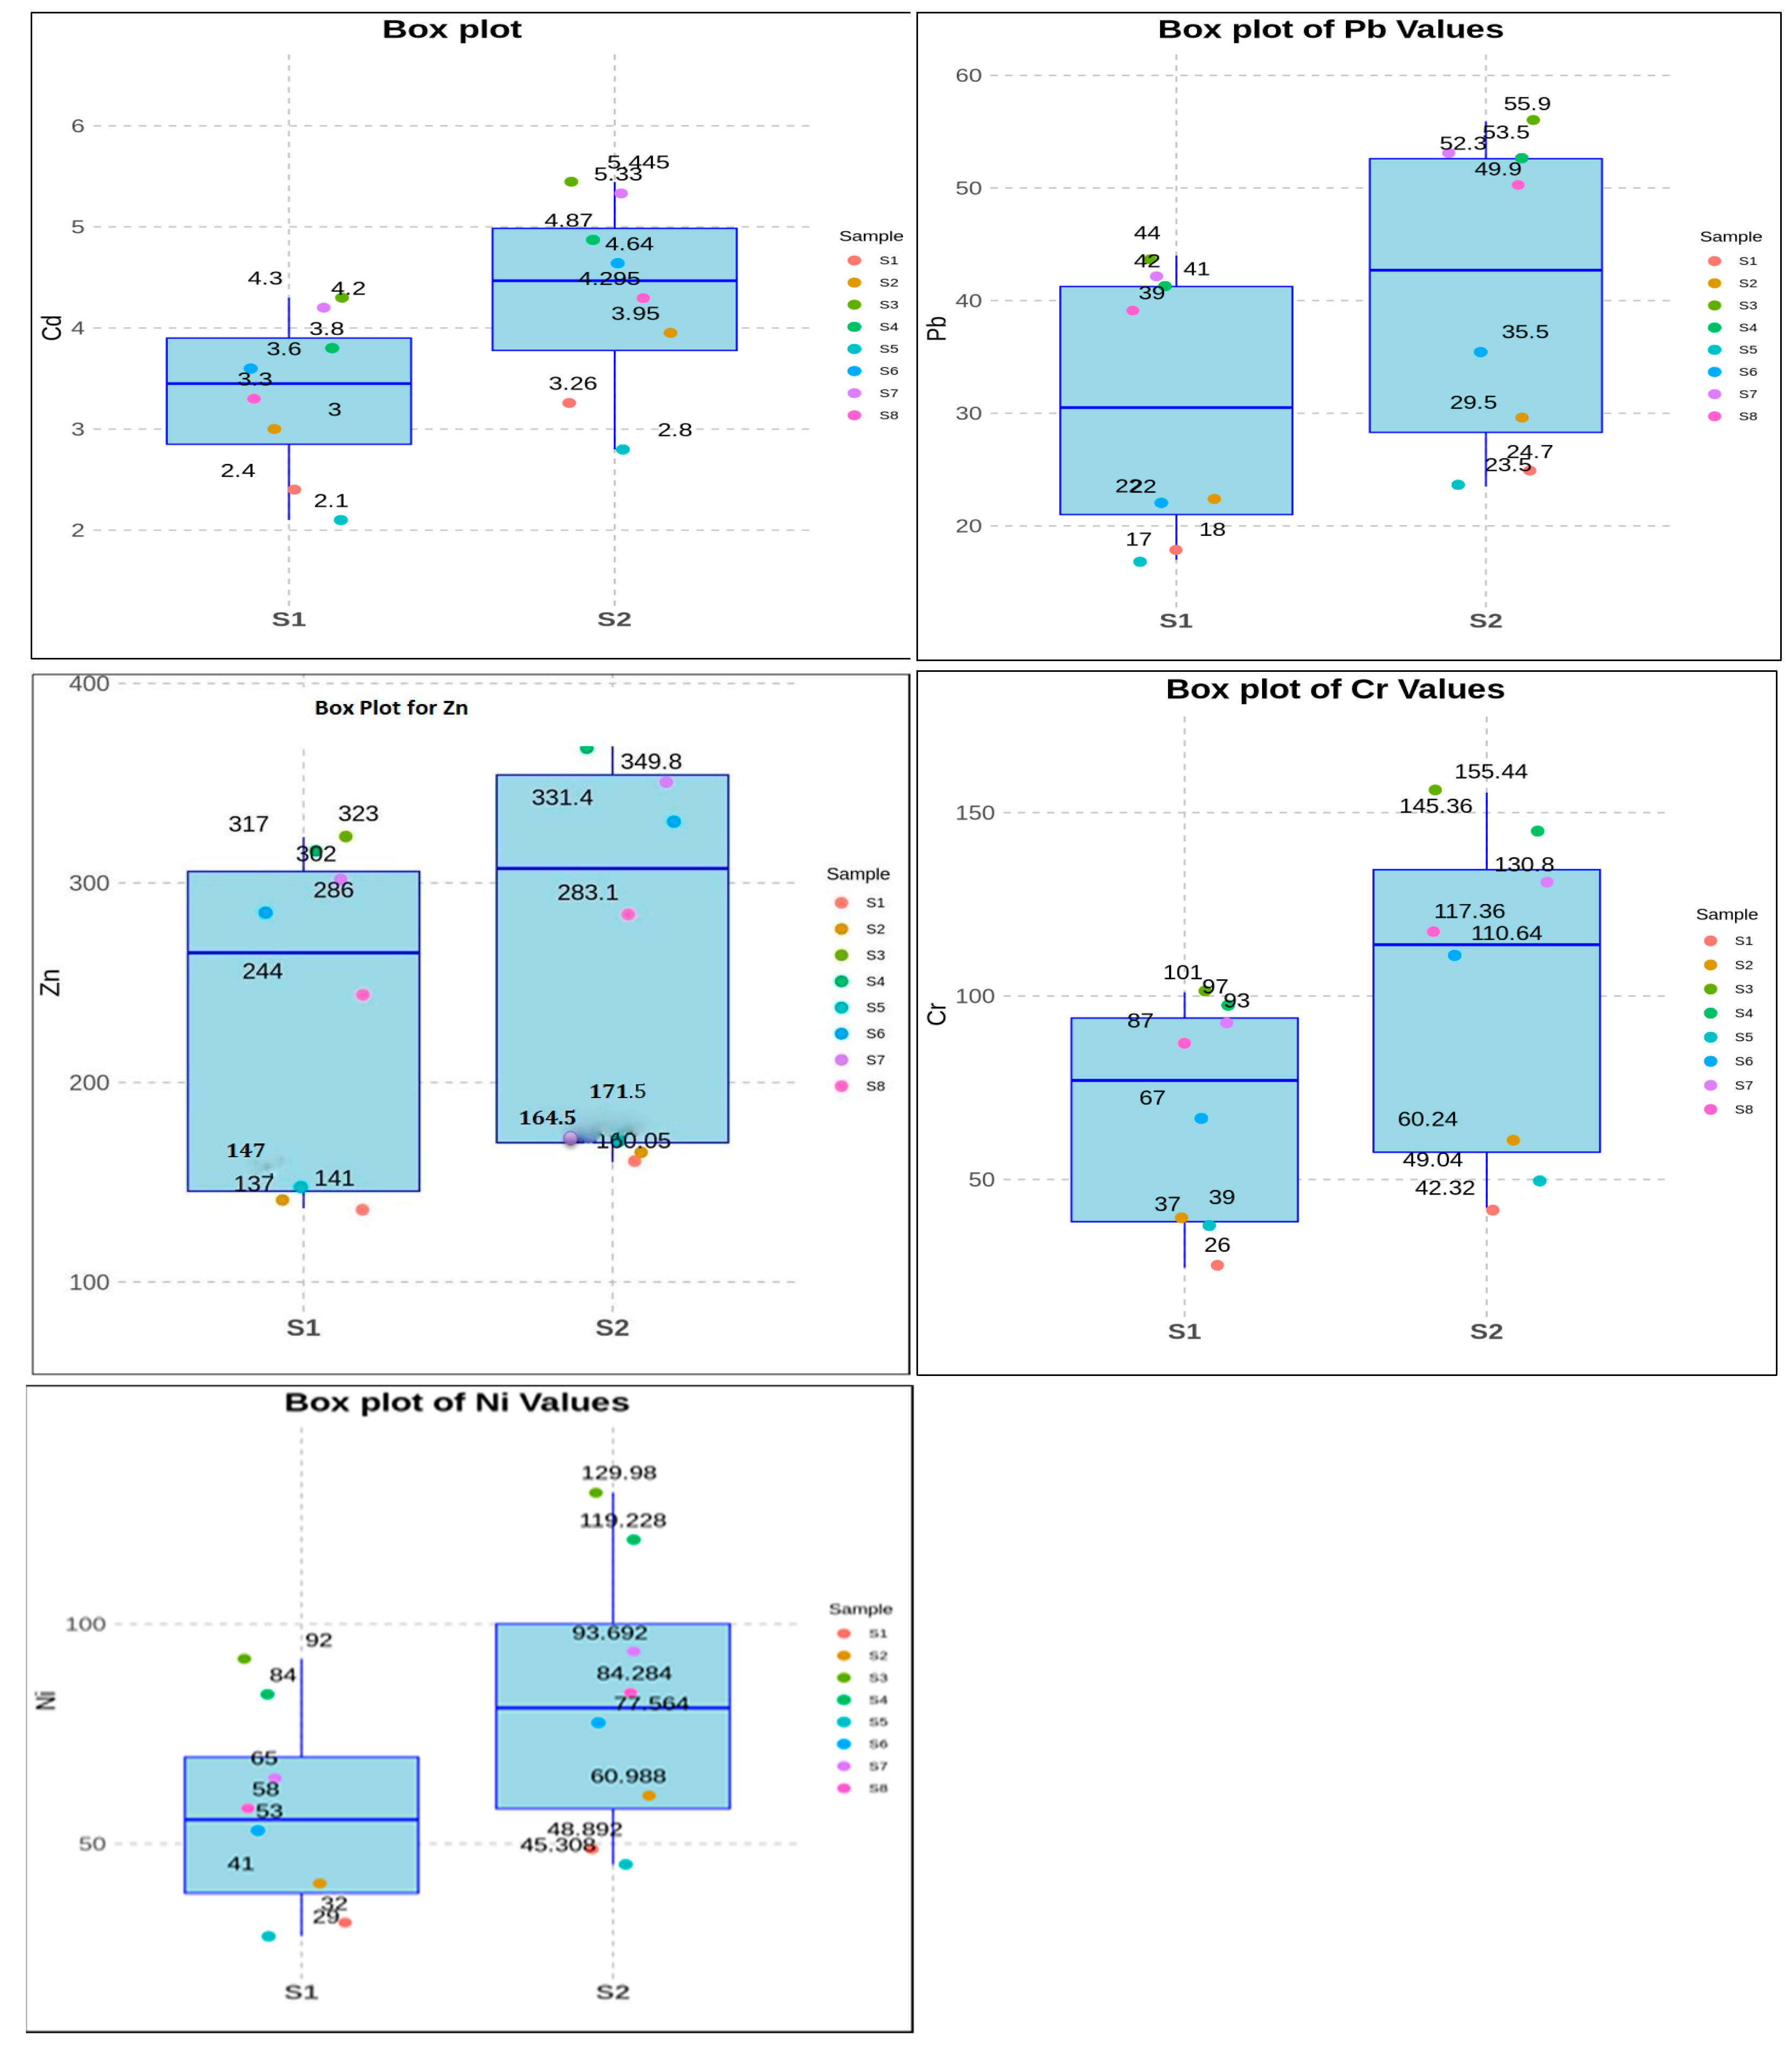
3.4. Heavy Metals
3.5. Statistical Analysis
3.5.1. t-Test
3.5.2. Seasonal Percentage Deviation of Soil Parameters
3.5.3. Pearson’s Correlation Coefficient for Heavy Metals
3.6. Assessment of Heavy Metal Pollution in Soil Samples
3.6.1. Contamination Factor (CF) in Soil Samples
3.6.2. Igeo Factor in Soil Samples
3.6.3. Pollution Load Index (PLI) in Soil Samples
4. Conclusions
Author Contributions
Funding
Data Availability Statement
Acknowledgments
Conflicts of Interest
References
- Adeeb, H.; Jawadi, A.; Salih, D. Evaluation of Engineering Properties of Rocks and Soils of a Part of the Southwestern Area of Mosul City. Iraqi Natl. J. Earth Sci. 2018, 18, 1–14. [Google Scholar] [CrossRef]
- United Nations Environment Programme (UNEP). Environmental Issues in Areas Retaken from ISIL Mosul, Iraq: Rapid Scoping Mission July–August 2017—Technical Note. 2017. Available online: https://wedocs.unep.org/20.500.11822/22434 (accessed on 15 January 2024).
- UNEO&OCHA. A Rapid Overview of Environmental and Health Risks Related to Chemical Hazards in the Mosul Humanitarian Response. 2016, pp. 1–17. Available online: https://reliefweb.int/report/iraq/rapid-overview-environmental-and-health-risks-related-chemical-hazards-mosul (accessed on 18 February 2022).
- United Habitat for Better Urban (UNHU). City Profile of Mosul, Iraq: Multi-Sector Assessment of a City Under Siege. 2016. Available online: https://unhabitat.org/city-profile-of-mosul-iraq-multi-sector-assessment-of-a-city-under-siege (accessed on 1 January 2024).
- Ross, J.; Ronald, J.F.; Peter, V.H. Particle and Gas Emissions from an In Situ Burn of Crude Oil on the Ocean. J. Air Waste Manag. Assoc. 1996, 46, 251–259. Available online: https://www.tandfonline.com/loi/uawm20 (accessed on 23 June 2022).
- Grmasha, R.A.; Stenger-Kovács, C.; Bedewy, B.A.H.; Al-sareji, O.J.; Al-Juboori, R.A.; Meiczinger, M.; Hashim, K.S.I. Ecological and human health risk assessment of polycyclic aromatic hydrocarbons (PAH) in Tigris river near the oil refineries in Iraq. Environ. Res. 2023, 227, 115791. Available online: https://www.sciencedirect.com/science/article/pii/S0013935123005832 (accessed on 18 January 2022). [CrossRef] [PubMed]
- Al-Halfy, A.; Al-Qurnawi, W.S.; Al-Hawash, A.B. Evaluation of Oil Spills in Sandy Soil Of Rumaila Oil Field Area in Basra, Southern Iraq. Marsh Bull. 2021, 16, 47–66. Available online: https://faculty.uobasrah.edu.iq/uploads/publications/1638473182.pdf (accessed on 22 January 2022).
- Alshahri, F. Heavy metal contamination in sand and sediments near to disposal site of reject brine from desalination plant, Arabian Gulf: Assessment of environmental pollution. Environ. Sci. Pollut. Res. 2016, 24, 1821–1831. [Google Scholar] [CrossRef]
- Alengebawy, A.; Abdelkhalek, S.T.; Qureshi, S.R.; Wang, M.Q. Heavy Metals and Pesticides Toxicity in Agricultural Soil and Plants: Ecological Risks and Human Health Implications. Toxics 2021, 9, 42. [Google Scholar] [CrossRef]
- Rai, P.K.; Lee, S.S.; Zhang, M.; Tsang, Y.F.; Kim, K.H. Heavy metals in food crops: Health risks”, fate, mechanisms, and management. Environ. Int. 2019, 125, 365–385. Available online: https://www.sciencedirect.com/science/article/pii/S0160412018327971 (accessed on 6 February 2023). [CrossRef]
- Broomandi, P.; Guney, M.; Kim, J.R.; Karaca, F. Soil Contamination in Areas Impacted by Military Activities: A Critical Review. Sustainability 2020, 12, 9002. [Google Scholar] [CrossRef]
- Gorecki, S.; Nesslany, F.; Hubé, D.; Mullot, J.U.; Vasseur, P.; Marchioni, E.; Camel, V.; Noël, L.; Le Bizec, B.; Guérin, T.; et al. Human health risks related to the consumption of foodstuffs of plant and animal origin produced on a site polluted by chemical munitions of the First World War. Sci. Total Environ. 2017, 599–600, 314–323. [Google Scholar] [CrossRef]
- Pichtel, J. Oil and Gas Production Wastewater: Soil Contamination and Pollution Prevention. Appl. Environ. Soil Sci. 2016, 2016, 1–24. [Google Scholar] [CrossRef]
- Olson, K.R.; Tharp, M. How did the Passaic River, a Superfund site near Newark, New Jersey, become an Agent Orange dioxin TCDD hotspot? J. Soil Water Conserv. 2020, 75, 33A–37A. [Google Scholar] [CrossRef]
- Zama, N.; Kirkman, K.; Mkhize, N.; Tedder, M.; Magadlela, A. Soil Acidification in Nutrient-Enriched Soils Reduces the Growth, Nutrient Concentrations, and Nitrogen-Use Efficiencies of Vachellia sieberiana (DC.) Kyal. & Boatwr Saplings. Plants 2022, 11, 3564. [Google Scholar] [CrossRef] [PubMed]
- Mazen, M.B.; Ahmed, M.M.M.; Nivien, A.N.; Omaima, A.M. The impact of soil contaminated with heavy metals on soil microbial diversity of industrial area near Assiut City, Egypt. Assiut. Univ. J. Bot. 2015, 44, 19–36. [Google Scholar]
- Hamad, R.; Balzter, H.; Kolo, K. Assessment of heavy metal release into the soil after mine clearing in Halgurd-Sakran National Park, Kurdistan, Iraq. Environ. Sci. Pollut. Res. 2019, 26, 1517–1536. [Google Scholar] [CrossRef]
- Saker, A.; Kim, J.-E.; Reza, A.; Islam, T.; Bilal, M.; Rakib, R.J.; Nandi, R.; Rahman, M.M. Heavy Metals Contamination and Associated Health Risks in Food “Environmental Science and Pollution Research Science Learn Organization, What Is Zinc and How Do We Use It?” 2022. Available online: https://www.sciencelearn.org.nz/resources/3195-case-study-zinc (accessed on 12 March 2024).
- Ahmad, M.K.; Islam, S.; Rahman, M.S.; Haque, M.R.; Islam, M.M. Heavy metals in water sediment and some fishes of Buriganga River, Bangladesh. Int. J. Environ. Res. 2010, 4, 321–332. [Google Scholar] [CrossRef]
- Witkowska, D.; Słowik, J.; Chilicka, K. Heavy Metals and Human Health: Possible Exposure Pathways and the Competition for Protein Binding Sites. Molecules 2021, 26, 6060. [Google Scholar] [CrossRef]
- Abdulsattar, J. The State of Some Heavy Metals in the Danfeli Stream Valley (Mosul City) and Its Impact on Soil Pollution Plants and Water. Ph.D. Thesis, College of Environmental Science and Technologie, Doctor of Soil Chemistry and Mineralogy, Mosul University, Mosul, Iraq, 2018; pp. 143–240. [Google Scholar]
- Al Lami, M.H.; Jawad Al Obaidy, A.H.M.; Al Sudani, I.M. Assessment of ecological pollution of heavy metals in surface soils of different sites within northwest of iraq. IOP Conf. Ser. Earth Environ. Sci. 2021, 779, 012063. [Google Scholar] [CrossRef]
- Znad, S.R.; Fadhel, M.N. Environmental Impact Assessment of Soil Pollution in Industrial Zones. Int. J. Environ. Monit. Anal. 2020, 8, 193. [Google Scholar] [CrossRef]
- Mohammed, A.-A.; Riyad, F.; Salim, Z. Assessment of heavy metal pollution of old city zones in mosul city, iraq. Plant Arch. 2020, 20, 7857–7860. Available online: https://www.researchgate.net/publication/353706097 (accessed on 30 September 2023).
- Al-Sheraefy, R.; Hussien, A.K.; Al-Mallah, A.Y. Spatial distribution of heavy metals in the soil of different areas at a left bank in Mosul City, Iraq: Part 2. Iraqi Natl. J. Earth Sci. 2023, 23, 132–153. [Google Scholar] [CrossRef]
- Aswad, O.A.K.; Zaki, H.F.; Ati, E.M.; Ajmi, R.N. Bio concentration Factor Of Mercury Element In Mosul City, Northern Of Iraq. Syst. Rev. Pharamacy 2021, 12, 285–288. [Google Scholar]
- Fernández-Martínez, R.; Rucandio, I. Total mercury, organic mercury and mercury fractionation in soil profiles from the Almadén mercury mine area. Environ. Sci. Process. Impacts 2014, 16, 333–340. [Google Scholar] [CrossRef] [PubMed]
- Yu, H.; Li, J.; Luan, Y. Meta-analysis of soil mercury accumulation by vegetables. Sci. Rep. 2018, 8, 1261. [Google Scholar] [CrossRef] [PubMed]
- World Reference Base for Soil Resources (WRB). International Soil Classification System for Naming Soils and Creating Legends for Soil Maps, 4th ed.; International Union of Soil Sciences (IUSS): Vienna, Austria, 2022. [Google Scholar]
- Al-Taie, E.; Al-Ansari, N.; Knutsson, S. Estimation of Settlement under Shallow Foundation for Different Regions in Iraq Using SAFE Software. Engineering 2015, 7, 379–386. [Google Scholar] [CrossRef]
- Gupta, P.K. Soil, Plant, Water and Fertilizer Analysis, 2nd ed.; Agrobios: Jodhpur, India, 2009; pp. 33–45. [Google Scholar]
- American Public Health Association, American Water Works Association, Water Environment Federation (APHA-AWWA-WEF). Standard Methods for The Examination of Water and Wastewater, 21st ed.; APHA-AWWA-WEF Press: Washington, DC, USA, 2005; ISBN 9780875530475. [Google Scholar]
- Haswell, S.J. Atomic Absorption: Principles, Techniques, and Applications; Ellis Horwood Limited: Chichester, West Sussex, UK, 1991; Volume 5 of Analytical Spectroscopy Library. [Google Scholar]
- Martin, J.; Meybeck, M. Elemental Mass-Balance of Material Carried by Major World Rivers. Mar. Chem. 1979, 7, 178–206. [Google Scholar] [CrossRef]
- Mueller, G. Index of Geoaccumulation in Sediments of the Rhine River. GeoJournal 1969, 2, 108–118. Available online: https://www.scirp.org/(S(351jmbntvnsjt1aadkposzje))/reference/ReferencesPapers.aspx?ReferenceID=1803049 (accessed on 1 January 2024).
- Tomlinson, D.L.; Wilson, J.G.; Harris, C.R.; Jeffrey, D.W. Problems in the assessment of heavy-metal levels in estuaries and the formation of a pollution index. Helgoländer Meeresunters. 1980, 33, 566–575. [Google Scholar] [CrossRef]
- Al-Mashhadany, M.H.S. Study the Environmental Status for Khosar River Water and the Application of Some Mathematical Models. Ph.D. Thesis, College of Education for Pure Science, University of Mosul, Mosul, Iraq, 2019. [Google Scholar]
- Li, K.W.; Lu, H.L.; Nkoh, J.N.; Hong, Z.N.; Xu, R.K. Aluminum mobilization as influenced by soil organic matter during soil and mineral acidification: A constant pH study. Geoderma 2022, 418, 115853. [Google Scholar] [CrossRef]
- Król, A.; Mizerna, K.; Bożym, M. An assessment of pH-dependent release and mobility of heavy metals from metallurgical slag. J. Hazard. Mater. 2020, 384, 121502. [Google Scholar] [CrossRef]
- Roe, M.; Johnson, B. Influence of pH on Heavy Metal Leaching. Soil Sci. Rev. 2019, 32, 567–580. [Google Scholar]
- Altahaan, Z.; Dobslaw, D. Assessment of the Impact of War on Concentrations of Pollutants and Heavy Metals and Their Seasonal Variations in Water and Sediments of the Tigris River in Mosul/Iraq. Environments 2024, 11, 22. [Google Scholar] [CrossRef]
- Altahaan, Z.; Dobslaw, D. Assessment of post-war groundwater quality in urban areas of Mosul city /Iraq and surrounding areas for drinking and irrigation purposes by using the Canadian Environment Water Quality Index CCME-WQI and Heavy Metal Pollution Index HPI. World J. Adv. Res. Rev. 2024, 21, 2461–2481. [Google Scholar] [CrossRef]
- Kunkel, R.; Voigt, H.J.; Wendland, F.; Hannappel, S. Die Natürliche, Ubiquitär überprägte Grundwasserbeschaffenheit in Deutschland; Series Environment; Schriften des Forschungszentrums Jülich: Jülich, Germany, 2004; Volume 47, ISBN 3-89336-353-X. [Google Scholar]
- Barbosa, F.S.; Zandonadi, R.S. Low cost aparatus for aparent soil electrical conductivity measurement based on direct currente. Nativa 2017, 5, 37–41. [Google Scholar] [CrossRef]
- Benjankar, R.; Kafle, R. Salt Concentration Measurement Using Reusable Electric Conductivity–based Sensors. Water Air Soil Pollut. 2021, 232, 16. [Google Scholar] [CrossRef]
- Koelle, W. Wasseranalysen—Richtig Beurteilen: Grundlagen, Parameter, Wassertypen, Inhaltsstoffe, 3rd ed.; Wiley-VCH: Weinheim, Germany, 2010; ISBN 978-3-527-32522-1. [Google Scholar]
- US Department of Agriculture (USDA)—Natural Resources Conservation Service. Soil Quality Indicators. 2011. Available online: https://www.nrcs.usda.gov/conservation-basics/natural-resource-concerns/soils/soil-health/soil-health-assessment?form=MG0AV3 (accessed on 23 September 2022).
- Fadhel, I.E.I.; Idrus, S.Z.B.S.; Abdullah, M.S.Y.; Ibrahim, A.A.E.A.; Omar, M.; Khred, A. A New Perspective of Web-Based Systems Quality Engineering Measure by Using Software Engineering Theory (ISO 25010): An Initial Study. J. Phys. Conf. Ser. 2020, 1529, 022004. [Google Scholar] [CrossRef]
- Xue, R.; Shen, Y.; Marschner, P. Soil water content during and after plant growth influence nutrient availability and microbial biomass. J. Soil Sci. Plant Nutr. 2017, 17, 702–715. [Google Scholar] [CrossRef]
- Verma, T.S.; Neue, H.U. Effect of soil salinity level and zinc application on growth, yield, and nutrient composition of rice. Plant Soil 1984, 82, 3–14. [Google Scholar] [CrossRef]
- Kiel, M.; Dobslaw, D.; Engesser, K.H. Comparison of biological and chemical treatment processes as cost-effective methods for elimination of benzoate in saline wastewaters. Water Res. 2014, 66, 1–11. [Google Scholar] [CrossRef]
- Al-Juraisy, B. The Effects of Some Physical and Chemical Factors on Apparent Resistivity of Surface Soil in the University of Mosul, Mosul City, Northern Iraq. Iraqi J. Sci. 2021, 62, 3973–3983. [Google Scholar] [CrossRef]
- Khamidov, M.; Ishchanov, J.; Hamidov, A.; Donmez, C.; Djumaboev, K. Assessment of Soil Salinity Changes under the Climate Change in the Khorezm Region, Uzbekistan. 2022. Available online: https://www.ncbi.nlm.nih.gov/pmc/articles/PMC9321814/ (accessed on 1 January 2024).
- Muhaimeed, A.S.; Saloom, A.J.; Saliem, K.A.; Alani, K.A.; Muklef, W.M. Classification and Distribution of Iraqi Soils. Int. J. Agric. Innov. Res. 2014, 2, 997–1002. [Google Scholar]
- Mouni, L.; Merabet, D.; Robert, D.; Bouzaza, A. Batch studies for the investigation of the sorption of the heavy metals Pb and Zn on to Amizour soil (Algeria). Geoderma 2009, 154, 30. Available online: https://www.academia.edu/18967377/ (accessed on 1 January 2024). [CrossRef]
- Odat, S.; Ahmed, M.A. Seasonal Variations of Soil Heavy Metal Contaminants along Urban Roads: A Case Study from the City of Hail, Saudi Arabia. Jordan J. Civ. Eng. 2011, 5, 581–591. [Google Scholar]
- Oluyemi, E.; Feuyit, G.; Oyekunle, J.A.O.; Ogunfowokan, A.O. Seasonal variations in heavy metal concentrations in soil and some selected crops at a landfill in Nigeria. Afr. J. Environ. Sci. Technol. 2008, 2, 89–96. Available online: https://www.ajol.info/index.php/ajest/article/view/135469 (accessed on 22 October 2022).
- Rathje Jackson, M.L. Soil chemical analysis. Verlag: Prentice Hall, Inc., Englewood Cliffs, NJ. 1958, 498 S. DM 39.40. Z. Für Pflanzenernährung Düngung Bodenkd. 1959, 85, 251–252. [Google Scholar] [CrossRef]
- Sharma, R.; Singh, N.S.; Singh, D.K. Impact of heavy metal contamination and seasonal variations on enzyme’s activity of Yamuna river soil in Delhi and NCR. Appl. Water Sci. 2020, 10, 83. [Google Scholar] [CrossRef]
- Agency for Toxic Substances and Disease Registery. Toxicological Profile for Zinc. 2021. Available online: https://www.atsdr.cdc.gov/ToxProfiles/tp60-c6.pdf (accessed on 1 January 2024).
- Heredia, B.; Tapia, R.; Young, B.J.; Hasuoka, P.; Pacheco, P.; Roqueiro, G. Phytoextraction of Cu, Cd, Zn and As in four shrubs and trees growing on soil contaminated with mining waste. Chemosphere 2022, 308, 136146. [Google Scholar] [CrossRef]
- Lindsay, W.L. Chemical Equilibrium in Soils; John Wiley and Sons: New York, NY, USA, 2014; Available online: https://www.scirp.org/(S(351jmbntvnsjt1aadkposzje))/reference/ReferencesPapers.aspx?ReferenceID=1188214 (accessed on 1 January 2024).
- Cohen, J. Statistical Power Analysis for the Behavioral Sciences, 2nd ed.; Hillsdale, N.J.L., Ed.; Erlbaum Associates: New York, NY, USA, 1988; ISBN 9780203771587. [Google Scholar]


| Site No. | Location | Latitude N | Longitude E | Site Description | Soil Description | Soil Types | No. of Samples |
|---|---|---|---|---|---|---|---|
| S1 | Alrashidia | 36.40005 | 43.103287 | Residential Area | Clayey and sandy soil with some organic matter and minerals such as quartz and feldspar. | Calcisols, Vertisols Fluvisols | 48 |
| S2 | Mosul Forest | 36.383410 | 43.117947 | Recreation Area | 48 | ||
| S3 | Old city | 36.34022 | 43.128143 | Commer + Resi Area | Mixture of clay and sand, with a higher percentage of organic matter with intensive mixing by explosions. | Calcisols, Vertisols Gypsisols | 48 |
| S4 | AL-Faysalia | 36.34651 | 43.142455 | Residential Area | Fluvisols | 48 | |
| S5 | Alyarmuk flats | 36.321480 | 43.076216 | Residential Area | Mixture of clay and sand, with a higher percentage of organic matter. Contains minerals such as illite and kaolin. | Calcisols, Vertisols Gypsisols | 48 |
| S6 | Al-Karama Ind. | 36.34201 | 43.205897 | Industrial Area | Fluvisols | 48 | |
| S7 | Al-Danadan | 36.32333 | 43.161559 | Residential Area | Heavy clay, with a high percentage of organic matter. Mixing by explosions. Contains minerals such as vermiculite and micas. | Calcisols, Vertisols Fluvisols | 48 |
| S8 | Al Busaf | 36.27324 | 43.163325 | Agricultural Area | 48 |
| Contamination Factor | Contamination Level (CF) |
|---|---|
| CF < 1 | Low |
| 1 ≤ CF < 3 | Moderate |
| 3 ≤ CF < 6 | Considerable |
| CF > 6 | Very high |
| Igeo Value | Class | Sediment Quality |
|---|---|---|
| ≤0 | 0 | Unpolluted |
| 0–1 | 1 | Moderate to low polluted |
| 1–2 | 2 | Moderately polluted |
| 2–3 | 3 | Moderately to strongly polluted |
| 3–4 | 4 | Strongly polluted |
| 4–5 | 5 | Strongly to extremely polluted |
| 5–6 | 6 | Extremely polluted |
| PLI | Class | Sediment Quality |
|---|---|---|
| <1 | 0 | Unpolluted |
| 1–2 | 2 | Moderately polluted |
| 2–3 | 3 | Heavily polluted |
| >3 | 4 | Extremely polluted |
| Series 1 | pH | E.C. mS/cm | Salinity% | Cd ppm | Pb ppm | Zn ppm | Cr ppm | Ni ppm | |
|---|---|---|---|---|---|---|---|---|---|
| WHO Std. limits | 6.5−9.0 | 0.5–2 | 3% | 0.06 | 10 | 50 | 100 | 40 | |
| World surface rock average | - | - | - | 0.2 | 16 | 127 | 71 | 49 | |
| S1 | Mean | 7.2 | 0.5 | 0.9 | 2.4 | 18.0 | 137.0 | 31.0 | 32.0 |
| ±Sd | 0.2 | 0.1 | 0.6 | 0.8 | 6.1 | 46.6 | 12.2 | 11.8 | |
| S2 | Mean | 7.3 | 0.7 | 1.2 | 3.0 | 22.0 | 141.0 | 47.0 | 41.0 |
| ±Sd | 0.2 | 0.1 | 0.6 | 1.0 | 7.5 | 47.9 | 17.7 | 14.8 | |
| S3 | Mean | 7.6 | 1.7 | 2.7 | 4.3 | 42.0 | 323.0 | 101.0 | 92.0 |
| ±Sd | 0.1 | 0.1 | 0.5 | 1.5 | 15.0 | 109.8 | 46.6 | 32.3 | |
| S4 | Mean | 7.3 | 1.1 | 2.2 | 4.2 | 37.0 | 317.0 | 97.0 | 84.0 |
| ±Sd | 0.2 | 0.1 | 0.8 | 1.3 | 13.9 | 107.8 | 43.5 | 29.6 | |
| S5 | Mean | 7.3 | 1.1 | 2.1 | 2.1 | 17.0 | 147.0 | 37.0 | 32.0 |
| ±Sd | 0.1 | 0.1 | 0.2 | 0.7 | 5.8 | 50.0 | 14.3 | 10.9 | |
| S6 | Mean | 7.6 | 1.0 | 0.4 | 3.6 | 22.0 | 244.0 | 92.0 | 53.0 |
| ±Sd | 0.4 | 0.1 | 0.4 | 1.2 | 9.2 | 97.2 | 33.0 | 19.0 | |
| S7 | Mean | 7.0 | 1.2 | 2.6 | 3.9 | 42.0 | 302.0 | 93.0 | 65.0 |
| ±Sd | 0.4 | 0.1 | 0.3 | 1.4 | 14.3 | 102.7 | 35.0 | 20.7 | |
| S8 | Mean | 7.7 | 0.9 | 1.6 | 3.3 | 33.0 | 287.0 | 98.0 | 58.0 |
| ±Sd | 0.4 | 0.1 | 0.1 | 1.1 | 13.3 | 83.0 | 39.1 | 23.1 | |
| Series 2 | pH | E.c mS/cm | Salinity% | Cd ppm | Pb ppm, | Zn ppm | Cr ppm | Ni ppm | |
|---|---|---|---|---|---|---|---|---|---|
| WHO std. limits | 6.5–9 | 0.5–2 | 3% | 0.06 | 10 | 50 | 100 | 40 | |
| World surface rock | - | - | - | 0.2 | 16 | 127 | 71 | 49 | |
| S1 | Mean | 7.34 | 0.60 | 1.73 | 3.26 | 24.7 | 157.6 | 42.3 | 48.9 |
| ±Sd | 0.14 | 0.08 | 0.40 | 0.50 | 3.9 | 28.4 | 7.3 | 8.4 | |
| S2 | Mean | 7.70 | 0.75 | 1.87 | 3.95 | 29.5 | 162.2 | 60.2 | 61.0 |
| ±Sd | 0.20 | 0.05 | 0.21 | 0.62 | 4.8 | 29.2 | 10.5 | 10.6 | |
| S3 | Mean | 6.97 | 2.07 | 2.80 | 5.45 | 55.9 | 371.5 | 155.4 | 130.0 |
| ±Sd | 0.17 | 0.06 | 0.32 | 0.89 | 9.5 | 66.9 | 27.6 | 23.0 | |
| S4 | Mean | 7.05 | 1.22 | 2.33 | 4.87 | 52.3 | 364.6 | 145.4 | 119.2 |
| ±Sd | 0.20 | 0.03 | 0.25 | 0.79 | 8.9 | 65.6 | 25.8 | 21.1 | |
| S5 | Mean | 7.15 | 1.17 | 2.33 | 2.80 | 23.5 | 169.1 | 49.0 | 45.3 |
| ±Sd | 0.29 | 0.10 | 0.56 | 0.41 | 3.7 | 30.4 | 8.5 | 7.7 | |
| S6 | Mean | 7.26 | 1.24 | 2.80 | 4.64 | 35.5 | 328.9 | 110.6 | 77.6 |
| ±Sd | 0.31 | 0.07 | 0.56 | 0.75 | 5.8 | 59.2 | 19.6 | 13.6 | |
| S7 | Mean | 7.03 | 1.50 | 2.53 | 5.33 | 53.5 | 347.3 | 130.8 | 93.7 |
| ±Sd | 0.30 | 0.03 | 0.62 | 0.87 | 9.1 | 62.5 | 23.2 | 16.5 | |
| S8 | Mean | 8.00 | 1.03 | 2.82 | 4.30 | 49.9 | 280.6 | 117.4 | 84.3 |
| ±Sd | 0.16 | 0.08 | 0.55 | 0.68 | 8.4 | 50.5 | 20.8 | 14.8 | |
| 2022 | pH | E.C. mS/cm | Salinity% | Cd ppm | Pb ppm | Zn ppm | Cr ppm | Ni ppm | |
|---|---|---|---|---|---|---|---|---|---|
| WHO limits | 6.5−9.0 | 0.5–2.0 | 3% | 0.06 | 10 | 50 | 100 | 40 | |
| World surface rock | - | - | - | 0.2 | 16 | 127 | 71 | 49 | |
| S1 | Mean | 7.29 | 0.90 | 1.31 | 2.83 | 21.4 | 148.5 | 34.2 | 40.5 |
| Max | 7.50 | 0.64 | 2.10 | 3.26 | 25.5 | 185.9 | 48.2 | 55.0 | |
| Min | 7.00 | 0.46 | 0.20 | 1.58 | 11.9 | 90.4 | 23.8 | 22.9 | |
| S2 | Mean | 7.52 | 0.92 | 1.55 | 3.48 | 25.8 | 152.8 | 49.6 | 51.0 |
| Max | 7.90 | 0.77 | 2.10 | 4.07 | 31.2 | 191.3 | 69.7 | 69.3 | |
| Min | 7.20 | 0.49 | 0.50 | 1.98 | 14.5 | 93.1 | 34.3 | 28.8 | |
| S3 | Mean | 7.50 | 1.42 | 2.63 | 4.87 | 50.0 | 348.5 | 128.2 | 111.0 |
| Max | 8.20 | 2.30 | 4.00 | 5.84 | 62.3 | 438.3 | 183.6 | 150.7 | |
| Min | 6.86 | 1.55 | 1.38 | 2.84 | 29.0 | 213.2 | 90.4 | 62.7 | |
| S4 | Mean | 7.20 | 1.25 | 2.55 | 4.34 | 46.7 | 342.0 | 121.2 | 101.6 |
| Max | 7.45 | 1.99 | 3.40 | 5.16 | 58.1 | 430.2 | 171.5 | 138.0 | |
| Min | 6.93 | 0.88 | 1.90 | 2.51 | 27.1 | 209.2 | 84.5 | 57.4 | |
| S5 | Mean | 7.24 | 1.45 | 2.35 | 2.45 | 20.3 | 159.3 | 43.0 | 41.2 |
| Max | 7.50 | 2.03 | 3.60 | 2.81 | 24.1 | 52.0 | 56.3 | 51.7 | |
| Min | 6.93 | 1.04 | 1.99 | 1.39 | 11.2 | 31.2 | 27.7 | 28.1 | |
| S6 | Mean | 7.41 | 1.09 | 2.10 | 4.12 | 28.8 | 308.7 | 88.8 | 65.3 |
| Max | 7.89 | 1.09 | 3.40 | 4.89 | 38.2 | 388.1 | 130.0 | 88.8 | |
| Min | 6.98 | 0.79 | 0.90 | 2.38 | 17.8 | 188.8 | 64.0 | 37.0 | |
| S7 | Mean | 6.96 | 1.63 | 2.08 | 4.77 | 47.8 | 325.9 | 111.9 | 79.4 |
| Max | 7.40 | 2.07 | 3.30 | 5.63 | 56.3 | 404.7 | 154.1 | 107.8 | |
| Min | 6.67 | 1.15 | 1.38 | 2.77 | 27.7 | 199.3 | 75.9 | 44.9 | |
| S8 | Mean | 7.41 | 1.93 | 2.18 | 3.80 | 44.5 | 263.6 | 102.2 | 71.1 |
| Max | 8.12 | 0.89 | 2.90 | 4.48 | 55.2 | 331.1 | 138.0 | 82.0 | |
| Min | 6.99 | 0.67 | 1.80 | 2.18 | 25.7 | 161.0 | 68.0 | 40.3 |
| Heavy Metal | t-Test | DF | p * | Status ** |
|---|---|---|---|---|
| pH | −0.27 | 14 | 0.395 | 0 |
| EC | −1.72 | 14 | 0.024 | 1 |
| %Sal. | −1.39 | 14 | 0.023 | 1 |
| Cd | −2.25 | 14 | 0.020 | 1 |
| Pb | −1.87 | 14 | 0.041 | 1 |
| Zn | −0.86 | 14 | 0.203 | 0 |
| Cr | −1.76 | 14 | 0.045 | 1 |
| Ni | −1.89 | 14 | 0.040 | 1 |
| Sites | EC% | %Sal | Cd% | Pb% | Zn% | Cr% | Ni% |
|---|---|---|---|---|---|---|---|
| S1 | 13.6 | 96.2 | 35.8 | 37.2 | 16.8 | 38.6 | 34.5 |
| S2 | 6.8 | 51.4 | 31.7 | 34.1 | 16.8 | 35.3 | 32.8 |
| S3 | 24.9 | 68.7 | 26.6 | 27 | 15.8 | 35 | 29.2 |
| S4 | 12.3 | 12.9 | 28.2 | 27.6 | 15.8 | 33.3 | 29.5 |
| S5 | 2.9 | 23.7 | 33.3 | 38.2 | 16.7 | 24.6 | 36 |
| S6 | 18.7 | 55.7 | 28.9 | 61.4 | 15.9 | 39.4 | 31.7 |
| S7 | 8.0 | 29.6 | 26.9 | 27.4 | 15.8 | 28.9 | 30.6 |
| S8 | 16.0 | 72.7 | 30.2 | 27.9 | 16 | 25.9 | 31.2 |
| Pearson Correlation | |||||
|---|---|---|---|---|---|
| Cd | Pb | Zn | Cr | Ni | |
| Cd | 1 | ||||
| Pb | 0.8806662 | 1 | |||
| Zn | 0.9174506 | 0.8665371 | 1 | ||
| Cr | 0.9198652 | 0.95539986 | 0.96654252 | 1 | |
| Ni | 0.8952122 | 0.91603492 | 0.90773979 | 0.95010035 | 1 |
| CF | Cd | Pb | Zn | Cr | Ni |
|---|---|---|---|---|---|
| S1 | 14.2 | 1.33 | 1.16 | 0.5 | 0.8 |
| S2 | 17.4 | 1.6 | 1.2 | 0.7 | 1.0 |
| S3 | 24.4 | 3.12 | 2.74 | 1.8 | 2.3 |
| S4 | 21.7 | 2.9 | 2.7 | 1.7 | 2.1 |
| S5 | 12.3 | 1.3 | 1.3 | 0.6 | 0.8 |
| S6 | 20.6 | 1.8 | 2.4 | 1.3 | 1.3 |
| S7 | 23.8 | 3.0 | 2.6 | 1.6 | 1.6 |
| S8 | 19.0 | 2.8 | 2.1 | 1.4 | 1.5 |
| Igeo | Cd | Pb | Zn | Cr | Ni |
|---|---|---|---|---|---|
| S1 | 3.24 | −0.17 | −0.36 | −1.64 | −0.86 |
| S2 | 3.53 | 0.10 | −0.32 | −1.10 | −0.53 |
| S3 | 4.02 | 1.06 | 0.87 | 0.27 | 0.59 |
| S4 | 3.85 | 0.96 | 0.84 | 0.19 | 0.47 |
| S5 | 3.03 | −0.25 | −0.26 | −1.31 | −0.98 |
| S6 | 3.78 | 0.26 | 0.70 | −0.26 | −0.17 |
| S7 | 3.99 | 0.99 | 0.77 | 0.07 | 0.11 |
| S8 | 3.66 | 0.89 | 0.47 | −0.06 | −0.05 |
| Sites | PLI | Classification |
|---|---|---|
| S1 | 1.54 | Moderately |
| S2 | 1.90 | Moderately |
| S3 | 3.86 | Extremely |
| S4 | 3.60 | Extremely |
| S5 | 1.55 | Moderately |
| S6 | 2.72 | Heavily |
| S7 | 3.42 | Extremely |
| S8 | 2.96 | Heavily |
Disclaimer/Publisher’s Note: The statements, opinions and data contained in all publications are solely those of the individual author(s) and contributor(s) and not of MDPI and/or the editor(s). MDPI and/or the editor(s) disclaim responsibility for any injury to people or property resulting from any ideas, methods, instructions or products referred to in the content. |
© 2024 by the authors. Licensee MDPI, Basel, Switzerland. This article is an open access article distributed under the terms and conditions of the Creative Commons Attribution (CC BY) license (https://creativecommons.org/licenses/by/4.0/).
Share and Cite
Altahaan, Z.; Dobslaw, D. The Impact of War on Heavy Metal Concentrations and the Seasonal Variation of Pollutants in Soils of the Conflict Zone and Adjacent Areas in Mosul City. Environments 2024, 11, 247. https://doi.org/10.3390/environments11110247
Altahaan Z, Dobslaw D. The Impact of War on Heavy Metal Concentrations and the Seasonal Variation of Pollutants in Soils of the Conflict Zone and Adjacent Areas in Mosul City. Environments. 2024; 11(11):247. https://doi.org/10.3390/environments11110247
Chicago/Turabian StyleAltahaan, Zena, and Daniel Dobslaw. 2024. "The Impact of War on Heavy Metal Concentrations and the Seasonal Variation of Pollutants in Soils of the Conflict Zone and Adjacent Areas in Mosul City" Environments 11, no. 11: 247. https://doi.org/10.3390/environments11110247
APA StyleAltahaan, Z., & Dobslaw, D. (2024). The Impact of War on Heavy Metal Concentrations and the Seasonal Variation of Pollutants in Soils of the Conflict Zone and Adjacent Areas in Mosul City. Environments, 11(11), 247. https://doi.org/10.3390/environments11110247