Article

Non-Conventional Data for Farming-Related Air Pollution: Contributions to Modelling and Risk Assessment in the Lombardy Region, Italy

1
Department of Civil and Environmental Engineering, Politecnico di Milano, Piazza Leonardo da Vinci 32, 20133 Milano, Italy
2
Department of Electronics, Information and Bioengineering, Politecnico di Milano, Piazza Leonardo da Vinci 32, 20133 Milano, Italy
3
Department of Science and High Technology, University of Insubria, Via Valleggio 11, 22100 Como, Italy
4
Department of Medical and Surgical Sciences, University of Bologna, Via Palagi 9, 40138 Bologna, Italy
*
Author to whom correspondence should be addressed.
Environments 2024, 11(11), 229; https://doi.org/10.3390/environments11110229
Submission received: 25 September 2024 / Revised: 16 October 2024 / Accepted: 17 October 2024 / Published: 22 October 2024

Abstract

:
Air pollution is one of the most critical global health concerns today. While emissions from industrial activities and combustion processes are the primary threats to air quality, intensive farming activities also contribute significantly, especially through ammonia emissions that promote the formation of secondary pollutants, such as particulate matter. Advancements in air quality research have been achieved by enhancements in emissions characterisation, modelling techniques, and sensor technology, expanding the availability of air pollution data beyond traditional ground sensor observations, which are often lacking in rural agricultural areas. Accordingly, this paper demonstrates the advantages of integrating traditional and non-conventional data to investigate farming-related air pollution through a case study in the Lombardy Region, Northern Italy. The study incorporates an array of data sources, including ground sensors and atmospheric composition model estimates. The concurrent utilisation of these diverse datasets is explored through machine learning modelling, focusing on assessing the influence of agricultural activities on particulate matter distribution patterns. Finally, the reliability of non-conventional air pollution data for health risk assessment applications is also investigated. The paper critically discusses the main findings based on empirical results, highlighting the significance of integrating multiple data sources to complement traditional air quality monitoring while outlining the main limitations in terms of the accuracy and usability of such non-conventional data.

1. Introduction

More than 90% of the global population is exposed to air that does not comply with the World Health Organization (WHO) Air Quality Guidelines [1]. Air pollution is considered as the biggest environmental risk to health worldwide and represents a pressing sustainability concern, directly connected to many United Nations Sustainable Development Goals (e.g., 3.9 and 11.6) [2,3,4]. The increase in the concentration of widely diffused air pollutants, such as particulate matter (PM), ozone (O3), nitrogen dioxide (NO2), and sulfur dioxide (SO2) are associated with the growth in hospital admissions and cardiovascular diseases and, in general, air quality deterioration has increased the number of deaths worldwide, even at low levels of exposure [5]. Accordingly, it has been estimated that ambient (outdoor) air pollution alone is responsible for around 3 million deaths each year [6]. Further than direct health risks, air pollution adversely affects the environment, resulting in acid rain and associated land and water pollution, and contributes to climate change [7].
Both air pollutants and greenhouse gases have increased their presence in the lower atmosphere over the last century due to the intensification of human activities such as energy production, industrial processes, and transportation [8]. Although most of the anthropogenic emissions are due to combustion processes, a relevant quota must be attributed to intensive farming [9]. This sector is marginally responsible for the emission of primary pollutants while its contribution to secondary pollutants emission has critically emerged in the scientific debate only during the last two decades [10]. Relevant primary pollutants from intensive farming include nitrogen emissions, such as nitrogen oxides (NOX) and ammonia (NH3), originating directly from animal housing, harvesting practices, and crop residue burning. Based on current estimates, agriculture and intensive farming are responsible for over 80% of total global NH3 emissions [11]. NH3 alone has direct impacts on human health only at very high concentrations [12], which is an unlikely case under typical ambient concentrations and due to the generally low (a day or less) NH3 residence time in the atmosphere [13]. Nonetheless, atmospheric NH3 together with other gaseous emissions, including SO2 and NOX, are responsible for the generation of secondary aerosol particles. By means of reactions with acid gases and water present in the atmosphere, they contribute to the formation of ammonium salts, which make up about 20% to 80% of atmospheric coarse and fine PM [7,14,15]. In rural agricultural areas, the mass percentages of ammonium salts in atmospheric fine PM are generally higher than in urban contexts, thus indicating farming is one of the main responsible for local PM emissions [16,17]. Nevertheless, a non-negligible source of PM in rural areas may also be represented by the transfer of PM and precursor gases from large anthropogenic sources, such as thermal power plants or industries [18].
Notably, inhalation of the fine fraction of PM with diameters of 2.5 µm or smaller (PM2.5) is associated with severe negative impacts on human health directly related to serious symptoms of respiratory tract diseases, undermined lung function, and raised morbidity and mortality of cardiopulmonary diseases [19]. Unlike other farming-related gaseous emissions, PM resides in the atmosphere for several days to a week [20] thus enhancing exposure risk for the population. Accordingly, the World Bank estimated that 4.1 million people worldwide died prematurely in 2016 from exposure to ambient PM2.5 [21] pinpointing this pollutant as one of the major and widespread environmental risks to human health. Emission reduction policies, particularly for NH3, have been implemented since the 1990s in various regions globally. Despite efforts, NH3 emissions continue to rise, posing a challenge to air quality improvement [22]. The regulatory landscape for NH3 is fragmented, leading to a lack of measurements in many regions. Recent advancements in air quality research include improved sensor technologies and low-cost sensors, which are being used for local monitoring [23]. However, challenges regarding data accuracy and reliability persist [24]. Additional methods like atmospheric composition (AC) models and satellite remote sensing have gained attention, providing valuable information for air quality management. Global coverage satellite and AC model estimates, available as open data, are considered crucial for monitoring farming-related emissions and addressing data gaps in areas with limited ground-level measurements [25].
To that end, this paper outlines the available air quality modelling data systems and services that could be utilised to model farming-related air pollution. Applications of such data sources to farming-related air pollution modelling are presented in the context of the Data-driven moDelling of particUlate with Satellite Technology aid (D-DUST) project, funded by Fondazione Cariplo [26].
The remainder of this paper is structured as follows. Section 2 provides an overview of the context of the D-DUST project and the methods used in this study. Section 3 comprises a chronology and current status of non-conventional data to support farming-related air pollution analyses, together with data preparation procedures developed and exploited in the D-DUST project. Section 4 presents applications of D-DUST data procedures to PM2.5 concentration modelling. Section 5 proposes a quality investigation for NO2, NH3 and PM2.5 CAMS estimates for application into risk assessment. Conclusions and outlook are finally reported and discussed in Section 6.

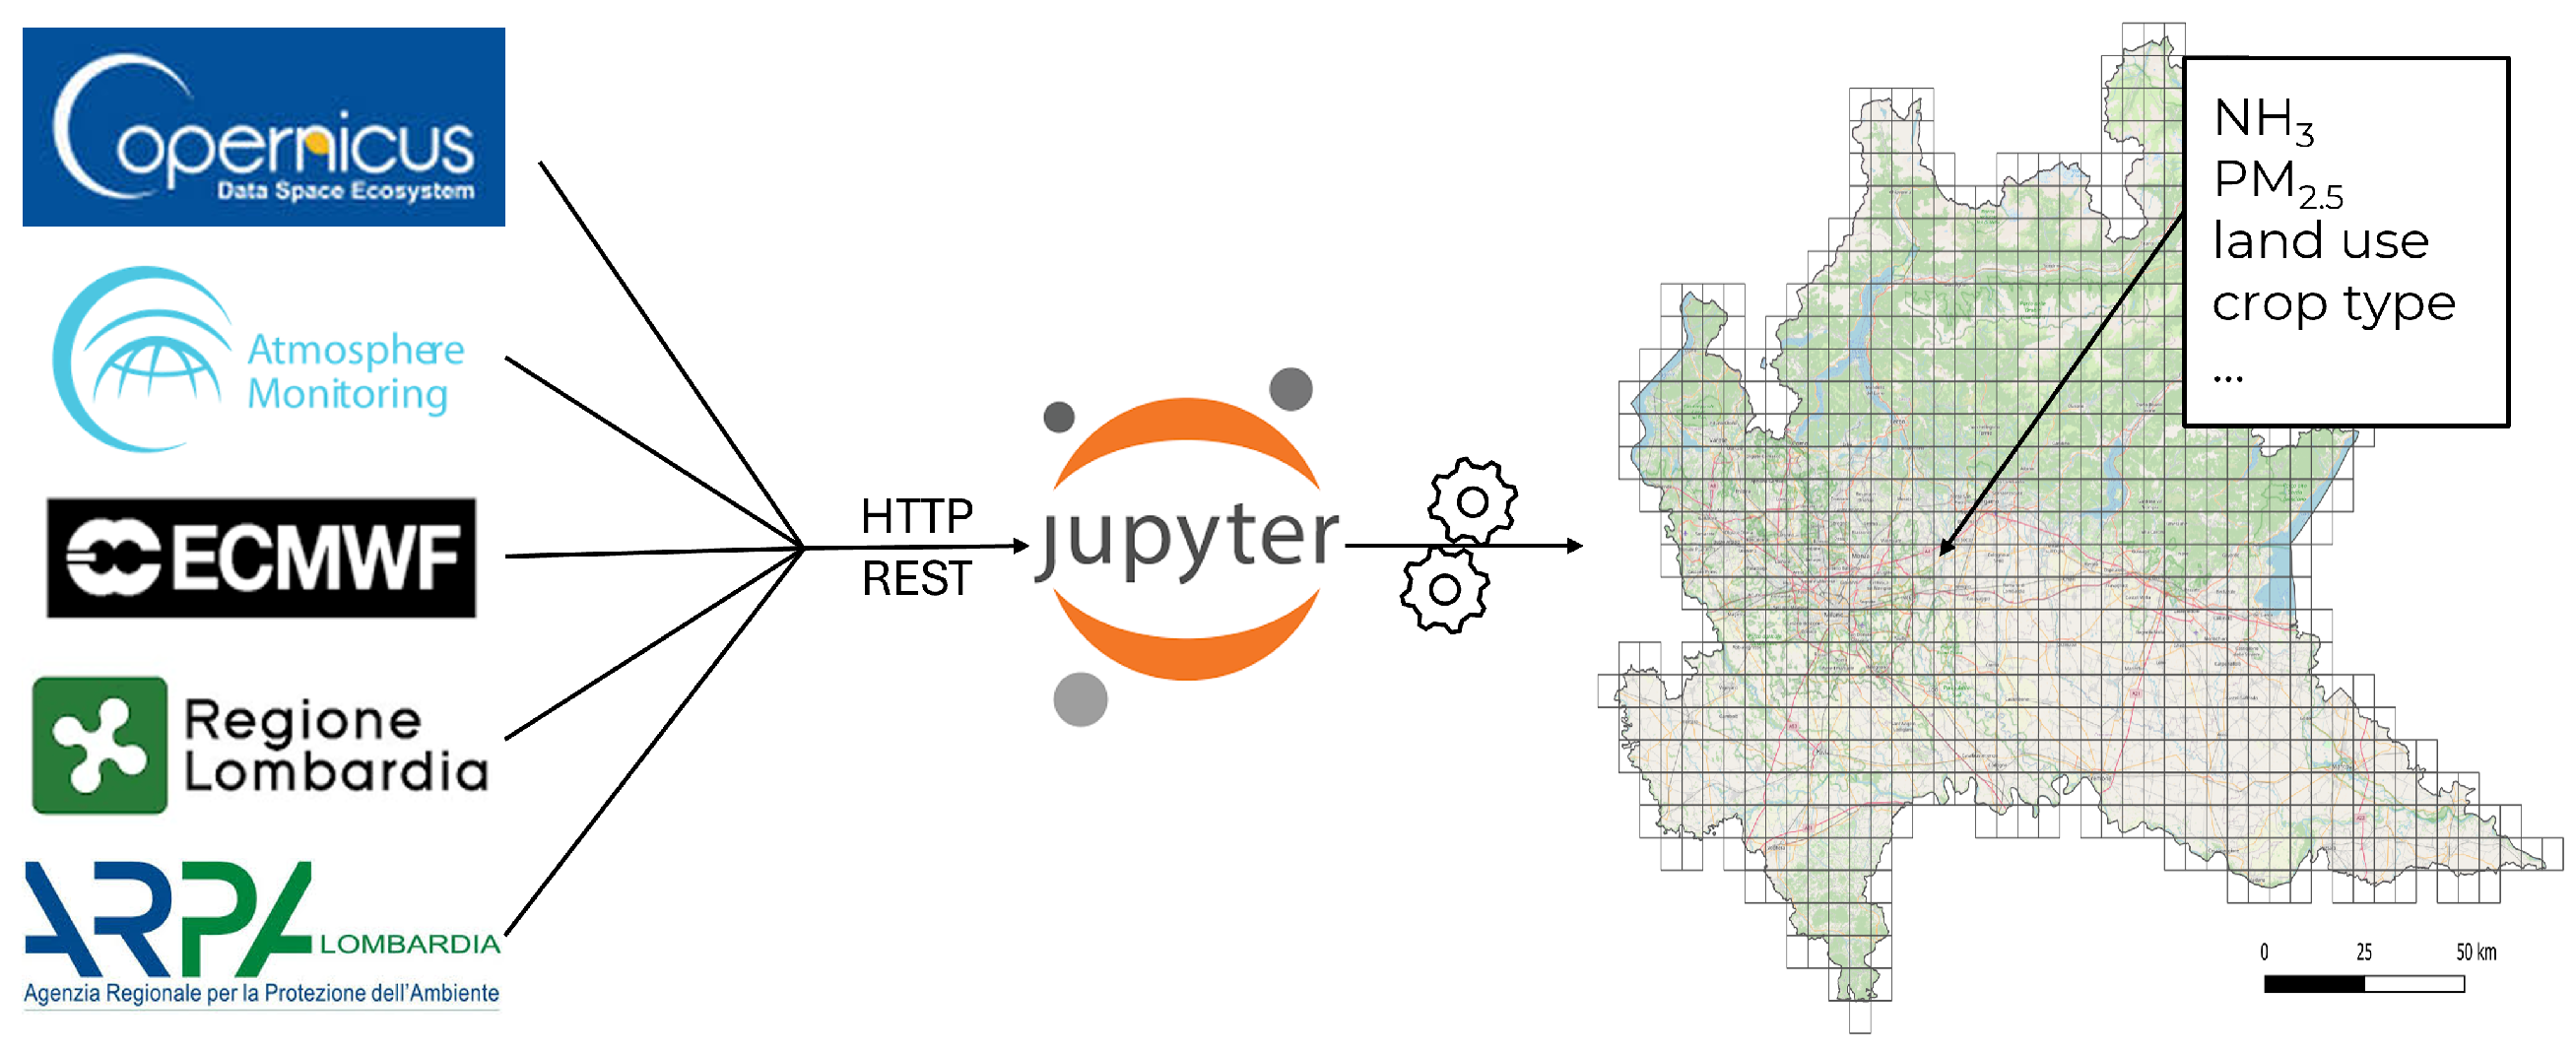
2. Materials and Methods

The D-DUST project investigated the contribution derived from the integration of non-conventional air pollution data into traditional monitoring frameworks based on ground sensors. As a testbed, the project considered agricultural areas of the Lombardy Region (Northern Italy), the most populated Italian region with the highest national agricultural production (Figure 1). Air quality in Lombardy is a primary concern due to its high urbanisation/industrialisation, as well as to its geomorphological conditions (Po River valley) which inhibit the dispersion of air pollutants [27]. Regarding pollutant emissions, data from the regional emission inventory (Inventario Emissioni Aria—INEMAR) [28] indicate that in 2021, SO2 emissions in Lombardy amounted to 8840 tons, with 39% attributed to industrial combustion. NOX emissions were reported at 94,822 tons, with 45% originating from road transport. NH3 emissions reached 92,883 tons, with agriculture contributing 95%. The INEMAR inventory also details emissions of O3, which amounted to 376,816 tons, of which 21% resulted from solvent use and 19% from road transport. CO emissions were measured at 170,083 tons, primarily from non-industrial combustion (34%) and road transport (32%). For dust emissions, PM2.5 in Lombardy amounted to 12,404 tons, with 52% originating from non-industrial combustion, while PM10 emissions amounted to 14,842 tons, with 45% deriving from non-industrial combustion.
The provision of PM2.5 and NH3 observations is used as a discriminant for selecting the AC model systems of interest for the D-DUST project. Attention is paid specifically to open data platforms which provide standardised and programmable means of accessing data, near-real-time data availability, extensive historical archives, and continuous observations spanning global to regional scales. Specifically, only AC model data from the Copernicus Atmosphere Monitoring Service (CAMS), implemented by the European Centre for Medium-Range Weather Forecasts (ECMWF) within the European Copernicus Programme [29], are considered in this study.
Modelling tests focused on the use of correlation analyses and Geographically Enhanced Artificial Intelligence (GEOAI) techniques to explore relationships and impacts of farming activities on the spatial distribution of PM2.5 concentrations obtained from the CAMS. In parallel, the reliability and accuracy of AC model data were evaluated against authoritative air quality observations to determine their actual usability in health risk assessment. Specifically for the D-DUST case study, the CAMS model estimates of NO2, NH3 and PM2.5 were compared to co-located observations from the Lombardy Region Environmental Protection Agency (ARPA) sensors network [30]. The ultimate goal of this work is to provide insight into the capabilities of the considered non-conventional data sources in functioning as building blocks of operative farming-related air pollution modelling and risk assessment at the regional to local scale. To that end, the main contribution of the D-DUST project consisted of developing replicable and programmatic procedures for conventional and non-conventional air pollution data preparation and integration with ancillary meteorological and territorial data that can support the analysis of farming-related air pollution.

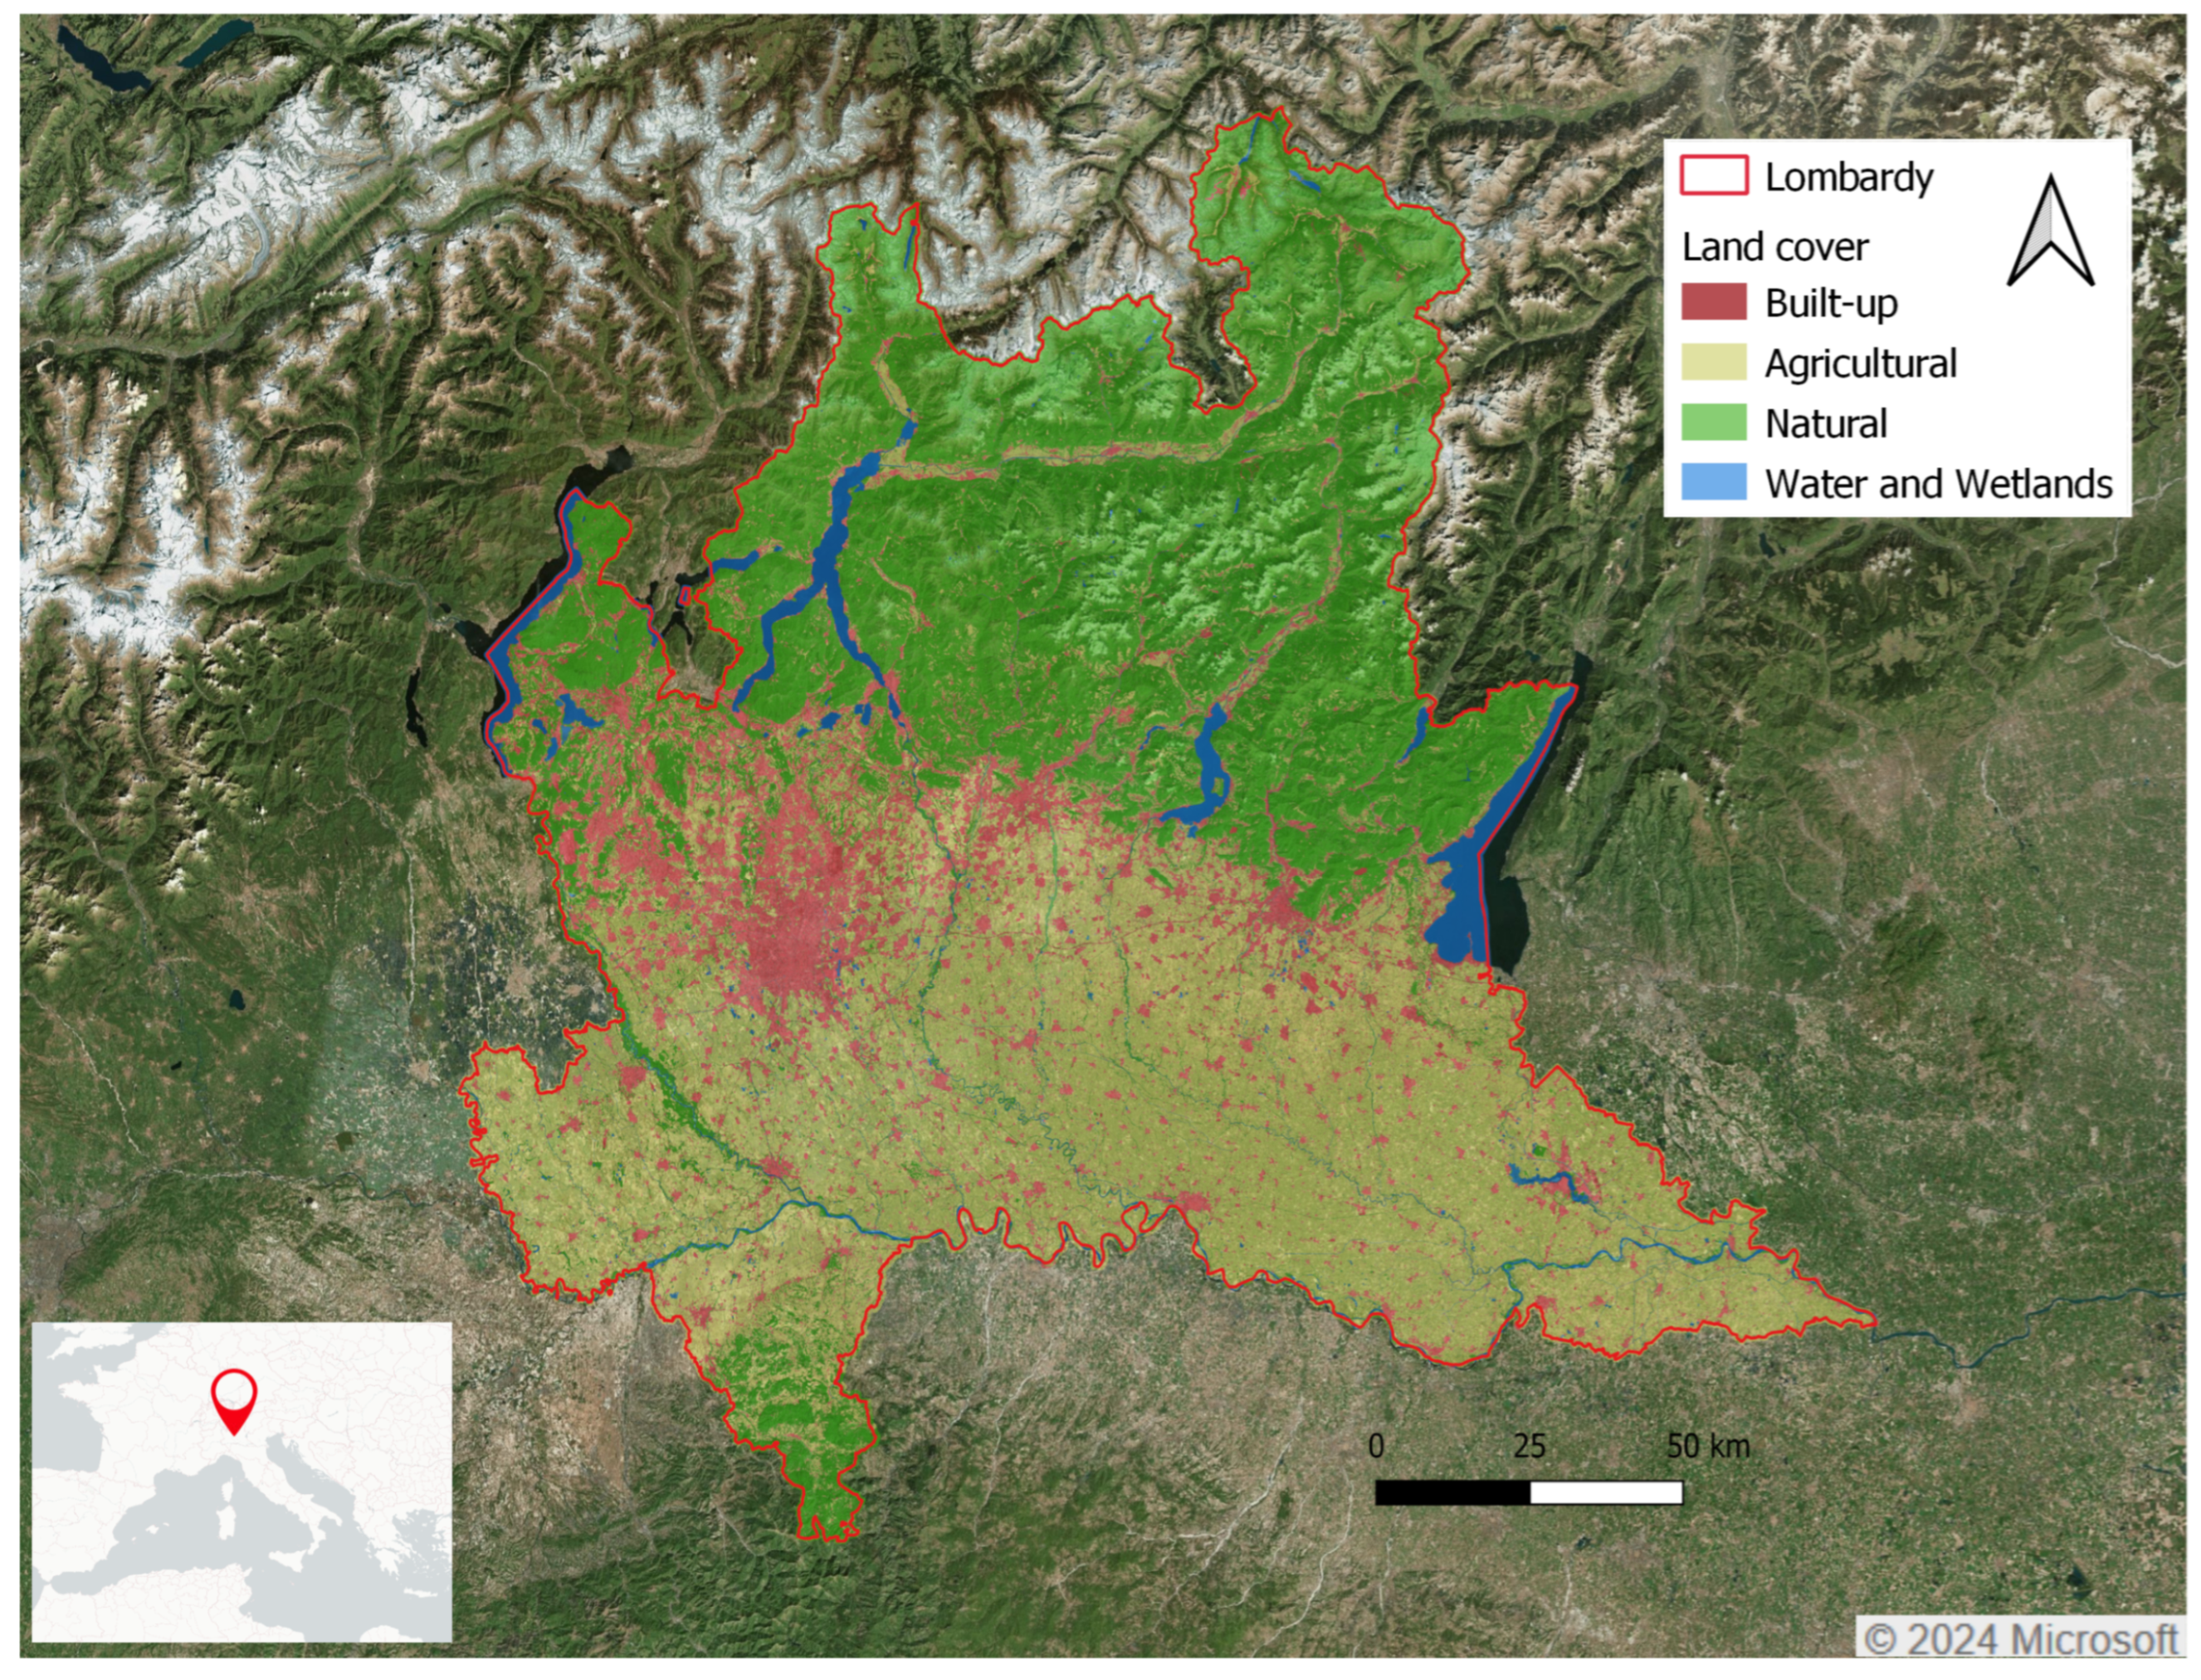
3. Non-Conventional Data for Farming-Related Air Pollution

Emissions reduction policies have been enforced starting from the 1990s mainly in Europe, North America, and Japan, followed in the last decade by mainland East Asia, driving down global trends for primary air pollutants [4,25]. Reduction in NH3 emission is considered one of the most effective and viable strategies to contrast PM2.5 pollution [17,22,31]. Nevertheless, global NH3 emissions continued to rise, posing the risk of attenuating the positive effects of such policies [32]. International regulations for NH3 emissions have been deployed starting from the 1999 Gothenburg Protocol [33]. However, this has not resulted in adopting significant NH3 emissions regulation worldwide but only in a short list of countries including the USA, Canada, the European Union, Australia, New Zealand, and Japan [34,35]. Additionally, the WHO Air Quality Guidelines [1], one of the primary references for local air quality policymaking worldwide, do not specify limits specific for NH3 emissions like for other pollutants such as PM2.5. The fragmented regulatory scenario described above leads to a lack of NH3 measurements in most regions of the globe [13] and actual rates of emission remain highly uncertain at all spatial scales, from local to global [36].
Nowadays, significant developments have been achieved in air quality research, such as improvements in characterising emissions sources, air quality forecast modelling, sensor technologies, and exposure assessment. The availability of space–time resolved air-quality measurements [37] remains critical to emissions reduction policymaking, particularly concerning farming-related emissions. Rural areas, where intensive farming activities mostly concentrate, generally have a lower prevalence of ground sensor networks than urban areas [38]. This is due to several reasons, including lower population densities and higher management/installation costs of the networks in remote locations [39]. The conventional air quality monitoring stations that are in a fixed location need regular upkeep and calibration of their equipment to guarantee the reliability of their data and make it easier to compare data from different stations and areas. Nonetheless, the expense of installing and maintaining these reference monitoring stations is high, which means that monitoring is not performed extensively, giving precise information only in a few areas that fulfil legal requirements. Hence, information on localised gradients is often missing, which could be crucial in protecting health [24].
Significant advances have been achieved, e.g., through the amelioration of hardware performance and sampling accuracy, with a concurrent reduction in costs and sizes, of air-quality sensors [40]. Accordingly, low-cost sensors have been exploited by several research projects, as well as citizens’ initiatives, to monitor air quality at a local scale as well as to investigate their role in monitoring pollutants for regulatory purposes by improving the density of traditional monitoring networks [41]. On one hand, the air-quality legislation currently in place does not officially regulate the use of measurements obtained through such platforms due to open challenges connected to the accuracy and reliability of the collected data [24,42]. On the other hand, many of the existing air quality directives, such as the European Air Quality Directive 2008/50/EC and the US National Ambient Air Quality Standards [43], encourage the implementation of additional methods, including but not limited to low-cost sensors, to obtain supportive air quality measurements [44,45,46].
In the preceding decades, the additional methods that have gained the most attention from scientists and policymakers worldwide are numerical AC models and satellite remote sensing, often used synergistically for observing, simulating, and predicting air pollution [37,47]. Starting from the 1970s, atmospheric observations from space have played a critical role in understanding the status of global and regional trends of air pollution. Satellite instruments have since advanced their retrieving capabilities from coarse single-trace gas total column estimates [48] to high space–time resolved and multi-trace gas tropospheric concentrations [49]. Instead, AC models assimilate satellite- and ground-based observations with meteorological and emissions inventory data to predict the concentration of pollutants in the atmosphere over time. AC models started to be adopted in the 1970s to study the transport and transformation processes of air pollutants. In the last two decades, AC models have gained momentum by evolving into global monitoring systems capable of providing broad-scale and time-continuous assessment of air pollutant concentrations [50]. Satellite estimates and AC modelling outputs may not be as accurate as sensor network observations and yet require calibration and validation with ground measurements [51]. However, modern satellite platforms and AC modelling systems have proved their value in complementing traditional monitoring methods and delivering valuable information for air-quality management and policymaking [52]. Such data can provide useful information on air pollution spatiotemporal dynamics even in areas where sensor density is high [53]. However, they are of utmost importance, especially for areas with limited ground-level measurements where they best promise to fill the data gap for assessing long-term human exposure, avoiding high economic investments by the managing authorities to increase the sensor network density [40]. A final key aspect is the growing availability of global coverage satellite and air-quality modelling estimates that are distributed as open data [54]. Examples are the European CAMS [55], together with recent satellite missions such as the Sentinel 5P of the European Space Agency (ESA) [56], providing cutting-edge global air-quality modelling services and observations from space. Considering this preamble, the availability of open, high-resolution, and continuous estimates of common pollutants related to farming is seen as the prominent asset to empower and support next-generation monitoring of farming-related emissions. To that end, several upcoming satellite missions are set to revolutionise air-quality monitoring. The most prominent examples of these missions include geostationary satellites such as the NASA Tropospheric Emissions: Monitoring of Pollution (TEMPO) [57], the ESA Sentinel 4 [58], and the Korea Aerospace Research Institute (KARI) Geostationary Environment Monitoring Spectrometer (GEMS) [49]. These satellites will provide continuous (1 h), high-resolution (between 2 and 8 km) data on air pollutants at a continental scale.

Data Preparation

The D-DUST project focuses on the analysis of air pollutant concentrations connected to intensive farming activities, with special attention being paid to PM2.5 and NH3. To account for the complex processes influencing the generation of secondary pollutants and to investigate the possible correlation with agricultural activities, additional factors such as terrain morphology, land cover, meteorological variables, etc., are also considered (see Table 1). The starting objective of the project was to design and develop a comprehensive and replicable procedure to prepare analysis-ready data supporting the investigation of farming-related air pollution patterns and risk assessment in the Lombardy region.
In the design of the data preparation procedures, the variables were categorised into four macro-types such as AC models data, satellite observations, ground sensor observations, and map layers (e.g. land use/land cover, digital elevation models, crop maps, transport networks, and population density). These macro-types provide essential information to empower data-driven assessments of pollution concentration and support multivariate space–time analysis of pollutant dynamics and correlation with underlined territorial processes. Variables refer to weather, pollutant concentrations, soil type, vegetation, etc., and were retrieved in their native formats from various sources. The data sources census considered the highest available temporal and spatial resolution by limiting the selection to open-license and programmatically accessible datasets from authoritative sources. A shortlist of the most relevant data sources and examples of retrieved variables was reported in Table 1. The D-DUST data preparation procedures also included satellite observations that are not later employed in the use cases described in the following sections but are reported for the sake of completeness.
Procedures for raw data download, pre-processing and aggregation both in space and time were developed and adapted to each considered data source. The procedure was implemented through a collection of Python Jupyter Notebooks made available on the D-DUST Project GitHub repository [66]. The code can be reused as a template to replicate the data repository generation in other geographical contexts, as well as for adaptation to different input data sources. The procedure includes standard operations such as HTTP and REST API data requests, format conversions, resampling, subsetting, re-projection, spatial and temporal aggregation, gridding, and interpolation. By running the Notebooks, users can define parameters such as spatial grid resolutions, the subset of variables to be considered, as well as the time windows for both data downloading and aggregation. The procedure output consists of a spatial vector grid containing as many attributes as the number of selected variables. Time-variant variables are aggregated using summary statistics in the user-selected time windows. The complete D-DUST data preparation procedures, together with sample data grids (see Figure 2) and supportive documentation are openly available on Zenodo [67].

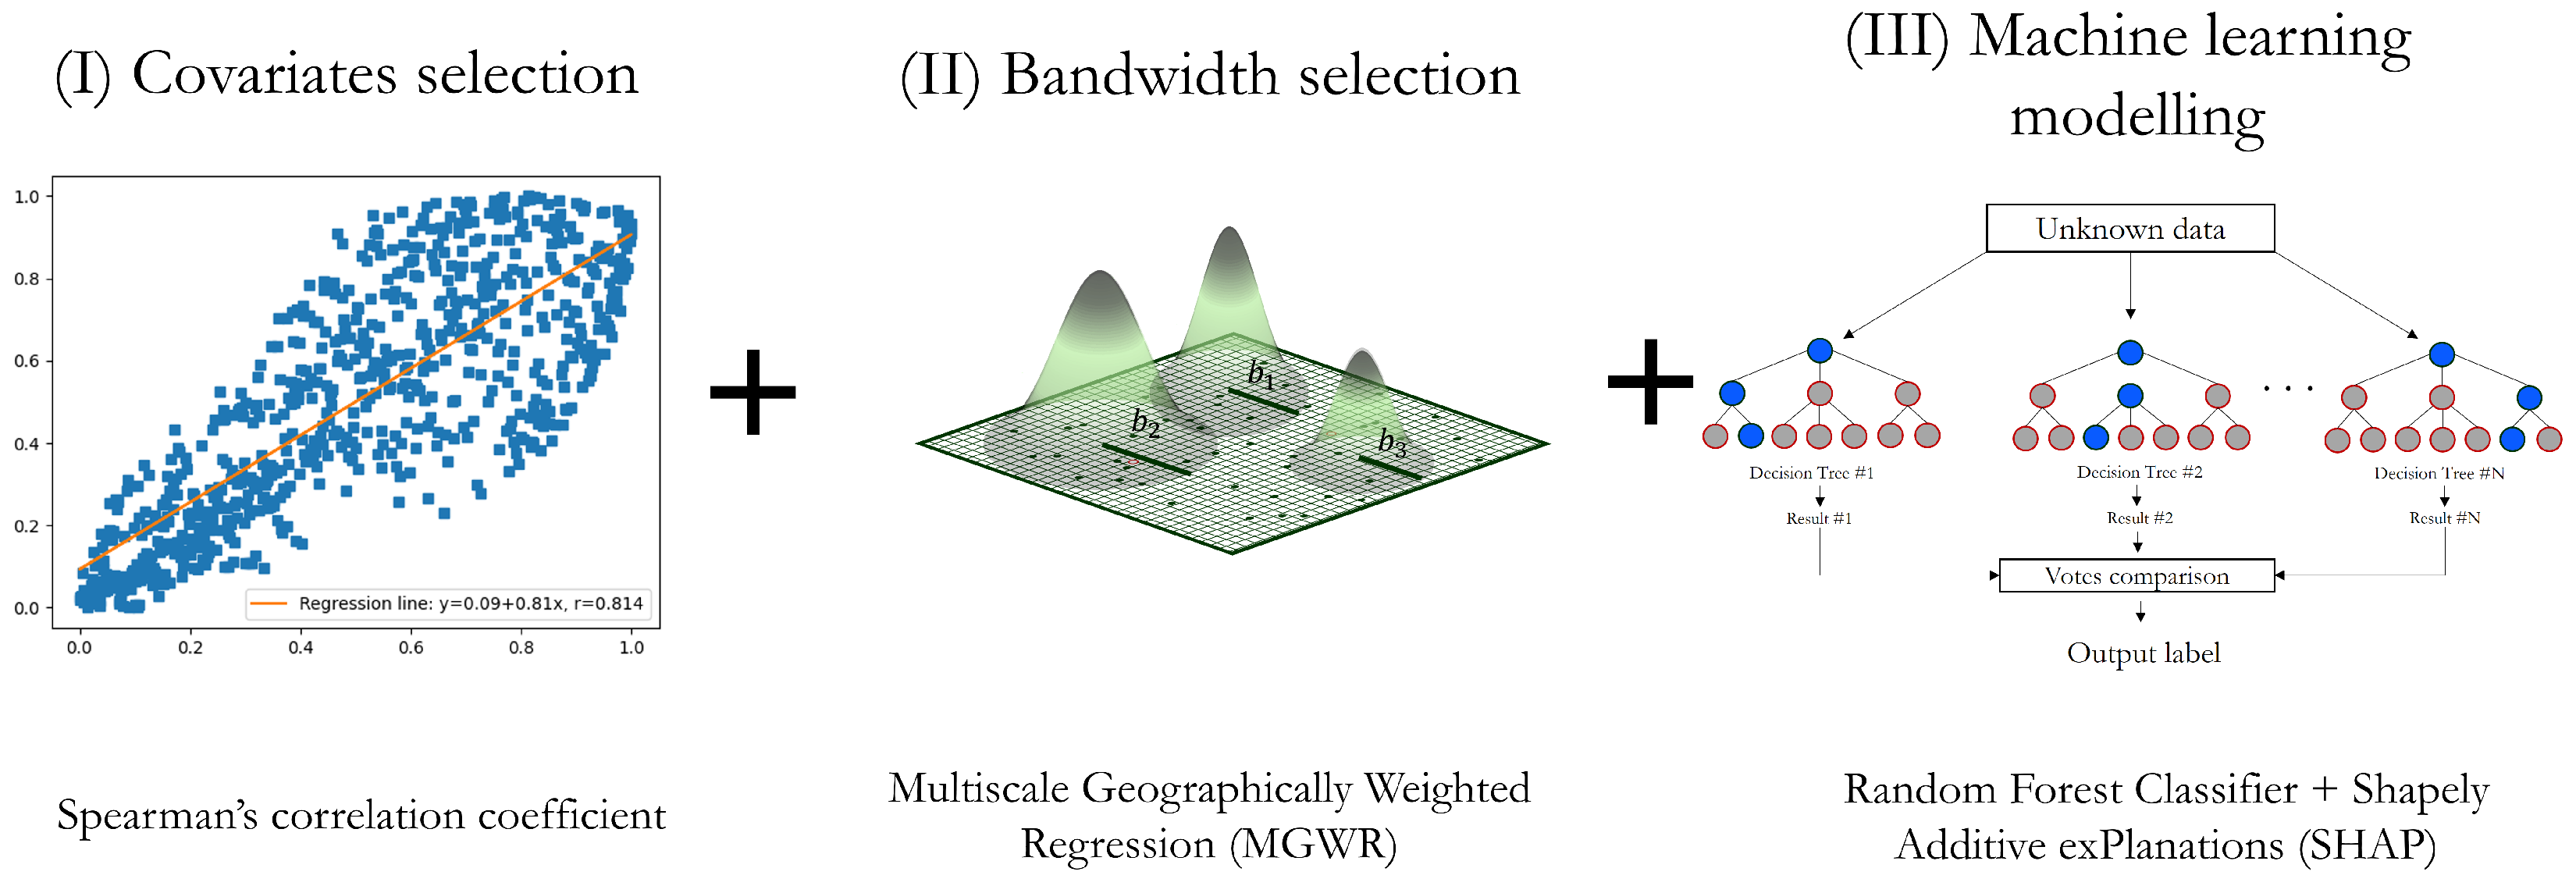
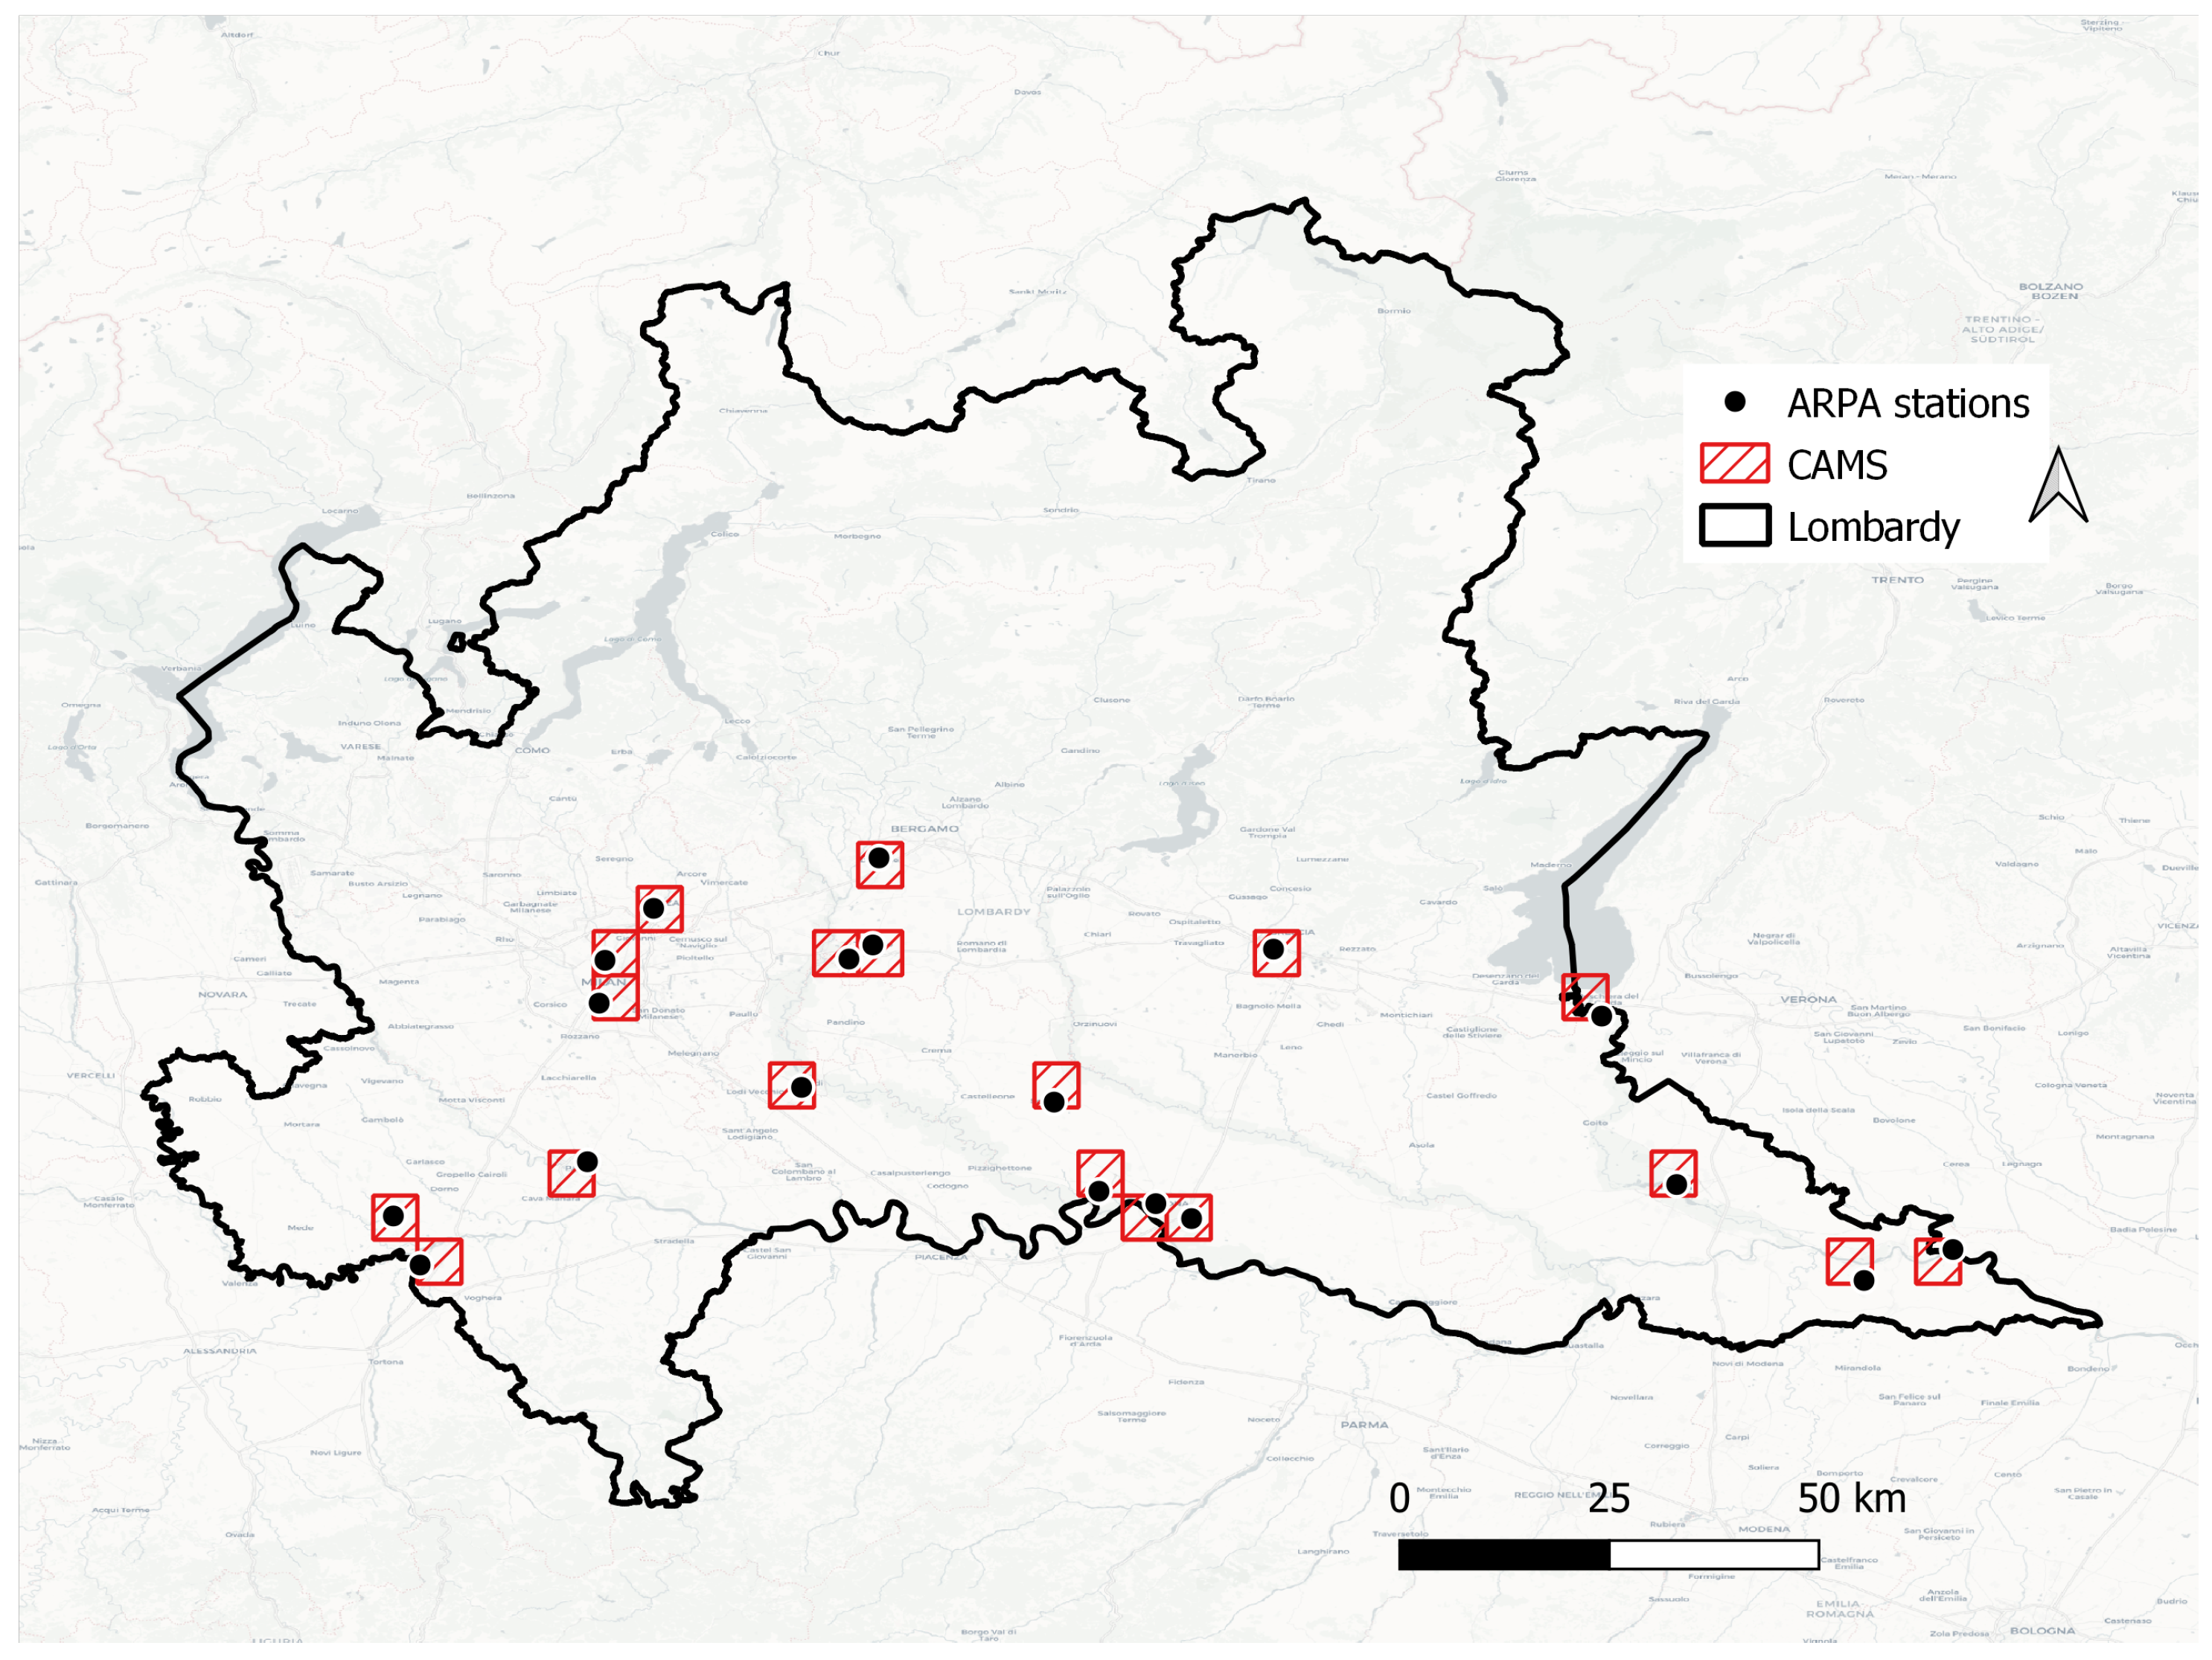
4. Contribution of Non-Conventional Air Pollution Data to Concentrations Modelling

The availability of manifold non-conventional air pollution and ancillary data sources, coupled with both established and experimental procedures to access and integrate them, is boosting the development and application of multivariate and machine learning-based modelling for air quality. To date, multivariate and data-driven approaches are very popular in air pollution modelling, particularly for PM modelling. According to a recent literature review published by the authors [68], based on 138 papers published in 2022 in which some kind of PM concentration modelling is implemented or applied, slightly more than 10% used univariate modelling, relying on bare data recorded from ground stations, whereas almost 90% considered integration of multiple and non-conventional data sources and multivariate modelling procedures. Traditional modelling techniques including Kriging interpolation, land-use regression, and chemical transport models, were recently overtaken by artificial intelligence (AI) approaches, particularly machine learning models [69]. The D-DUST data preparation procedures aim exactly at supporting the above methods, whose final goal is to facilitate the development, replication, and adaptation of innovative multivariate geospatial modelling applications that fully leverage the wealth of conventional, non-conventional, and ancillary data connected to air pollution.

Modelling Examples

Within the D-DUST project, experiments on implementing a novel PM modelling framework were carried out. The results demonstrated the potential of non-conventional data in enabling new research outcomes. Specifically, the large-scale impact of agricultural activities on PM2.5 concentration levels in the Lombardy region was assessed. The framework included coupling univariate variable analyses for feature selection and implementing a GEOAI model to evaluate the agricultural land characteristics most influencing the spatial distribution of PM2.5 concentrations (see Figure 3). Both procedure and results were fully documented in previous publications by the authors [70,71]. A summary of the main outcomes is reported below as a demonstration of the support the D-DUST data preparation procedures offered to these modelling applications.
The dataset used in the experiments was generated by running the D-DUST data preparation procedure to compute spatial vector grids at approx. 5 km resolution, containing weekly averages of CAMS PM2.5 concentrations estimates [ μ g/m3] for the years 2020 and 2021 as attributes; aggregated land-use class fractions (built-up, natural, agricultural), expressed as grid cell area coverage [%]; and sub-classes fractions which included residential, industry, and roads for built-up areas as well as crop type (cereals, corn, rice) for agricultural areas. The PM2.5 was considered the dependent variable while the other variables were used as covariates.
The strength of correlations among the covariates and the target variable was evaluated through Spearman’s correlation coefficients ρ . Following the identification of the most significant covariates, a GEOAI model was developed to examine the influence of land cover and crop types on the spatial distribution of PM2.5 concentrations within the study area. For this purpose, a Random Forest (RF) classifier, analysed with the SHapley Additive exPlanation (SHAP) method [72], was employed to evaluate the importance of various land-use classes and crop types during model training, thereby determining their impact on the spatial patterns of PM2.5 concentrations. To enhance the spatial accuracy of the model, Multiscale Geographically Weighted Regression (MGWR) [73] was integrated into the analysis to account for local variations in the relationships between the covariates and the target variable in the reported results. For each covariate, a bandwidth was computed to identify the size of the spatial window over which local regression coefficients are estimated. A collinearity test was also run before bandwidth estimation to remove highly correlated covariates from the computations.
The implementation of the proposed framework would be limited by the exclusive use of conventional ground sensor observations, given their limited spatial coverage, which would impact the spatialisation of the model. Consequently, the data preparation procedure implemented in the D-DUST project was crucial in supporting these modelling efforts.
As a result, this methodology allowed us to examine the impact of agricultural activities, investigated using crop types’ co-location with pollutants’ concentrations, on the spatial distribution of PM2.5. This impact was found to be comparable to that of traditional sources such as urban areas, industries, and transport networks both in terms of correlations (Spearman’s ρ ) and importance in the RF evaluation with SHAP (see Table 2). Natural areas instead showed a marked negative correlation with the PM2.5. Rice crops were removed from MGWR and RF computations due to the low correlation while urbanised areas were not considered in RF computation due to high collinearity with the other built-up classes.

5. Reliability of Non-Conventional Air Pollution Data for Health Risk Assessment

The use of non-conventional data such as the CAMS model estimates in air pollution studies has the potential to empower health risk assessment for the population exposed to air pollutants and management strategies (e.g., studying the role of different sources of air pollutants). When integrated into a risk assessment process, non-conventional data usefully represent information on large temporal and spatial scales that might not be obtained with traditional pollutant measurement and monitoring approaches. To this end, however, it is worth noting that for a fruitful use of such non-conventional data, it is necessary to characterise the measurement and estimation errors and to detect any distortions introduced in the data acquisition or processing. Assessing the accuracy, precision, representativeness or, more generally, reliability of non-conventional data for air pollution is a fundamental requirement to ensure the correctness of any risk assessment study based on this type of information.
In the following use case, the D-DUST data preparation procedure was employed to derive an analysis-ready dataset for local comparison of CAMS estimates with authoritative ground sensor data to assess the suitability of using this non-conventional data source in operative air pollution risk assessment.

AC Model Estimates for Risk Assesment

For the D-DUST case study, the CAMS European Air-Quality Forecasts Ensemble median hourly estimates of NO2, NH3, and PM2.5 concentrations [ μ g/m3] were compared with co-located observations from the ARPA Lombardia sensor network, which provided ambient-measured concentrations of equivalent pollutants. Daily average concentrations were considered for this comparison. Sensor data were acquired from 19 ARPA stations located in the agricultural area (Po Valley) of the Lombardy Region (Figure 4). The CAMS estimates have a native spatial resolution of 0.1° × 0.1°. ARPA sensor observations were further aggregated on the same spatial grid and co-located observations were considered in the comparison, thus excluding grid cells where no ARPA stations were present. Pollutant concentration data were extracted for one year, from 1 January 2021, to 31 December 2021. The whole temporal series of both ARPA observations and CAMS estimates were associated with the overlay grid cells.
The reliability of the CAMS model was evaluated using several methods including linear regression analysis and comparability analysis with ARPA’s reference measurements as the independent variable and CAMS estimates as the dependent variable [74]. Accuracy was assessed by comparing the entire dataset of ARPA measurements and CAMS estimates. Additional analysis involved calculating the Coefficient of Variation (CV) and the Mean Normalised Bias (MNB) of values from both ARPA and CAMS [75]. the error trends of the CAMS estimates relative to ARPA measurements were evaluated using Bland–Altman plots. A summary of the adopted methods and criteria together with numerical results of the analyses is presented in Table 3.
The initial evaluation of the CAMS estimates was conducted using regression analysis. the CAMS estimates were compared to data acquired from ARPA measurement sites. Applying the criteria established by [74] through the regression analysis approach, it was determined that there was a lack of comparability between the CAMS estimates and the ARPA measurements. This conclusion was based on the observed low correlation, indicating the poor accuracy of the CAMS estimates.
CV and MNB were computed to investigate the error trends of the CAMS estimates, indicating on average a slight underestimation for PM2.5 and NO2 and a slight overestimation of NH3 values when considering CAMS compared to the measurement obtained from ARPA. It is worth noticing that, despite the above highlighted slight underestimation, the CAMS estimates were suitable to recognise the exceeding of the WHO Air Quality Guidelines (15 μ g/m3—PM2.5 daily average; 25 μ g/m3—NO2 daily average) [1] recorded by the ARPA in 56% and 81% of grid cells, respectively, for PM2.5 and NO2, proving to be capable of providing sufficiently conservative estimates for risk assessment.
The Bland–Altman plots (Figure 5) showed different error trends for each considered pollutant. Although a good agreement between CAMS and ARPA can be observed for PM2.5 at concentrations lower than 20 μ g/m3, worse performance was observed with increasing concentration but without a clear trend towards overestimation or underestimation. The accordance between the CAMS estimates and ARPA measurement for NH3 and NO2 concentrations outlined a clear trend of overestimation and underestimation, respectively, for increasing ambient concentration.
Finally, based on the CV and MNB parameters, the CAMS estimates could be classified as a “Tier II” method (thus suitable for “Hotspot Identification and Characterisation”) for PM2.5 and NO2, and “Tier I” (thus suitable for “Education and Training”) for NH3. It should be noted that this classification is mainly based on MNB values, since the calculated CVs were too high to comply with the proposed classification criteria, thus suggesting the need for an improvement of precision.
Overall, the outcomes from this study suggest that the CAMS could be improved to enhance its performance (in terms of accuracy and precision) but to date, it can follow PM2.5 and NO2 concentration trends with reasonable efficacy for risk assessment purposes since it is configured as a useful method for the identification and characterisation of pollutant hotspots (with a possible improvement in terms of precision for NH3).

6. Conclusions

This paper provided a summary of the chronology and current status of non-conventional data suitable for farming-related air pollution analysis, alongside a description of some relevant data types and sources. The exploitation of such a wealth of information is investigated through the presentation of the D-DUST project use cases related to pollutant concentration modelling and risk assessment in the Lombardy Region.
The data preparation procedure implemented in the D-DUST project is a tangible outcome of this research. Both source code and documentation have been openly published for future adaptation to additional data sources and replication to other geographical contexts. The employment of analysis-ready data, generated using this procedure, to PM2.5 local pattern modelling, provided insights into the relationship between agricultural land use and the concentrations of this pollutant. A strong positive correlation with corn cultures was found in the Lombardy Region. In addition to the practical use and integration of non-conventional air pollution data into modelling practices, this work also investigated the reliability of some of the considered non-conventional data, specifically CAMS AC model estimates of NO2, PM2.5 and NH3, for health risk assessment. This investigation was carried out through statistical comparison with reference and authoritative data from the ground sensors network in the Lombardy Region. The results indicated that CAMS is reasonably effective in identifying concentration trends and pollutant hotspots, though an improvement in precision is necessary to supplement traditional monitoring and population exposure assessment effectively. It should be noted that the analyses were conducted over a limited period and with a reduced set of observations, constrained by the availability of ground stations. Further experiments are planned to draw robust conclusions based on the presented numerical outcomes.
According to the empirical results, the maturity and widespread availability of such non-conventional data are key capabilities to empower next-generation air pollution studies as well as applications in health monitoring, also at a local scale. Nevertheless, application in operational air-quality monitoring is still confined to a supportive role due to data accuracy and resolution concerns. Improvements are expected, especially from next-generation geostationary satellite missions that are promising in supporting finer and more accurate AC models. Future directions for this work will focus on testing and extending the data integration procedures also to these new sources.

Author Contributions

All authors contributed to the study conception and design. Material preparation, code development, and data collection were performed by D.O. and L.G. Analyses were performed by A.S., L.G., G.F. and F.B. The first draft of the manuscript was written by D.O., A.S. and L.G. All authors commented on previous versions of the manuscript. All authors read and approved the final manuscript.

Funding

This work was supported by D-DUST (Data-driven moDelling of particUlate with Satellite Technology aid), a project funded by Fondazione Cariplo (Project ID: 2020-4022).

Data Availability Statement

Sample datasets supporting the findings of this study are openly available at https://doi.org/10.5281/zenodo.7962551.

Acknowledgments

The authors express their gratitude to Eng. Emanuele Capizzi for his valuable support in code development and publication.

Conflicts of Interest

The authors declare no conflicts of interest.

Abbreviations

The following abbreviations are used in this manuscript:
ACAtmospheric Composition
AIArtificial Intelligence
ARPAEnvironmental Protection Agency
CAMSCopernicus Atmosphere Monitoring Service
CVCoefficient of Variation
D-DUSTData-driven moDelling of particUlate with Satellite Technology aid
DUSAFLombardy Region - Land Use and Land Cover Database
ECMWFEuropean Centre for Medium-Range Weather Forecasts
ESAEuropean Space Agency
EUEuropean Union
GEMSGeostationary Environment Monitoring Spectrometer
GEOAIGeographically Enhanced Artificial Intelligence
INEMARINventario EMissioni ARia
KARIKorea Aerospace Research Institute
MGWRMultiscale Geographically Weighted Regression
MNBMean Normalized Bias
NONitric Oxide
NO2Nitrogen Dioxide
NOXNitrogen Oxides
NH3Ammonia
O3Ozone
PMParticulate Matter
PM10Particulate Matter with diameter 10 µm or smaller
PM2.5Particulate Matter with diameter 2.5 µm or smaller
RFRandom Forest
SDGsSustainable Development Goals
SHAPSHapley Additive exPlanation
SIARLLombardy Region - Agricultural Information System
TEMPOTropospheric Emissions: Monitoring of Pollution
UNUnited Nations
USAUnited States of America
WorldPopWorld Population Data

References

  1. World Health Organization. WHO Global Air Quality Guidelines; WHO: Geneva, Switzerland, 2021. [Google Scholar]
  2. Rafaj, P.; Kiesewetter, G.; Gül, T.; Schöpp, W.; Cofala, J.; Klimont, Z.; Purohit, P.; Heyes, C.; Amann, M.; Borken-Kleefeld, J.; et al. Outlook for clean air in the context of sustainable development goals. Glob. Environ. Chang. 2018, 53, 1–11. [Google Scholar] [CrossRef]
  3. Vandyck, T.; Keramidas, K.; Kitous, A.; Spadaro, J.V.; Van Dingenen, R.; Holland, M.; Saveyn, B. Air quality co-benefits for human health and agriculture counterbalance costs to meet Paris Agreement pledges. Nat. Commun. 2018, 9, 4939. [Google Scholar] [CrossRef] [PubMed]
  4. Amann, M.; Kiesewetter, G.; Schöpp, W.; Klimont, Z.; Winiwarter, W.; Cofala, J.; Rafaj, P.; Höglund-Isaksson, L.; Gomez-Sabriana, A.; Heyes, C.; et al. Reducing global air pollution: The scope for further policy interventions. Philos. Trans. R. Soc. A Math. Phys. Eng. Sci. 2020, 378, 20190331. [Google Scholar] [CrossRef]
  5. Chen, B.; Kan, H. Air pollution and population health: A global challenge. Environ. Health Prev. Med. 2008, 13, 94–101. [Google Scholar] [CrossRef] [PubMed]
  6. World Health Organization. Ambient air pollution: A global assessment of exposure and burden of disease. Clean Air J. 2016, 26, 6. [Google Scholar] [CrossRef]
  7. Shindell, D.; Kuylenstierna, J.C.I.; Vignati, E.; van Dingenen, R.; Amann, M.; Klimont, Z.; Anenberg, S.C.; Muller, N.; Janssens-Maenhout, G.; Raes, F.; et al. Simultaneously Mitigating Near-Term Climate Change and Improving Human Health and Food Security. Science 2012, 335, 183–189. [Google Scholar] [CrossRef]
  8. McDuffie, E.E.; Smith, S.J.; O’Rourke, P.; Tibrewal, K.; Venkataraman, C.; Marais, E.A.; Zheng, B.; Crippa, M.; Brauer, M.; Martin, R.V. A global anthropogenic emission inventory of atmospheric pollutants from sector- and fuel-specific sources (1970–2017): An application of the Community Emissions Data System (CEDS). Earth Syst. Sci. Data 2020, 12, 3413–3442. [Google Scholar] [CrossRef]
  9. Paulot, F.; Jacob, D.J. Hidden Cost of U.S. Agricultural Exports: Particulate Matter from Ammonia Emissions. Environ. Sci. Technol. 2014, 48, 903–908. [Google Scholar] [CrossRef]
  10. Aneja, V.P.; Schlesinger, W.H.; Erisman, J.W. Farming pollution. Nat. Geosci. 2008, 1, 409–411. [Google Scholar] [CrossRef]
  11. Wyer, K.E.; Kelleghan, D.B.; Blanes-Vidal, V.; Schauberger, G.; Curran, T.P. Ammonia emissions from agriculture and their contribution to fine particulate matter: A review of implications for human health. J. Environ. Manag. 2022, 323, 116285. [Google Scholar] [CrossRef]
  12. World Health Organization. Ammonia; Number 54 in Environmental Health Criteria; WHO: Geneva, Switzerland, 1986. [Google Scholar]
  13. Zhu, L.; Henze, D.K.; Bash, J.O.; Cady-Pereira, K.E.; Shephard, M.W.; Luo, M.; Capps, S.L. Sources and Impacts of Atmospheric NH3: Current Understanding and Frontiers for Modeling, Measurements, and Remote Sensing in North America. Curr. Pollut. Rep. 2015, 1, 95–116. [Google Scholar] [CrossRef]
  14. Baek, B.H.; Aneja, V.P.; Tong, Q. Chemical coupling between ammonia, acid gases, and fine particles. Environ. Pollut. 2004, 129, 89–98. [Google Scholar] [CrossRef] [PubMed]
  15. Sun, Z.; Duan, F.; He, K.; Du, J.; Zhu, L. Sulfate–nitrate–ammonium as double salts in PM2.5: Direct observations and implications for haze events. Sci. Total Environ. 2019, 647, 204–209. [Google Scholar] [CrossRef]
  16. Putaud, J.P.; Van Dingenen, R.; Alastuey, A.; Bauer, H.; Birmili, W.; Cyrys, J.; Flentje, H.; Fuzzi, S.; Gehrig, R.; Hansson, H.; et al. A European aerosol phenomenology—3: Physical and chemical characteristics of particulate matter from 60 rural, urban, and kerbside sites across Europe. Atmos. Environ. 2010, 44, 1308–1320. [Google Scholar] [CrossRef]
  17. Park, J.; Kim, E.; Oh, S.; Kim, H.; Kim, S.; Kim, Y.P.; Song, M. Contributions of Ammonia to High Concentrations of PM2.5 in an Urban Area. Atmosphere 2021, 12, 1676. [Google Scholar] [CrossRef]
  18. Shikhovtsev, M.Y.; Obolkin, V.; Khodzher, T.; Molozhnikova, Y.V. Variability of the Ground Concentration of Particulate Matter PM1–PM10 in the Air Basin of the Southern Baikal Region. Atmos. Ocean. Opt. 2023, 36, 655–662. [Google Scholar] [CrossRef]
  19. Xing, Y.F.; Xu, Y.H.; Shi, M.H.; Lian, Y.X. The impact of PM2.5 on the human respiratory system. J. Thorac. Dis. 2016, 8, E69–E74. [Google Scholar] [CrossRef]
  20. Papastefanou, C. Residence time of tropospheric aerosols in association with radioactive nuclides. Appl. Radiat. Isot. 2006, 64, 93–100. [Google Scholar] [CrossRef]
  21. World Bank. The Global Health Cost of Ambient PM2.5 Air Pollution; The World Bank Group: Washington, DC, USA, 2020. [Google Scholar] [CrossRef]
  22. Pohl, V.; Gilmer, A.; Hellebust, S.; McGovern, E.; Cassidy, J.; Byers, V.; McGillicuddy, E.J.; Neeson, F.; O’Connor, D.J. Ammonia Cycling and Emerging Secondary Aerosols from Arable Agriculture: A European and Irish Perspective. Air 2022, 1, 37–54. [Google Scholar] [CrossRef]
  23. Fanti, G.; Borghi, F.; Spinazzè, A.; Rovelli, S.; Campagnolo, D.; Keller, M.; Cattaneo, A.; Cauda, E.; Cavallo, D.M. Features and practicability of the next-generation sensors and monitors for exposure assessment to airborne pollutants: A systematic review. Sensors 2021, 21, 4513. [Google Scholar] [CrossRef]
  24. Castell, N.; Dauge, F.R.; Schneider, P.; Vogt, M.; Lerner, U.; Fishbain, B.; Broday, D.; Bartonova, A. Can commercial low-cost sensor platforms contribute to air quality monitoring and exposure estimates? Environ. Int. 2017, 99, 293–302. [Google Scholar] [CrossRef] [PubMed]
  25. Fowler, D.; Brimblecombe, P.; Burrows, J.; Heal, M.R.; Grennfelt, P.; Stevenson, D.S.; Jowett, A.; Nemitz, E.; Coyle, M.; Liu, X.; et al. A chronology of global air quality. Philos. Trans. R. Soc. A Math. Phys. Eng. Sci. 2020, 378, 20190314. [Google Scholar] [CrossRef] [PubMed]
  26. D-DUST. Data-Driven moDelling of particUlate with Satellite Technology Aid. 2023. Available online: https://www.ddust.it (accessed on 12 May 2024).
  27. Maranzano, P. Air Quality in Lombardy, Italy: An Overview of the Environmental Monitoring System of ARPA Lombardia. Earth 2022, 3, 172–203. [Google Scholar] [CrossRef]
  28. ARPA Lombardia. INEMAR, Atmospheric Emissions Inventory: Emissions in the Lombardy Region for the Year 2021. 2024. Available online: https://www.inemar.eu (accessed on 15 October 2024).
  29. CAMS. Copernicus Atmosphere Monitoring Service. 2024. Available online: https://atmosphere.copernicus.eu (accessed on 18 June 2024).
  30. ARPA Lombardia. ARPA Lombardia—Air Quality Data and Indicators. 2024. Available online: https://www.arpalombardia.it/dati-e-indicatori/aria (accessed on 18 June 2024).
  31. Erisman, J.; Schaap, M. The need for ammonia abatement with respect to secondary PM reductions in Europe. Environ. Pollut. 2004, 129, 159–163. [Google Scholar] [CrossRef] [PubMed]
  32. Xu, W.; Zhao, Y.; Wen, Z.; Chang, Y.; Pan, Y.; Sun, Y.; Ma, X.; Sha, Z.; Li, Z.; Kang, J.; et al. Increasing importance of ammonia emission abatement in PM2.5 pollution control. Sci. Bull. 2022, 67, 1745–1749. [Google Scholar] [CrossRef]
  33. European Commission. Proposal for a Directive of the European Parliament and of the Council on National Emissions Ceilings for Certain Atmospheric Pollutant; European Commission: Luxembourg, 1999.
  34. Yao, X.; Zhang, L. Trends in atmospheric ammonia at urban, rural, and remote sites across NorthAmerica. Atmos. Chem. Phys. 2016, 16, 11465–11475. [Google Scholar] [CrossRef]
  35. Ma, R.; Li, K.; Guo, Y.; Zhang, B.; Zhao, X.; Linder, S.; Guan, C.; Chen, G.; Gan, Y.; Meng, J. Mitigation potential of global ammonia emissions and related health impacts in the trade network. Nat. Commun. 2021, 12, 6308. [Google Scholar] [CrossRef]
  36. Dammers, E.; Shephard, M.; Griffin, D.; Chow, E.; White, E.; Hickman, J.; Tokaya, J.; Lutsch, E.; Kharol, S.; van der Graaf, S. County-level ammonia emissions monitored worldwide. Res. Sq. 2022. [Google Scholar] [CrossRef]
  37. Sokhi, R.S.; Moussiopoulos, N.; Baklanov, A.; Bartzis, J.; Coll, I.; Finardi, S.; Friedrich, R.; Geels, C.; Grönholm, T.; Halenka, T.; et al. Advances in air quality research – current and emerging challenges. Atmos. Chem. Phys. 2022, 22, 4615–4703. [Google Scholar] [CrossRef]
  38. Pinder, R.W.; Adams, P.J.; Pandis, S.N.; Gilliland, A.B. Temporally resolved ammonia emission inventories: Current estimates, evaluation tools, and measurement needs. J. Geophys. Res. 2006, 111, D16310. [Google Scholar] [CrossRef]
  39. Narayana, M.V.; Jalihal, D.; Nagendra, S.M.S. Establishing A Sustainable Low-Cost Air Quality Monitoring Setup: A Survey of the State-of-the-Art. Sensors 2022, 22, 394. [Google Scholar] [CrossRef] [PubMed]
  40. Snider, G.; Weagle, C.L.; Murdymootoo, K.K.; Ring, A.; Ritchie, Y.; Stone, E.; Walsh, A.; Akoshile, C.; Anh, N.X.; Balasubramanian, R.; et al. Variation in global chemical composition of PM2.5: Emerging results from SPARTAN. Atmos. Chem. Phys. 2016, 16, 9629–9653. [Google Scholar] [CrossRef]
  41. Kang, Y.; Aye, L.; Ngo, T.D.; Zhou, J. Performance evaluation of low-cost air quality sensors: A review. Sci. Total Environ. 2022, 818, 151769. [Google Scholar] [CrossRef] [PubMed]
  42. Giordano, M.R.; Malings, C.; Pandis, S.N.; Presto, A.A.; McNeill, V.; Westervelt, D.M.; Beekmann, M.; Subramanian, R. From low-cost sensors to high-quality data: A summary of challenges and best practices for effectively calibrating low-cost particulate matter mass sensors. J. Aerosol Sci. 2021, 158, 105833. [Google Scholar] [CrossRef]
  43. Kuklinska, K.; Wolska, L.; Namiesnik, J. Air quality policy in the U.S. and the EU—A review. Atmos. Pollut. Res. 2015, 6, 129–137. [Google Scholar] [CrossRef]
  44. European Environment Agency. The Application of Models Under the European Union’s Air Quality Directive: A Technical Reference Guide; European Environment Agency: Copenhagen, Denmark, 2011; OCLC: 904337141.
  45. Thunis, P.; Miranda, A.; Baldasano, J.; Blond, N.; Douros, J.; Graff, A.; Janssen, S.; Juda-Rezler, K.; Karvosenoja, N.; Maffeis, G.; et al. Overview of current regional and local scale air quality modelling practices: Assessment and planning tools in the EU. Environ. Sci. Policy 2016, 65, 13–21. [Google Scholar] [CrossRef]
  46. European Commission. A Europe That Protects: Clean Air for All; European Commission: Luxembourg, 2018.
  47. Heal, M.R.; Kumar, P.; Harrison, R.M. Particles, air quality, policy and health. Chem. Soc. Rev. 2012, 41, 6606. [Google Scholar] [CrossRef]
  48. Heath, D.F.; Krueger, A.J.; Roeder, H.A.; Henderson, B.D. The Solar Backscatter Ultraviolet and Total Ozone Mapping Spectrometer (SBUV/TOMS) for NIMBUS G. Opt. Eng. 1975, 14, 144323. [Google Scholar] [CrossRef]
  49. Kim, J.; Jeong, U.; Ahn, M.H.; Kim, J.H.; Park, R.J.; Lee, H.; Song, C.H.; Choi, Y.S.; Lee, K.H.; Yoo, J.M.; et al. New era of air quality monitoring from space: Geostationary Environment Monitoring Spectrometer (GEMS). Bull. Am. Meteorol. Soc. 2020, 101, E1–E22. [Google Scholar] [CrossRef]
  50. Benedetti, A.; Reid, J.S.; Knippertz, P.; Marsham, J.H.; Di Giuseppe, F.; Rémy, S.; Basart, S.; Boucher, O.; Brooks, I.M.; Menut, L.; et al. Status and future of numerical atmospheric aerosol prediction with a focus on data requirements. Atmos. Chem. Phys. 2018, 18, 10615–10643. [Google Scholar] [CrossRef]
  51. Fowlie, M.; Rubin, E.; Walker, R. Bringing satellite-based air quality estimates down to Earth. Aea Pap. Proc. 2019, 109, 283–288. [Google Scholar] [CrossRef]
  52. Stortini, M.; Arvani, B.; Deserti, M. Operational Forecast and Daily Assessment of the Air Quality in Italy: A Copernicus-CAMS Downstream Service. Atmosphere 2020, 11, 447. [Google Scholar] [CrossRef]
  53. Lee, H.J.; Coull, B.A.; Bell, M.L.; Koutrakis, P. Use of satellite-based aerosol optical depth and spatial clustering to predict ambient PM2.5 concentrations. Environ. Res. 2012, 118, 8–15. [Google Scholar] [CrossRef] [PubMed]
  54. Harris, R.; Baumann, I. Open data policies and satellite Earth observation. Space Policy 2015, 32, 44–53. [Google Scholar] [CrossRef]
  55. Peuch, V.H.; Engelen, R.; Rixen, M.; Dee, D.; Flemming, J.; Suttie, M.; Ades, M.; Agustí-Panareda, A.; Ananasso, C.; Andersson, E.; et al. The Copernicus Atmosphere Monitoring Service: From Research to Operations. Bull. Am. Meteorol. Soc. 2022, 103, E2650–E2668. [Google Scholar] [CrossRef]
  56. Koch, A.C.; Bydekerke, L. Sentinel 5p in the framework of the EU Copernicus programme. In Proceedings of the EGU General Assembly 2018, Vienna, Austria, 8–13 April 2018; EGU General Assembly Conference Abstracts. p. 6557. [Google Scholar]
  57. Zoogman, P.; Liu, X.; Suleiman, R.; Pennington, W.; Flittner, D.; Al-Saadi, J.; Hilton, B.; Nicks, D.; Newchurch, M.; Carr, J.; et al. Tropospheric Emissions: Monitoring of Pollution (TEMPO). J. Quant. Spectrosc. Radiat. Transf. 2017, 186, 17–39. [Google Scholar] [CrossRef]
  58. Courrèges-Lacoste, G.B.; Sallusti, M.; Bulsa, G.; Bagnasco, G.; Veihelmann, B.; Riedl, S.; Smith, D.J.; Maurer, R. The Copernicus Sentinel 4 mission: A geostationary imaging UVN spectrometer for air quality monitoring. In Proceedings of the Sensors, Systems, and Next-Generation Satellites XXI, Warsaw, Poland, 11–14 September 2017; Neeck, S.P., Bézy, J.L., Kimura, T., Eds.; International Society for Optics and Photonics. SPIE: Bellingham, DC, USA, 2017; Volume 10423, p. 1042307. [Google Scholar] [CrossRef]
  59. ECMWF. European Centre for Medium-Range Weather Forecasts—ERA5-Land. 2024. Available online: https://cds.climate.copernicus.eu/cdsapp#!/dataset/reanalysis-era5-land (accessed on 18 June 2024).
  60. ARPA Lombardia. ARPA Lombardia—Meteo e Clima. 2024. Available online: https://www.arpalombardia.it/temi-ambientali/meteo-e-clima (accessed on 18 June 2024).
  61. Lombardy Region. Land Use and Land Cover Database (DUSAF). 2024. Available online: https://www.ersaf.lombardia.it/territorio/dusaf-destinazione-uso-suoli-agricoli-e-forestali (accessed on 18 June 2024).
  62. Lombardy Region. Geo-Topographic Database. 2024. Available online: https://www.geoportale.regione.lombardia.it (accessed on 18 June 2024).
  63. Lombardy Region. Agricultural Information System (SIARL). 2024. Available online: https://www.siarl.regione.lombardia.it (accessed on 18 June 2024).
  64. WorldPop. WorldPop: Open Spatial Demographic Data and Research. 2024. Available online: https://www.worldpop.org (accessed on 18 June 2024).
  65. European Space Agency. Sentinel-5P. 2024. Available online: https://sentinel.esa.int/web/sentinel/missions/sentinel-5p (accessed on 18 June 2024).
  66. Oxoli, D.; Capizzi, E. D-DUST Code Respository. 2023. Available online: https://github.com/gisgeolab/D-DUST (accessed on 12 May 2024).
  67. Oxoli, D.; Capizzi, E. D-DUST Analysis Ready Data Repository; Zenodo: Geneva, Switzerland, 2023. [Google Scholar] [CrossRef]
  68. Gianquintieri, L.; Oxoli, D.; Caiani, E.G.; Brovelli, M.A. State-of-art in modelling particulate matter (PM) concentration: A scoping review of aims and methods. Environ. Dev. Sustain. 2024, 26, 1–23. [Google Scholar] [CrossRef]
  69. Mahakalkar, A.U.; Gianquintieri, L.; Amici, L.; Brovelli, M.A.; Caiani, E.G. Geospatial analysis of short-term exposure to air pollution and risk of cardiovascular diseases and mortality—A systematic review. Chemosphere 2024, 353, 141495. [Google Scholar] [CrossRef]
  70. Gianquintieri, L.; Oxoli, D.; Caiani, E.G.; Brovelli, M.A. Land use influence on ambient PM2. 5 and ammonia concentrations: Correlation analyses in the Lombardy region, Italy. AGILE GIScience Ser. 2023, 4, 26. [Google Scholar] [CrossRef]
  71. Gianquintieri, L.; Oxoli, D.; Caiani, E.G.; Brovelli, M.A. Implementation of a GEOAI model to assess the impact of agricultural land on the spatial distribution of PM2. 5 concentration. Chemosphere 2024, 352, 141438. [Google Scholar] [CrossRef]
  72. Lundberg, S.M.; Lee, S.I. A Unified Approach to Interpreting Model Predictions. In Proceedings of the Advances in Neural Information Processing Systems, Long Beach, CA, USA, 4–9 December 2017; Guyon, I., Luxburg, U.V., Bengio, S., Wallach, H., Fergus, R., Vishwanathan, S., Garnett, R., Eds.; Curran Associates, Inc.: Red Hook, NY, USA, 2017; Volume 30. [Google Scholar]
  73. Fotheringham, A.S.; Yang, W.; Kang, W. Multiscale geographically weighted regression (MGWR). Ann. Am. Assoc. Geogr. 2017, 107, 1247–1265. [Google Scholar] [CrossRef]
  74. Watson, J.G.; Chow, J.C.; Moosmüller, H.; Green, M.; Frank, N. Guidance for Using Continuous Monitors in PM2.5 Monitoring Networks; Technical Report; Nevada Univ. System, Desert Research Inst.: Reno, NV, USA, 1998. [Google Scholar]
  75. Williams, R.; Kaufman, A.; Hanley, T.; Rice, J.; Garvey, S. Evaluation of Field-Deployed Low-Cost PM Sensors; Technical Report EPA/600/R-14/464; U.S. Environmental Protection Agency: Washington, DC, USA, 2014.
Figure 1. Location of the D-DUST project study area (Lombardy Region) with its main land cover classes.
Environments 11 00229 g001
Figure 2. Schematic of the D-DUST data preparation procedure and outputs.
Environments 11 00229 g002
Figure 3. Schematic of the D-DUST PM2.5 modelling framework.
Environments 11 00229 g003
Figure 4. ARPA stations and co-located CAMS grid cells considered for the data comparison.
Environments 11 00229 g004
Figure 5. Bland–Altman plot for different pollutants (PM2.5; NO2; NH3). The average concentrations between the reference measurements (ARPA) and the compared estimates (CAMS) are reported on the x-axis while their differences, in terms of absolute errors (AE), are on the y-axis. The black line represents the perfect agreement (absolute deviation equal to 0) between the two datasets, whereas the red line is the computed average deviation.
Environments 11 00229 g005
Table 1. Summary table of the D-DUST project data.
Data TypeVariable DomainVariablesDatasource
ModelsWeatherTemperature, Wind, Precipitation, Air humidity, Air pressure, Solar radiationECMWF ERA5-Land [59]
Air pollutantsPM10, PM2.5, SO2, NO2, NO, CO, O3, NH3CAMS [29]
Ground sensorsWeatherTemperature, Wind, Precipitation, Air humidity, Air pressure, Solar radiationARPA Lombardia—Weather and climate [60]
Air pollutantsPM10, PM2.5, SO2, NO2, NO, CO, O3, NH3ARPA Lombardia—Air quality [30]
Map layersLand useMajor land use classes (natural areas, agriculture, residential, industrial)Lombardy Region—Land Use and Land Cover Database (DUSAF) [61]
Transport networksRoad densityLombardy Region—Geo-Topographic Database [62]
Crop typesMajor crop types (corn, cereals, rice)Lombardy Region—Agricultural Information System (SIARL) [63]
TerrainElevation, aspect, slopeLombardy Region—Digital Terrain Model [62]
PopulationPopulation densityWorldPop [64]
SatellitesAir pollutantsAerosol Optical Depth, column densities: SO2, NO2, CO, O3ESA Sentinel 5P [65]
Table 2. Results summary of land-use impact on the spatial distribution of PM2.5 concentration.
Land-Use ClassesSpearman’s ρ [−1–1]MGWR Bandwidth [Grid Cells]SHAP Relevance [0–1]
Agricultural0.76770.38
Cereals0.73170.73
Corn0.89970.65
Rice0.228//
Built-up0.80090.40
Urbanised0.717//
Industrial0.86290.63
Roads0.77590.24
Natural−0.86170.97
Table 3. Analysis of performance of CAMS estimates compared to ARPA measurements through different tests.
TestEvaluation CriteriaResults
Linear RegressionData are comparable if the correlation coefficient (R) ≥ 0.9 [74]PM2.5: R = 0.792; NH3: R = 0.115; NO2: R = 0.665
Accuracy—Coefficient of Variation (CV) and Mean Normalised Bias (MNB)See footnote for details 1PM2.5: MNB = 0.100, CV = 0.646; NH3: MNB = 0.240,
CV = 0.583; NO2: MNB = 0.366, CV = 0.789
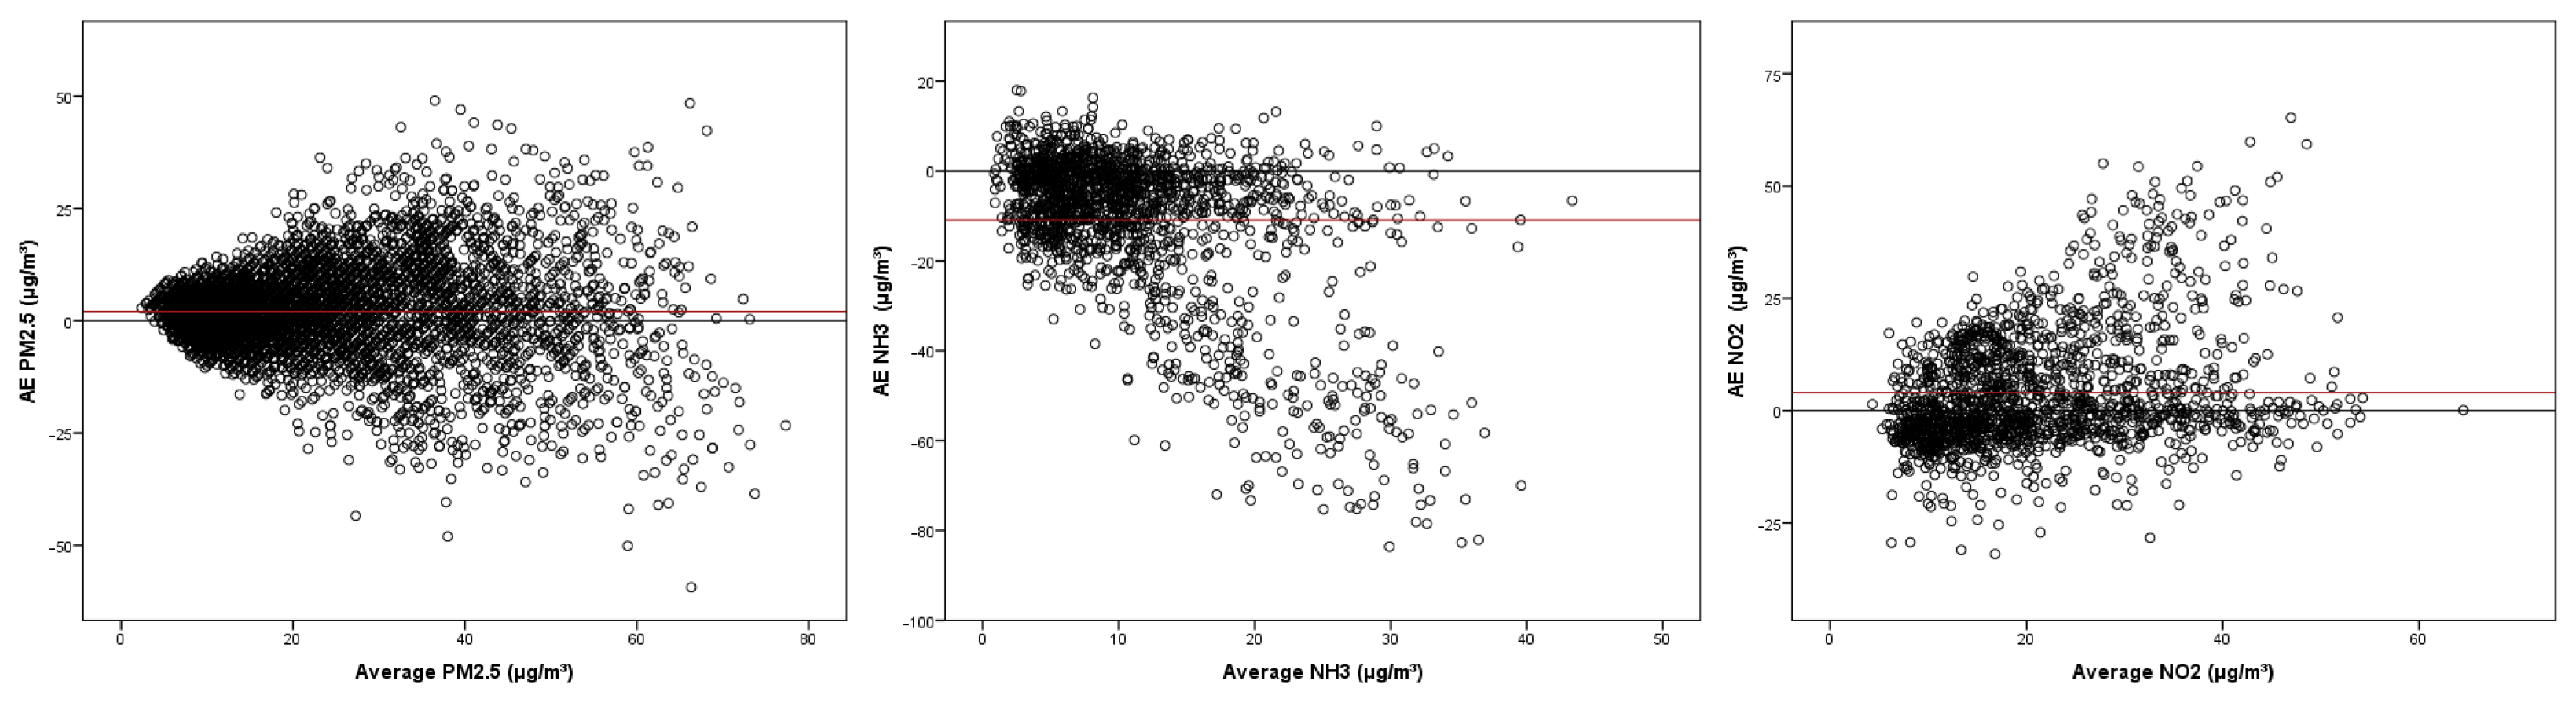
Bland–Altman Plot—Absolute Error (AE; mean ± standard deviation)Assessment of absolute deviations between each pair of pollutants’ concentrationsPM2.5: AE = 2.0 ± 9.5; NH3: AE = −6.5 ± 11.3; NO2: AE = 4.1 ± 13.1
1 Williams et al. [75] criteria: Tier I—Education and Information ( 0.5 < MNB < 0.5 ;   CV < 0.5 ); Tier II—Hotspot Identification and Characterisation ( 0.3 < MNB < 0.3 ;   CV < 0.3 ); Tier III—Supplemental Monitoring ( 0.2 < MNB < 0.2 ;   CV < 0.2 ); Tier IV—Personal Exposure ( 0.3 < MNB < 0.3 ;   CV < 0.3 ); Tier V—Regulatory Monitoring ( 0.1 < MNB < 0.1 ;   CV < 0.1 ).
Disclaimer/Publisher’s Note: The statements, opinions and data contained in all publications are solely those of the individual author(s) and contributor(s) and not of MDPI and/or the editor(s). MDPI and/or the editor(s) disclaim responsibility for any injury to people or property resulting from any ideas, methods, instructions or products referred to in the content.

