Article

Pipeline-Related Residential Benzene Exposure and Groundwater Natural Attenuation Capacity in the Eastern Niger Delta, Nigeria

1
Institute of Geosciences, University of Bremen, 28359 Bremen, Germany
2
Institute of Geoecology, Technical University Braunschweig, 38106 Braunschweig, Germany
*
Author to whom correspondence should be addressed.
Environments 2024, 11(10), 221; https://doi.org/10.3390/environments11100221
Submission received: 16 September 2024 / Revised: 8 October 2024 / Accepted: 9 October 2024 / Published: 11 October 2024
(This article belongs to the Special Issue Research Progress in Groundwater Contamination and Treatment)

Abstract

:
This study was conducted to investigate the presence of benzene in the ground and drinking water in the eastern Niger Delta, where multiple oil and gas production facilities are present. Samples from drinking water wells were collected for measurements of benzene, toluene, ethylbenzene, and xylenes (BTEX). Additionally, the dissolved organic carbon (DOC) concentration was determined for the first time to establish the groundwater’s total hydrocarbon and non-hydrocarbon load. The groundwater BTEX and benzene levels were up to 3904 µg/L and 3500 µg/L, respectively. DOC concentrations were up to 49 mg/L. The highest benzene concentrations were detected in wells near an underground petroleum pipeline. However, the concentrations decreased with distance from the pipeline to levels less than 0.1 µg/L. Despite benzene contamination, the aquifer has shown promising aerobic attenuation potential, having up to a 7.5 (95%) mg/L DO level and 2.11 mg/L BTEX biodegradation capacity for DO. However, the high groundwater temperature of up to 32.5 °C may weaken attenuation. The benzene and BTEX point attenuation rates ranged from 0.128 to 0.693 day−1 and 0.086 to 0.556 day−1, respectively. Hence, by natural attenuation alone, up to 66.5 and 85 years would be required to reach Nigeria’s groundwater benzene and BTEX remediation goals, respectively.

1. Introduction

Using pipelines to transfer oil and gas has become a widespread global practice because they are considered the safest and most economical, particularly when transporting over long distances [1,2]. The Nigerian National Petroleum Corporation (NNPC) maintains a pipeline network of over 5000 km. Since the pipelines are constructed of carbon steel, leakage due to corrosion is a common problem; for example, see [3]. Additionally, problems of pipeline leakages resulting from oil theft/sabotage and vandalism (commonly called bunkering), aging infrastructure, equipment failures, and operational failures have been frequently observed in oil and gas infrastructures worldwide [1,4,5,6,7]. For instance, in Nigeria, Shell Nigeria reported 11,000 barrels per day of crude oil loss in their pipeline networks in 2018 due to leakages, an increment of about 550% compared to the previous year’s data [2]. Such leaks are the main cause of oil losses and can lead to extreme environmental pollution, degradation, and economic losses [6,7,8,9]. Several studies have investigated the occurrence of pipeline leakages into groundwater (e.g., [10,11,12,13,14,15,16,17]), in the submarine environment (e.g., [18,19,20]), and in soils (e.g., [21]) at several locations worldwide. Also, investigations were reported for leakages in soils and groundwater near petroleum facilities and petroleum product spills (e.g., [22,23,24,25,26]), petrol stations, and other gasoline-containing storage facilities (e.g., [27,28,29,30,31,32]). As underground petroleum pipelines leak, the frequently co-occurring monocyclic aromatic compounds, i.e., benzene, toluene, ethylbenzene, and the three forms of xylenes (o, m, p), commonly referred to as BTEX, might be released into groundwater along with other hydrocarbon constituents, including several polycyclic aromatic hydrocarbons and organochlorine compounds [30,33,34,35]. These compounds, especially BTEX, can readily migrate through the soil [36] and contaminate groundwater due to their highly soluble nature. The aqueous solubilities of benzene, toluene, ethylbenzene, and xylenes are 1780 mg/L, 515 mg/L, 161 mg/L, and 204 mg/L, respectively [37,38,39]. To our knowledge, despite the substantial use of underground pipelines for crude oil transfer in the Niger Delta region [40], investigations on groundwater contamination from pipeline-related leakages are unavailable.
Of all the BTEX compounds, benzene is considered the most toxic (e.g., [41]). Prolonged human exposure to benzene can lead to various health issues, including an attack on the central nervous system, the immune system, and the hematopoietic system, cancer (e.g., acute myeloid leukemia, myelodysplastic syndrome, aplastic anemia, and pancytopenia), kidney conditions, liver damage, reduction in the size of women’s ovaries, disruption of the menstrual cycle in women, and many other short-term health effects [42,43,44]. Exposure to TEX compounds can also be detrimental to human health (e.g., [45,46]). As a result, the WHO [42] set a drinking water guideline value of 10 µg/L for benzene. Since groundwater is Nigeria’s primary drinking water source, National Environmental Regulations [47] set a remedial target value of 0.2 µg/L and an intervention value of 30 µg/L for benzene.
In groundwater, benzene undergoes several redox-controlled reactions. Under aerobic conditions, microbes can reduce benzene molecules into less toxic compounds, producing carbon dioxide and water: C6H6 + 7.5O2 → 6CO2 + 3H2O. Although benzene readily degrades under aerobic conditions [48,49,50], the extent of degradation depends on several factors, such as the benzene concentration, the available population of microbes, the availability of oxygen, the available nutrients, the prevailing pH conditions, and the temperature [36,49,51]. Degradation is slow if (1) the benzene concentration is very high and toxic to microbes [52] and (2) the conditions required to change the ring structure of the benzene to carbon dioxide gas molecules during benzene oxidation are not met (the process requires multiple electron transfer and substantial activation energies to remove electrons from the carbon atoms in the benzene ring) [53]. Nevertheless, the fate of benzene in contaminated groundwater systems seems to be primarily controlled by the availability of oxygen as a terminal electron acceptor [54]. Oxygen is rapidly depleted during benzene oxidation due to microbial respiration, creating anoxic conditions [55]. Therefore, to further biodegrade the benzene, an alternative electron acceptor, such as NO3, Mn4+, Fe3+, or SO42−, and other benzene-degrading microbes capable of using the alternative electron acceptor must be available [56,57,58]. This process is, however, usually slow and is often associated with long lag times [54,58], as benzene appears to be more persistent under anaerobic conditions than the TEX compounds [54].
Nevertheless, these natural processes, collectively referred to as natural attenuation (NA), can significantly reduce the concentration, mobility, bioavailability, and toxicity of benzene in groundwater. As a well-known clean-up measure for petroleum-contaminated groundwater, assessing the NA potential at contaminated sites is important. Although NA has been widely applied (e.g., [59,60,61,62,63]), studies of its effectiveness in attenuating the petroleum-contaminated groundwater in the eastern Niger Delta have not been conducted.
The hydrocarbon-contaminated areas in the Niger Delta provide a unique opportunity to investigate benzene contamination and improve our understanding of NA and the time required to reach Nigeria’s groundwater clean-up goal by NA under aerobic conditions. To our knowledge, only a single study has been published on benzene occurrence in groundwater in the entire region [26]. That study reported concentrations that ranged from 0.155 to 48.2 μg/m3 in indoor air and 161 to 9280 μg/L in groundwater. Benzene data for Alode and Okochiri does not exist. Total petroleum hydrocarbon concentration in groundwater ranged from 649 to 86,100 μg/L in Nsisioken Agbi Ogale and 1310 to 16,500 μg/L in Nkeleoken-Alode. Soil remediation was carried out in the affected community recently following UNEP recommendations, but published data on the current benzene level in the groundwater of Nsisioken Ogale and many other affected communities in the region are unavailable. Here, several investigations reported various disease symptoms associated with oil pollution, such as kidney diseases, respiratory problems, skin rashes, congenital disabilities, diabetes, headache, dizziness, throat irritation, and chest pain (e.g., [64,65,66]). Furthermore, Howard, Okpara [67] and Enuneku, Ogbeide [68] reported a high cancer risk in the region due to oil pollution. Particularly detrimental is benzene since, through dermal absorption alone, the risk of contracting leukemia can increase by 70% (e.g., [69]).
Since long-term exposure to benzene presents acute risks to human health [42], assessing its concentration and fate remains essential to ensure the safe use of groundwater as a source of drinking water. This paper presents (i) the current level and distribution of benzene, (ii) source information, and (iii) the potential and rates of the NA and biodegradation capacity for benzene-contaminated groundwater in the eastern Niger Delta, Nigeria.

2. Materials and Methods

2.1. Site Description, Geology, and Hydrogeology

The study site is located in the eastern part of the petroleum-rich Niger Delta Region of Nigeria (Latitude 4°44′57″ N to 4°47′42″ N and Longitude 7°5′26″ E to 7°6′52″ E), where several oil spills were reported by UNEP [26]. Groundwater samples were collected from the Okochiri in the Okrika Local Government Area, Alode, and Ogale in the Eleme Local Government Area of Rivers State. The sampling locations and the oil and gas production facilities are shown in Figure 1. Okochiri is situated between the Port Harcourt Refinery (PHR) and the Okochiri Creek at approximately 4 m above sea level. Groundwater is flowing to the SSW. The community is characterized by (1) the Nigerian National Petroleum Corporation Limited (NNPCL) underground petroleum pipeline, which runs from the refinery to Umu Nwa (through Alode and Ogale), and the Indorama Eleme Petrochemicals Plant (through Alode and Aleto), (2) the Pipelines and Products Marketing Company (PPMC) 12-joint surface pipeline, which runs from the refinery to the Nigerian Port Authority (Rivers Port Complex), and (3) the wastewater discharge channel stretching for over 1 km from the PHR (through the Okochiri) to Okochiri Creek. Alode is characterized by the presence of (1) the Shell Petroleum Development Corporation (SDPC)-owned underground pipeline, (2) the NNPCL-owned refined petroleum product pipeline, and (3) two petroleum truck parking stations situated on the edge of the PHR to the north, and the north-west. Soil remediation for oil spill clean-up was completed at this location in April 2021. It was overseen by the Hydrocarbon Pollution Remediation Project (HYPREP) (an agency established in July 2012 under the Nigerian Ministry of Petroleum to manage the implementation of recommendations in the UNEP [26] report).
Similarly, Ogale is characterized by (1) the presence of both SPDC- and NNPCL-owned petroleum crude and product pipelines, (2) the intersection of several petroleum pipelines, including the SPDC-owned 28-inch trunk line, which runs from Rumuekpe to Bomu, the 36-inch trunk line, which runs from Nkpoku to New Ebubu, and the abandoned 20-inch trunk line, which runs from the Rumuekpe manifold to the Bomu manifold [26], and (3) petroleum-contaminated drainage systems resulting from sales of petroleum products in plastic containers at roadside stalls. Although the pipelines run underground, visible signs indicate their routes and the width extent in the three communities. Nevertheless, residential houses have been built next to the pipelines, the closest within 5 m from the pipelines.
Geologically, the region comprises three (3) major lithostratigraphic units: the (1) Benin Formation, (2) Agbada Formation, and (3) Akata Formation [70]. The Benin Formation is Oligocene to Recent in age. It mainly comprises coarse-grained, sub-angular to well-rounded, and poorly sorted coastal plain sand and alluvial deposits at shallow horizons [71,72]. The formation, which extends to a depth of about 2 km [73], serves as a groundwater reservoir for the region [74]. It also has excellent water-yielding capacity, up to 6 to 9 L/s [75]. The groundwater resources can be tapped within 3 to 300 m depth within the formation [76]. Based on the hydrostratigraphic unit model developed by Akpokodje, Etu-Efeotor [77], the Benin Formation is considered homogeneous, and the groundwater flow direction is to the SSW. The Agbada Formation, Eocene to Recent, consists of a coastal sequence of alternating marine sands and shales [71,78]. It extends to a depth of up to 3.7 km [73]. Obaje [70] reported that the sand percentage variation within the formation ranges between 30 to 70%. The Paleocene—Recent Akata Formation consists of basal marine thick-shale units with <30% sand intercalations and little silt and clay [70,71]. The formation extends up to 7 km in depth [79]. The marine shales in the Agbada and the Upper Akata Formation are considered a source rock for the petroleum hydrocarbon in the region [72,80,81,82].
Both shallow and deeper wells tap the aquifers of the Benin Formation. They comprise clay units, unconsolidated sand, and sandy gravels of about 95 to 99% quartz grains [83]. The 2800 to 4000 mm/year precipitation rate, vast catchment area, geology, north–southwards groundwater flow, and rivers and streams contribute to the region’s high perennial aquifer recharge [84,85]. Consequently, the increased precipitation, sea level rise, flood and coastal erosion, poverty, coastal location, and intensive oil and gas industrial activities have left the shallow groundwater vulnerable to pollution [86,87,88,89]. However, deep-seated aquifers are considered safe and less vulnerable due to the intercalations of clay units [85]. The protection of the Benin Formation’s aquifers remains vital since the entire population in the region depends on them for their drinking water.

2.2. Groundwater Sampling

Groundwater samples were collected in May 2021, April 2022, and April 2023 (50 samples in 2021 and 53 samples in 2022 and 2023) for DOC, cations, anions, and trace metal analysis. Samples were filtered through 0.45 μm cellulose acetate (CA) membrane filters and collected into 25 mL glass vials for DOC, 30 mL brown HDPE vials for major cations, and 20 mL Zinnser vials for anions and trace metals. The sub-samples for DOC and major cations were preserved with 1% concentrated hydrochloric acid (HCl) and stored at 4 °C until transported to the laboratory for analysis. Samples were also collected for BTEX analysis during the 2022 and 2023 field campaigns.
The samples were collected from shallow wells (1 to 30 m) within the Benin Formation that serve as private supply wells (PSWs) and community supply wells (CSWs). Sampling locations were in three communities with suspected hydrocarbon contamination: Alode, Ogale, and Okochiri (Figure 1). In Alode, 17 samples were collected from PSWs within 350 m of the pipeline. In Ogale, 14 samples were collected from PSWs within 640 m of the pipeline. Similarly, 22 samples collected in both PSWs and CSWs in Okochiri were within 285 m from the pipeline. In addition, 4 samples (REF 1 to REF 4) were collected in areas considered unaffected by oil and gas activities in Alode, Ogale, and Okochiri (Figure 1). The groundwater sampling for BTEX measurement followed the US EPA method 5021A [90]. Duplicate samples were collected unfiltered in 22 mL headspace vials, preserved with one spatula tip of CuSO4/Na2SO4, and stored at 4 °C until transported to the laboratory for analyses.
To ensure that “true or fresh” groundwater samples were collected, sampling was conducted during the early hours (between 6:00 and 8:00 a.m.) when residents were using the wells. Samples were collected by pumping where wells already had electric submersible pumps installed. First, groundwater was pumped into overhead storage tanks to purge the wells for 30 min before sampling directly from the wellhead. Manual sample collection was completed with a water bail made of polyvinyl chloride. The bail was rinsed with water from the well three times before collecting a sample. All samples were collected fresh after pumping.
The pH, conductivity, total dissolved solids (TDS), temperature, dissolved oxygen (DO), salinity, redox potential (ORP), and resistivity were immediately determined in situ using a Hanna instrument HI98494 multiparameter. The total alkalinity (CaCO3) was determined in the field by colorimetric titration with 0.16 N H2SO4 in combination with a bromcresol green-methyl red indicator. The bromcresol green-methyl red indicator powder was added to 100 mL of the groundwater sample and titrated using a Hach digital titrator to a light pink color. The total alkalinity was reported as CaCO3.
During the sampling, a strong petroleum odor was observed in most wells, especially in Alode. Samples with a strong petroleum odor also had free-phase petroleum hydrocarbon on the water surfaces, especially when left to sit for up to 10 min. Subsequently, a change in color, from colorless to reddish-brown, was observed in some samples collected within 5 m from the pipeline. Unfortunately, it was impossible to determine the water table and well depth for most wells because the wellheads were sealed with concrete slabs to prevent surface contamination and the theft of submersible pumps installed in the wells. Most well owners rejected unsealing the wells for depth measurement during sampling. In those wells where measurement was possible, the water table and well depth ranged from 1 to 11 m and 9.8 to 30 m, respectively.

2.3. Analytical Procedures

2.3.1. Determination of BTEX and DOC

The BTEX measurements were performed using the “DIN 38407-F 43: 2014-10” method. The method combines gas chromatography and mass spectrometry using the static headspace technique (HS-GC/MS). The instrument used for the measurement was the Shimadzu QP2020 with GC-2030 and HS-20 Trap. If necessary, the samples were diluted before measurement. Five MilliQ water (Sartorius Inc., Göttingen, Germany) samples and five reference groundwater samples were measured, along with the study samples, for quality control.
Dissolved organic carbon (DOC), a fraction of organic carbon that can pass through the 0.45 μm pore size, was determined using a Shimadzu TOC analyzer TOC-V CPN (Shimadzu Corporation, Kyoto, Japan). A certified Total Organic Carbon Standard of 50 mg/L (Aqua Solution Inc., Deer Park, TX, USA) was used to check the accuracy and precision of the method. The measurement error observed was <6%.

2.3.2. Anion and Cation Measurements

Major cations and trace metals were determined by inductively coupled plasma-optical emission spectrometry (ICP-OES) using a Perkin Elmer Optima 7300 DV instrument (Waltham, MA, USA). Measurement precision was checked using EnviroMAT Groundwater Low (ES-L-2) and High (ES-H-2) certified water from SCP Science, Baie-d’Urfé, QC, Canada, showing errors of <3% for all analytes. Also, the accuracy of the measurement was checked using an internal standard, and errors < 4% were observed. Anions were determined using a Metrohm 883 Basic IC plus instrument (Herisau, Switzerland) with a 5 μL injection loop and a Metrosep A Supp5 (150 × 4.0 mm; 5 μm) column. The accuracy and precision of the measurement were checked with an internal standard, and errors < 10% were recorded.

2.3.3. Expressed Biodegradation Capacity and Natural Attenuation Rate

Based on Wiedemeier, Rifai [59], the calculation of the expressed biodegradation capacity (EBC) was used to estimate the amount of BTEX degraded by a given terminal electron-accepting process (dissolved oxygen (DO) in this study):
E B C D O = [ C B C P ] F
where EBCDO (mg/L) = expressed biodegradation capacity for dissolved oxygen, CB (mg/L) = average background concentration of the DO, CP (mg/L) = the concentration of the DO within the plume, and F = the BTEX utilization factor using DO. Furthermore, point attenuation rates and half-lives were calculated for benzene and BTEX, following methods described by Newell [91], McAllister and Chiang [92], and Bockelmann, Zamfirescu [93], shown in Equation (2), which is transformed into Equation (3). The natural logarithm of benzene and BTEX concentrations were plotted against time to obtain the point attenuation.
C t = C 0 e k t
l n C t = k t × l n C 0
where Ct = concentration of attenuated contaminant at time t (mg/L), C0 = the initial concentration of contaminant (mg/L), t = time (days) after attenuation, and k = the first-order attenuation (decay) rate constant (day−1). The half-life, t1/2 (days) (i.e., the time required to attenuate the initial concentration of the contaminant by 50%) was computed using Equation (4):
t 1 / 2 = l n ( 2 ) / k
Furthermore, using Equation (5), the time required to reach the contaminant remediation goal can be estimated. Here, we used 1.3 mg/L, 0.620 mg/L, 1.0 mg/L, and 0.460 mg/L as Cinitial for benzene and 1.305 mg/L, 0.6225 mg/L, 1.1194 mg/L, and 0.4609 mg/L as Cinitial for BTEX in samples W–21, W–22, W–12, and W–1, respectively, to calculate the time required to reach Nigeria’s groundwater remediation goal for benzene (i.e., 0.2 µg/L) and BTEX (i.e., 0.8 µg/L) [47].
t g o a l = [ l n ( C g o a l / C i n i t i a l ) ] / k
where tgoal = the time (days) required to reach goal concentrations Cgoal (mg/L); Cinitial = the initial concentration of contaminant (mg/L)

3. Results and Discussion

3.1. Results

3.1.1. Field Measurements and Chemical Data

The groundwater’s physicochemical and inorganic chemical composition showed slight variations in concentration between the three communities (Table 1). The pH was slightly acidic, in the range of 4.7 to 6.3, 4.1 to 6.6, and 4.5 to 6.1 in Alode, Ogale, and Okochiri, respectively. Overall, the mean pH in the groundwater across the three communities showed only slight differences in the order of Ogale > Alode > Okochiri; however, the pH values were mainly below the WHO [42] drinking water guideline range of 6.5 to 8.5, a likely result of the breakdown of petroleum hydrocarbon into organic acid by microbes. Lin, Chaocheng [94] observed a decrease in the pH when microbes degraded hydrocarbons in aqueous systems.
The electrical conductivity (EC) values in the drinking water were relatively low across the three communities, ranging from 20 to 106 µS/cm, 20 to 364 µS/cm, and 21 to 207 µS/cm in Alode, Ogale, and Okochiri, respectively. The EC values showed slight differences in the order of Alode > Okochiri > Ogale. Similarly, total dissolved solids (TDS) in the groundwater ranged from 10 to 53 mg/L, 10 to 183 mg/L, and 11 to 105 mg/L in Alode, Ogale, and Okochiri, respectively. The wide range in EC and TDS values is controlled by the salinity (r = 0.99) and Cl (r = 0.53) distribution in the study area. While the source of the salinity and Cl values has not been established yet, the concentrations might be heavily influenced by anthropogenic activities, e.g., the indiscriminate disposal of household wastes into community drainages. Notably, the Cl concentrations were not influenced by the distance from the coast. The concentrations were lower in PSWs near the coast and higher in PSWs near the community drainages. Leachates from those drainages, which often contain contaminants, including Cl, infiltrate the groundwater and increase its Cl levels [95]. The EC, TDS, Cl, and salinity levels at the reference sites, which have comparatively less anthropogenic influence, had less variation, ranging from 19 to 24 µS/cm EC, 9 to 12 mg/L TDS, 4 to 6.6 mg/L Cl, and 0.01 PSU salinity. The EC, TDS, and Cl values were consistent with the findings by Eyankware, Akakuru [96], Nwankwoala and Walter [97], and Abam and Nwankwoala [85]. Although the study area is in a coastal region, there was no indication of saltwater intrusion. Groundwater salinity values ranged from 0.01 to 0.1 PSU (Alode), 0.01 to 0.17 PSU (Ogale), and 0.01 to 0.1 PSU (Okochiri).
The concentrations of the major ions and trace metals in the groundwater were generally within the acceptable drinking water guidelines set by the WHO [42]. However, other trace metals (e.g., As, Cr, Ni, Co, and Zn) were not detected in the groundwater. Since the aquifer comprises coastal plain sands of >95% quartz grains [83], limited ion exchange and minimal dissolution are expected, given that quartz is relatively inert under typical groundwater conditions. As such, the low TDS, EC, and major ion values are attributed to the dominance of quartz grains in the aquifer.
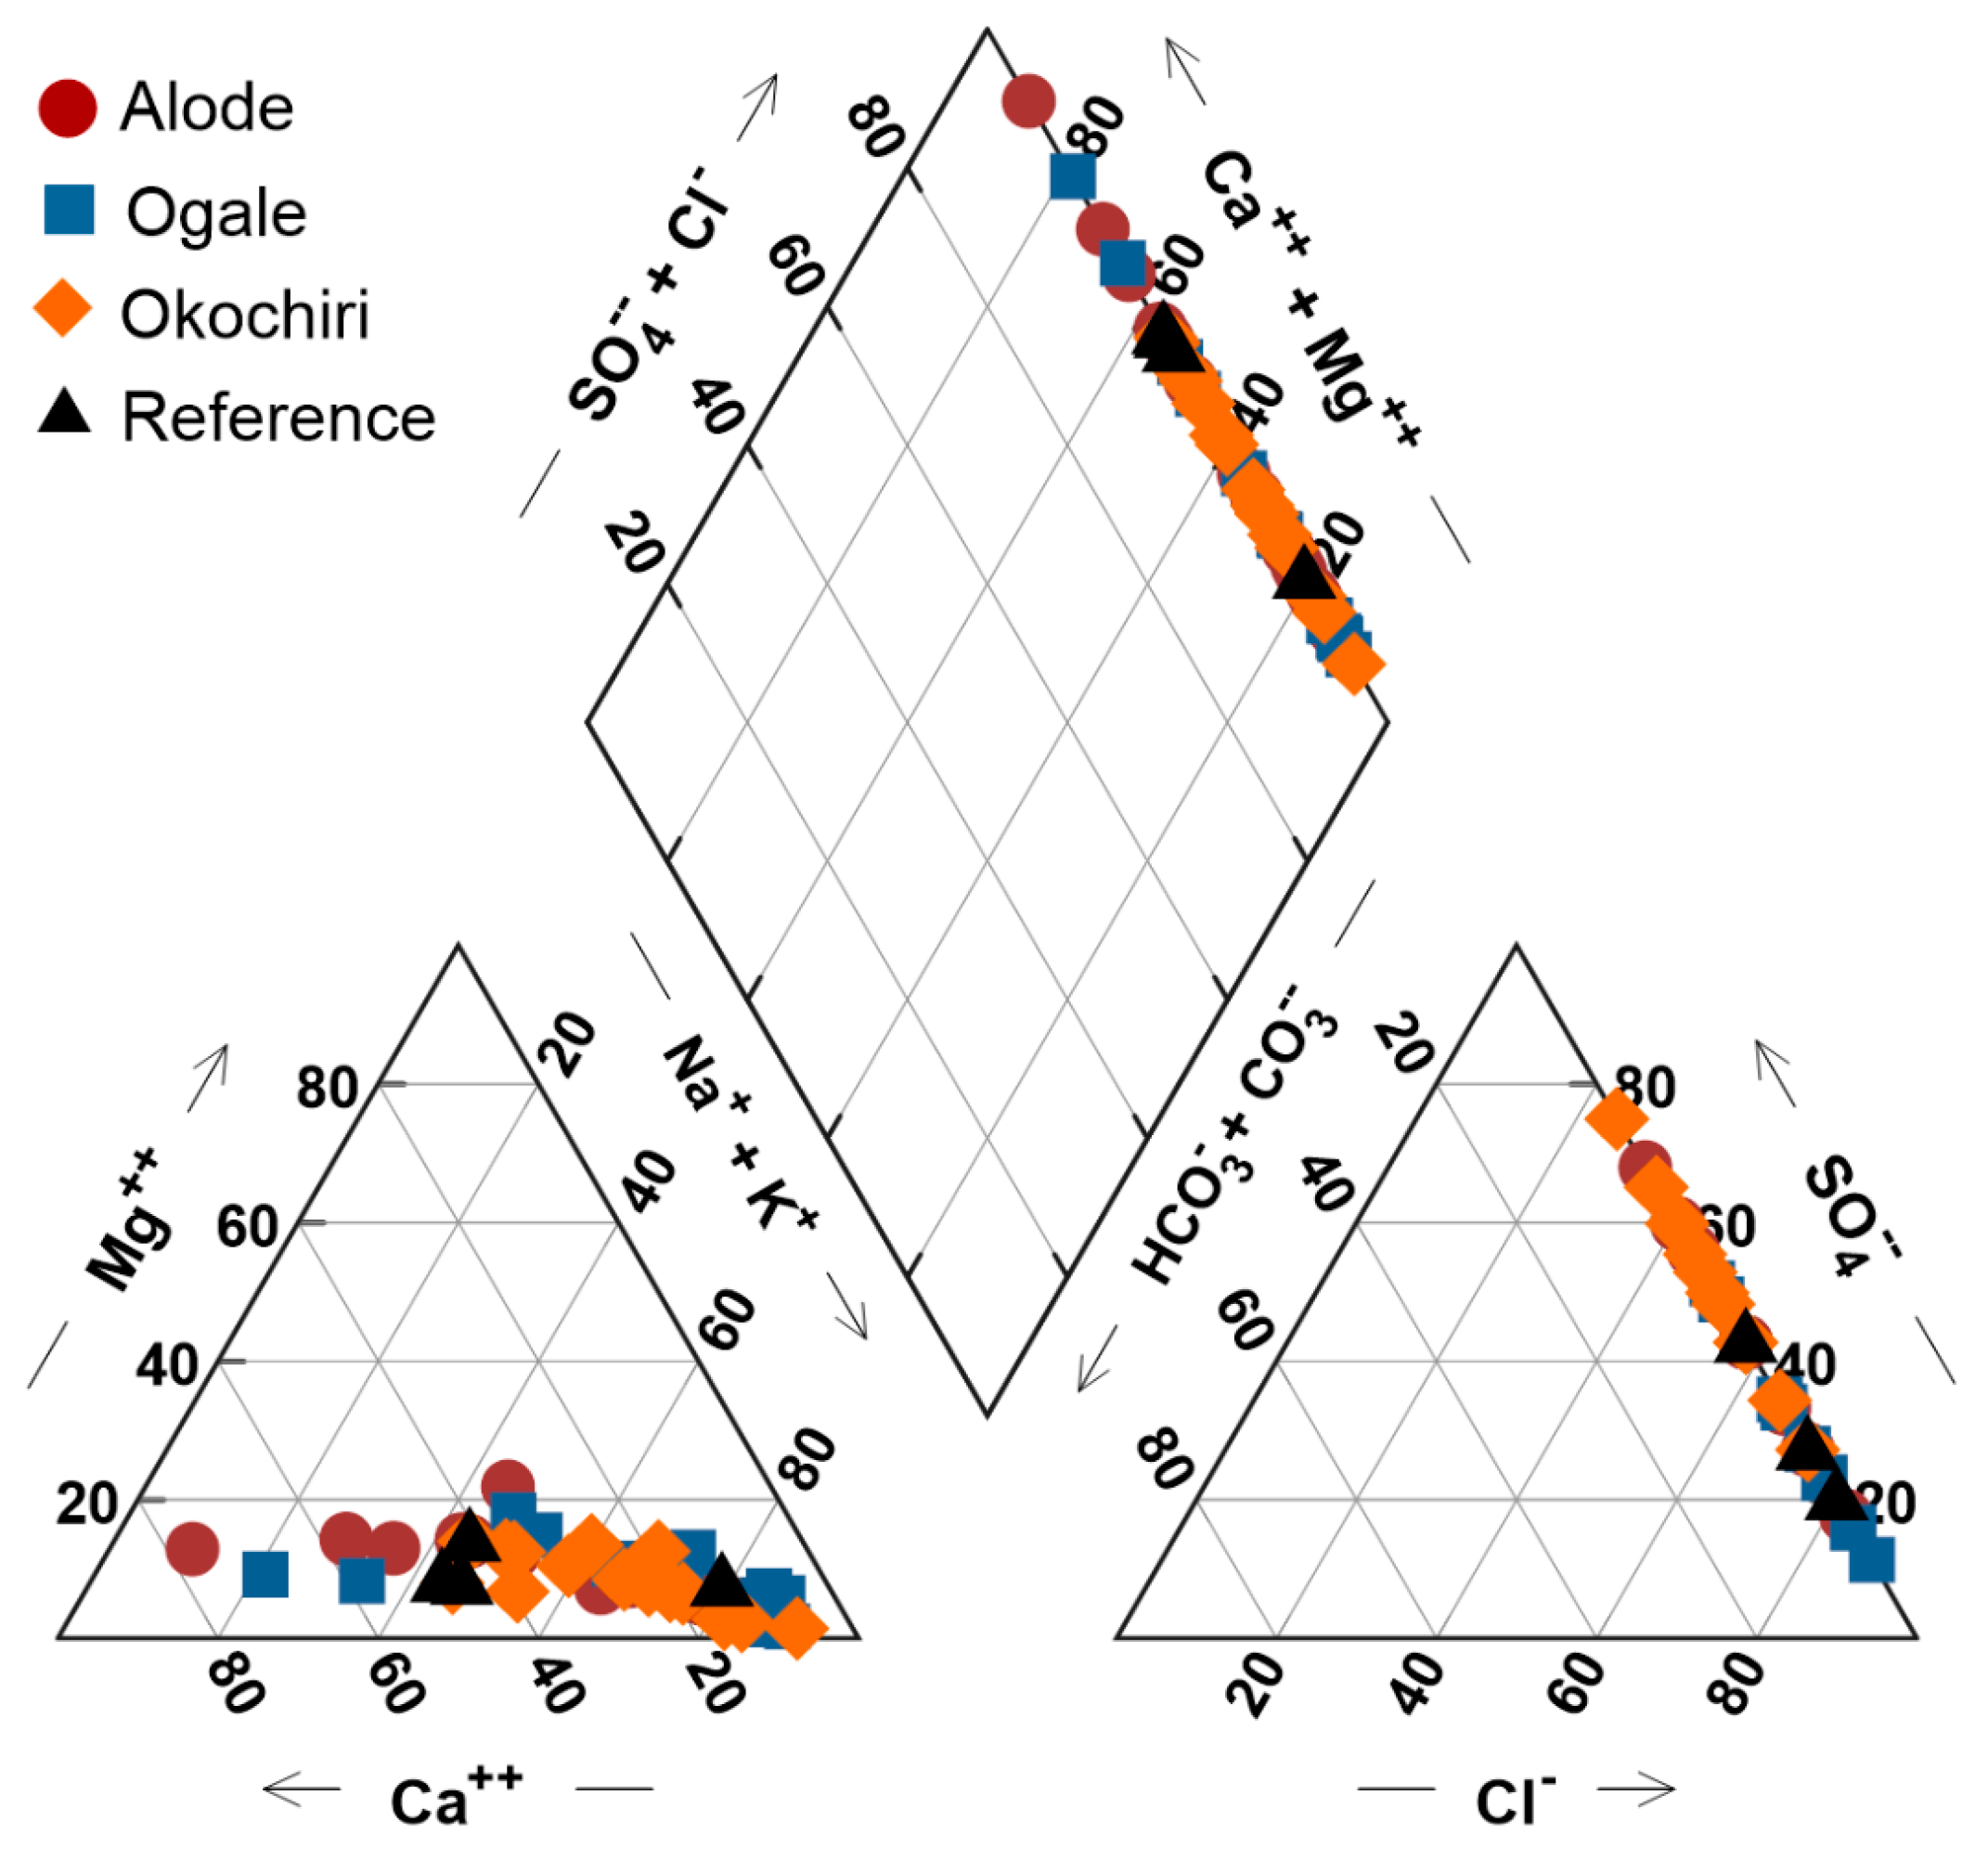
Based on the major ions, the hydrochemical facies of the groundwater were evaluated through the trilinear Piper diagram [98]. Two water types were identified: sodium–chloride (Na-Cl, 74%) and calcium–chloride (Ca-Cl, 26%) (Figure 2). In Alode, the facies were 62% Na-Cl and 38% Ca-Cl type. In Ogale, the facies were 75% Na-Cl and 25% Ca-Cl type; whereas, in Okochiri, closest to the coast, the facies were 83% Na-Cl and 17% Ca-Cl type. Despite the Na-Cl type’s dominance, there was no incidence of saltwater intrusion in the groundwater (salinity: 0.01 to 0.17 PSU). Anthropogenic influence, rather than mixing freshwater with saltwater, was likely responsible for the Na-Cl water type in this study.

3.1.2. Benzene and TEX Concentration

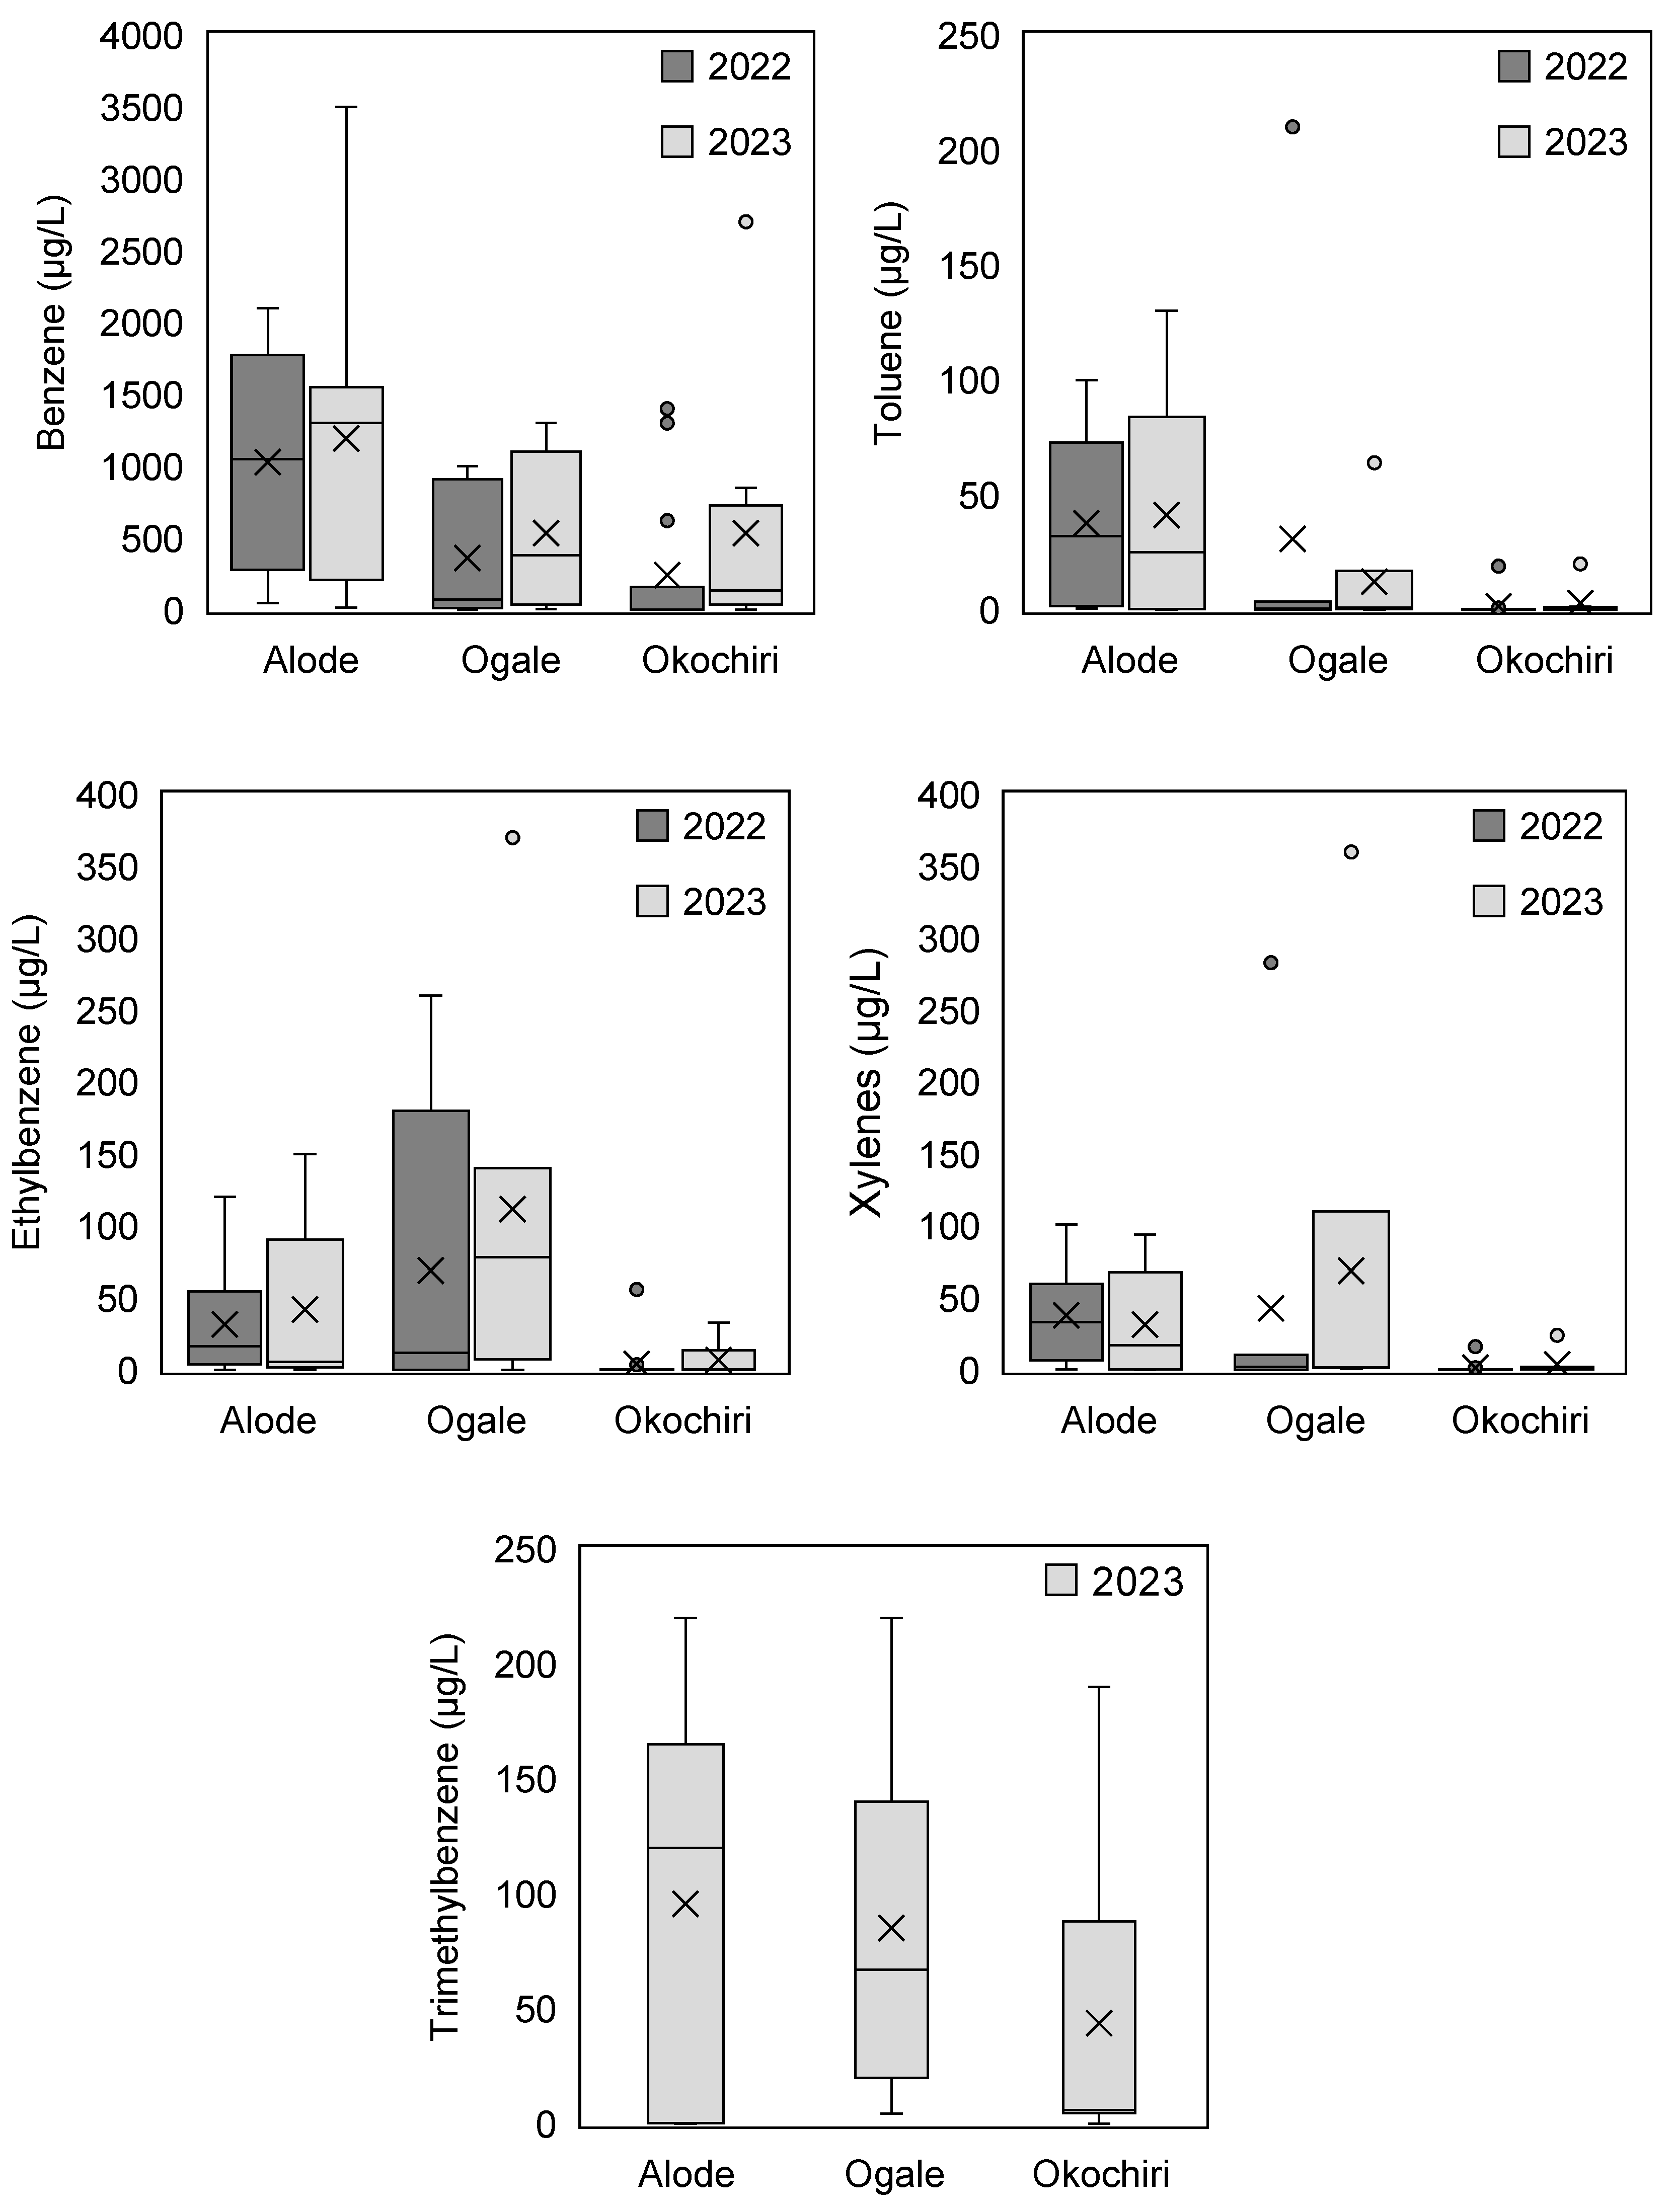
As shown in Figure 3, the concentration of benzene, toluene, ethylbenzene, xylenes, and trimethylbenzene varied between less than 0.1 and 3500 µg/L, less than 0.1 to 210 µg/L, less than 0.1 to 370 µg/L, less than 0.1 to 360 µg/L, and less than 0.1 to 220 µg/L. The total BTEX levels ranged from 0.1 to 3904 µg/L.
Although benzene, toluene, ethylbenzene, trimethylbenzene, and xylenes were released into the subsurface simultaneously, their concentrations vary significantly in the groundwater. The benzene concentration dominates in the wells, with a Pearson correlation coefficient of r = 0.97 in 2022 and 2023. Figure 3 and Figure 4 show the percentage comparison between concentrations of benzene, toluene, ethylbenzene, xylenes, and trimethylbenzene in Alode, Ogale, and Okochiri, demonstrating the dominance of benzene in the study groundwaters. Overall, the order of abundance was benzene > trimethylbenzene > ethylbenzene > xylenes > toluene. In 2022, benzene constituted 91% in Alode, 72% in Ogale, and 97% in Okochiri. In 2023, those values were 85% in Alode, 66 % in Ogale, and 90% in Okochiri.

3.1.3. Dissolved Organic Carbon (DOC)

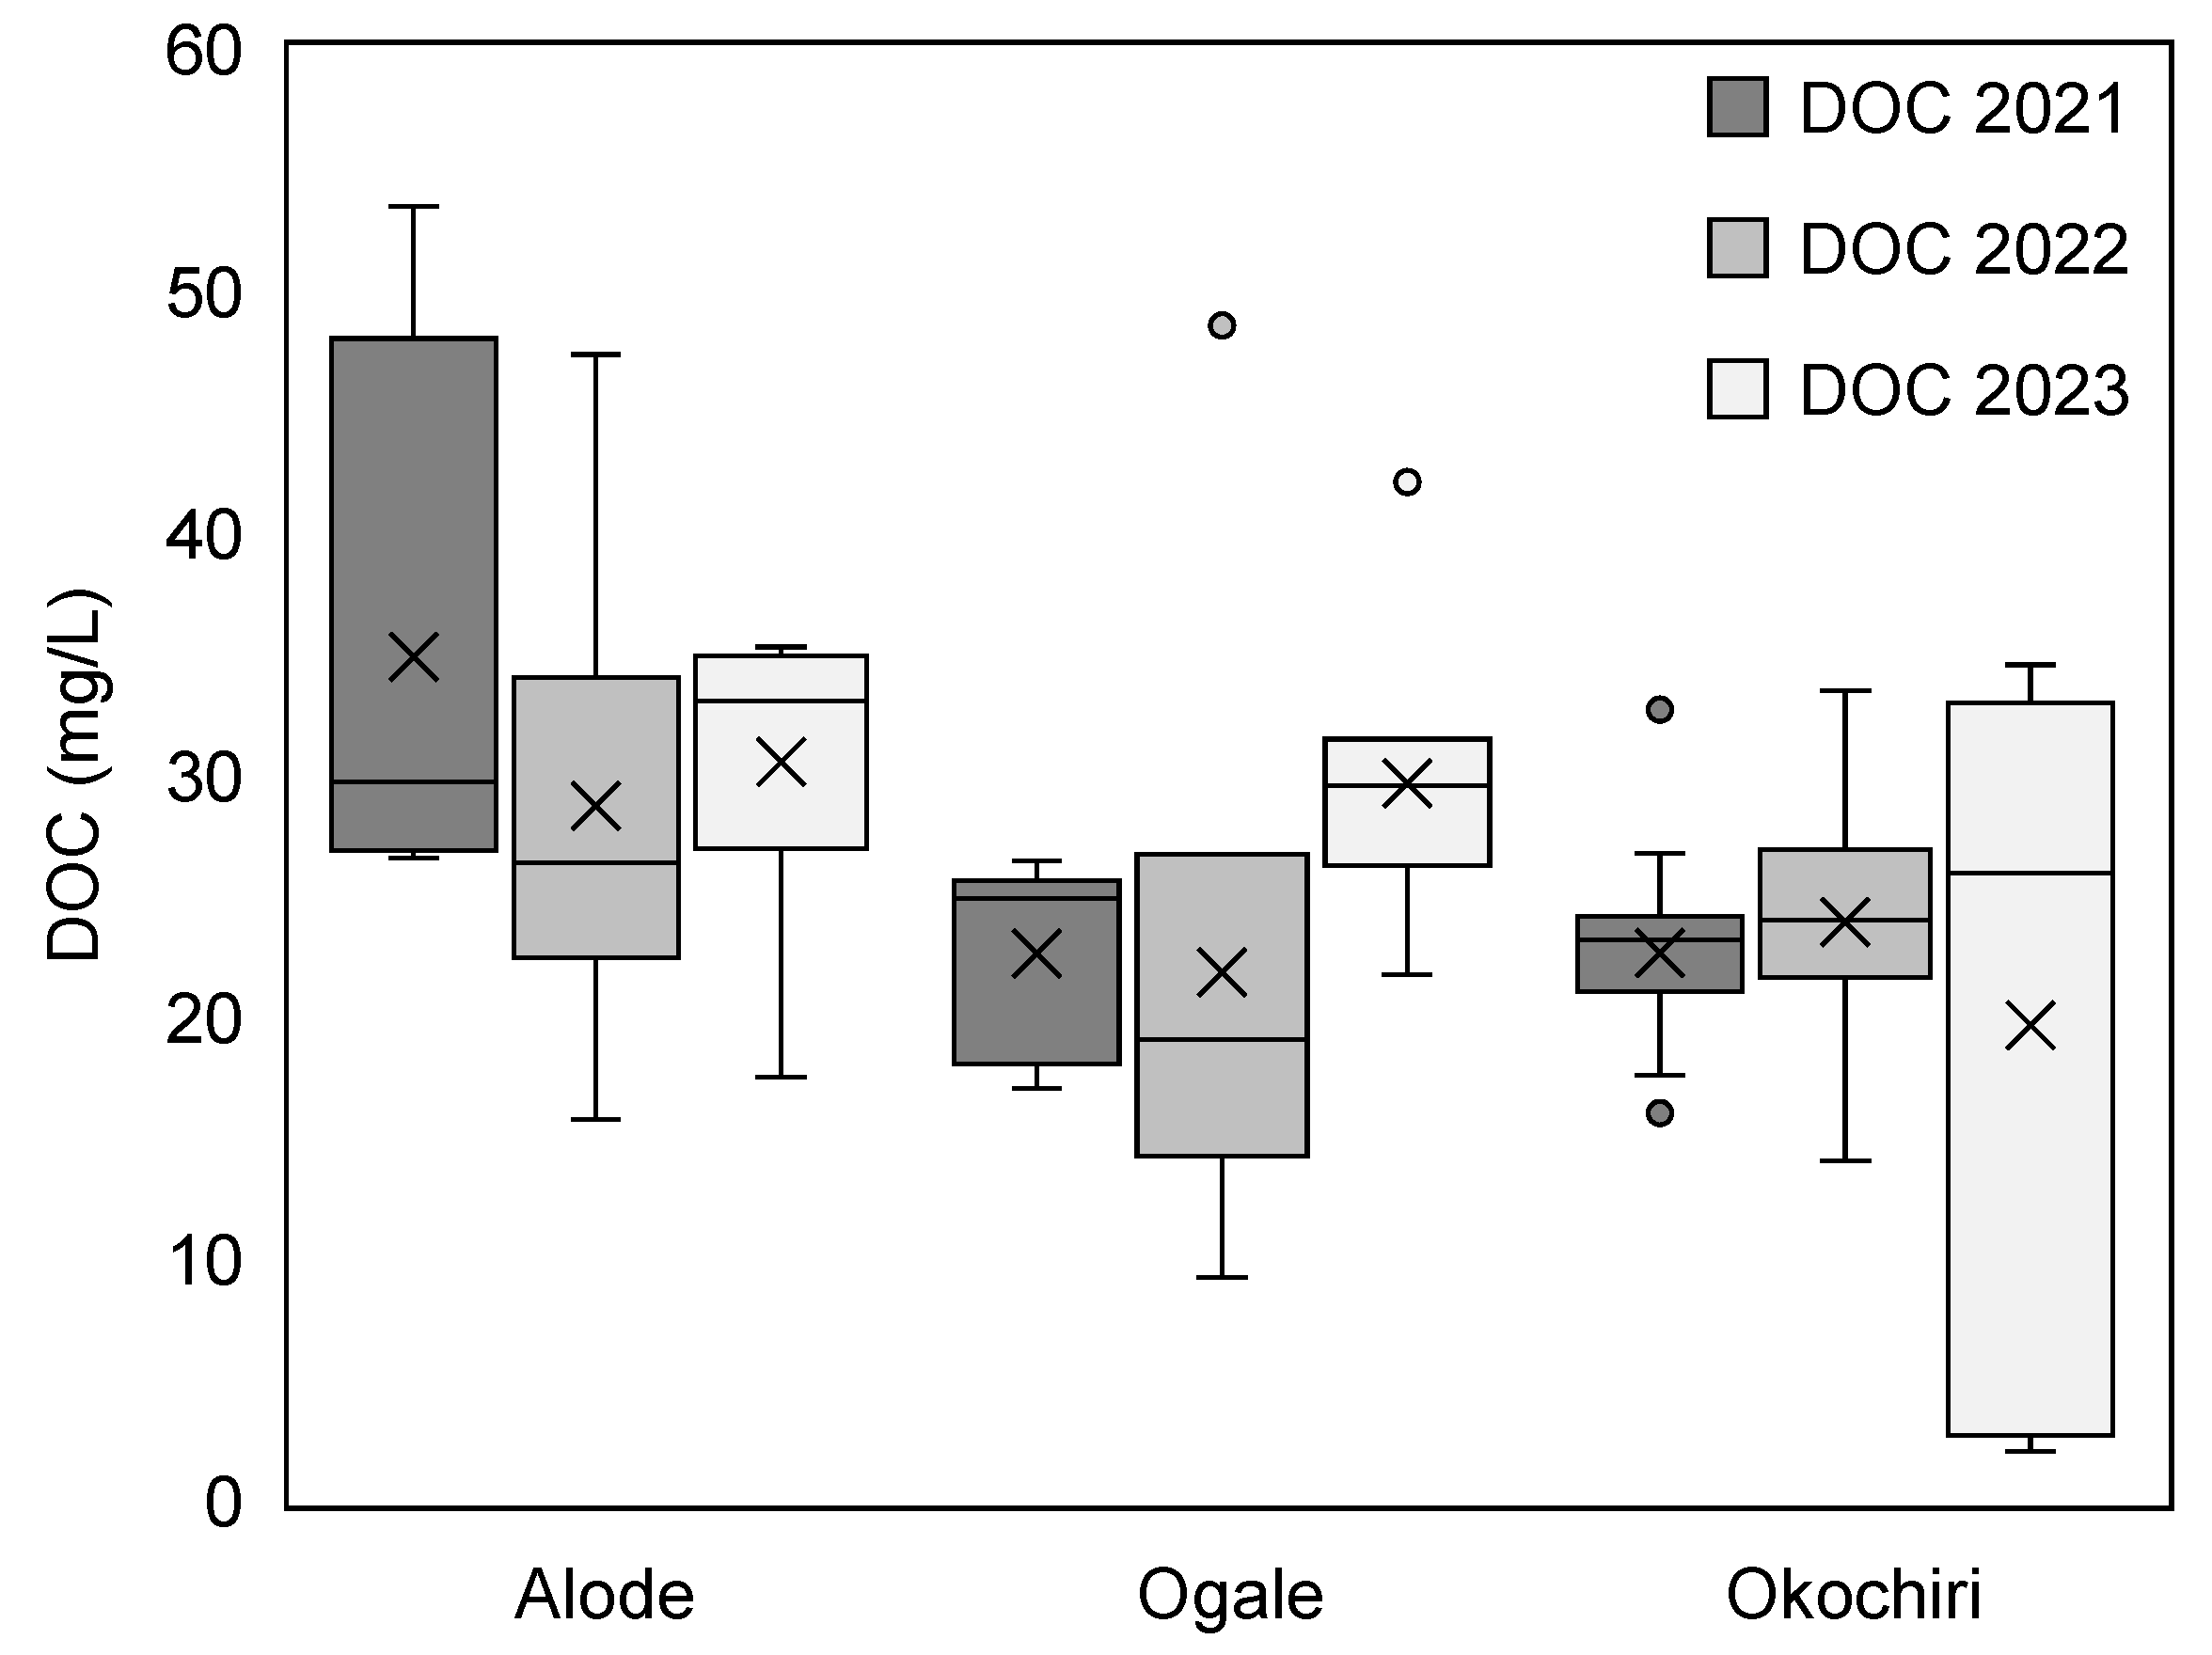
The DOC results are given in Figure 4 and Table 1. The concentrations varied between 2.7 and 54 mg/L. Overall, high concentrations were observed in wells with a strong hydrocarbon odor. Concentrations across the study sites were consistently within the same range throughout the sampling campaign, averaging 26 mg/L, 26 mg/L, and 28 mg/L for Okochiri, Ogale, and Alode, respectively.

3.2. Discussion

3.2.1. The Source, Transport, and Fate of the Benzene

Source

At Alode, the benzene concentration in the groundwater was up to 3500 µg/L. The elevated benzene concentrations in the groundwater were found along the NNPCL petroleum pipeline, which runs from the PHR to Umu Nwa, passing through Alode and Ogale. Samples from wells on the western side of the NNPCL pipeline had a strong hydrocarbon odor and free-phase hydrocarbon when left to sit for a few minutes. In contrast, the wells on the pipeline’s eastern side do not show similar characteristics. As groundwater flows in the SSW direction, benzene is transported in that direction, contaminating wells on the pipeline’s eastern side. Concentrations ranging from 220 to 3500 µg/L occur between 1 and 550 m, while lower concentrations occurred in PSWs further away from the pipeline. Nevertheless, all the sampled wells in 2022 and 2023 had elevated benzene, up to 350 times higher than the WHO-recommended drinking water value of 10 µg/L.
In Ogale, the benzene level was up to 1300 µg/L in the groundwater. Like the situation in Alode, wells on the western side of the NNPCL-owned petroleum pipeline had a strong hydrocarbon odor with free-phase hydrocarbon when left to sit for a few minutes. However, similar behavior was not observed in wells sited on the eastern side of the pipeline. Elevated benzene concentrations, up to 1300 µg/L, were observed at a distance of up to 700 m from the pipeline, along the groundwater flow direction. UNEP [26] observed a high benzene concentration in PSW 11 (labeled 001-005-BH-102 in their study), but the concentration was approximately eight times higher than our data in that well. This may be attributed to the NA effect due to DO availability and the soil remediation by HYPREP in Ogale in 2021.
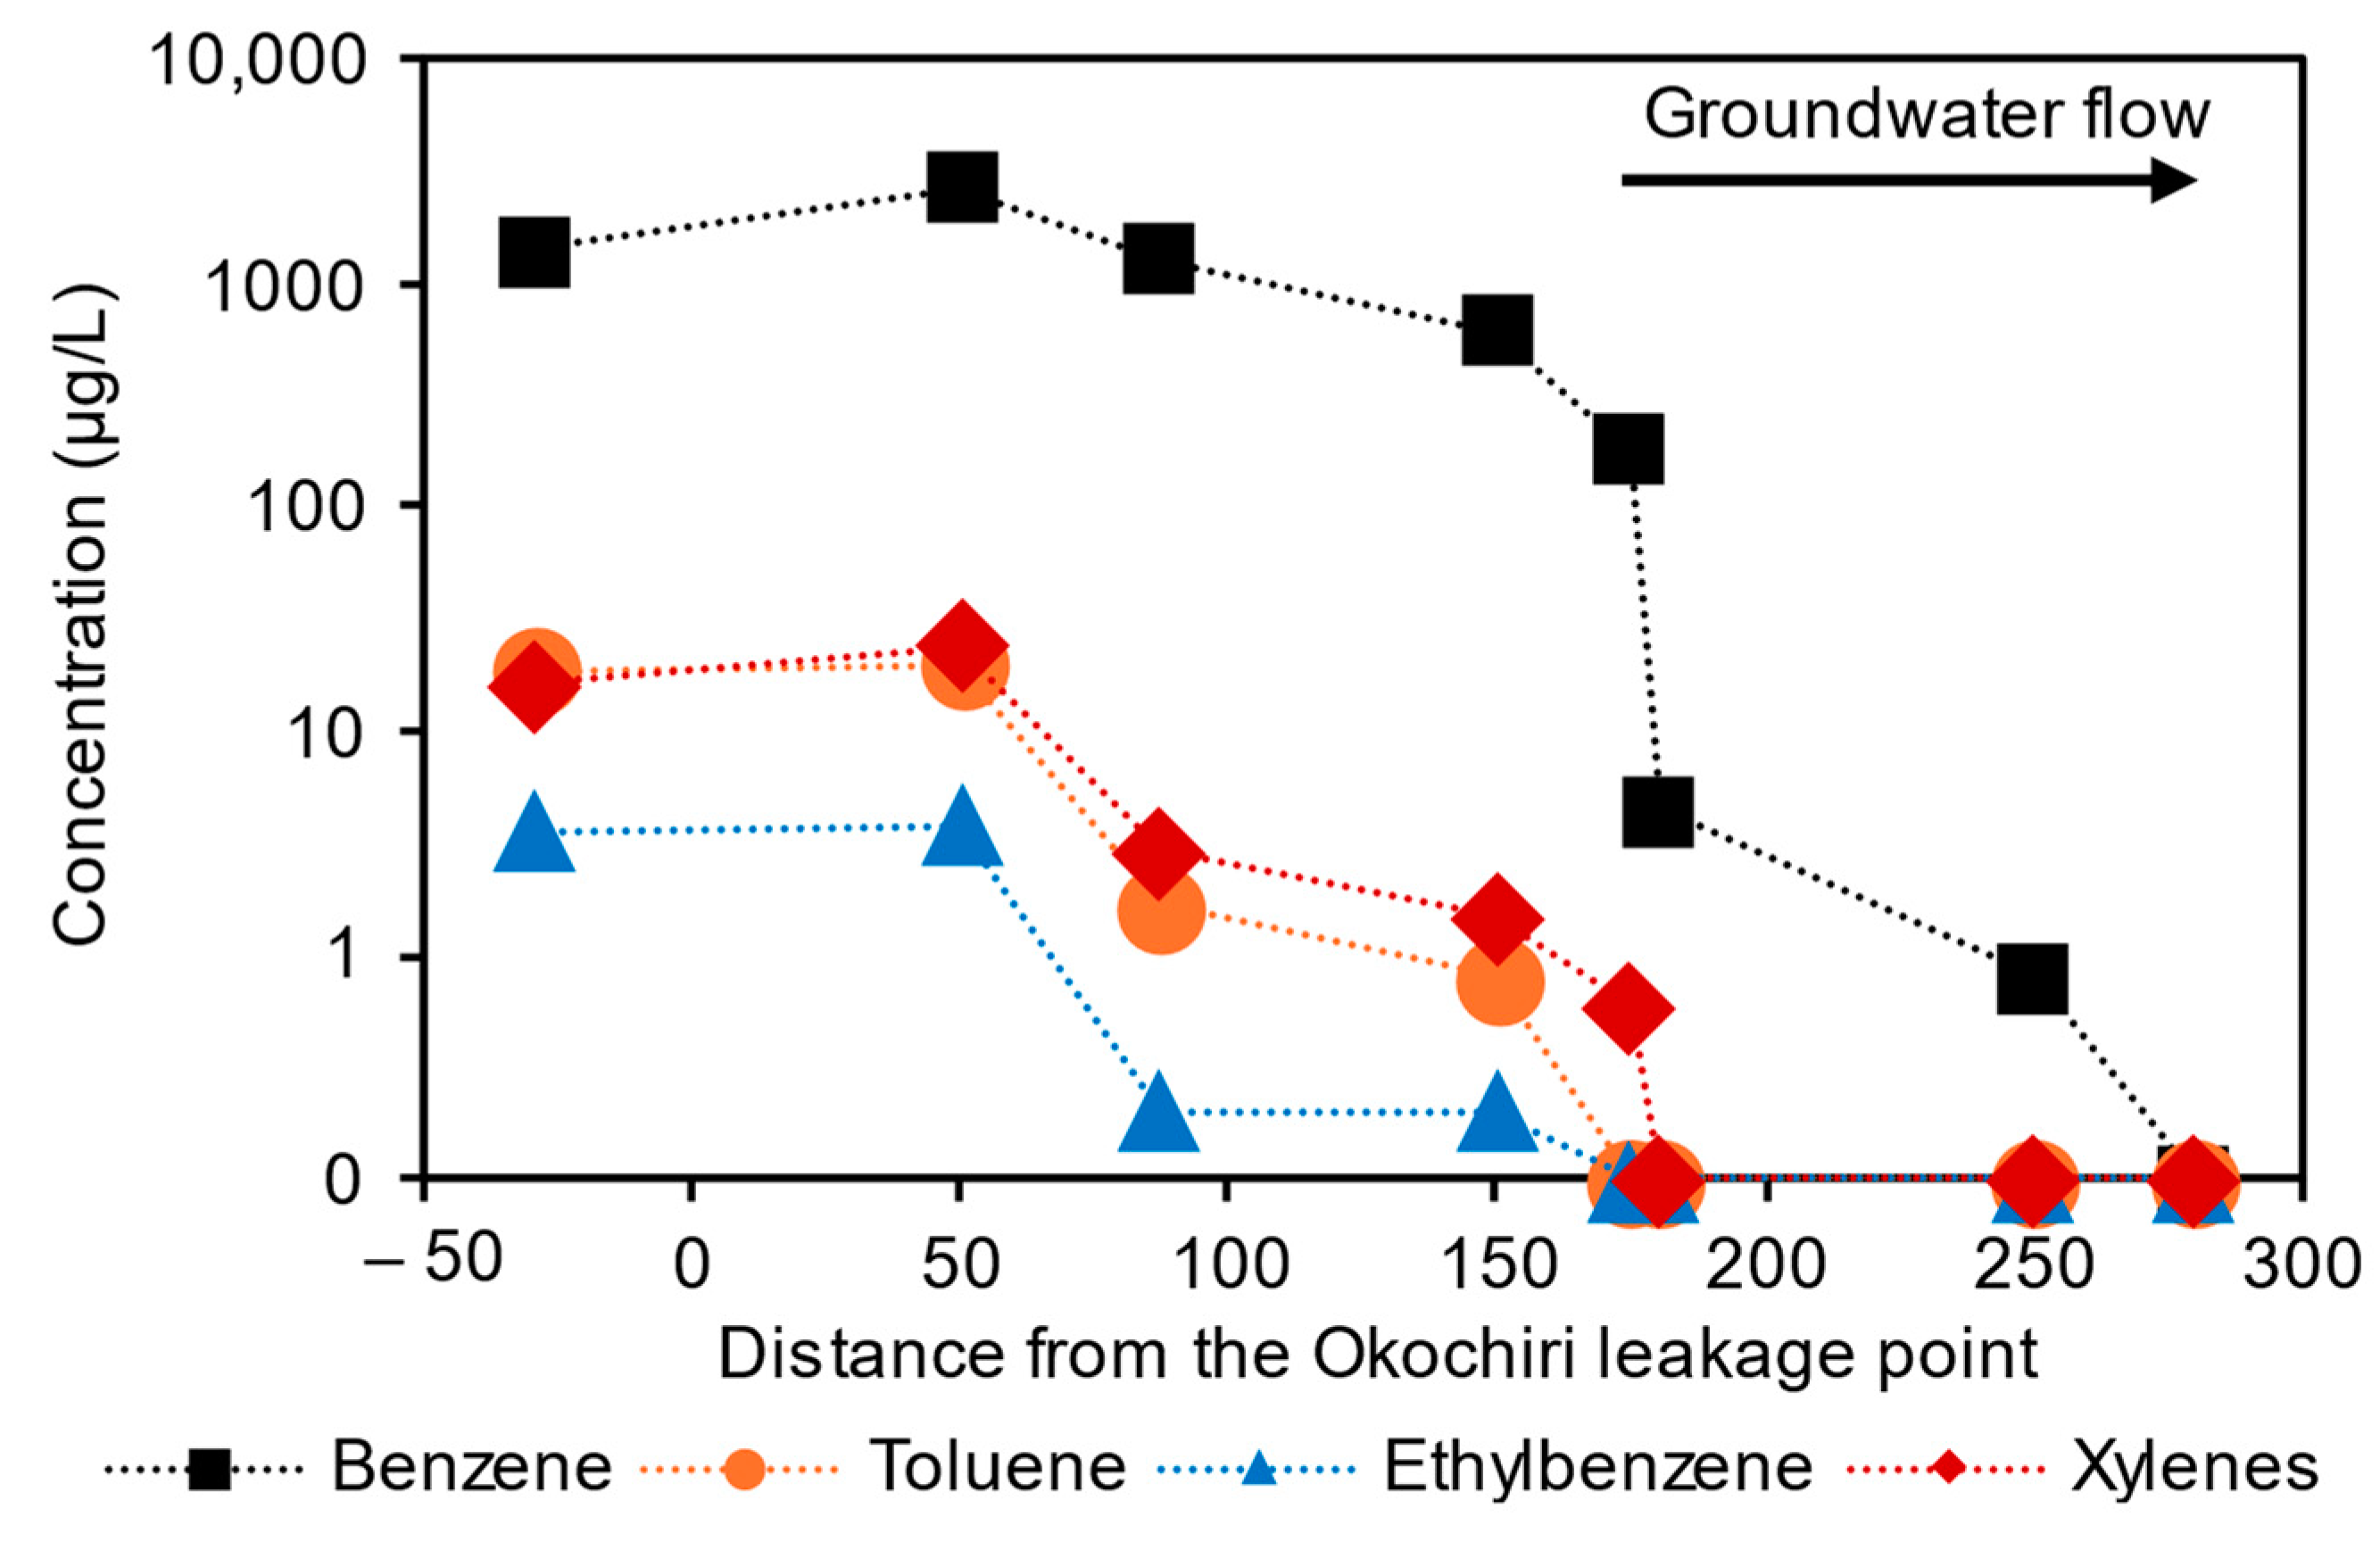
In Okochiri (the host community of the PHR), the benzene concentration was up to 2700 µg/L in groundwater. The highest benzene concentrations were observed in PSW 21, 22, 27, and 28, close to the NNPCL underground petroleum pipeline, which runs from the PHR to Umu Nwa through Alode and Ogale. Based on the groundwater samples taken along transect A in Okochiri (Figure 1) along the groundwater flow direction, the benzene (and other TEX) concentration decreased significantly away from the pipeline leakage point (Figure 5). Benzene and other TEX compounds were undetected in wells more than 250 m from the pipeline.
The presence, level, and distribution of benzene in the groundwater of the three communities depend mainly on (1) the distance of PSWs and CSWs from the underground NNPCL petroleum pipeline, suggesting possible leakages of petroleum hydrocarbon into the corresponding groundwater, (2) the amount of hydrocarbon leakage from the NNPCL pipeline, and (3) the groundwater flow direction.
As the NNPCL petroleum pipeline leaks in the subsurface, benzene and other organic pollutants are released, contaminating groundwater. This occurs in three stages, as outlined by Zhang [99] and Freeze and Cherry [100]: (1) the seepage stage, where gravitational and capillary forces influence the lateral migration of benzene from the oil-wetting zone in the soil into the corresponding groundwater; (2) the seepage of the petroleum ceases when it reaches the water table and subsequently floats on the groundwater; and (3) the separate phase migration, where vaporization and slight dissolution of some of the benzene into the groundwater occurs. The dissolution further leads to benzene lateral transport with the groundwater flow [101]. However, concentrations usually decrease further away from the seepage source. Hence, in the study area, the high amount of precipitation facilitates benzene transport into the groundwater [102], while the groundwater flow direction controls the extent and movement of the contamination plume.
Table 2 compares groundwater BTEX levels of the current study with previous results from the same locations and published results from other countries with similar underground petroleum leakage issues (e.g., [10,26,30,31,32,103,104]). All other study locations, except Eleme (Ogale) in the Niger Delta of Nigeria [26] and Utah, USA [105], have lower groundwater benzene levels than the current study. The pipeline presence and the continuous transport of petroleum products from the PHR refinery to other parts of the country through the pipeline might be responsible for the high benzene levels observed in Ogale, Alode, and Okochiri groundwater compared to different locations. The groundwater benzene concentration was several orders higher than that of Brazil (Bragança), India (Bengaluru), China (a Petrochemical Site near the Yangtze River), and Nigeria (Bonny) groundwater, as shown in Table 2. However, the current study’s toluene, ethylbenzene, xylenes, and trimethylbenzene concentrations are comparable to results published for other areas.

Benzene Concentrations in Relation to Toluene, Ethylbenzene, Trimethylbenzene, and Xylenes

Being a soluble compound, and in the presence of the high BTEX concentration, the aerobic removal of the more easily degraded TEX compounds may be responsible for the abundance of benzene in the Ogale and Okochiri groundwater [106]. It has been shown that TEX compounds degrade at higher rates than benzene when specific benzene-degrading bacteria capable of oxidizing the aromatic ring are unavailable [107]. Although oxygen appears to be available for degradation in the study area, the groundwater benzene levels remain high. In an experiment, Eziuzor, Schmidt [108] collected sediments from the study area, i.e., Eleme (Alode and Ogale), as well as other locations in the region (i.e., Tai, Gokana, and Khana) to test the benzene degradation potential. The sediments were spiked with a mixture of benzene, ethylbenzene, and naphthalene dissolved in acetone and left to sit for one year to monitor the potential for hydrocarbon degradation in the sediment. The result suggests that the benzene degradation is too slow to detect by analyzing benzene removal or that the benzene degraders were absent in the sediments. Relatively, sediments collected from Khana showed slightly higher degradation potential than sediments collected from Eleme (the study area), Gokana, and Tai.
Few samples, however, have less dominance of benzene (e.g., PSW 11 had 55% in 2022 and 54% in 2023, and PSW 7 had 64% in 2022 and 75% in 2023). In contrast, sample PSW 17 had an ethylbenzene (11 µg/L) dominance, up to 91%, with 1% benzene, 1% toluene, and 7% total xylenes. The dominance of ethylbenzene in PSW 17, while benzene is dominant in all the other 52 samples, suggests the possible presence of distinct microbial communities that may preferentially degrade benzene, toluene, and xylenes over ethylbenzene. Since the groundwater is mainly oxygen-saturated, the aerobic microbial communities can break down the benzene, toluene, and xylenes using the available oxygen as an electron acceptor. This process likely depleted the DO level in PSW 17 to 1.53 mg/L (19%), making it the lowest in the 2022 data set. The role of DO in the natural degradation of benzene will be discussed in more detail in Section 3.2.2.

Dissolved Organic Carbon (DOC) in the Eastern Niger Delta

The residents of Ogale and Alode suggested that oil spills resulting from pipeline failure first occurred in 2005 in Ogale. As a result, HYPREP carried out soil remediation to clean up the affected areas. Although the remediation activities ended in 2021 in Ogale and Alode, most wells in those communities still have a mild to pungent hydrocarbon odor, and some well waters show free-phase hydrocarbon after sitting for about 10 min. Those wells, as well as a few other wells with little or no hydrocarbon odor, all have elevated DOC concentrations. The generally high DOC (>4 mg/L), unusual for natural groundwater, indicates groundwater contamination derived from anthropogenically released organic pollutants [109]. Most of the DOC is likely dominated by hydrocarbon degradation intermediates [15,110,111]. The DOC levels, therefore, reflect the total hydrocarbon and non-hydrocarbon load in the groundwater. The shallow and sandy nature of the aquifer and the amount of precipitation in the area facilitate the infiltration of DOC from these sources into the aquifer [112,113].
In oxic groundwater where aerobic respiration is present, DOC typically shows an inverse relationship with DO [114] that depends on the bioavailability of the DOC [115]. In Alode and Ogale, DOC poorly correlates with DO, indicating either the absence of aerobic respiration or that DOC is not bioavailable for microbial respiration. In Okochiri, however, there seems to be a moderate negative trend (r = −0.43), suggesting possible microbial respiration ongoing in the aquifer. Generally, the microbes in the study area utilized the available oxygen to metabolize and break down the DOC into CO2 and HCO3, leading to its slight decrease in concentration (DOC vs. HCO3 showed a moderate positive correlation, r = 0.5). In instances where a specific microbial population capable of degrading DOC is high in Alode, Ogale, and Okochiri aquifers, the DOC will be degraded, depleting the DO in the process. When the DO is wholly consumed, electron acceptors such as NO3, Mn4+, Fe3+, and SO42−, if available, will further oxidize the DOC [53].

Fe Contamination and Influence on the Fate of Benzene

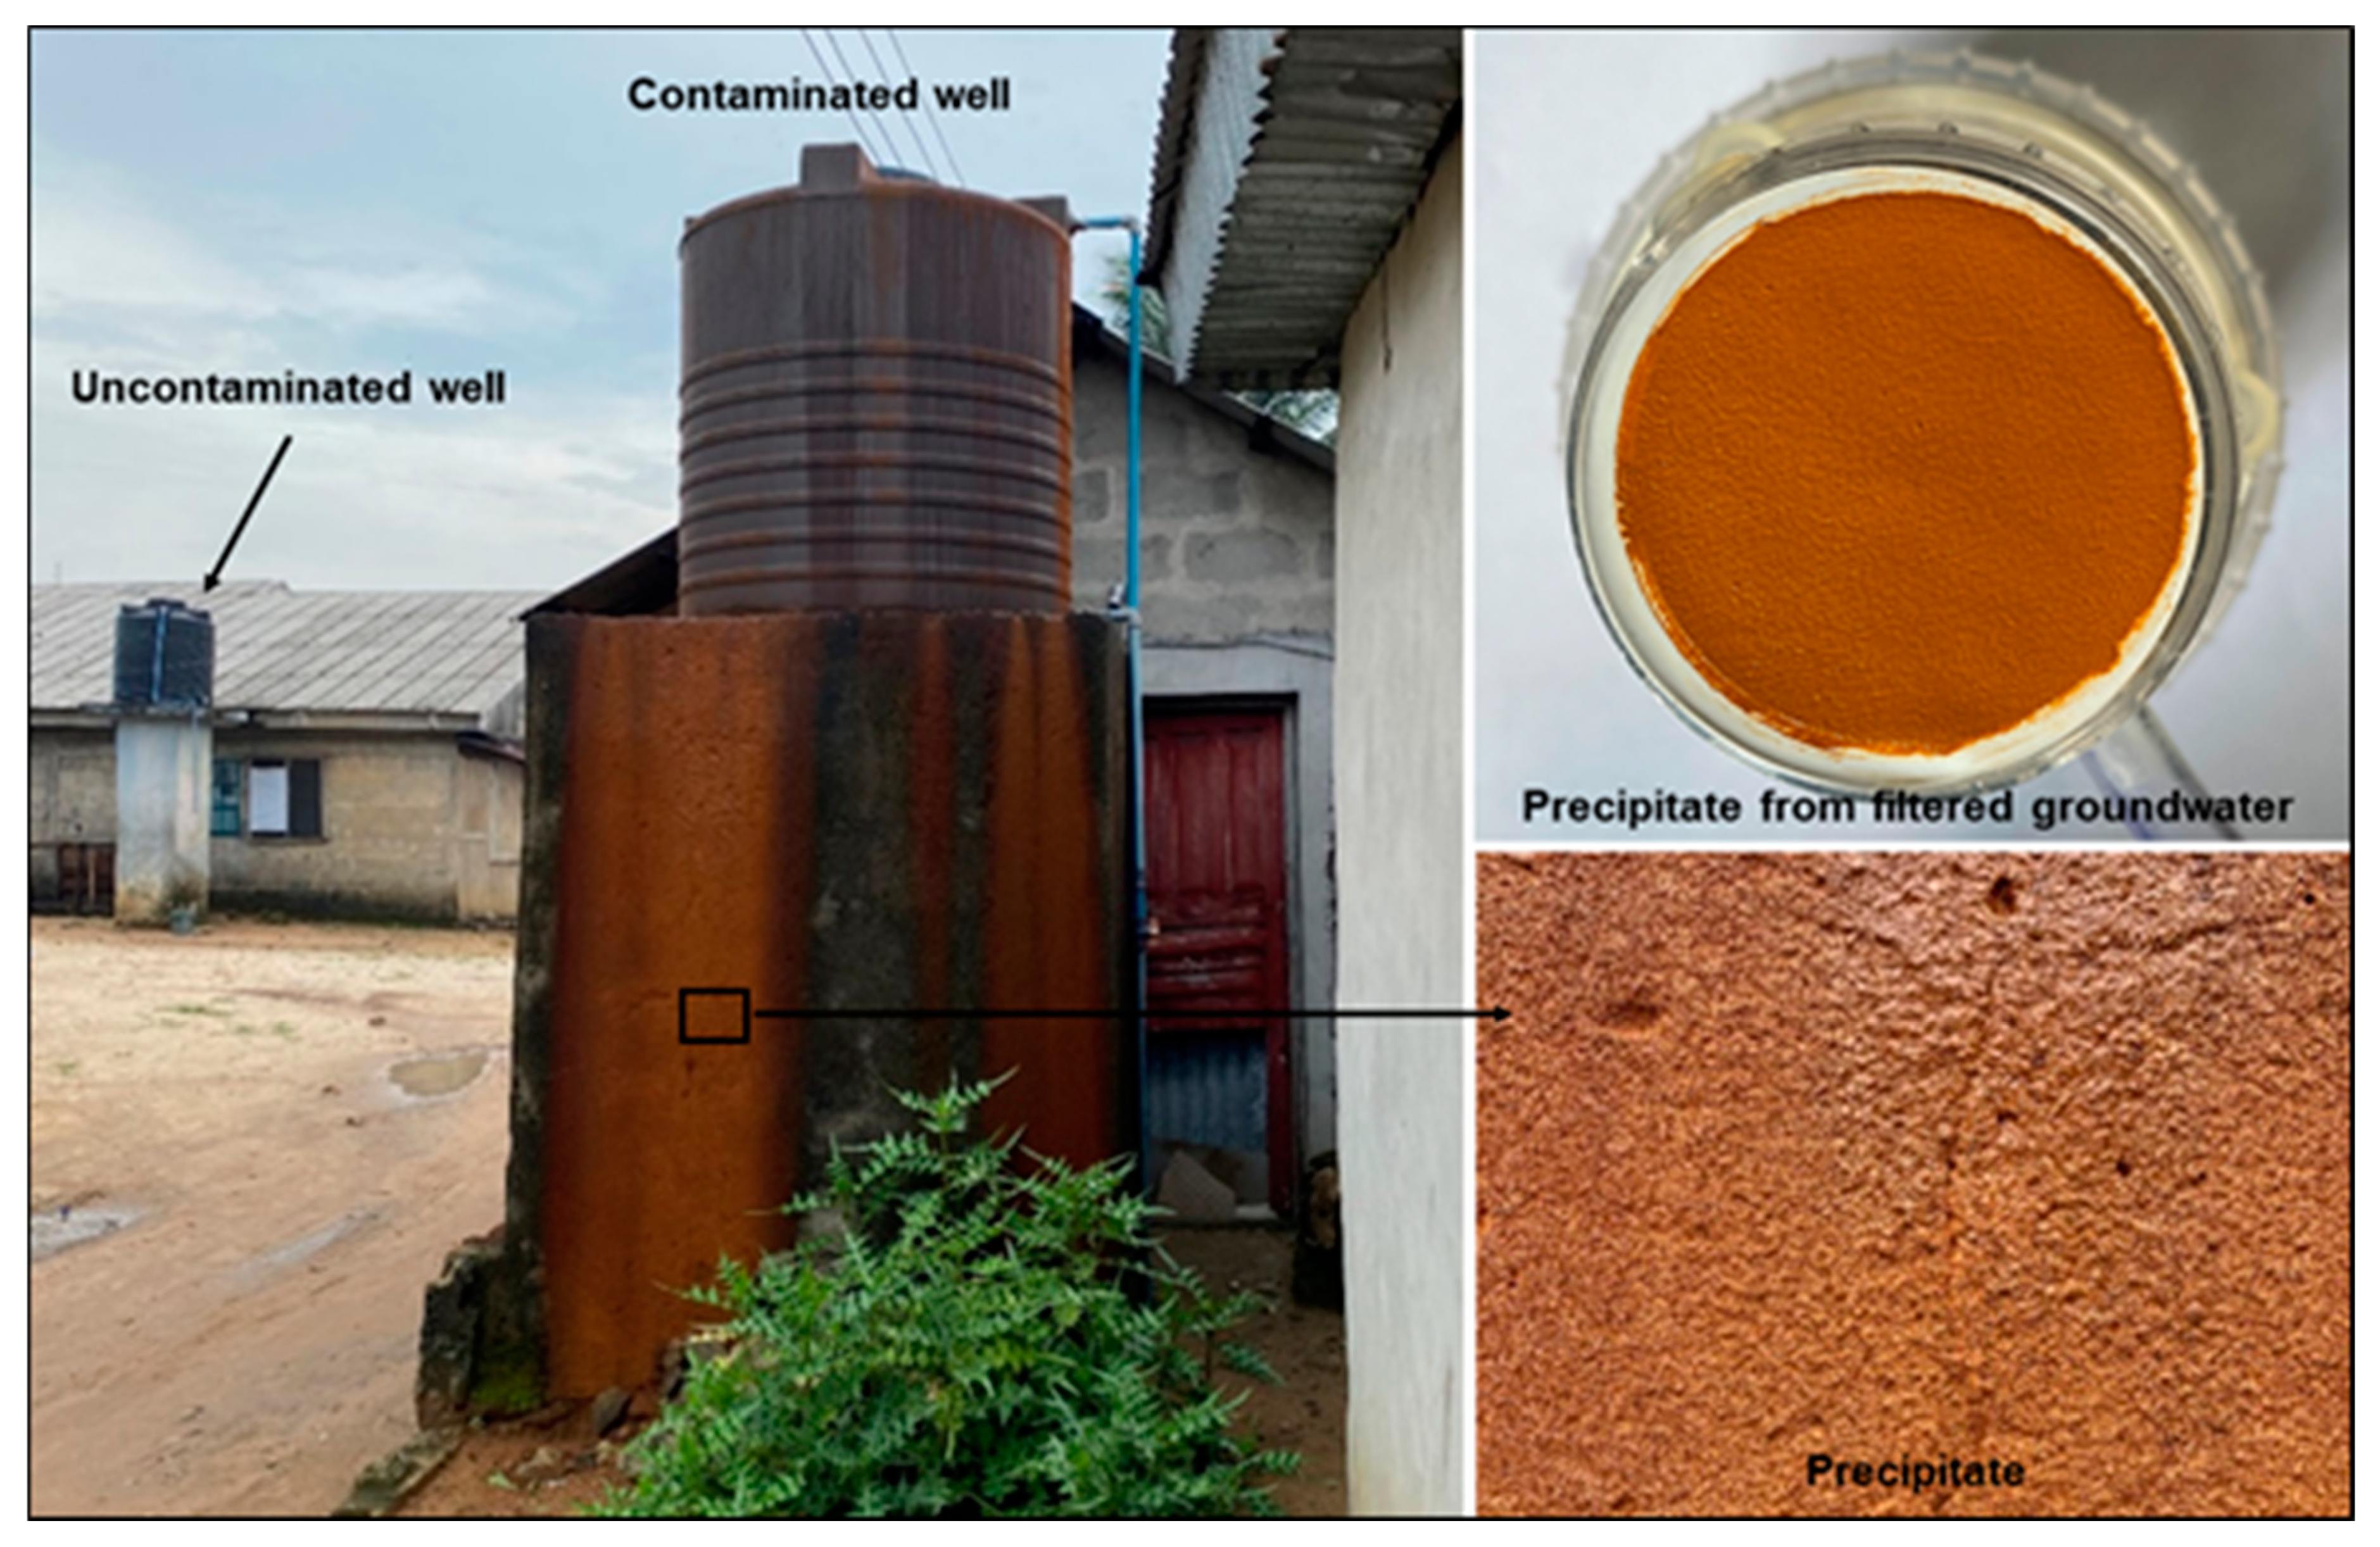
While the major ions and trace metal concentrations were relatively low or undetected in some wells, Fe2+ concentrations in some samples were elevated. Alode, Ogale, and Okochiri concentrations varied between 0.01 to 7 mg/L, 0.01 to 50 mg/L, and 0.01 to 25 mg/L, respectively. The highest concentrations were observed in wells located near the NNPCL pipeline in Okochiri and Ogale. Wells situated further away have lower concentrations, usually between 0.01 to 0.3 mg/L of Fe, and in some cases, they are undetected. Along the NNPCL petroleum pipelines, the accumulation of Fe precipitates as stains (reddish-brown rust particles) were observed on surfaces of (1) polyvinyl chloride (PVC) overhead tanks used for the storage of drinking water (Figure 6) and (2) plumbing fixtures, as well as other domestic water containers. This phenomenon usually occurs under oxic conditions [116,117,118]. The reddish-brown rust particles (Fe(OH)3) resulted from the reaction between Fe and DO in the groundwater, as shown by the following reaction: 4Fe2+ + O2 + 10H2O → 4Fe(OH)3 + 8H+. The precipitation was also observed in samples left sitting for about 10 min after abstraction, suggesting the release of Fe from the nearby underground pipelines.
pH plays a significant role in the oxidation process, as the solubility and precipitation of Fe are pH-dependent. In the study wells, while >95% of Fe concentrations are <4 mg/L, the elevated concentration shows a positive relationship with pH (r = 0.75 in 2022 and 0.54 in 2023, Figure 7), demonstrating Fe precipitation under slightly alkaline conditions. As groundwater becomes more alkaline, Fe ions become less soluble and tend to come out of the solution, forming visible solid particles (i.e., the reddish-brown rust particles). Since rusts primarily contain Fe oxides, and the groundwater samples were acidified to pH < 2 with 2% HNO3 after filtration, the low pH condition favored the further dissolution of the rust, which was analyzed as Fe2+.
Being an electron acceptor, iron is significant in the anaerobic degradation of petroleum hydrocarbons [119]. van Leeuwen, Gerritse [120] and Botton and Parsons [121] showed that benzene was degraded under iron-reducing conditions in groundwater. From a thermodynamic perspective, such conditions occur when DO, NO3, and Mn4+ are consumed [118]. In Ogale, for instance, iron-reducing conditions occurred in PSW-11. Here, the DO, NO3, Mn4+, and Fe3+ levels were 2.3 mg/L, 2 mg/L, 0.1 mg/L, and 50 mg/L in 2022 and 0.7 mg/L, less than 0.01 mg/L, 0.1 mg/L, and 46 mg/L in 2023, respectively. While the Fe3+ in the system decreased in 2023, the continuous release of benzene overwhelmed the iron-reducing capacity to attenuate benzene in the groundwater. Thus, the benzene level increased from 910 µg/L in 2022 to 1100 in 2023 µg/L. This suggests that benzene degradation by iron reduction may not have occurred. Furthermore, the SO42− level was higher in 2023 (7 mg/L) than in 2022 (3 mg/L), indicating that SO42− did not react with benzene.

3.2.2. Potential for Natural Attenuation of Benzene

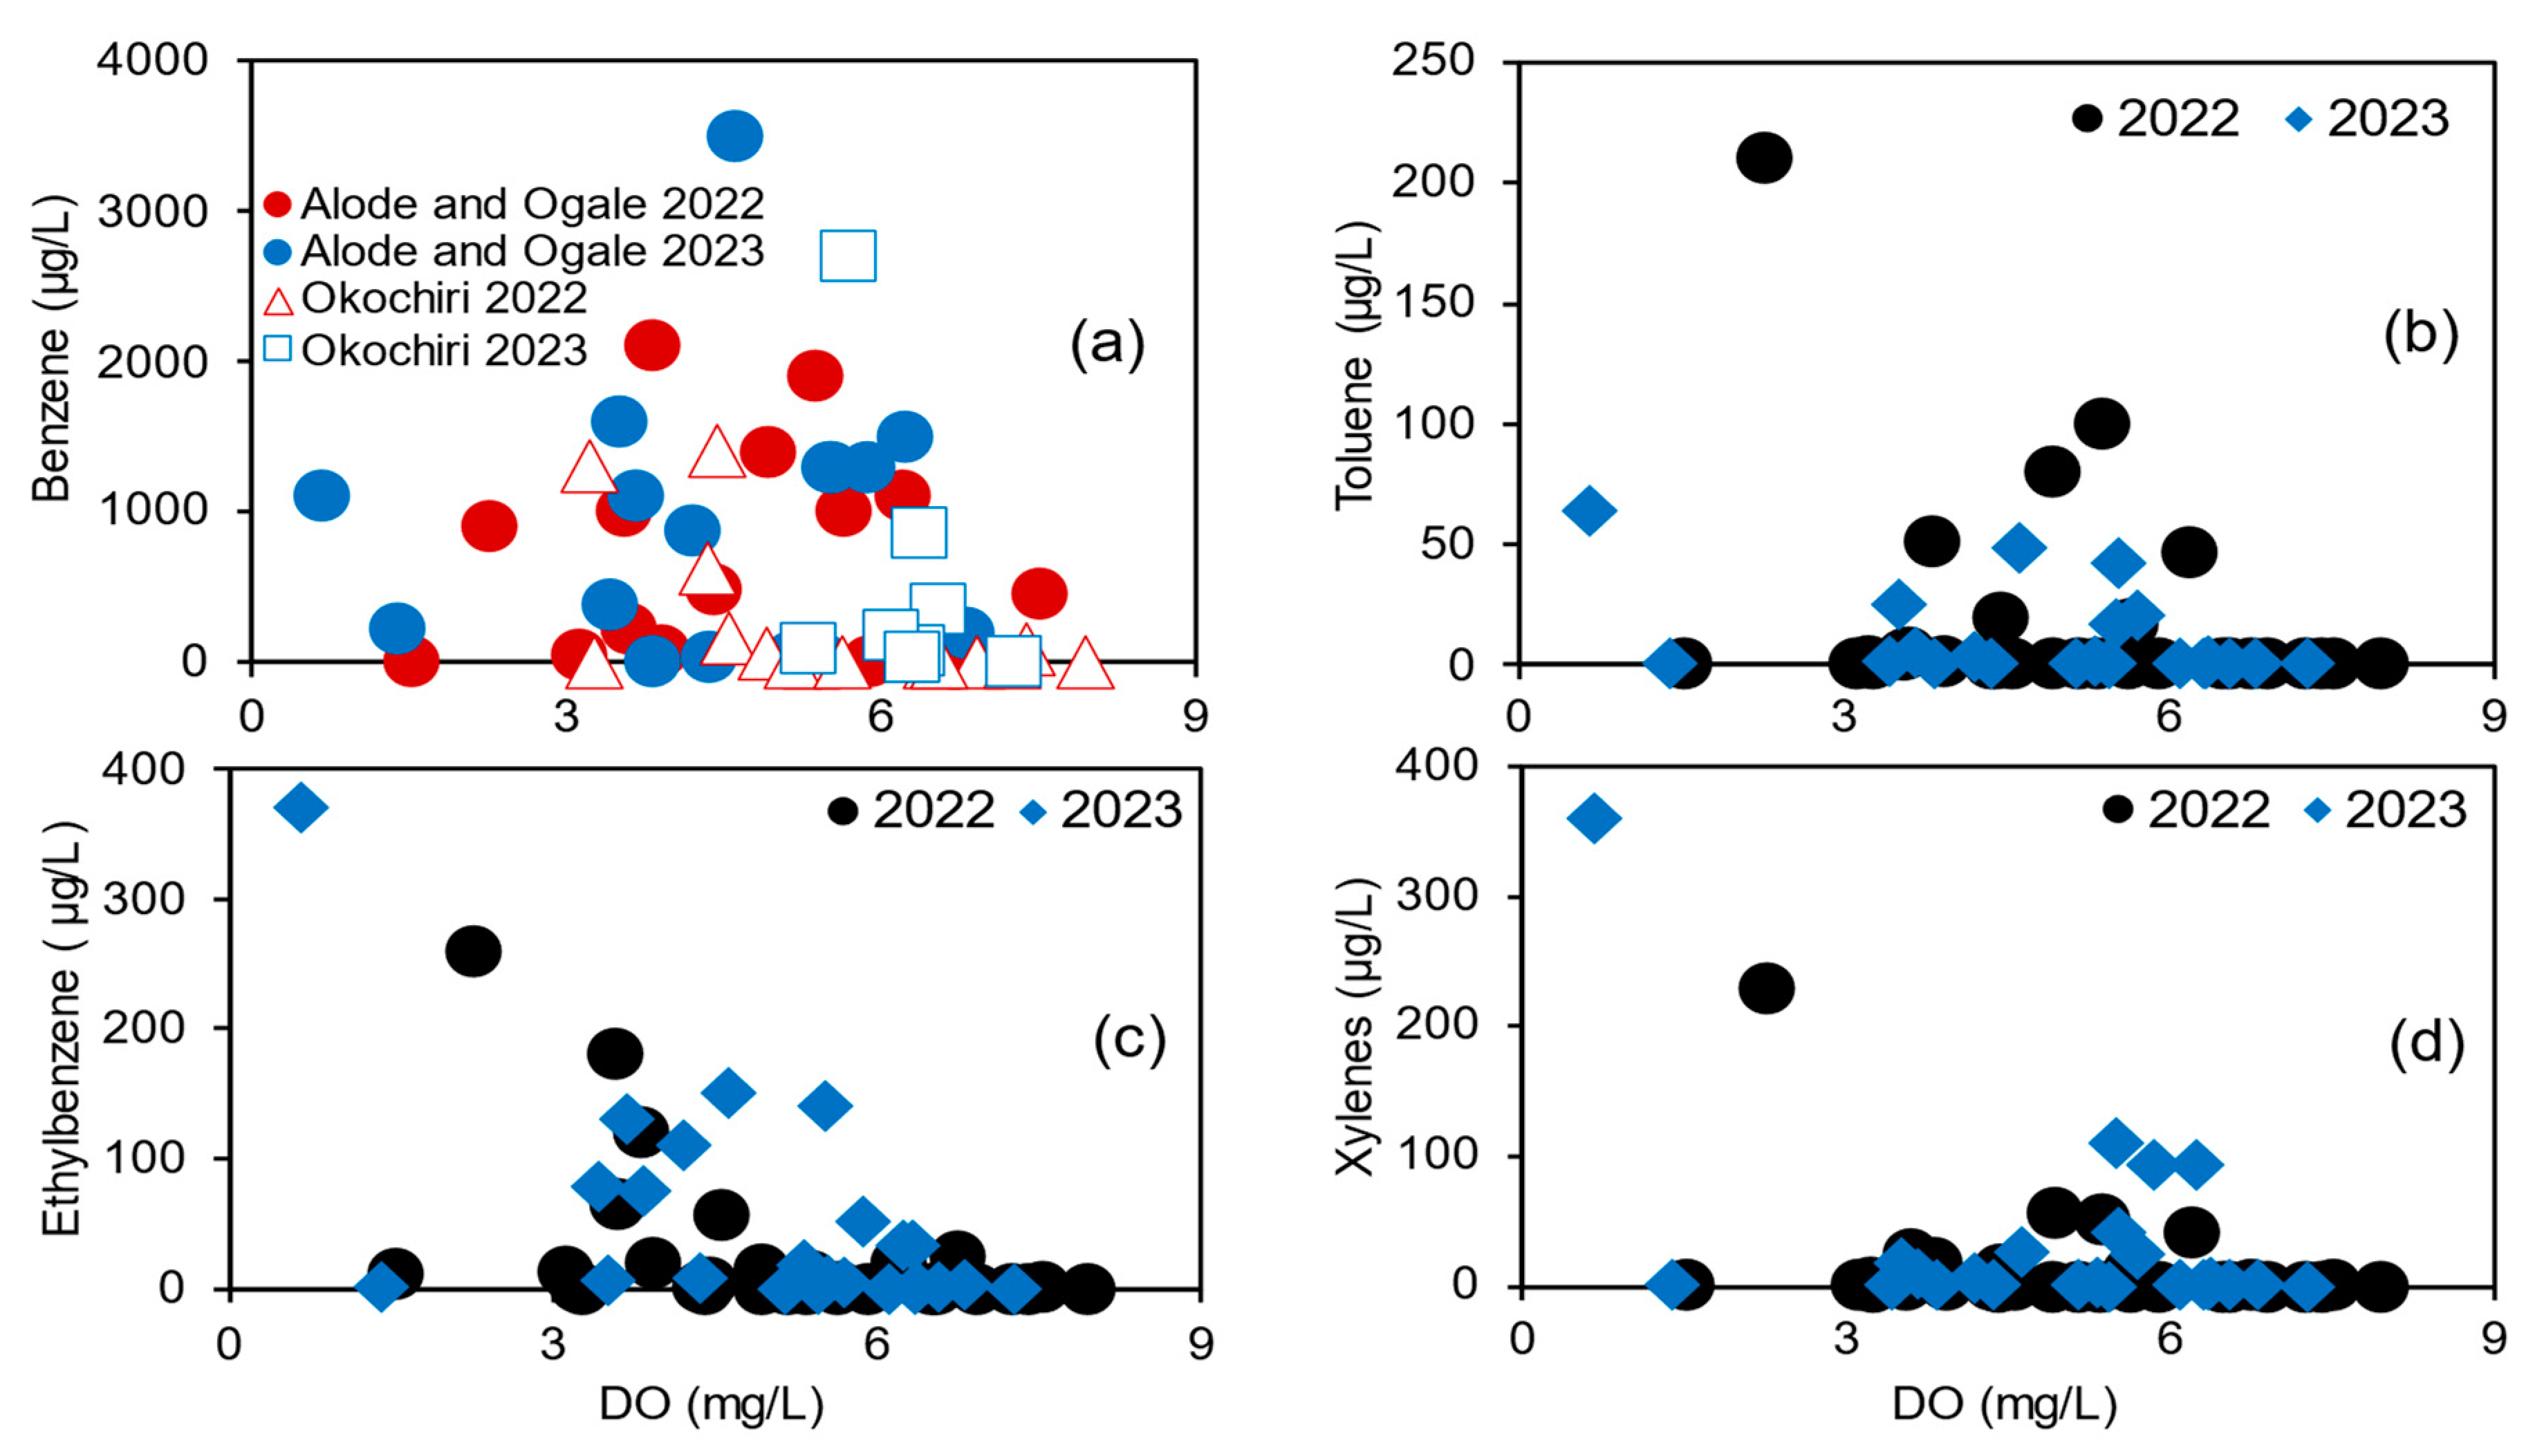
Since DO is considered the primary electron acceptor for hydrocarbon degradation [122], the available amount of DO in the studied groundwater shows considerable potential for the NA of benzene contamination. DO, however, poorly correlates with benzene in the groundwater (Figure 8a). The lowest DO level (0.7 mg/L, 9%) was observed in well PSW 11, which is located 111 m away from the NNPC underground petroleum pipeline in Ogale but is contaminated with both benzene (1100 µg/L) and Fe (45.6 mg/L). The high Fe content contributed to the depletion of oxygen levels in the groundwater. The Fe contamination was discussed in detail earlier in Fe contamination and influence on the fate of benzene section.
Although DO and benzene have a weak negative correlation (r = −0.22 in 2022 and −0.11 in 2023, Figure 8a), DO is consistently higher in wells with undetected benzene than in the contaminated wells. For instance, DO levels in the five reference wells with undetected benzene ranged from 6.4 (88%) to 7.9 (102%) mg/L. In contrast, the DO levels at the contaminated sites were lower in most wells, ranging from 0.7 (9%) to 6.7 (86%) mg/L. Data from Okochiri indicated that the considerable decrease in benzene must be related to the amount of DO available in the groundwater (Figure 8a). For instance, the DO concentrations at PSW 21 were 3.2 (41.4%) mg/L and 6.4 (85%) mg/L, while the benzene concentrations were 1300 µg/L and 850 µg/L in 2022 and 2023, respectively. Similarly, at well PSW 22, the DO concentrations were 4.4 (57%) mg/L (620 µg/L of benzene) and 6.6 (88%) mg/L (350 µg/L of benzene) in 2022 and 2023, respectively.
In 2022 and 2023, higher DO levels and corresponding lower benzene levels were consistently observed downgradient of the NNPCL product pipeline in Okochiri. Similarly, benzene levels in the groundwater samples taken along transect A in the Okochiri (shown earlier) showed an inverse relationship with DO along an established flow path (Figure 9); DO levels increase as the benzene concentration decreases. In Alode and Ogale, however, the relationship between DO and benzene was inconsistent. This may be affected by several factors, such as multidimensional groundwater flow directions and other contaminants.
Despite the elevated benzene levels in the three communities, DO is still available due to constant recharge from precipitation. The precipitation, saturated with oxygen, continuously infiltrates the soils and the corresponding shallow and sandy aquifers in the study area. Since the area has permeable sandy soils, oxygen consumption in the soil zone is resupplied by gaseous oxygen transport through the soil, resulting in insignificant oxygen consumption (e.g., [118]) given that the depth to the aquifer is 11 m, 9 m, and 1 m in Ogale, Alode, and Okochiri, respectively. As a result, groundwater across the three communities remained saturated, up to 95%, with an average of 66%. Oxygen in the groundwater can initiate aerobic benzene degradation [123] under favorable conditions, such as appropriate pH levels (i.e., 6.5 to 8.5) [124,125] and specific microbial populations capable of degrading benzene. In this process, aerobic bacteria, fungi, or algae utilize DO for both ring activation and the cleavage of the aromatic nucleus and as an electron acceptor for the complete mineralization of the benzene, as presented in Equation (1) [107].
C6H6 + 7.5O2 → 6CO2 + 3H2O
According to Jindrová, Chocová [123], under ambient conditions, 8 to 12 mg/L of DO is sufficient to degrade 3000 to 4000 µg/L of benzene. However, such high DO levels were absent in the study area due to the high groundwater temperature, up to 32.5 °C.
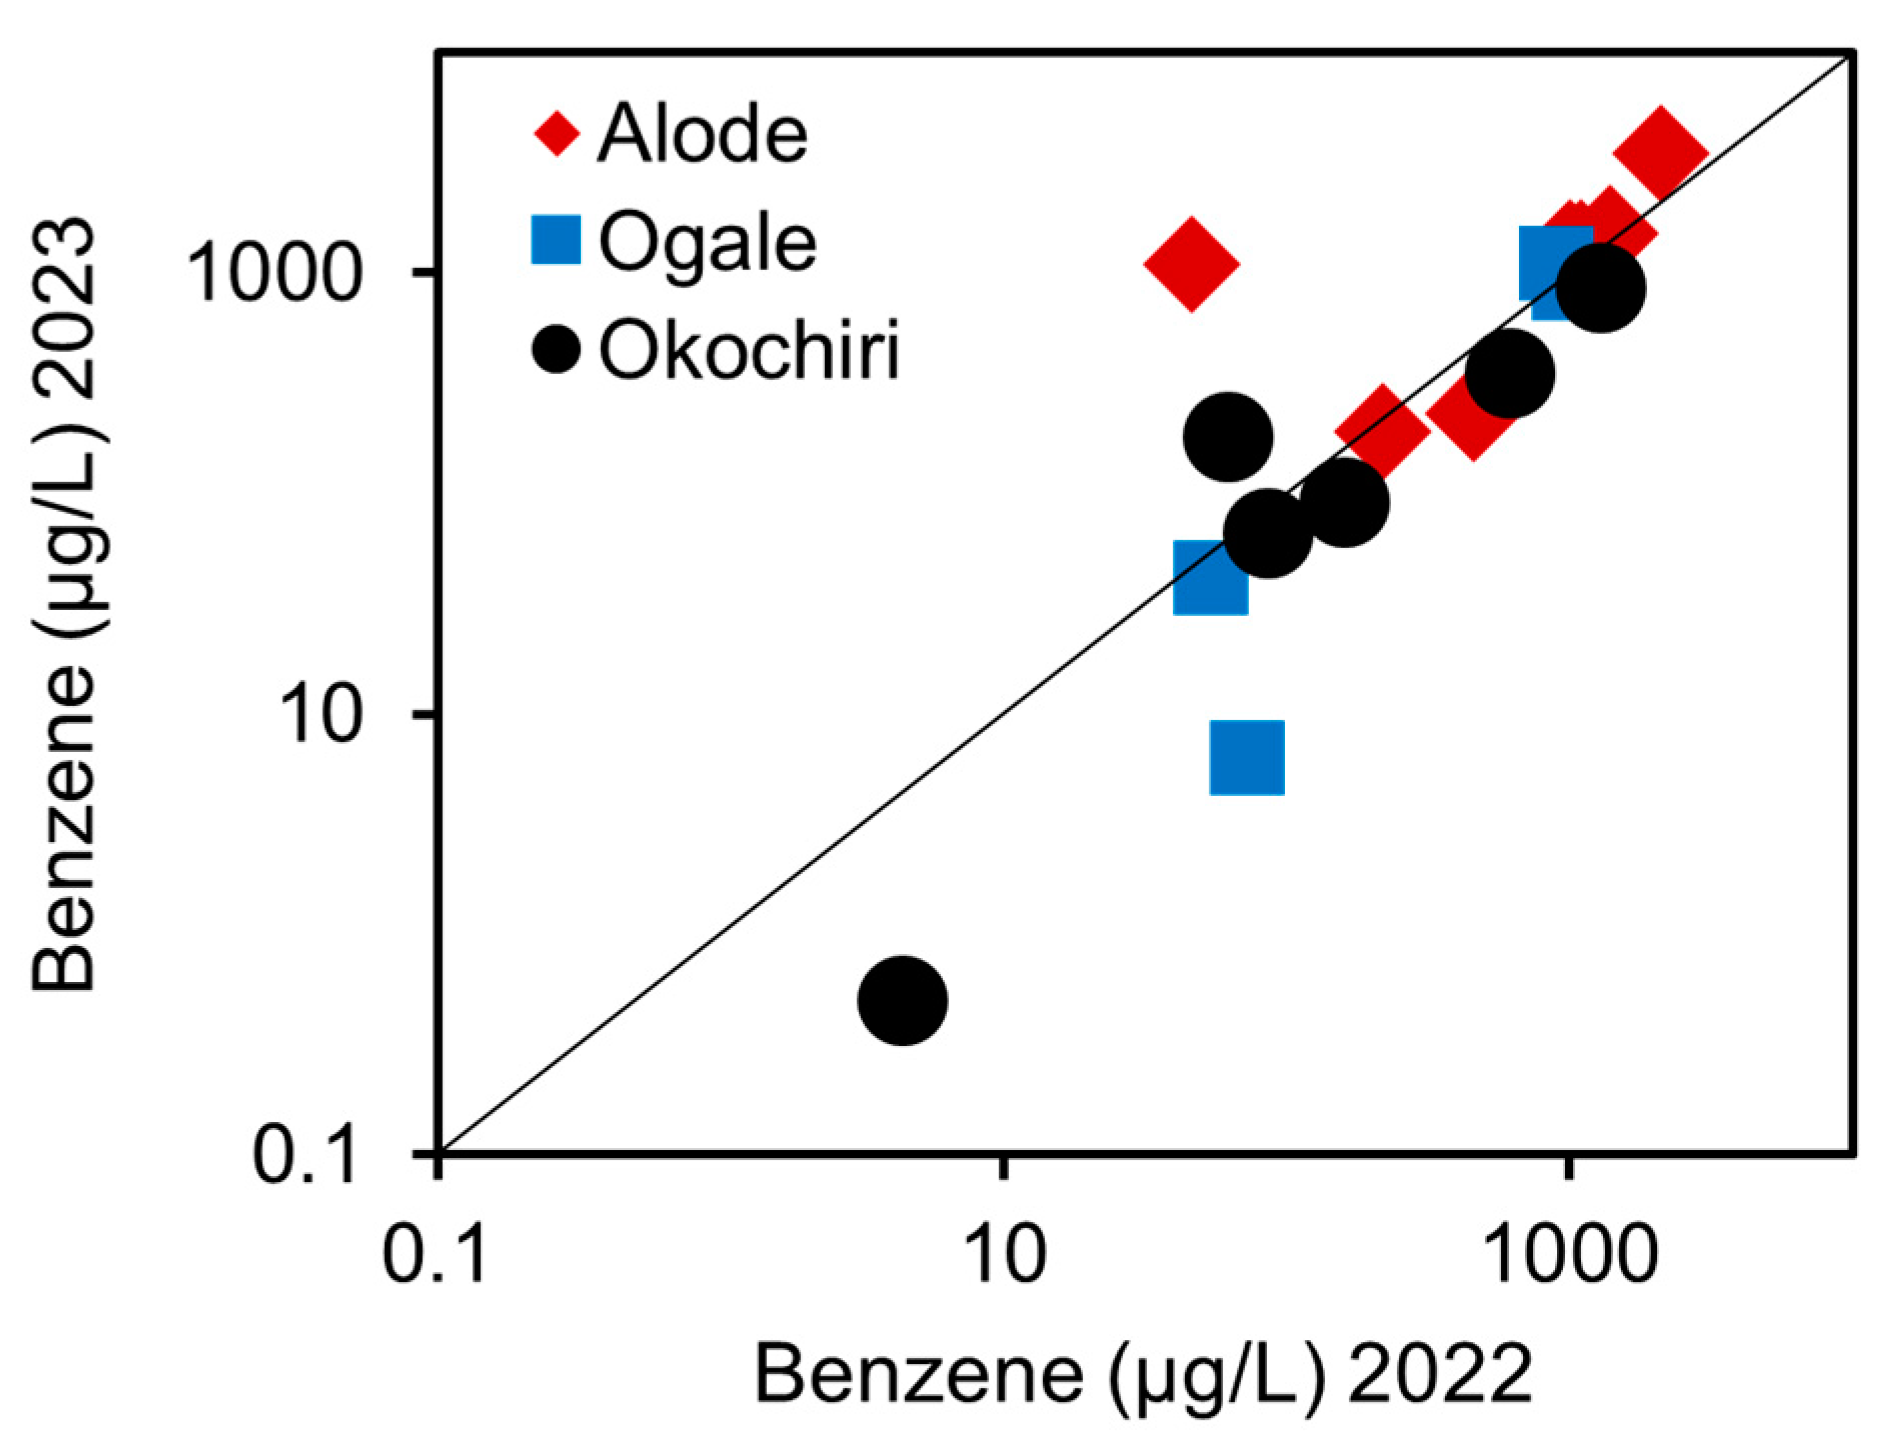
Typically, 100% DO saturation at 25 °C is 8.45 mg/L and, at 32.5 °C, only 7.2 mg/L. The highest values for DO were 7.4 mg/L at Okochiri, 5.9 mg/L at Ogale, and 7.5 mg/L at Alode. Similarly, the highest values for temperature were 32.5 °C at Okochiri, 31 °C at Ogale, and 31 °C at Alode. The groundwater temperature, therefore, appears to be a limiting factor to the aquifer’s benzene NA potential. The rate and efficiency of benzene degradation, however, do not only depend on the oxygen availability but also the discontinuous release of BTEX from the pollutant source, temperature, nutrient availability, and overall microbial activity in the groundwater environment [56,126,127,128,129]. In the case of Ogale, for instance, the benzene concentration in well PSW 11 decreased from 9280 μg/L [26] to 910 μg/L (this study) in 11 years but increased from 910 μg/L to 1100 μg/L in 1 year. Figure 10 shows a general comparison between benzene levels in 2022 and 2023. Besides two samples from Alode, which were significantly higher in 2023, benzene concentrations were similar for the two sampling campaigns. The lack of a consistent decline between 2022 and 2023 concentrations suggests that there may be a continuous release of benzene from the pipeline into the groundwater. Also, benzene concentrations in the three communities appear to exceed the capacity of microbial degradation. Therefore, the high initial concentration or continuous benzene release overwhelmed the NA capacity, slowing the degradation.
Nevertheless, the EBC calculations shown in Table 3 further suggest that the DO levels could be sufficient to support aerobic benzene-degrading bacteria to naturally attenuate the benzene-contaminated groundwater of Alode, Ogale, and Okochiri. The EBC calculations were based on the lowest and the highest DO measured in the contaminated and reference groundwater in the 2022 and 2023 samples. The calculated EBCDO for BTEX levels ranged from 0.62 to 2.11 mg/L, which should be sufficient for BTEX removal [63].
Furthermore, the point attenuation rate for benzene and BTEX were computed. Most wells, especially in Alode, showed fluctuated concentrations or insufficient data and were unsuitable for first-order decay calculations. Thus, only a few suitable samples were selected for the NA investigation. The computed point attenuation rates for benzene and BTEX are shown in Table 4. The BTEX point attenuation rates varied between 0.086 and 0.556 day−1, equivalent to half-lives of 51.7 years and 4.5 years, respectively. These attenuation rates were comparable to the 0.19 day−1 and 0.038 day−1 values reported for the sandy aquifer in Florida [130] and Utah, USA [105], respectively. The time required to reach the Nigerian remediation goal (0.8 µg/L total BTEX) was 9.2 to 85 years. Also, the point attenuation rates for benzene were smaller, varying between 0.128 and 0.693 day−1, with half-lives of 4.6 to 32.8 years. To reach the Nigeria benzene remediation goal of 0.2 µg/L by NA alone, 11.2 to 66.5 years would be required. Notably, most of the NA at this site may be attributed to dilution due to the high precipitation rate, up to 4000 mm/year, and dispersion enhanced by groundwater flow. Although the aquifer has a promising NA potential, active remediation measures would be required to reduce the time needed to reach the Nigerian benzene remediation goal. Due to the lack of sufficient data, it was impossible to estimate the study site’s bulk attenuation rate.

4. Conclusions

The current study demonstrates that Alode, Ogale, and Okochiri groundwater is heavily contaminated by benzene. Other drinking water quality parameters are within the WHO-recommended values. The maximum benzene concentration (3500 µg/L) was recorded in Alode. Ogale and Okochiri had benzene concentrations up to 1300 µg/L and 2700 µg/L, respectively. Elevated values, however, were observed only in wells next to the NNPCL underground petroleum product pipeline, which runs from the PHR to Umu Nwa through Alode and Ogale. The concentration decreased with distance from the pipeline. While the benzene contamination is at a dangerous level, concentrations of the other co-occurring monocyclic aromatic compounds, i.e., toluene, ethylbenzene, trimethylbenzene, and the three forms of xylenes, are within the WHO-accepted drinking water limits (i.e., 210 µg/L, 370 µg/L, 220 µg/L, and 360 µg/L, respectively). Additionally, DOC levels are elevated in most samples, up to 47 mg/L, 49 mg/L, and 33 mg/L in Alode, Ogale, and Okochiri. The elevated DOC reflects the groundwater’s total hydrocarbon and non-hydrocarbon load.
While both the benzene and DOC levels in the groundwater are high, the aquifer has shown promising potential for possible aerobic degradation with its available level of DO (up to 7.5 (95%) mg/L). The calculated BTEX biodegradation capacity for DO alone ranged from 0.62 to 2.11 mg/L. The point attenuation rates of benzene ranged from 0.128 to 0.693 day−1. The time required to reach the groundwater benzene clean-up goal by NA alone was 11.2 to 66.5 years. Despite the promising potential for NA, the degradation rate appears to be too slow owing to (1) the elevated concentrations in the samples, (2) the continuous release of benzene into the groundwater, (3) the high groundwater temperature (up to 32.5 °C), or (4) the possible absence of a specific benzene-degrading microbial population to utilize the available oxygen. The analysis and identification of the microbial population were not within this study’s scope. Hence, considerable uncertainties and distinct unknowns regarding the nature and population of the appropriate microbial population needed for such attenuation remain.
Immediate measures are required to save the health of the growing population residing in the affected communities. These could include (1) using granular activated carbon or charcoal filters for benzene removal or (2) discontinuing the use of the contaminated groundwater. Water from safe sources (e.g., bottled or sachet) should be used instead. In the long term, (1) the local authorities should provide alternative drinking water sources in the form of a centralized water supply system, where the quality of the drinking water can be controlled before being distributed to the affected communities, (2) the local authorities should implement measures to ensure a decline in benzene concentration, and (3) the NNCPL should carry out active remedial intervention on sediments and aquifers to facilitate the biodegradation and NA capacities in Alode, Ogale, and Okochiri. The benzene level in the affected communities already exceeded the National Environmental Regulations [47] drinking water target value at levels over 17,500 times and the intervention value at levels over 117 times.

Supplementary Materials

The following supporting information can be downloaded at: https://www.mdpi.com/article/10.3390/environments11100221/s1.

Author Contributions

Conceptualization, T.P.; methodology, T.P.; formal analysis, D.L.A.; investigation, D.L.A.; writing—original draft presentation, D.L.A.; writing—review and editing, H.B. and T.P.; visualization, D.L.A.; supervision, T.P.; project administration, T.P. and D.L.A.; funding acquisition, D.L.A. and T.P. All authors have read and agreed to the published version of the manuscript.

Funding

This work was partly funded by the Deutsche Forschungsgemeinschaft (DFG) grant PI 746/19-1 to Pichler and Petroleum Technology Development Fund (PTDF), Nigeria to Dogo.

Data Availability Statement

Data is contained within the article/Supplementary Materials.

Acknowledgments

The authors thank Kay Hammer (University of Bremen) for contributing to this work. We thank Obrike Ewoma Stephen (Nasarawa State University, Keffi), Faith Nyerma Aleku, and Clement Domgbara for assistance in the field. We thank Henning Fröllje, Christian Hansen, Tobias Himmler, and Janin Scheplitz (University of Bremen) for laboratory support. The Dr. Döring laboratory in Bremen is thanked for the excellent collaboration during the BTEX analyses.

Conflicts of Interest

The authors declare no conflicts of interest.

References

  1. Feo, A.; Pinardi, R.; Scanferla, E.; Celico, F. How to Minimize the Environmental Contamination Caused by Hydrocarbon Releases by Onshore Pipelines: The Key Role of a Three-Dimensional Three-Phase Fluid Flow Numerical Model. Water 2023, 15, 1900. [Google Scholar] [CrossRef]
  2. Ahmed, S.; Le Mouël, F.; Stouls, N.; Lipeme Kouyi, G. Development and Analysis of a Distributed Leak Detection and Localisation System for Crude Oil Pipelines. Sensors 2023, 23, 4298. [Google Scholar] [CrossRef] [PubMed]
  3. Unueroh, U.; Omonria, G.; Efosa, O.; Awotunde, M. Pipeline corrosion control in oil and gas industry: A case study of NNPC/PPMC system 2A pipeline. Niger. J. Technol. 2016, 35, 317–320. [Google Scholar] [CrossRef]
  4. Umar, H.; Abdul Khanan, M.; Magashi, S.; Ja’afar, M.; Sani, M. Fractal Analysis for Oil Spills Clustering in Ahoada Communities of the Niger Delta Region of Nigeria. Int. Arch. Photogramm. Remote Sens. Spat. Inf. Sci. 2023, 48, 371–377. [Google Scholar] [CrossRef]
  5. PHMSA. Pipeline Failure Causes; Technical Report; U.S. Department of Transportation: Washington, DC, USA, 2019.
  6. Ekong, A.P.; James, G.G.; Ohaeri, I. Oil and Gas Pipeline Leakage Detection using IoT and Deep Learning Algorithm. J. Inf. Syst. Inform. 2024, 6, 421–434. [Google Scholar] [CrossRef]
  7. Ambituuni, A.; Hopkins, P.; Amezaga, J.; Werner, D.; Wood, J. Risk assessment of a petroleum product pipeline in Nigeria: The realities of managing problems of theft/sabotage. In Safety and Security Engineering V; WIT Press: Southampton, UK, 2015; pp. 49–60. [Google Scholar]
  8. Lu, H.; Iseley, T.; Behbahani, S.; Fu, L. Leakage detection techniques for oil and gas pipelines: State-of-the-art. Tunn. Undergr. Space Technol. 2020, 98, 103249. [Google Scholar] [CrossRef]
  9. Korlapati, N.V.S.; Khan, F.; Noor, Q.; Mirza, S.; Vaddiraju, S. Review and analysis of pipeline leak detection methods. J. Pipeline Sci. Eng. 2022, 2, 100074. [Google Scholar] [CrossRef]
  10. Cozzarelli, I.M.; Baedecker, M.J.; Mumford, A.C.; Jaeschke, J.B.; Spencer, T.A. Understanding the Evolution of Groundwater-Contaminant Plume Chemistry Emanating from Legacy Contaminant Sources: An Example from a Long-Term Crude Oil Spill. Groundw. Monit. Remediat. 2022, 42, 30–42. [Google Scholar] [CrossRef]
  11. McGuire, J.T.; Cozzarelli, I.M.; Bekins, B.A.; Link, H.; Martinović-Weigelt, D. Toxicity assessment of groundwater contaminated by petroleum hydrocarbons at a well-characterized, aged, crude oil release site. Environ. Sci. Technol. 2018, 52, 12172–12178. [Google Scholar] [CrossRef]
  12. Baedecker, M.J.; Siegel, D.I.; Bennett, P.; Cozzarelli, I.M. The fate and effects of crude oil in a shallow aquifer. In US Geological Survey Toxic Substances Hydrology Program, Proceedings of the Technical Meeting, Phoenix, AZ, USA, 26–30 September 1988; Department of the Interior, US Geological Survey: Washington, DC, USA, 1989. [Google Scholar]
  13. Baedecker, M.J.; Cozzarelli, I.; Siegel, D.; Bennett, P.; Egan-house, R. Crude oil in a shallow sand and gravel aquifer. III. Biochemical reactions and mass balance modeling in anoxic groundwater. Appl. Geochem. 1993, 8, 569586. [Google Scholar] [CrossRef]
  14. Bennett, P.; Siegel, D.; Baedecker, M.J.; Hult, M. Crude oil in a shallow sand and gravel aquifer—I. Hydrogeology and inorganic geochemistry. Appl. Geochem. 1993, 8, 529–549. [Google Scholar] [CrossRef]
  15. Bekins, B.A.; Brennan, J.C.; Tillitt, D.E.; Cozzarelli, I.M.; Illig, J.M.; Martinović-Weigelt, D. Biological effects of hydrocarbon degradation intermediates: Is the total petroleum hydrocarbon analytical method adequate for risk assessment? Environ. Sci. Technol. 2020, 54, 11396–11404. [Google Scholar] [CrossRef] [PubMed]
  16. Essaid, H.I.; Bekins, B.A.; Godsy, E.M.; Warren, E.; Baedecker, M.J.; Cozzarelli, I.M. Simulation of aerobic and anaerobic biodegradation processes at a crude oil spill site. Water Resour. Res. 1995, 31, 3309–3327. [Google Scholar] [CrossRef]
  17. Cozzarelli, I.M.; Eganhouse, R.P.; Baedecker, M.J. Transformation of monoaromatic hydrocarbons to organic acids in anoxic groundwater environment. Environ. Geol. Water Sci. 1990, 16, 135–141. [Google Scholar] [CrossRef]
  18. Poursanidis, K.; Sharanik, J.; Hadjistassou, C. World’s largest natural gas leak from nord stream pipeline estimated at 478,000 tonnes. iScience 2024, 27, 1108772. [Google Scholar] [CrossRef]
  19. Zhao, H.; Zhang, D.; Lv, X.; Song, L.; Li, J.; Chen, F.; Xie, X. Numerical Simulation of Crude Oil Leakage from Damaged Submarine-Buried Pipeline Keywords: Submarine buried pipeline Crude oil leakage Oil spill Numerical simulation Multiphase flow. J. Appl. Fluid Mech. 2024, 17, 75–88. [Google Scholar]
  20. Lu, H.; Xu, Z.-D.; Song, K.; Cheng, Y.; Dong, S.; Fang, H.; Peng, H.; Fu, Y.; Xi, D.; Han, Z.; et al. Greenhouse gas emissions from U.S. crude oil pipeline accidents: 1968 to 2020. Sci. Data 2023, 10, 563. [Google Scholar] [CrossRef] [PubMed]
  21. Ismailov, N.; Nadjafova, S. Experience in Assessing Environmental Risks of Main Oil Pipelines in Azerbaijan through the Prism of Soil Biogeoresistance to Crude Oil Pollution. Mosc. Univ. Soil Sci. Bull. 2022, 77, 196–202. [Google Scholar] [CrossRef]
  22. Adewuyi, G.; Olowu, R. Assessment of oil and grease, total petroleum hydrocarbons and some heavy metals in surface and groundwater NNPC oil depot, Apata, Ibadan, Nigeria. Int. J. Aquat. Sci. 2012, 13, 45–76. [Google Scholar]
  23. Nambi, I.M.; Rajasekhar, B.; Loganathan, V.; RaviKrishna, R. An assessment of subsurface contamination of an urban coastal aquifer due to oil spill. Environ. Monit. Assess. 2017, 189, 148. [Google Scholar] [CrossRef]
  24. Gross, S.A.; Avens, H.J.; Banducci, A.M.; Sahmel, J.; Panko, J.M.; Tvermoes, B.E. Analysis of BTEX groundwater concentrations from surface spills associated with hydraulic fracturing operations. J. Air Waste Manag. Assoc. 2013, 63, 424–432. [Google Scholar] [CrossRef] [PubMed]
  25. Nwankwoala, H.O.; Omofuophu, E. Investigation of hydrocarbon contaminant levels and groundwater quality assessment in parts of Bonny Island, Rivers State of Nigeria. Cent. Asian J. Environ. Sci. Technol. Innov. 2020, 1, 61–70. [Google Scholar]
  26. UNEP. Environmental Assessment of Ogoniland, Nigeria; United Nations Environment Programme: Nairobi, Kenya, 2011. [Google Scholar]
  27. Sivasankar, V.; Gopalakrishna, G. Quantification of benzene in groundwater sources and risk analysis in a popular South Indian Pilgrimage City—A GIS based approach. Arab. J. Chem. 2017, 10, S2523–S2533. [Google Scholar]
  28. doRego, E.C.P.; Pereira, N.A.D. PAHs and BTEX in groundwater of gasoline stations from Rio de Janeiro City, Brazil. Bull. Environ. Contam. Toxicol. 2007, 79, 660–664. [Google Scholar] [CrossRef]
  29. Rao, S.M.; Joshua, R.E.; Arkenadan, L. BTEX contamination of Bengaluru aquifers, Karnataka, India. J. Environ. Eng. Sci. 2017, 12, 56–61. [Google Scholar] [CrossRef]
  30. Gomes, K.J.M.; Oliva, P.A.C.; da Rocha, H.O.; de Alcantara Mendes, R.; da Costa, A.C.G.; dos Santos Miranda, C.; de Oliveira Almeida, N. Evaluation of the contamination of the subsurface and groundwater by monoaromatic hydrocarbons in an eastern Amazonian town in northern Brazil. Environ. Earth Sci. 2023, 82, 23. [Google Scholar] [CrossRef]
  31. Joshua, R.E. Evaluation of Btex Contamination in Bengaluru Groundwater and Remediation of Contaminated Water Samples. Ph.D. Dissertation, Indian Institute of Science, Bangalore, India, 2020. [Google Scholar]
  32. Chen, X.; Zhang, S.; Yi, L.; Liu, Z.; Ye, X.; Yu, B.; Shi, S.; Lu, X. Evaluation of Biodegradation of BTEX in the Subsurface of a Petrochemical Site near the Yangtze River, China. Int. J. Environ. Res. Public Health 2022, 19, 16449. [Google Scholar] [CrossRef]
  33. Belpaire, C.; Goemans, G. Eels: Contaminant cocktails pinpointing environmental contamination. ICES J. Mar. Sci. 2007, 64, 1423–1436. [Google Scholar] [CrossRef]
  34. An, Y.-J. Toxicity of benzene, toluene, ethylbenzene, and xylene (BTEX) mixtures to Sorghum bicolor and Cucumis sativus. Bull. Environ. Contam. Toxicol. 2004, 72, 1006–1011. [Google Scholar] [CrossRef]
  35. Yang, Y.; Li, J.; Lv, N.; Wang, H.; Zhang, H. Multiphase migration and transformation of BTEX on groundwater table fluctuation in riparian petrochemical sites. Environ. Sci. Pollut. Res. 2023, 30, 55756–55767. [Google Scholar] [CrossRef]
  36. Kaur, G.; Lecka, J.; Krol, M.; Brar, S.K. Novel BTEX-degrading strains from subsurface soil: Isolation, identification and growth evaluation. Environ. Pollut. 2023, 335, 122303. [Google Scholar] [CrossRef] [PubMed]
  37. Alexander, M. Biodegradation and Bioremediation; Academic Press: San Diego, CA, USA, 1999. [Google Scholar]
  38. López, E.; Schuhmacher, M.; Domingo, J.L. Human health risks of petroleum-contaminated groundwater. Environ. Sci. Pollut. Res. 2008, 15, 278–288. [Google Scholar] [CrossRef]
  39. Mohammadi, L.; Rahdar, A.; Bazrafshan, E.; Dahmardeh, H.; Susan, M.A.B.H.; Kyzas, G.Z. Petroleum hydrocarbon removal from wastewaters: A review. Processes 2020, 8, 447. [Google Scholar] [CrossRef]
  40. Umar, H.; Abdul Khanan, M.; Ogbonnaya, C.; Shiru, M.; Ahmad, A.; Baba, A. Environmental and socioeconomic impacts of pipeline transport interdiction in Niger Delta, Nigeria. Heliyon 2021, 7, e06999. [Google Scholar] [CrossRef]
  41. Behnami, A.; Jafari, N.; Benis, K.Z.; Fanaei, F.; Abdolahnejad, A. Spatio-temporal variations, ozone and secondary organic aerosol formation potential, and health risk assessment of BTEX compounds in east of Azerbaijan Province, Iran. Urban Clim. 2023, 47, 101360. [Google Scholar] [CrossRef]
  42. WHO. Guidelines for Drinking-Water Quality: First Addendum to the Fourth Edition; WHO: Geneva, Switzerland, 2017. [Google Scholar]
  43. WHO. Exposure to Benzene: A Major Public Health Concern; WHO: Geneva, Switzerland, 2019. [Google Scholar]
  44. IARC. IARC Monographs on the Evaluation of Carcinogenic Risks to Humans; Volume 120: Benzene; International Agency for Research on Cancer: Lyon, France, 2018; Volume 120. [Google Scholar]
  45. Kuranchie, F.A.; Angnunavuri, P.N.; Attiogbe, F.; Nerquaye-Tetteh, E.N. Occupational exposure of benzene, toluene, ethylbenzene and xylene (BTEX) to pump attendants in Ghana: Implications for policy guidance. Cogent Environ. Sci. 2019, 5, 1603418. [Google Scholar] [CrossRef]
  46. Zoleikha, S.; Mirzaei, R.; Roksana, M. Exposure to chemical hazards in petrol pumps stations in Ahvaz City, Iran. Arch. Environ. Occup. Health 2017, 72, 3–9. [Google Scholar] [CrossRef] [PubMed]
  47. National Environmental Regulations. National Environmental (Surface and Ground Water Quality Control) Regulations of Nigeria; National Environmental Regulations: Lagos, Nigeria, 2011. [Google Scholar]
  48. Billersjö, S. In-Situ Remediation of Benzene-Contaminated Groundwater—A Bench-Scale Study; TRITA–LWR Degree Project 13:19; Royal Institute of Technology: Stockholm, Sweden, 2013; 37p. [Google Scholar]
  49. Bedics, A.; Táncsics, A.; Tóth, E.; Banerjee, S.; Harkai, P.; Kovács, B.; Bóka, K.; Kriszt, B. Microaerobic enrichment of benzene-degrading bacteria and description of Ideonella benzenivorans sp. nov., capable of degrading benzene, toluene and ethylbenzene under microaerobic conditions. Antonie Leeuwenhoek 2022, 115, 1113–1128. [Google Scholar] [CrossRef]
  50. Sohrabi, T.; Shakiba, M.; Mirzaei, F.; Pourbabaee, A. BTEX biodegradation using Bacillus sp. in a synthetic hypoxic aquatic environment: Optimization by Taguchi-based design of experiments. Int. J. Environ. Sci. Technol. 2022, 19, 5571–5578. [Google Scholar] [CrossRef]
  51. ATSDR. Toxicological Profile for Benzene; Agency for Toxic Substances and Disease Registry: Atlanta, GA, USA, 2007.
  52. Vaishnav, D.; Babeu, L. Comparison of Occurrence and Rates of Chemical Biodegradation in Natural Waters; Center for Lake Superior Environmental: Superior, WI, USA, 1987. [Google Scholar]
  53. Christensen, T.H.; Bjerg, P.L.; Banwart, S.A.; Jakobsen, R.; Heron, G.; Albrechtsen, H.-J. Characterization of redox conditions in groundwater contaminant plumes. J. Contam. Hydrol. 2000, 45, 165–241. [Google Scholar] [CrossRef]
  54. Vogt, C.; Kleinsteuber, S.; Richnow, H.H. Anaerobic benzene degradation by bacteria. Microb. Biotechnol. 2011, 4, 710–724. [Google Scholar] [CrossRef] [PubMed]
  55. Melkonian, C.; Fillinger, L.; Atashgahi, S.; da Rocha, U.N.; Kuiper, E.; Olivier, B.; Braster, M.; Gottstein, W.; Helmus, R.; Parsons, J.R. High biodiversity in a benzene-degrading nitrate-reducing culture is sustained by a few primary consumers. Commun. Biol. 2021, 4, 530. [Google Scholar]
  56. Wu, J.; Bian, J.; Wang, Q.; Ruan, D. Degradation of benzene in anaerobic groundwater in the typical cold industrial region: Identification, interactions, and optimization of nitrate-/sulfate-reducing assemblages. Biochem. Eng. J. 2023, 192, 108833. [Google Scholar] [CrossRef]
  57. Atashgahi, S.; Hornung, B.; van der Waals, M.J.; da Rocha, U.N.; Hugenholtz, F.; Nijsse, B.; Molenaar, D.; van Spanning, R.; Stams, A.J.M.; Gerritse, J.; et al. A benzene-degrading nitrate-reducing microbial consortium displays aerobic and anaerobic benzene degradation pathways. Sci. Rep. 2018, 8, 4490. [Google Scholar] [CrossRef]
  58. Toth, C.R.A.; Luo, F.; Bawa, N.; Webb, J.; Guo, S.; Dworatzek, S.; Edwards, E.A. Anaerobic Benzene Biodegradation Linked to the Growth of Highly Specific Bacterial Clades. Environ. Sci. Technol. 2021, 55, 7970–7980. [Google Scholar] [CrossRef] [PubMed]
  59. Wiedemeier, T.H.; Rifai, H.S.; Newell, C.J.; Wilson, J.T. Natural Attenuation of Fuels and Chlorinated Solvents in the Subsurface; John Wiley & Sons: Hoboken, NJ, USA, 1999. [Google Scholar]
  60. Kao, C.; Prosser, J. Evaluation of natural attenuation rate at a gasoline spill site. J. Hazard. Mater. 2001, 82, 275–289. [Google Scholar] [CrossRef]
  61. Scow, K.M.; Hicks, K.A. Natural attenuation and enhanced bioremediation of organic contaminants in groundwater. Curr. Opin. Biotechnol. 2005, 16, 246–253. [Google Scholar] [CrossRef] [PubMed]
  62. Cozzarelli, I.M.; Bekins, B.A.; Eganhouse, R.P.; Warren, E.; Essaid, H.I. In situ measurements of volatile aromatic hydrocarbon biodegradation rates in groundwater. J. Contam. Hydrol. 2010, 111, 48–64. [Google Scholar] [CrossRef]
  63. Choi, H.-M.; Lee, J.-Y. Groundwater contamination and natural attenuation capacity at a petroleum spilled facility in Korea. J. Environ. Sci. 2011, 23, 1650–1659. [Google Scholar] [CrossRef]
  64. Ordinioha, B.; Brisibe, S. The human health implications of crude oil spills in the Niger delta, Nigeria: An interpretation of published studies. Niger. Med. J. 2013, 54, 10–16. [Google Scholar] [CrossRef]
  65. Nriagu, J.; Udofia, E.A.; Ekong, I.; Ebuk, G. Health risks associated with oil pollution in the Niger Delta, Nigeria. Int. J. Environ. Res. Public Health 2016, 13, 346. [Google Scholar] [CrossRef] [PubMed]
  66. Nanadeinboemi, O.A.; Uju, M.L.; Christopher, C.N.; Hakeem, O.O.; David, D.S. Environmental and Health Influences of Crude Oil Spills in Niger Delta, Nigeria: Case Study Oporoma Community. J. Health Environ. Res. 2024, 8, 29–40. [Google Scholar] [CrossRef]
  67. Howard, I.C.; Okpara, K.E.; Techato, K. Toxicity and risks assessment of polycyclic aromatic hydrocarbons in river bed sediments of an artisanal crude oil refining area in the Niger Delta, Nigeria. Water 2021, 13, 3295. [Google Scholar] [CrossRef]
  68. Enuneku, A.; Ogbeide, O.; Okpara, B.; Kubeyinje, B.F.; Job, O.; Asemota, C.O.; Imoobe, T.; Ezemonye, L.I. Ingestion and dermal cancer risk via exposure to polycyclic aromatic hydrocarbon–contaminated soils in an oil-producing community, Niger Delta, Nigeria. Environ. Toxicol. Chem. 2021, 40, 261–271. [Google Scholar] [CrossRef]
  69. Kalnas, J.; Teitelbaum, D.T. Dermal Absorption of Benzene: Implications for Work Practices and Regulations. Int. J. Occup. Environ. Health 2000, 6, 114–121. [Google Scholar] [CrossRef]
  70. Obaje, N.G. Geology and Mineral Resources of Nigeria; Springer: Berlin/Heidelberg, Germany, 2009; Volume 120. [Google Scholar]
  71. Short, K.; Stäuble, A. Outline of geology of Niger Delta. AAPG Bull. 1967, 51, 761–779. [Google Scholar]
  72. Avbovbo, A.A. Tertiary lithostratigraphy of Niger Delta. AAPG Bull. 1978, 62, 295–300. [Google Scholar]
  73. Tuttle, M.L.; Charpentier, R.R.; Brownfield, M.E. The Niger Delta Petroleum System: Niger Delta Province, Nigeria, Cameroon, and Equatorial Guinea, Africa; US Department of the Interior, US Geological Survey: Washington, DC, USA, 1999.
  74. Ajaegwu, N.; Ozumba, B.; Anomneze, D.; Ugwueze, C. The impact of global drawdown of sea-level on the Messinian deposits of shallow offshore, Niger Delta, Nigeria. Basic Phys. Res. 2017, 7, 68–86. [Google Scholar]
  75. Akujieze, C.N.; Coker, S.; Oteze, G. Groundwater in Nigeria–a millennium experience–distribution, practice, problems and solutions. Hydrogeol. J. 2003, 11, 259–274. [Google Scholar] [CrossRef]
  76. Adelana, S.M.A.; Olasehinde, P.I.; Bale, R.B.; Vrbka, P.; Edet, A.E.; Goni, I.B. An Overview of the Geology and Hydrogeology of Nigeria; Taylor & Francis Group eBooks: London, UK, 2008; pp. 171–197. [Google Scholar]
  77. Akpokodje, E.; Etu-Efeotor, J.; Mbeledogu, I. A Study of Environmental Effects of Deep Subsurface Injection of Drilling Waste on Water Resources of the Niger Delta; CORDEC, University of Port Harcourt: Port Harcourt, Nigeria, 1996. [Google Scholar]
  78. Ogbe, O.; Opatola, O.; Idjerhe, W.; Ocheli, A. Reservoir quality evaluation of sand bodies of K-field, onshore Niger Delta, using wireline logs. Int. J. Sci. Emerg. Technol. Latest Trends 2013, 13, 46–64. [Google Scholar]
  79. Adagunodo, T.A.; Sunmonu, L.A.; Adabanija, M.A. Reservoir characterization and seal integrity of Jemir field in Niger Delta, Nigeria. J. Afr. Earth Sci. 2017, 129, 779–791. [Google Scholar] [CrossRef]
  80. Diab, A.I.; Sanuade, O.; Radwan, A.E. An integrated source rock potential, sequence stratigraphy, and petroleum geology of (Agbada-Akata) sediment succession, Niger Delta: Application of well logs aided by 3D seismic and basin modeling. J. Pet. Explor. Prod. Technol. 2023, 13, 237–257. [Google Scholar] [CrossRef]
  81. Adiela, U.; Odiri, N. Depositional Enviroment and Reservoir Characterization of the Z10 Reservoir sand, Niger Delta, Nigeria. Int. J. Pure Appl. Sci. Technol. 2018, 38, 008–012. [Google Scholar]
  82. Ogbe, O.B. Sequence stratigraphic controls on reservoir characterization and architectural analysis: A case study of Tovo field, coastal swamp depobelt, Niger Delta Basin, Nigeria. Mar. Pet. Geol. 2020, 121, 104579. [Google Scholar] [CrossRef]
  83. Onyeagocha, A. Petrography and depositional environment of the Benin Formation. J. Min. Geol. 1980, 17, 147–150. [Google Scholar]
  84. Ohwoghere-Asuma, O.; Oteng, F.M.; Ophori, D. Simulation of Saltwater Intrusion into Coastal Aquifer of the Western Niger Delta. In Recent Research on Hydrogeology, Geoecology and Atmospheric Sciences; Springer Nature Switzerland: Cham, Switzerland, 2023. [Google Scholar]
  85. Abam, T.; Nwankwoala, H. Hydrogeology of Eastern Niger Delta: A Review. J. Water Resour. Prot. 2020, 12, 741–777. [Google Scholar] [CrossRef]
  86. Richard, G.; Izah, S.C.; Morufu, O.R.; Austin-Asomeji, I. Public and environmental health implications of artisanal petroleum refining and risk reduction strategies in the Niger Delta region of Nigeria. Bio-Research 2023, 21, 1896–1910. [Google Scholar] [CrossRef]
  87. Ewim, D.R.E.; Orikpete, O.F.; Scott, T.O.; Onyebuchi, C.N.; Onukogu, A.O.; Uzougbo, C.G.; Onunka, C. Survey of wastewater issues due to oil spills and pollution in the Niger Delta area of Nigeria: A secondary data analysis. Bull. Natl. Res. Cent. 2023, 47, 116. [Google Scholar] [CrossRef]
  88. Sam, K.S.; Onyena, A.P.; Erieegha, O.J.; Eze, F. Water quality evaluation using water quality index and pollution model in selected communities in Gbaramatu Kingdom, Niger Delta, Nigeria. Afr. J. Environ. Sci. Technol. 2023, 17, 118–134. [Google Scholar]
  89. Adeniran, M.A.; Oladunjoye, M.A.; Doro, K.O. Soil and groundwater contamination by crude oil spillage: A review and implications for remediation projects in Nigeria. Front. Environ. Sci. 2023, 11, 1137496. [Google Scholar] [CrossRef]
  90. USEPA. Method 5021A: Volatile Organic Compounds in Various Sample Matrices Using Equilibrium Headspace Analysis; Revision 1; US Environmental Protection Agency: Washington, DC, USA, 2003.
  91. Newell, C.J. Calculation and Use of First-Order Rate Constants for Monitored Natural Attenuation Studies; US Environmental Protection Agency, National Risk Management Research Laboratory: San Francisco, CA, USA, 2002.
  92. McAllister, P.M.; Chiang, C.Y. A practical approach to evaluating natural attenuation of contaminants in ground water. Groundw. Monit. Remediat. 1994, 14, 161–173. [Google Scholar] [CrossRef]
  93. Bockelmann, A.; Zamfirescu, D.; Ptak, T.; Grathwohl, P.; Teutsch, G. Quantification of mass fluxes and natural attenuation rates at an industrial site with a limited monitoring network: A case study. J. Contam. Hydrol. 2003, 60, 97–121. [Google Scholar] [CrossRef] [PubMed]
  94. Lin, L.; Chaocheng, Z.; Qiyou, L.; Yunbo, Z.; Chunshuang, L.; Jianliang, X. Optimization for microbial degradation of dibenzothiophene by Pseudomonas sp. Lky-5 using response surface methodology. China Pet. Process. Petrochem. Technol. 2014, 16, 19–26. [Google Scholar]
  95. Aweto, K.; Ohwohere-Asuma, O.; Ovwamuedo, G.; Atiti, P. Hydro-geochemical characterization and Groundwater modelling of the subsurface around Ughelli West Engineered Dumpsite in the Western Niger Delta, Nigeria. Niger. J. Technol. Dev. 2023, 20, 62–72. [Google Scholar] [CrossRef]
  96. Eyankware, M.; Akakuru, O.; Ulakpa, R.; Eyankware, E. Hydrogeochemical approach in the assessment of coastal aquifer for domestic, industrial, and agricultural utilities in Port Harcourt urban, southern Nigeria. Int. J. Energy Water Resour. 2023, 7, 401–419. [Google Scholar] [CrossRef]
  97. Nwankwoala, H.O.; Walter, I. Assessment of groundwater quality in shallow coastal aquifers of Okrika Island, Eastern Niger Delta, Nigeria. Ife J. Sci. 2012, 14, 297–304. [Google Scholar]
  98. Piper, A.M. A graphic procedure in the geochemical interpretation of water-analyses. Eos Trans. Am. Geophys. Union 1944, 25, 914–928. [Google Scholar]
  99. Zhang, P.; Aagaard, P.; Gottschalk, L. Probability method used in predicting contaminant risk in groundwater adjacent to airport. Water Air Soil Pollut. 2010, 211, 323–339. [Google Scholar] [CrossRef]
  100. Freeze, R.; Cherry, J. Groundwater; Prentice-Hall, Inc.: Englewood Cliffs, NJ, USA, 1979. [Google Scholar]
  101. Pantazidou, M.; Sitar, N. Emplacement of nonaqueous liquids in the vadose zone. Water Resour. Res. 1993, 29, 705–722. [Google Scholar] [CrossRef]
  102. Wadge, A.; Salisbury, J. Benzene, National Environmental Health Forum Monographs; Air Series No. 2; South Australian Health Commission, Rundle Mall: Adelaide, SA, Australia, 1997. [Google Scholar]
  103. Baedecker, M.J.; Eganhouse, R.P.; Bekins, B.A.; Delin, G.N. Loss of volatile hydrocarbons from an LNAPL oil source. J. Contam. Hydrol. 2011, 126, 140–152. [Google Scholar] [CrossRef]
  104. Baedecker, M.J.; Eganhouse, R.P.; Qi, H.; Cozzarelli, I.M.; Trost, J.J.; Bekins, B.A. Weathering of oil in a surficial aquifer. Groundwater 2018, 56, 797–809. [Google Scholar] [CrossRef] [PubMed]
  105. Weidemeier, T.; Swanson, M.; Wilson, J.; Kampbell, D.; Miller, R.; Hansen, J. Approximation of Biodegradation Rate Constants for Monoaromatic Hydrocarbons (BTEX) in Ground Water; US Environmental Protection Agency Papers; U.S. Environmental Protection Agency: Washington, DC, USA, 1996; p. 26.
  106. Johnson, S.J.; Woolhouse, K.J.; Prommer, H.; Barry, D.A.; Christofi, N. Contribution of anaerobic microbial activity to natural attenuation of benzene in groundwater. Eng. Geol. 2003, 70, 343–349. [Google Scholar] [CrossRef]
  107. El-Naas, M.H.; Acio, J.A.; El Telib, A.E. Aerobic biodegradation of BTEX: Progresses and prospects. J. Environ. Chem. Eng. 2014, 2, 1104–1122. [Google Scholar] [CrossRef]
  108. Eziuzor, S.; Schmidt, M.; Vogt, C. Anaerobic benzene mineralization by natural microbial communities from Niger Delta. Biodegradation 2021, 32, 37–52. [Google Scholar] [CrossRef] [PubMed]
  109. Regan, S.; Hynds, P.; Flynn, R. An overview of dissolved organic carbon in groundwater and implications for drinking water safety. Hydrogeol. J. 2017, 25, 959. [Google Scholar] [CrossRef]
  110. Bekins, B.A.; Cozzarelli, I.M.; Erickson, M.L.; Steenson, R.A.; Thorn, K.A. Crude oil metabolites in groundwater at two spill sites. Groundwater 2016, 54, 681–691. [Google Scholar] [CrossRef]
  111. Podgorski, D.C.; Zito, P.; McGuire, J.T.; Martinovic-Weigelt, D.; Cozzarelli, I.M.; Bekins, B.A.; Spencer, R.G. Examining natural attenuation and acute toxicity of petroleum-derived dissolved organic matter with optical spectroscopy. Environ. Sci. Technol. 2018, 52, 6157–6166. [Google Scholar] [CrossRef]
  112. Chinago, A. Analysis of rainfall trend, fluctuation and pattern over Port Harcourt, Niger Delta coastal environment of Nigeria. Biodivers. Int. J. 2020, 4, 1–8. [Google Scholar] [CrossRef]
  113. McDonough, L.K.; Santos, I.R.; Andersen, M.S.; O’Carroll, D.M.; Rutlidge, H.; Meredith, K.; Oudone, P.; Bridgeman, J.; Gooddy, D.C.; Sorensen, J.P. Changes in global groundwater organic carbon driven by climate change and urbanization. Nat. Commun. 2020, 11, 1279. [Google Scholar] [CrossRef]
  114. Rajendiran, T.; Sabarathinam, C.; Panda, B.; Elumalai, V. Influence of Dissolved Oxygen, Water Level and Temperature on Dissolved Organic Carbon in Coastal Groundwater. Hydrology 2023, 10, 85. [Google Scholar] [CrossRef]
  115. Chapelle, F.H.; Bradley, P.M.; McMahon, P.B.; Kaiser, K.; Benner, R. Dissolved oxygen as an indicator of bioavailable dissolved organic carbon in groundwater. Groundwater 2012, 50, 230–241. [Google Scholar] [CrossRef] [PubMed]
  116. Ryan, J.N.; Gschwend, P.M. Effect of iron diagenesis on the transport of colloidal clay in an unconfined sand aquifer. Geochim. Cosmochim. Acta 1992, 56, 1507–1521. [Google Scholar] [CrossRef]
  117. White, A.F. Heterogeneous electrochemical reactions associated with oxidation of ferrous oxide and silicate surfaces. Rev. Mineral. Geochem. 1990, 23, 467–509. [Google Scholar]
  118. Appelo, C.A.J.; Postma, D. Geochemistry, Groundwater and Pollution; CRC Press: Boca Raton, FL, USA, 2005. [Google Scholar]
  119. Castro, A.R.; Martins, G.; Salvador, A.F.; Cavaleiro, A.J. Iron Compounds in anaerobic degradation of petroleum hydrocarbons: A review. Microorganisms 2022, 10, 2142. [Google Scholar] [CrossRef]
  120. Van Leeuwen, J.A.; Gerritse, J.; Hartog, N.; Ertl, S.; Parsons, J.R.; Hassanizadeh, S.M. Anaerobic degradation of benzene and other aromatic hydrocarbons in a tar-derived plume: Nitrate versus iron reducing conditions. J. Contam. Hydrol. 2022, 248, 104006. [Google Scholar] [CrossRef]
  121. Botton, S.; Parsons, J. Degradation of BTEX compounds under iron-reducing conditions in contaminated aquifer microcosms. Environ. Toxicol. Chem. 2006, 25, 2630–2638. [Google Scholar] [CrossRef]
  122. Marić, N.; Štrbački, J.; Polk, J.; Slavković Beškoski, L.; Avdalović, J.; Lješević, M.; Joksimović, K.; Žerađanin, A.; Beškoski, V.P. Spatial–temporal assessment of hydrocarbon biodegradation mechanisms at a contaminated groundwater site in Serbia. Chem. Ecol. 2022, 38, 95–107. [Google Scholar] [CrossRef]
  123. Jindrová, E.; Chocová, M.; Demnerová, K.; Brenner, V. Bacterial aerobic degradation of benzene, toluene, ethylbenzene and xylene. Folia Microbiol. 2002, 47, 83–93. [Google Scholar] [CrossRef] [PubMed]
  124. NRC. Alternatives for Managing the Nation’s Complex Contaminated Groundwater Sites; National Academies Press: Washington, DC, USA, 2013. [Google Scholar]
  125. Finneran, K.T.; Housewright, M.E. Enhanced anaerobic bioremediation of BTEX and TCE in groundwater. In Situ and On-Site Bioremediation; Battelle Press: Columbus, OH, USA, 2001; Volume 7. [Google Scholar]
  126. Singh, R.; Celin, S.M. Biodegradation of BTEX (benzene, toluene, ethyl benzene and xylene) compounds by bacterial strain under aerobic conditions. J. Ecobiotechnol. 2010, 2, 27–32. [Google Scholar]
  127. Seeger, E.M. Treatment of Groundwater Contaminated with Benzene, MTBE, and Ammonium by Constructed Wetlands. Ph.D. Thesis, Universität Tübingen, Tübingen, Germany, 2013. [Google Scholar]
  128. Ali, M.; Song, X.; Wang, Q.; Zhang, Z.; Zhang, M.; Chen, X.; Tang, Z.; Liu, X. Thermally enhanced biodegradation of benzo[a]pyrene and benzene co-contaminated soil: Bioavailability and generation of ROS. J. Hazard. Mater. 2023, 455, 131494. [Google Scholar] [CrossRef]
  129. Eze, M.O. Metagenome analysis of a hydrocarbon-degrading bacterial consortium reveals the specific roles of BTEX biodegraders. Genes 2021, 12, 98. [Google Scholar] [CrossRef] [PubMed]
  130. Wilson, J.T.; Pfeffer, F.M.; Weaver, J.W.; Kampbell, D.H.; Wiedemeier, T.H.; Hansen, J.E.; Miller, R.N. Intrinsic bioremediation of JP-4 jet fuel. In Proceedings of the Symposium on Intrinsic Bioremediation of Ground Water, EPA/540/R-94/515, Denver, CO, USA, 30 August–1 September 1994. [Google Scholar]
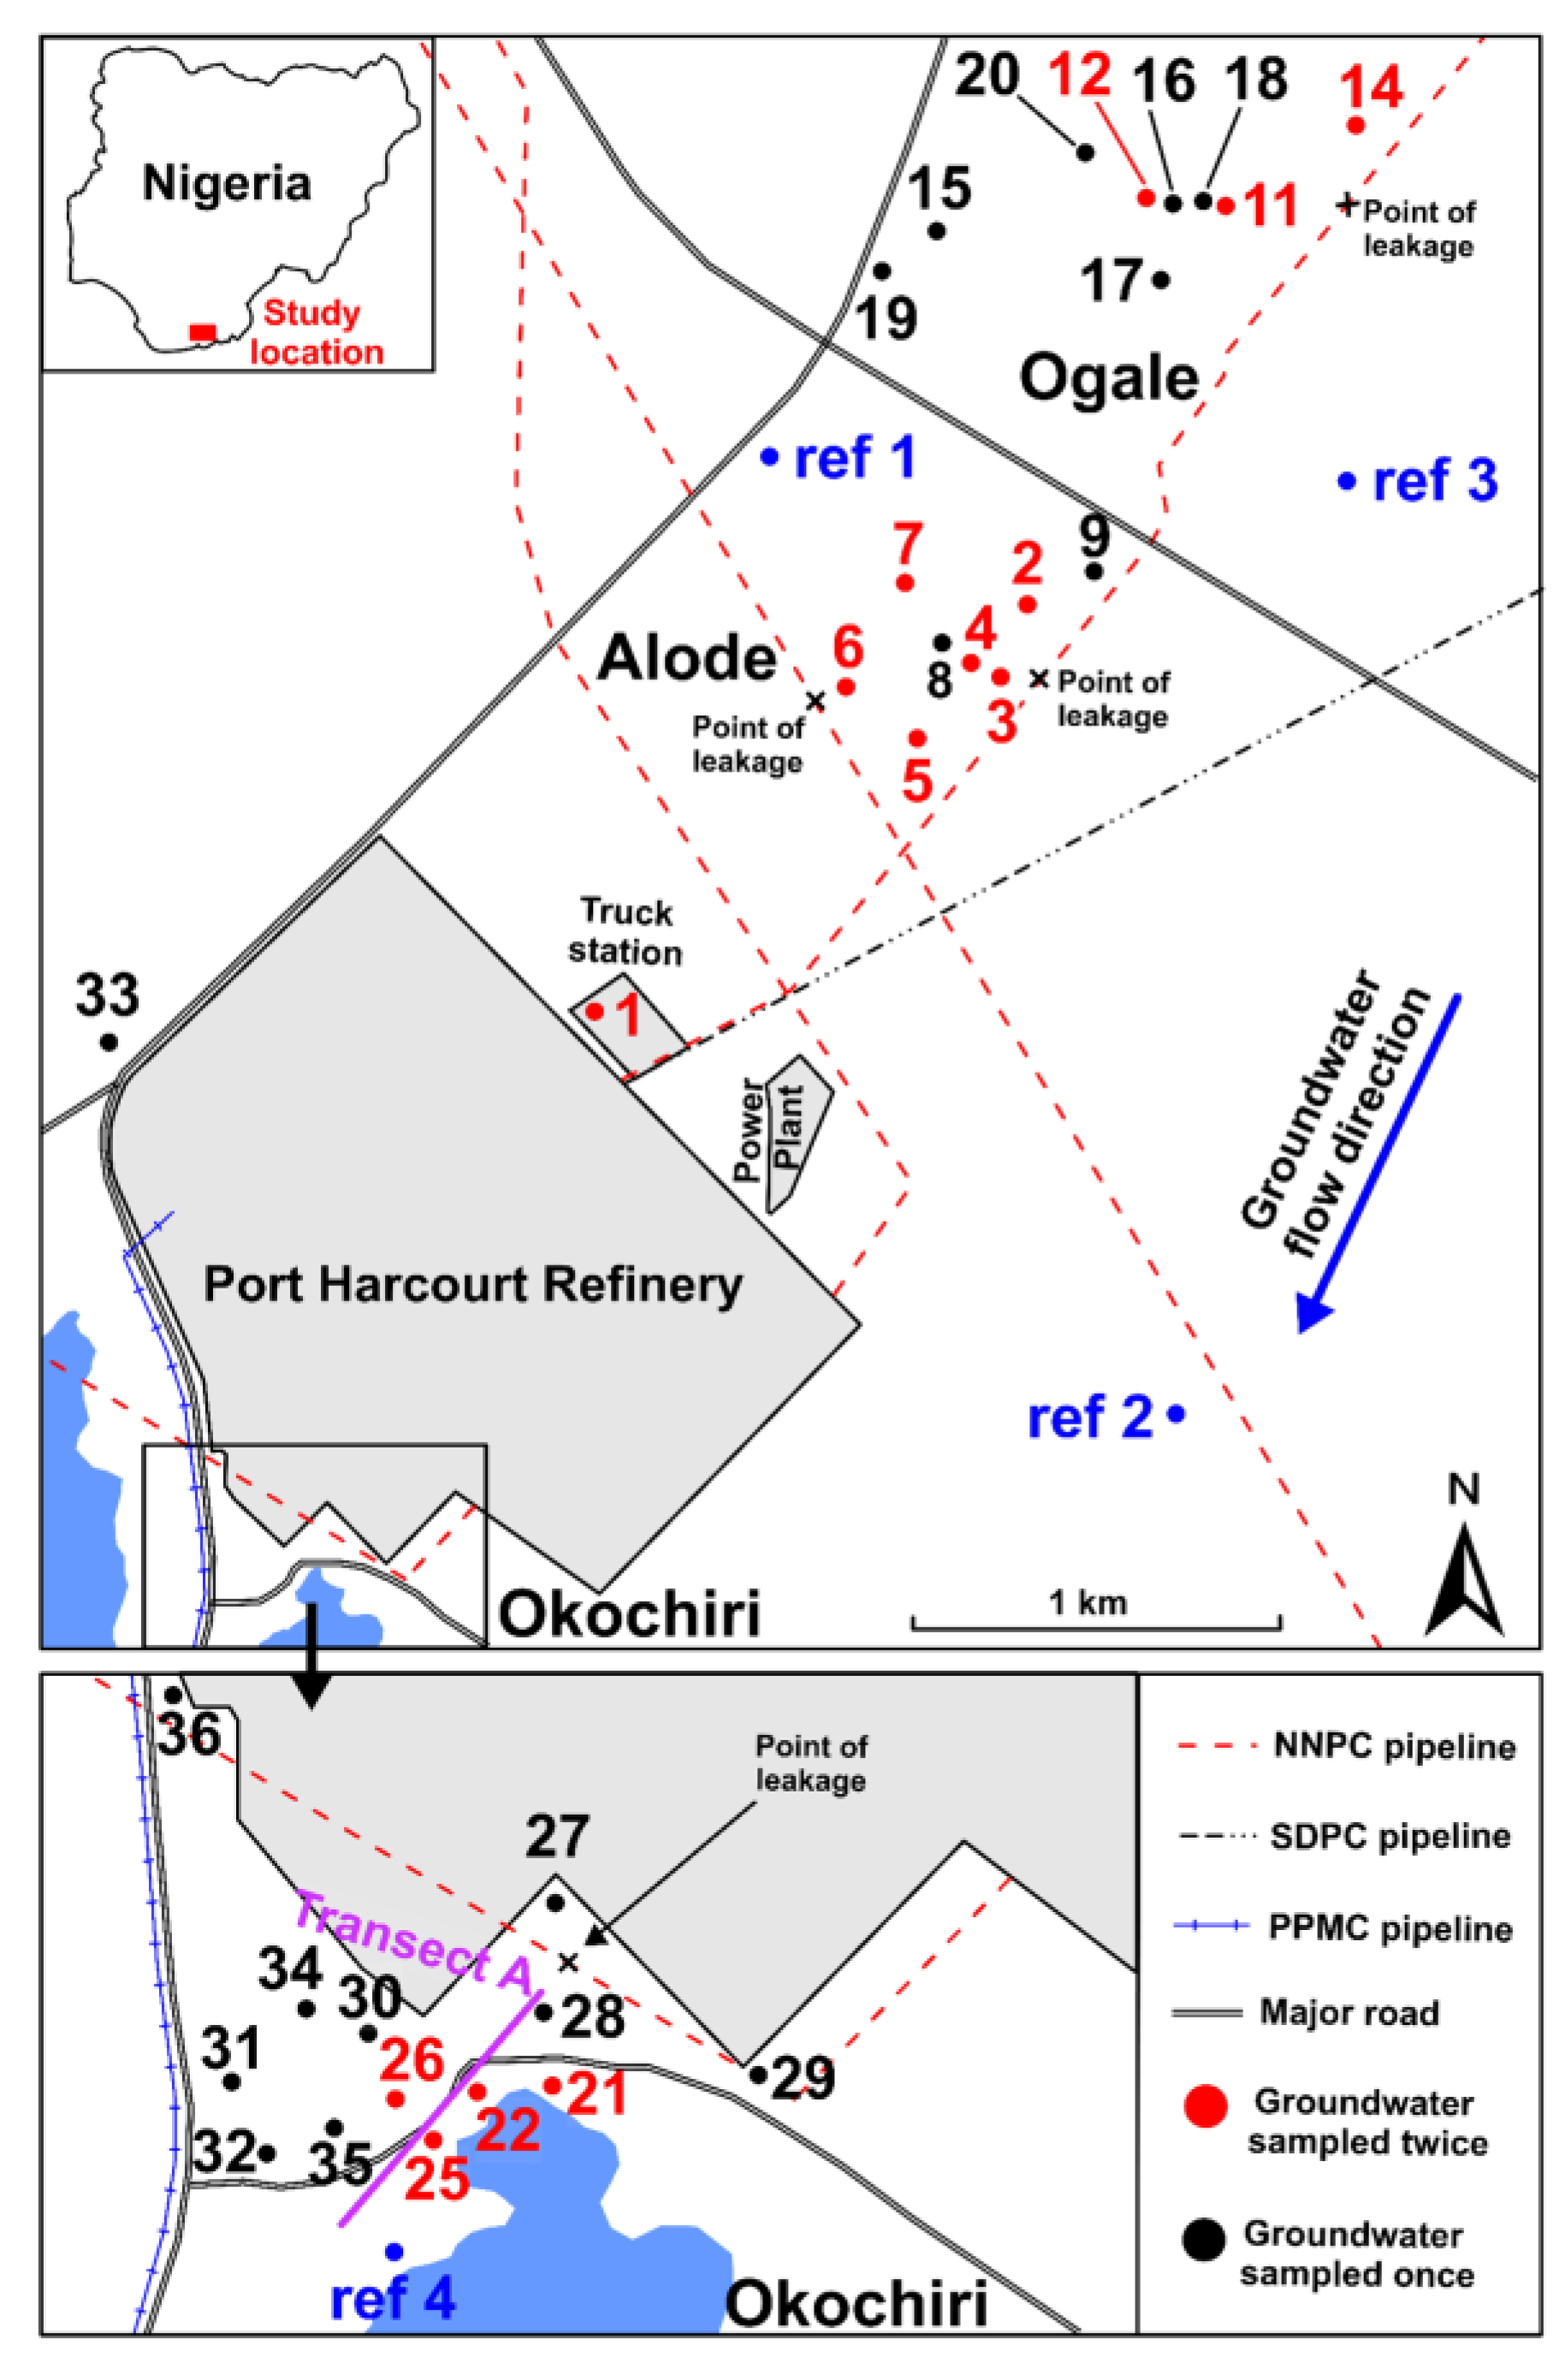
Figure 1. A site map showing the groundwater sample location and oil and gas production facilities. Transect A, indicated in purple, shows the groundwater flow path in Okochiri.
Environments 11 00221 g001
Figure 2. Piper diagram for groundwater of the study area.
Environments 11 00221 g002
Figure 3. A box plot of benzene, toluene, ethylbenzene, xylenes, and trimethylbenzene concentrations in the study area. The edges of the box represent the 75th and 25th percentiles, respectively. The “x” sign in the box represents the mean value. The solid line represents the median value. The branch gives the range of the data, except for the outliers.
Environments 11 00221 g003
Figure 4. DOC concentrations in the study area. The box’s edges represent the 75th and 25th percentiles, respectively. In the box, the “x” sign and the solid line represent the mean and median values, respectively. The branch gives the range of the data except for the outliers.
Environments 11 00221 g004
Figure 5. The relationship between groundwater benzene and other TEX concentrations and the distance from the petroleum pipeline leakage point in Okochiri for groundwater samples taken along the flow direction (transect A). The wells plotted are, from left to right, PSW 27, 28, 21, 22, 25, 26, 35, and REF 4.
Environments 11 00221 g005
Figure 6. Accumulated precipitates on PVC overhead drinking water storage tank situated directly above the NNPCL pipeline in Okochiri.
Environments 11 00221 g006
Figure 7. The relationship between Fe and pH in the groundwater in 2022 and 2023.
Environments 11 00221 g007
Figure 8. The relationship between (a) benzene vs. DO, (b) toluene vs. DO, (c) ethylbenzene vs. DO, and (d) total xylenes vs. DO in Alode, Ogale, and Okochiri groundwater.
Environments 11 00221 g008
Figure 9. The relationship between DO, benzene, toluene, ethylbenzene, and xylenes concentrations along the groundwater flow direction (transect A) in Okochiri. From left to right, the wells plotted are PSW 27, 28, 21, 22, 25, 26, 35, and REF 4.
Environments 11 00221 g009
Figure 10. A comparison between benzene concentrations in 2022 and 2023.
Environments 11 00221 g010
Table 1. Groundwater chemical measurements in the study area.
ParameterUnitsOkochiri (n = 15)Ogale (n = 7)Alode (n = 8)
pH 4.5–6.1 (5.4)4.1–6.6 (5.2)4.7–6.1 (5.1)
DOmg/L3.2–7.4 (6.3)0.7–5.9 (4.2)1.4–7.5 (5.5)
DO saturation%41.4–97 (85)9–74.5 (55.4)19–95 (76)
EhmV238–801 (652)118–561 (427)113–596 (401)
ECµS/cm21–207 (59)20–364 (67)20–106 (49)
TDSmg/L11–105 (30)10–183 (33)10–53 (25)
Temperature°C26.6–32.5 (29.3)25.12–30.7 (29.4)26.45–31 (30.8)
SalinityPSU0.01–0.1 (0.03)0.01–0.17 (0.03)0.01–0.1 (0.02)
Alkalinitymg/L0–25 (1)0–100 (0)0–30 (3)
DICmg/L0–31 (1.3)0–122 (0)0–37 (4)
Fmg/L<0.01<0.01–0.2 (<0.01)<0.01–3 (0.1)
Clmg/L1–6 (5)3–17 (8)<0.01–12 (4)
NO2mg/L<0.01<0.01–1 (<0.01)<0.01–3 (<0.01)
NO3mg/L<0.01–3 (2)<0.01–39 (2)<0.01–2 (<0.01)
SO42−mg/L1–14 (9)1–23 (6)1–20 (6)
Camg/L0.5–1 (0.6)0.2–13 (1)0.5–12 (2)
Namg/L0.6–15 (4)1–14 (4)0.6–10 (3)
Kmg/L0.2–1 (0.4)0.1–12 (1)0.1–7 (1)
Mgmg/L0.04–0.4 (0.2)0.02–4 (0.1)0.1–1 (0.3)
Simg/L0.5–5 (4)0.3–4 (3)1–4 (3.6)
Femg/L0.01–25 (0.2)0.01–50 (2)0.01–7 (1)
Mnmg/L0.01–0.3 (0.1)0.01–0.2 (0.02)0.01–0.2 (0.03)
Srmg/L0.002–0.01 (0.003)0.001–0.02 (0.003)0.001–0.03 (0.01)
DOCmg/L3–33 (24)9–49 (30)16–47 (32)
Notes: DO: dissolved oxygen; DOC: dissolved organic carbon; DIC: Dissolved Inorganic Carbon; EC: electrical conductivity; TDS: total dissolved solids; NA: not analyzed; n: number of samples. The values in parentheses are the median.
Table 2. A comparison of BTEX concentrations (µg/L) in the eastern Niger Delta region groundwater with other groundwater studies.
LocationBenzeneTolueneEthylbenzeneXylenesTrimethylbenzeneSource
Bragança, Brazil 1<0.1–0.6<0.1–10.4<0.1<0.1–0.5NAUST at gas station
Bengaluru, India 2<0.1–485<0.1–153<0.1–80<0.1–2620NAUST at gas station
China<0.1–644<0.1–16.7<0.1–209<0.1–181NAPetrochemical site
Bonny, Nigeria 3<0.1–660<0.1–800<0.1–250<0.1–4200NAPetroleum spillage
Eleme, Nigeria 4161–9280NANANANAPetroleum spillage
Minnesota, USA 5<0.1–2550<0.1–10.370.3–3.26<0.1–1230.7<0.1–678.23Pipeline rupture
Utah, USA 6<0.1–5600<0.1–58702–95036–90502–650Hydrocarbon storage facility
Eleme/Okrika, Nigeria 7<0.1–3500<0.1–210<0.1–370<0.1–360<0.1–220Pipeline leakage
ND: Not detected; NA: not analyzed; UST: Underground Storage Tank; References: 1: Gomes, Oliva [30]; 2: Joshua [31]; 3: Nwankwoala and Omofuophu [25]; 4: UNEP [26]; 5: Cozzarelli, Baedecker [10]; 6: Weidemeier, Swanson [105]; 7: this study.
Table 3. The results of EBC calculations.
YearParameterAlodeOgaleOkochiri
2022CP (mg/L, DO)3.61.533.23
CB (mg/L, DO)8.898.178.44
F3.143.143.14
EBCDO (mg/L)1.682.111.66
2023CP (mg/L, DO)1.40.665.32
CB (mg/L, DO)7.867.287.27
F3.143.143.14
EBCDO (mg/L)2.062.110.62
MeanEBCDO (mg/L)1.872.111.14
EBC: expressed biodegradation capacity; F: BTEX utilization factor using DO.
Table 4. Estimated point attenuation rates for total BTEX and benzene.
SampleSiteContaminantPoint Attenuation (day−1)Half-Life (yr)Remediation Goal aRemediation Time (yr) b
W-21OkochiriBenzene0.4257.10.000220.7
BTEX0.3837.70.000819.3
W-22OkochiriBenzene0.5724.60.000214.1
BTEX0.5564.50.000812
W-12OgaleBenzene0.12832.80.000266.5
BTEX0.08651.70.000885
W-1AlodeBenzene0.6933.50.000211.2
BTEX0.46094.80.00089.2
a Groundwater remediation goal of Nigeria [47]; b time required to reach the remediation goal.
Disclaimer/Publisher’s Note: The statements, opinions and data contained in all publications are solely those of the individual author(s) and contributor(s) and not of MDPI and/or the editor(s). MDPI and/or the editor(s) disclaim responsibility for any injury to people or property resulting from any ideas, methods, instructions or products referred to in the content.