Article

Impaired Soil Health in Agricultural Areas Close to Fe-Ni Mines on Euboea Island, Greece, Caused by Increased Concentrations of Potentially Toxic Elements, and the Associated Impacts on Human Health

Soil Science and Agricultural Chemistry Lab, Department of Natural Resources Management and Agricultural Engineering, Agricultural University of Athens, 75 Iera Odos St., 118 55 Athens, Greece
*
Authors to whom correspondence should be addressed.
Environments 2023, 10(9), 150; https://doi.org/10.3390/environments10090150
Submission received: 25 May 2023 / Revised: 9 August 2023 / Accepted: 11 August 2023 / Published: 22 August 2023

Abstract

:
Agricultural soils close to mining establishments may suffer from airborne pollution, due to excavation and transportation activities. To assess the impact of soil pollution from potentially toxic elements (PTEs) on soil and human health in agricultural areas close to Fe-Ni mines, 36 composite topsoil samples were collected from central Euboea Island, Greece. The soils were analyzed for their physicochemical properties and for total and bioavailable Ni, Cr, Co, Mn, Fe, Pb, Cu, and Zn concentrations; the BCR sequential extraction protocol was additionally applied to all samples. Soil enrichment caused by the metals and the implications of soil degradation on the ecosystem were evaluated using the calculation of single pollution indices (PI) and the potential ecological risk index (RI), respectively. The hazard index (HI) for non-carcinogenic metals and life cancer risk (LCR) for carcinogenic metals were used to appraise the human health risks. Extremely high, very high, and considerably high total concentrations of Ni, Cr, and Mn, respectively, were determined. Though most of the total amounts of metals in soil samples were found to be related to the residual fraction, the considerable portion extracted in the first two steps of the BCR process can be regarded as able to introduce toxicity issues in the local biota. High PI values of Cr, Co, and especially Ni point to severely polluted soils, and the mean RI values indicate a considerable risk for biota. HI values > 1 show increased possibilities for non-carcinogenic health issues in children, whereas the LCR values of Ni were above the critical limit, 1 × 10⁻⁴, for both children and adults.

1. Introduction

The intensive exploitation of natural resources that has been taking place in most countries for decades has, in many ways and in many cases, resulted in the degradation of the environment and of living standards for people [1,2]. Potentially toxic elements (PTEs) and their uncontrolled dispersion and deposition by anthropogenic processes, such as industry, urbanization, mining, emissions from the transportation of vehicles, and recycling, have a significant share in the pollution of agroecosystems [3,4,5].
Metallurgy and mining activities contaminate the surrounding areas in many cases, with PTEs contained both in the mining products and in other products used in metallurgy processes [2,6]. The impact of the above phenomenon is significantly enhanced when there are cultivated areas near the mining sites, as in the case of Fe-Ni mining in the region of Euboea, which is the subject of the present study. The mining procedures in the Euboea mines are mostly open and closed excavations, but underground mining activities have also been implemented. The Euboea mines have operated since 1969, and currently constitute the main sources of ore for the holding company LARCO GMMSA, contributing 1.2–1.5 million tons/year. The deposits from LARCO GMMSA comprise a significant majority of European deposits and fulfill a substantial portion of the European demand for Ni. Greece is the only producer of Fe-Ni with deposits inboard. The main PTE contaminating surface soil layers in Fe-Ni mines is Ni, with multiple references in the literature [7,8,9]; however, it is necessary not to underestimate the contribution of other PTEs, such as Co, Mn, Cr, Zn, Cu, and Fe, to the environmental degradation of agroecosystems [10].
Soil solution Ni forms both anionic (Ni(OH)3 and HNiO2) and cationic ((NiHCO3)+, NiOH+, and Ni+2) ions, depending mostly on the soil solution pH. Nickel concentration in soils varies due to the parent material, but pollution may also influence Ni concentration, especially in surface soil horizons. The world’s mean soil Ni concentration is 22 mg kg−1 [11]. According to Tsadilas et al. [12], in order of increasing Ni content, Chernozems are ranked lowest (6–61 mg Ni kg−1; mean value, 25), followed by Cambisols (3–110 mg Ni kg−1; mean value, 26), while the highest values are recorded for Calcisols (2–450 mg Ni kg−1; mean value, 34). However, in peripheral mine soils, Ni concentrations up to 450 times higher than the background level are recorded. For instance, in soils at Severonickel Smelter Complex (Kola Peninsula) and at Zvečan Pb-Zn smelter (northern Kosovo), Ni contents above 1000 mg kg−1 were found, while in the soils of the Sudbury area of Ontario, considered “the nickel capital of the world”, concentrations of up to 5000 mg kg−1 were recorded [13]. Similar Ni concentrations have been reported for mine soils in Greece, with 1100 mg kg−1 Ni reported in Thebes and 1800 mg kg−1 in the wider area of central Euboea [9,14,15].
At low concentrations, nickel in soil is considered as essential element for plants, due to its role in the enzyme that catalyzes the conversion of urea into NH4+ and CO2 [12], and it also has secondary beneficial properties [16,17]. On the other hand, high concentrations of the element pose problems of toxicity, soil degradation, and public health risks [18,19]. The environmental degradation of an agroecosystem can have multi-level effects, in terms of both the degradation of natural resources and the potential exposure of human and animal health to risk. An urgent need of our time, to develop sustainable models for the exploitation of natural resources with environmentally friendly strategies and circular economy rules, requires an excellent awareness and inventory of the current situation.
The aim of this study was to record and discuss the impact of the long-term operation of Fe-Ni mines in three areas of Euboea on both the quality of the surrounding agricultural soils and the potential risks to the local population caused by their exposure to the contaminated soils. To accomplish this objective, total and bioavailable Fe, Ni, Mn, Cr, Co, Zn, Pb, and Cu concentrations were determined in soils from the selected areas. The BCR sequential extraction protocol was employed to understand the geochemical behavior of these elements, and acceptable models for land degradation and human health risk assessment were implemented.

2. Materials and Methods

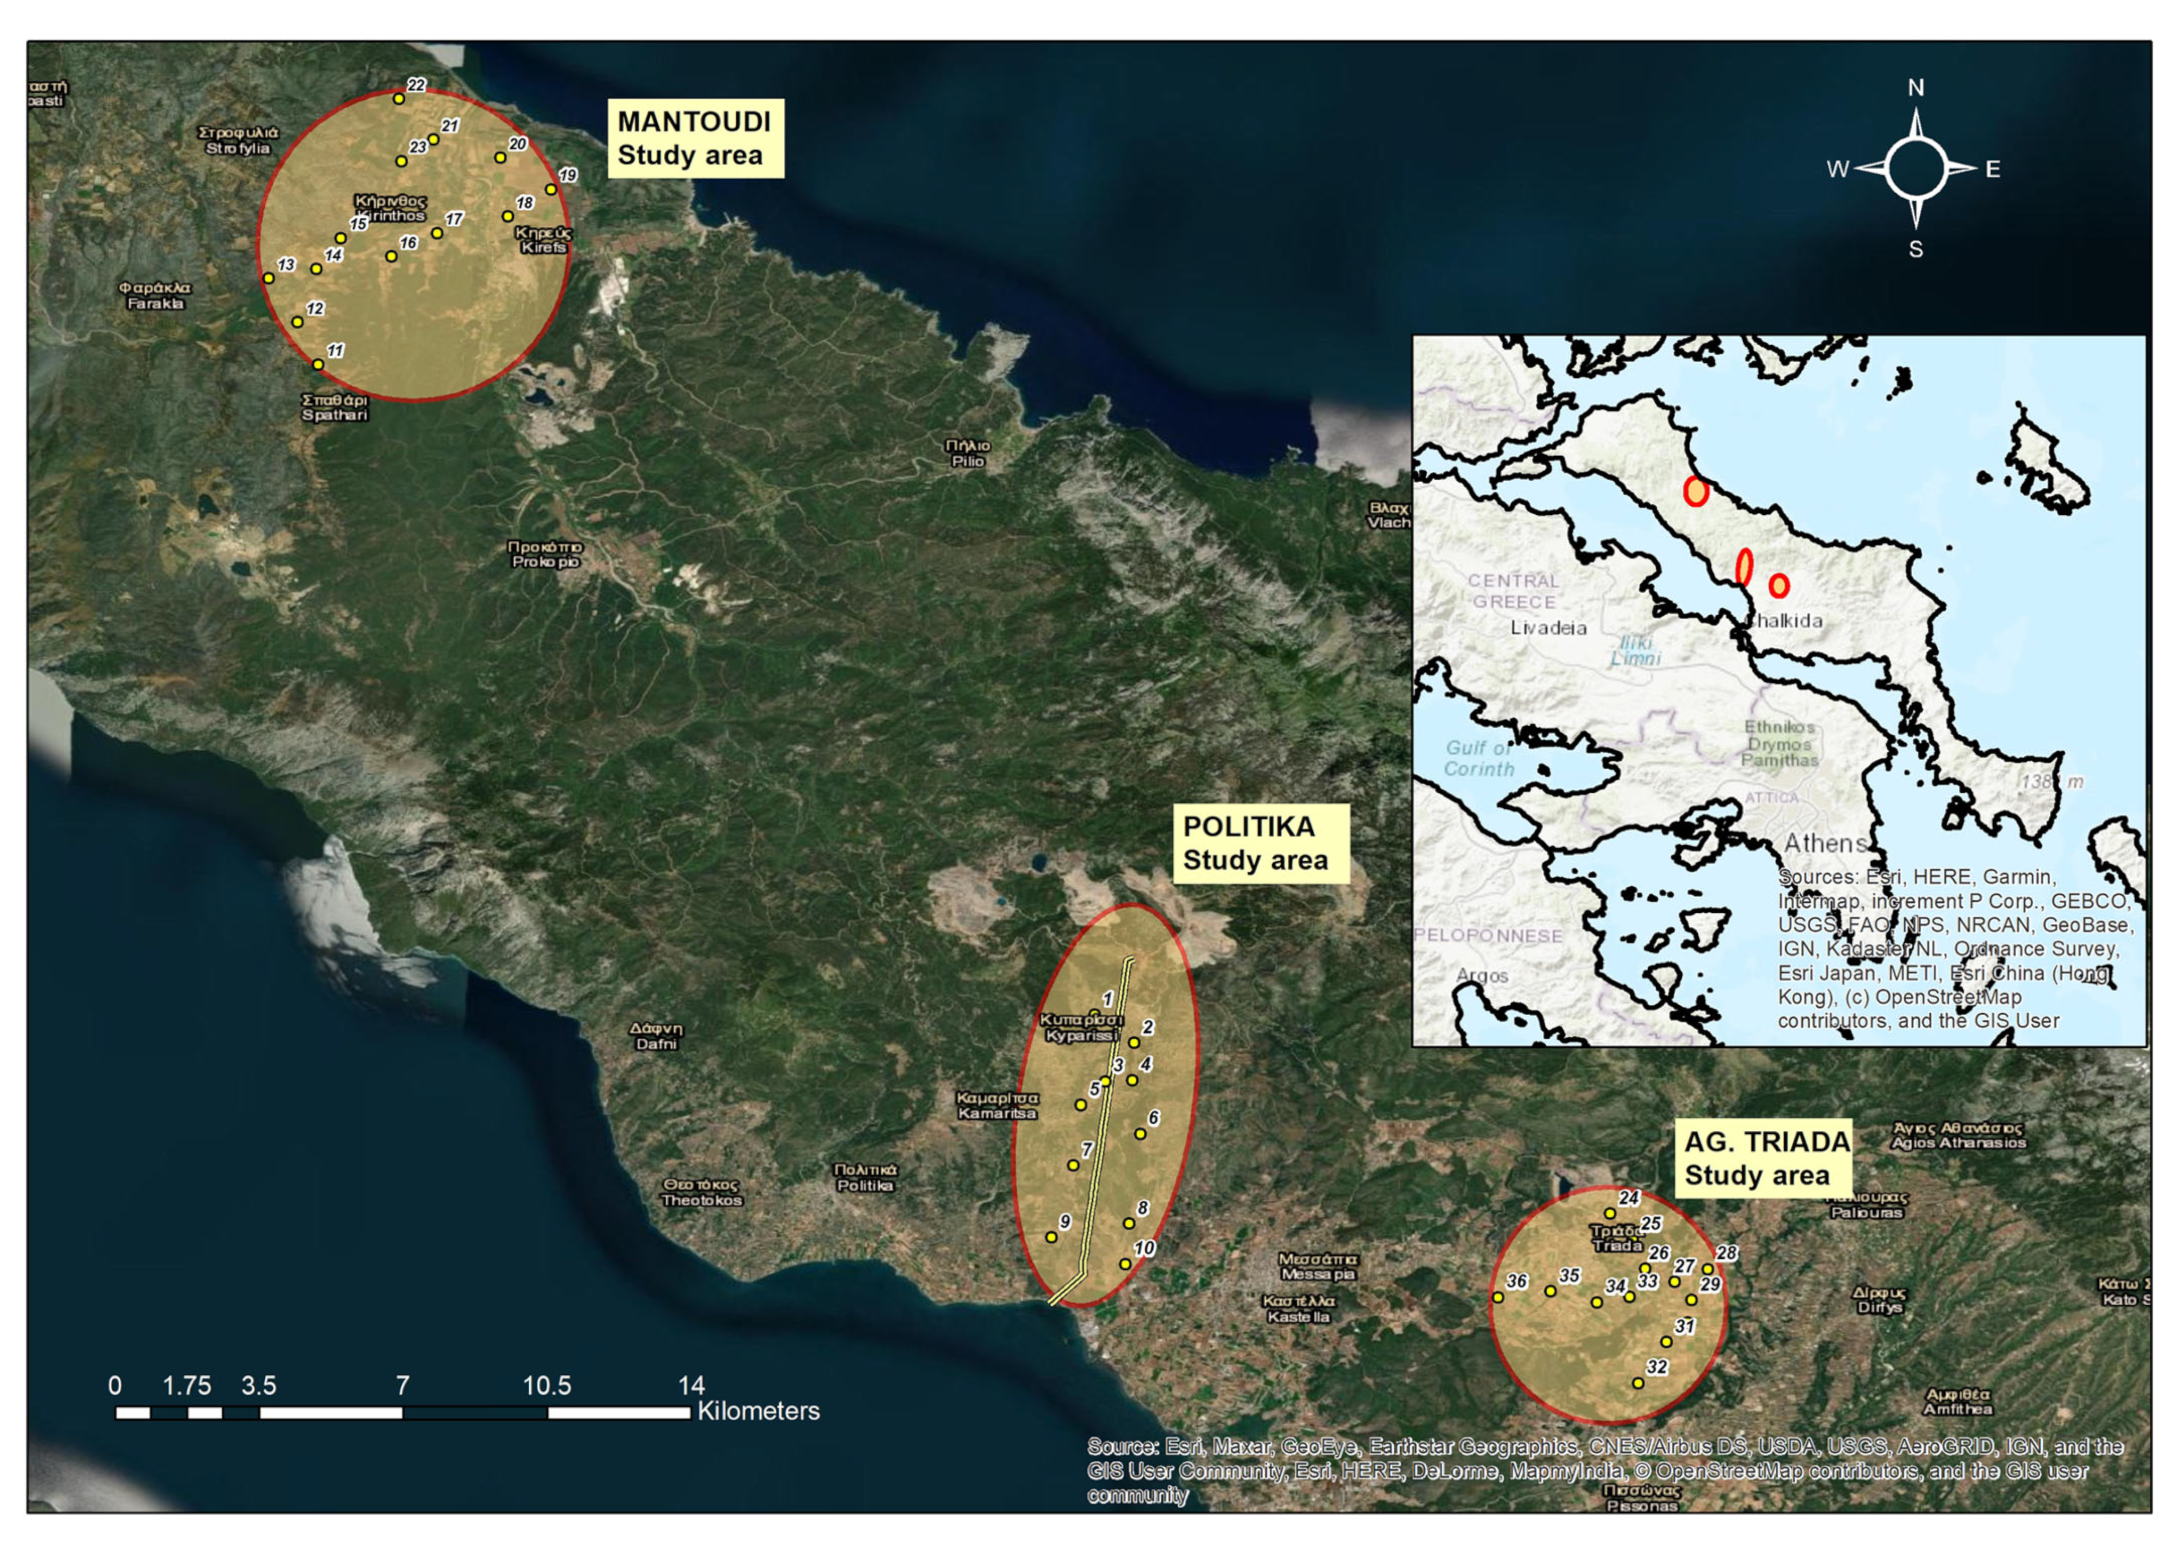
2.1. Description of Study Area

The study area was Central Euboea Island in Greece (Figure 1). According to the purpose of the study, three agricultural areas were selected, namely Politika, Mantoudi, and Ag. Triada. The main agricultural activity in Politika comprises olive tree orchards for olive oil production, whilst vegetables are mainly grown in the soils of the other two areas. In these areas, a considerable number of Fe-Ni mines operate, exploiting the nickeliferous laterite deposits in the geological substrate of Central Euboea that, apart from quaternary alluvial formations covering lowland areas, is characterized by widespread masses of ophiolites, which are composed of volcano-sedimentary formations, serpentinized peridotites, gabbros, amphibolites, and basalts. According to Economou et al. [20], the ore, as a limonitic type laterite, is poor in Ni (avg. 1.00–1.03%) and rich in Fe2O3 and SiO2.

Soils

The study area of Mantoudi occupies 3513.6 hectares (ha), and 61.3% of the area can be identified in the national soil map of Greece [21]. Based on this mapping, 41.0% of the Mantoudi area is covered in Fluvisols, 8.4% in Cambisols, 7.2% in Leptosols, and 4.7% in Calcisols [22]. The Politika study area covers 2582 hectares, 39.5% of which is included in the country’s soil map, with the reference soil group (RSG) of Cambisols occupying the largest area (38.7% of the area included) and Fluvisols representing only 0.8% of the mapped area. Finally, the Ag. Triada area, which spans 2018.7 ha, has the largest representation on the country’s soil map, with 81.0% of its area included, and is mostly occupied by Cambisols (69.0% of the mapped area) and secondarily by Fluvisols (12.0% of the area included in soil mapping).

2.2. Sample Collection, Preparation, and Analysis

During autumn 2021, 36 topsoil samples (0–20 cm depth) were collected from the three agricultural areas on northern central Euboea Island, Greece. From the area of Politika, 10 topsoil samples were obtained at a distance of ~50 m and from both sides of the belt by which the iron–nickel ore is transferred from the mines to a nearby harbor and from there shipped to the metallurgical factory (Figure 1). From the agricultural soils of the other two areas, Mantoudi and Ag. Triada, 26 samples were collected, 13 from each area, following a grid sampling strategy, modified to address accessibility issues where necessary (Figure 1). At every sampling site, three subsamples from a 1 × 1 m surface area were obtained and mixed to make a composite soil sample.
The soil samples were transferred to the laboratory in polyethylene bags, air-dried and sieved through a 2 mm sieve. Soil samples used for the sequential extraction procedure were passed through a 0.5 mm sieve. Particle size analysis was performed according to the Bouyoucos hydrometer method [23] and the organic matter content was determined using the Walkley–Black procedure [24]. Soil pH was determined in 1:1 w/v soil–water ratio slurries using standard glass/calomel electrodes. The CaCO3 equivalent percentage was estimated by measuring the evolved CO2 following HCl dilution [25]. The sodium citrate—bicarbonate—dithionite (CBD) [26] and the ammonium oxalate buffer methods [27] were used to obtain free and amorphous and poorly crystallized Fe, Mn and Al oxides contents, respectively.
The “pseudo-total” metal concentrations extracted by aqua regia (HNO3/HCl, 1:3). “Pseudo-total” expression accurately describes the metal concentrations determined in aqua regia extracts, because aqua regia digestion does not completely destroy silicates [28]. However, in the text of this study, the term “total” is used for simplicity.
Available metal fraction (water-soluble, easily exchangeable, and some of the organic bound metals) was extracted using diethylenetriaminepentaacetic acid (DTPA). In several studies, it was shown that DTPA is a suitable extractant for the determination of metals availability in soils [29]. DTPA was originally developed for calcareous soils (like the soils of this study) minimizing the dissolution of carbonates and mimicking rhizosphere effects in the soil.

2.2.1. Sequential Extraction Procedure

The Community Bureau of Reference (BCR) sequential extraction method, as modified by Rauret et al. [30], was applied to determine the chemical partitioning of Fe, Mn, Ni, Cr, and Co in the studied soils. Three chemical fractions are operationally defined; exchangeable/acid soluble (F1), reducible (F2), and oxidizable (F3). In brief, 1.0 g of dry soil was extracted in a 50 mL centrifuge tube with the corresponding extracting solution for each fractionation step. The F1 fraction was considered the most soluble and 0.11 mol L−1 acetic acid was used as the extractant. The F2 fraction, from which the reducible elements were obtained, was determined using 0.5 mol L−1 hydroxylamine hydrochloride. Finally, in the F3 extraction, the oxidizable fraction was obtained and 1 mol L−1 ammonium acetate was used following oxidation with 8.8 mol L−1 H2O2. The residual fraction (RF) was obtained via aqua regia digestion of the residue from the third extraction step. The analytical procedures are described in detail in Kalyvas et al. study [31].
The percentage recovery for all the studied elements was calculated as follows:
Recovery% = [(F1 + F2 + F3 + RF)/Total] × 100

2.2.2. Analytical Determinations

Aqua regia and DTPA-extracted Ni, Cr, Co, Mn, Zn, Cu, Pb, and Fe concentrations and Fe, Mn, Ni, Cr, and Co concentrations in the chemical fractions of BCR were determined by using Atomic Absorption spectrometry using a Varian AA240FS spectrometer (AA240FS, Varian, Middelburg, The Netherlands). Reproducibility was tested by reanalyzing 20% of the samples. The analytical precision, estimated as relative standard deviation, was less than 5%. To test the accuracy of the aqua regia digestion method, the ERM-CC141 loam soil was used as a reference material. The mean percentage recoveries of Ni, Cr, Co, Mn, Zn, Cu, and Pb were 97, 106, 95, 93, 97, and 95, respectively. All reagents used in this study were of analytical grade, and they were supplied by Merck Millipore (Darmstadt, Germany).

2.2.3. Statistics

For all properties, comparisons of means between the three studied areas were performed with a two-tailed t-test (p 0.05), while Pearson correlation was applied to the data to highlight significant relations using STATISTICA (StatSoft, Inc. 2011, v. 10, Tulsa, 74104, OK, USA) [32].

2.2.4. GIS

A popular method of interpolation based on inverse functions of distance [33], was used to interpolate values of the measured Ni, Cr, and Co Single Pollution indices (PIs), Potential Ecological Risk Index (RI), and Ni Hazard Index (HI-Ni) for children and to create the corresponding interpolated surfaces. The previous method of prediction, as a method of weighted average data, is called the Inverse Distance Weighted (IDW) method and uses the measured values of a parameter or an index surrounding unsampled locations to estimate its predicted values, based on the assumption that, at nearby locations, the examined variables have more similarities to each other than in more distant positions [34]. In our case, creating a very accurate, in terms of predicted values, interpolated surface was not in the scope of this research work, and the interpolated surfaces of the abovementioned PIs, RI, and HI-Ni were used only to display the spatial trend of the values to facilitate the discussion.

2.3. Single Pollution Index (PI)

The single pollution index was used to assess the level of soil contamination by a single metal. The PI was determined for Ni, Cr, Co, Zn, Cu, and Pb; for the calculation of PIs the following formula was used:
PI = Cit/Cref
where Cit is the total concentration of a metal at each sampling site, and Cref is the A threshold value of the Dutch soil pollution evaluation protocol corrected for the clay and organic matter contents of the i-soil sample. Cref for each studied metal and sampling site was obtained by using the following formula:
Cref = A value X ((a + (b × %clay) + (c × % O.M.))/((a + (b × 25) + (c × 10)))
The threshold A values for the metals examined in this study were (mg kg−1): Ni = 35, Cr = 100, Co = 10, Zn = 140, Cu = 35, and Pb = 85 [35]. In Table 1, the substance-dependent constants a, b, and c values for the studied metals are included [35].
When 1< PI< 2, soil enrichment is possible, and when PI> 2, soil contamination is probable. Higher PI values indicate more severe soil pollution.

2.4. Potential Ecological Risk Index (RI)

The potential ecological risk index (RI) was used to portray the cumulative environmental impact of the studied metals by assessing the potential risk of each metal, and represents the biota‘s sensitivity to the polluting PTEs. For the calculation of the RI, as introduced by Hakanson et al. [36] and implemented by many other researchers [32,37], the following formula was used:
RI = E r i
where RI is the sum of all the ecological risk factors for all studied metals and E r i   is the ecological risk factor for single metal pollution. E r i   was calculated as follows:
E r i = T r i × PI
where T r i   is the toxic response factor for single metal contamination, and PI is the single pollution index for the specific metal at each sampling site. Toxic response factors for the studied metals were adopted from Kusin et al. [38], Wei et al. [39], and Okonkwo et al. [40], and are presented in Table 2 along with the classification of the ecological risk factor ( E r i ) for single metal pollution and the potential ecological risk index (RI).
Table 2. Classification of environmental risk factor E r i , potential ecological risk index (RI), and toxic response factors T r i   for the studied metals. E r i and RI risk evaluation adopted from Kusin et al. [38] and T r i   values from Wei et al. [39] and Okonkwo et al. [40].
E r i Risk ClassificationRIRisk Classification T r i
E r i < 40Low RI < 50 Low Ni: 5
40 ≤ E r i   < 80 Moderate50 ≤ RI < 200Moderate Cr: 2
80 ≤ E r i   < 160 Considerable 200 ≤ RI < 300ConsiderableCo: 5
160 ≤ E r i   < 320 HighRI ≥ 300 HighZn: 1
E r i ≥ 320 Very high Cu: 5
Pb: 5
Mn: 1

2.5. Human Health Assessment

Metals can enter the human body from the soil through three major pathways, namely, oral ingestion of soil particles, inhalation of soil dust, and dermal absorption through contact of exposed skin with soil. The estimation of the health risk for children and adults due to ingestion, inhalation, and dermal absorption was assessed through the calculation of the average daily dose (ADD), applying the following equations [37].
ADDing = ((Csoil × IngR × EF × ED × CF)/(BW × AT)
ADDinh = (Csoil × InhR × EF × ED)/(PEF × BW × AT)
ADDderm = (Csoil × SA × CF × AFsoil × ABS × EF × ED)/(BW × AT)
where, Csoil is the aqua regia extracted concentration of metal in the soil and sampling site (mg kg−1), IngR is the ingestion rate (mg day−1), EF is the exposure frequency (days year−1), ED indicates the exposure duration (years), CF is the conversion factor (kg mg−1), BW is the body weight (kg), AT is the average exposure time to different metals (days), InhR is the inhalation rate (mg cm−2), PEF is the particle emission factor (m3 kg−1), SA is the exposed to soil contact skin area (cm2), AFsoil is the skin adhesion factor for soil (mg cm−2), and ABS is the dermal adsorption factor (dimensionless). All the values of the exposure factors used for the calculation of ADDs are listed in Table 3.
The exposure of human body via the three exposure routes (i.e., soil ingestion, soil inhalation, and soil dermal absorption) in the studied metals, was assessed for non-carcinogenic health risks and for carcinogenic health risks only for Ni, Co, Cr, and Pb.
The cumulative non-carcinogenic risk is estimated by the Hazard Index (HI) by summing up all the hazard quotients (HQ). For the calculation of HQ and HI, the following equations were used:
HQ = ADD/RfD
where RfD is the reference dose value, specific for each metal and exposure route (Table 4), and
HI = ∑ HQ = HQing + HQinh + HQderm
When HI values exceed one (HI > 1), non-carcinogenic health effects may occur that may increase in importance as HI values increase [40]. HI < 1 indicates insignificant non-carcinogenic health effects.
The carcinogenic health risks for Ni, Co, Cr, and Pb were expressed by the total life cancer risk (LCR) determined by the estimation of the total value of cancer risks for every exposure route, by using the following equations:
Cancer risk = ADD × CSF
where CSF is the cancer slope factor, specific for each metal and exposure route (Table 4), and
LCR = Cancer risking + Cancer riskinh + Carcer riskderm
If LCR > 1 × 10⁻⁴, carcinogenic health effects are highly possible, while LCR values between 1 × 10⁻⁶ and 1 × 10⁻⁴ are acceptable for regulatory purposes [41].
Table 3. Exposure factors used in Average Daily Dose (ADD) estimation [42].
ParameterValue
IngR100 mg day−1 (adult), 200 mg day −1 (child)
EF350 days year−1
ED24 years (adult), 6 years (child)
BW70 kg (adult), 15 kg (child)
AT365 × ED adult/child (days)
CF1 × 10−6 kg mg−1
InhR20 mg cm−2
PEF1.36 × 109 m3 kg−1
SA5800 cm2 event−1 (adult), 2100 cm2 event−1 (child)
AFsoil0.07 mg cm−2
ABS0.001 (adult and child)
IngR: ingestion rate; EF: exposure frequency; ED: exposure duration; BW: body weight; AT: average exposure time to different metals; CF: conversion factor; InhR: inhalation rate; PEF: particle emission factor; SA: exposed to soil contact skin area; AFsoil: skin adhesion factor for soil; ABS: dermal absorption factor.
Table 4. The reference dose (RfD) and cancer slope factor (CSF) values used in this study [36].
ElementRfDingRfDinhRfDdermCSFingCSFinh
Ni2 × 10−22.5 × 10−25.6 × 10−3 0.91 0.0421
Cr1.53 × 10−53 × 10−3 47.6
Co2 × 10−25.76 × 10−65.76 × 10−6 9.8
Mn1.4 × 10−11.4 × 10−15.6 × 10−2
Pb3.5 × 10−33.25 × 10−35.25 × 10−48.5 × 10−34.2 × 10−2
Cu4 × 10−24.02 × 10−21.2 × 10−2
Zn3 × 10−13.5 × 10−13 × 10−1
ing: ingestion; inh: inhalation; derm: dermal absorption.

3. Results

3.1. Soil Properties

The examined soil properties and comparisons of mean values between the three areas are presented in Table 5. The soils of the studied areas are neutral to slightly alkaline, with medium amounts of carbonates (expressed as CaCO3eq), moderate E.C. values, and generally low organic carbon contents. They are classified as heavy soils (most of them classified as Clay to Clay–Loam). Iron and manganese concentrations extracted by ammonium oxalate are higher in the soils of Mantoudi, significantly higher compared to Politika soils. Since Fe and Mn are generated from the dissolution of amorphous Fe and Mn oxides, their concentrations determined following this extraction protocol correspond to the amorphous and poorly crystalline Fe and Mn oxide content in the soils. Carbonate content and E.C. values were significantly lower in the soils of the Mantoudi area compared to Politika, while organic carbon content was significantly higher in the soils of Politika compared to Mantoudi and Ag. Triada soils. Considering that these differences in soil properties are relatively small, it can be assumed that the soils of the studied areas present similar characteristics.

3.2. Aqua Regia

In Table 6, the descriptive statistics of total PTEs concentrations and comparisons of mean values are included.

3.2.1. Manganese

Total manganese concentrations ranged between 972 and 1628 mg kg−1 in Politika soils, 1243 and 2254 mg kg−1 in Mantoudi soils, and 726 and 2202 mg kg−1 in the soils of Ag. Triada. The corresponding mean total concentrations are 1360.38, 1675.43, and 1322.16 mg kg−1, respectively. The soils of Mantoudi showed a significantly higher Mn content.

3.2.2. Nickel

Total nickel concentrations in the soils of Politika, Mantoudi, and Ag. Triada ranged between 510 and 3490, 1050 and 2926, and 1358 and 3780 mg kg−1, respectively, while the corresponding mean values were 1946.88, 1682.31, and 2220.67 mg kg−1, respectively. A significantly lower mean Ni content was recorded for the soils of Mantoudi whereas no difference was observed between the soils of Politika and Ag. Triada.

3.2.3. Chromium

Total chromium concentrations in the soils of Politika, Mantoudi, and Ag. Triada ranged between 328 and 1174, 257 and 581, and 475 and 2444 mg kg−1, respectively, while the corresponding mean values were 711.43, 445.88, and 1156.37 mg kg−1, respectively. A significantly higher Cr content was recorded for the soils of Ag. Triada and significantly lower for the soils of Mantoudi.

3.2.4. Cobalt

Total cobalt concentrations in the soils of Politika, Mantoudi, and Ag. Triada ranged between 57 and 182, 86 and 182, and 90 and 185 mg kg−1, respectively, while the corresponding mean values were 122.02, 121.76, and 136.21 mg kg−1, respectively. No significant differences between mean Co total concentrations in the soils of the three areas were observed.

3.2.5. Lead, Zinc, and Copper

Total concentrations of lead, zinc, and copper were generally low. The highest mean total Pb concentration was recorded for the soils of Politika and the significantly lowest for the soils of Ag. Triada; the corresponding values were 15.39 and 3.63 mg kg−1. Mean total Zn concentrations in the soils of Politika, Mantoudi, and Ag. Triada were 51.68, 38.52, and 49.89 mg kg−1, respectively, and no significant difference between the three areas was observed. The mean total Cu concentration in the soils of Mantoudi was 62.05 mg kg−1, significantly higher than the mean total Cu concentrations in the soils of Politika and Ag. Triada, which were 41.09 and 40.60 mg kg−1, respectively.

3.3. Diethylenetriamine Pentaacetic Acid (DTPA)

The determination of the bioavailable fraction of Fe, Mn, Cu, and Zn in alkaline soils by DTPA is well established [43,44,45]. The same protocol is also used to estimate Ni availability in soils [46,47]. The descriptive statistics of the DTPA-extracted fractions are presented in Table 7. The highest Fe and Mn bioavaliable concentrations were recorded for the soils of Politika, and the lowest for the soils of Mantoudi. Bioavaliable Ni, Zn, and Co concentrations were significantly lower in the soils of Mantoudi compared to the soils of Politika and Ag. Triada, whereas a significantly lower Cu concentration was recorded for the soils of Politika.

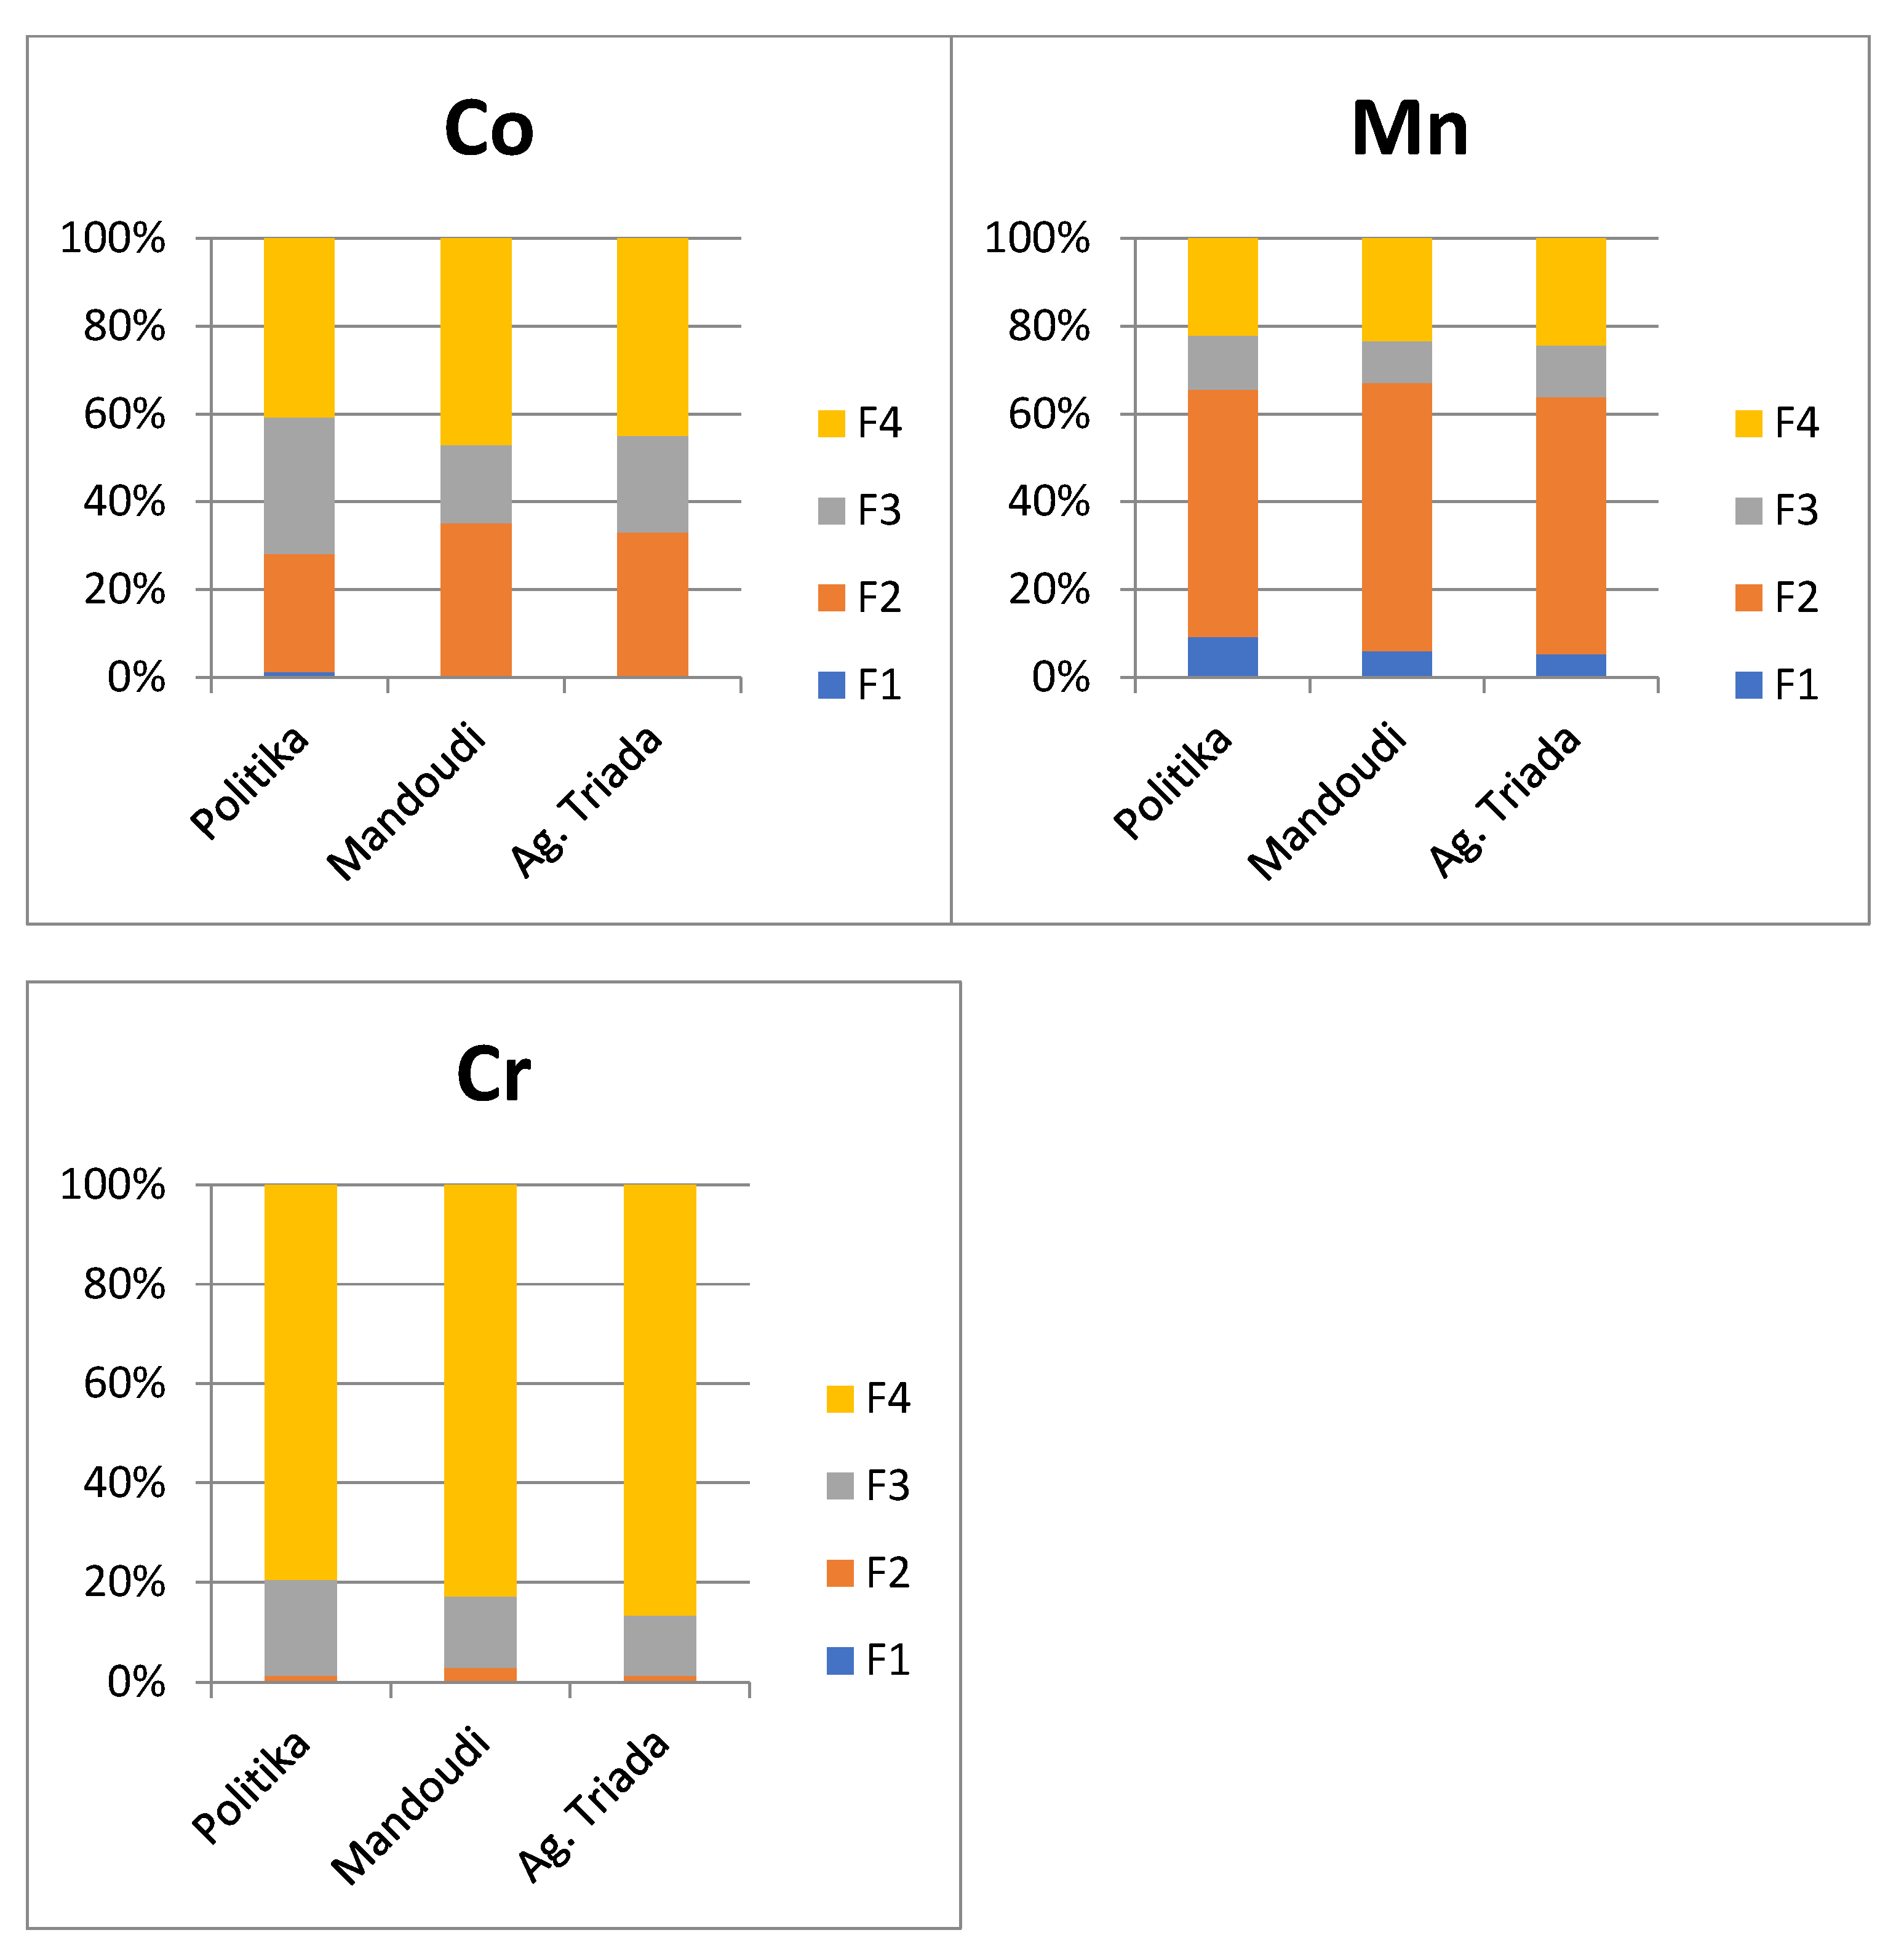
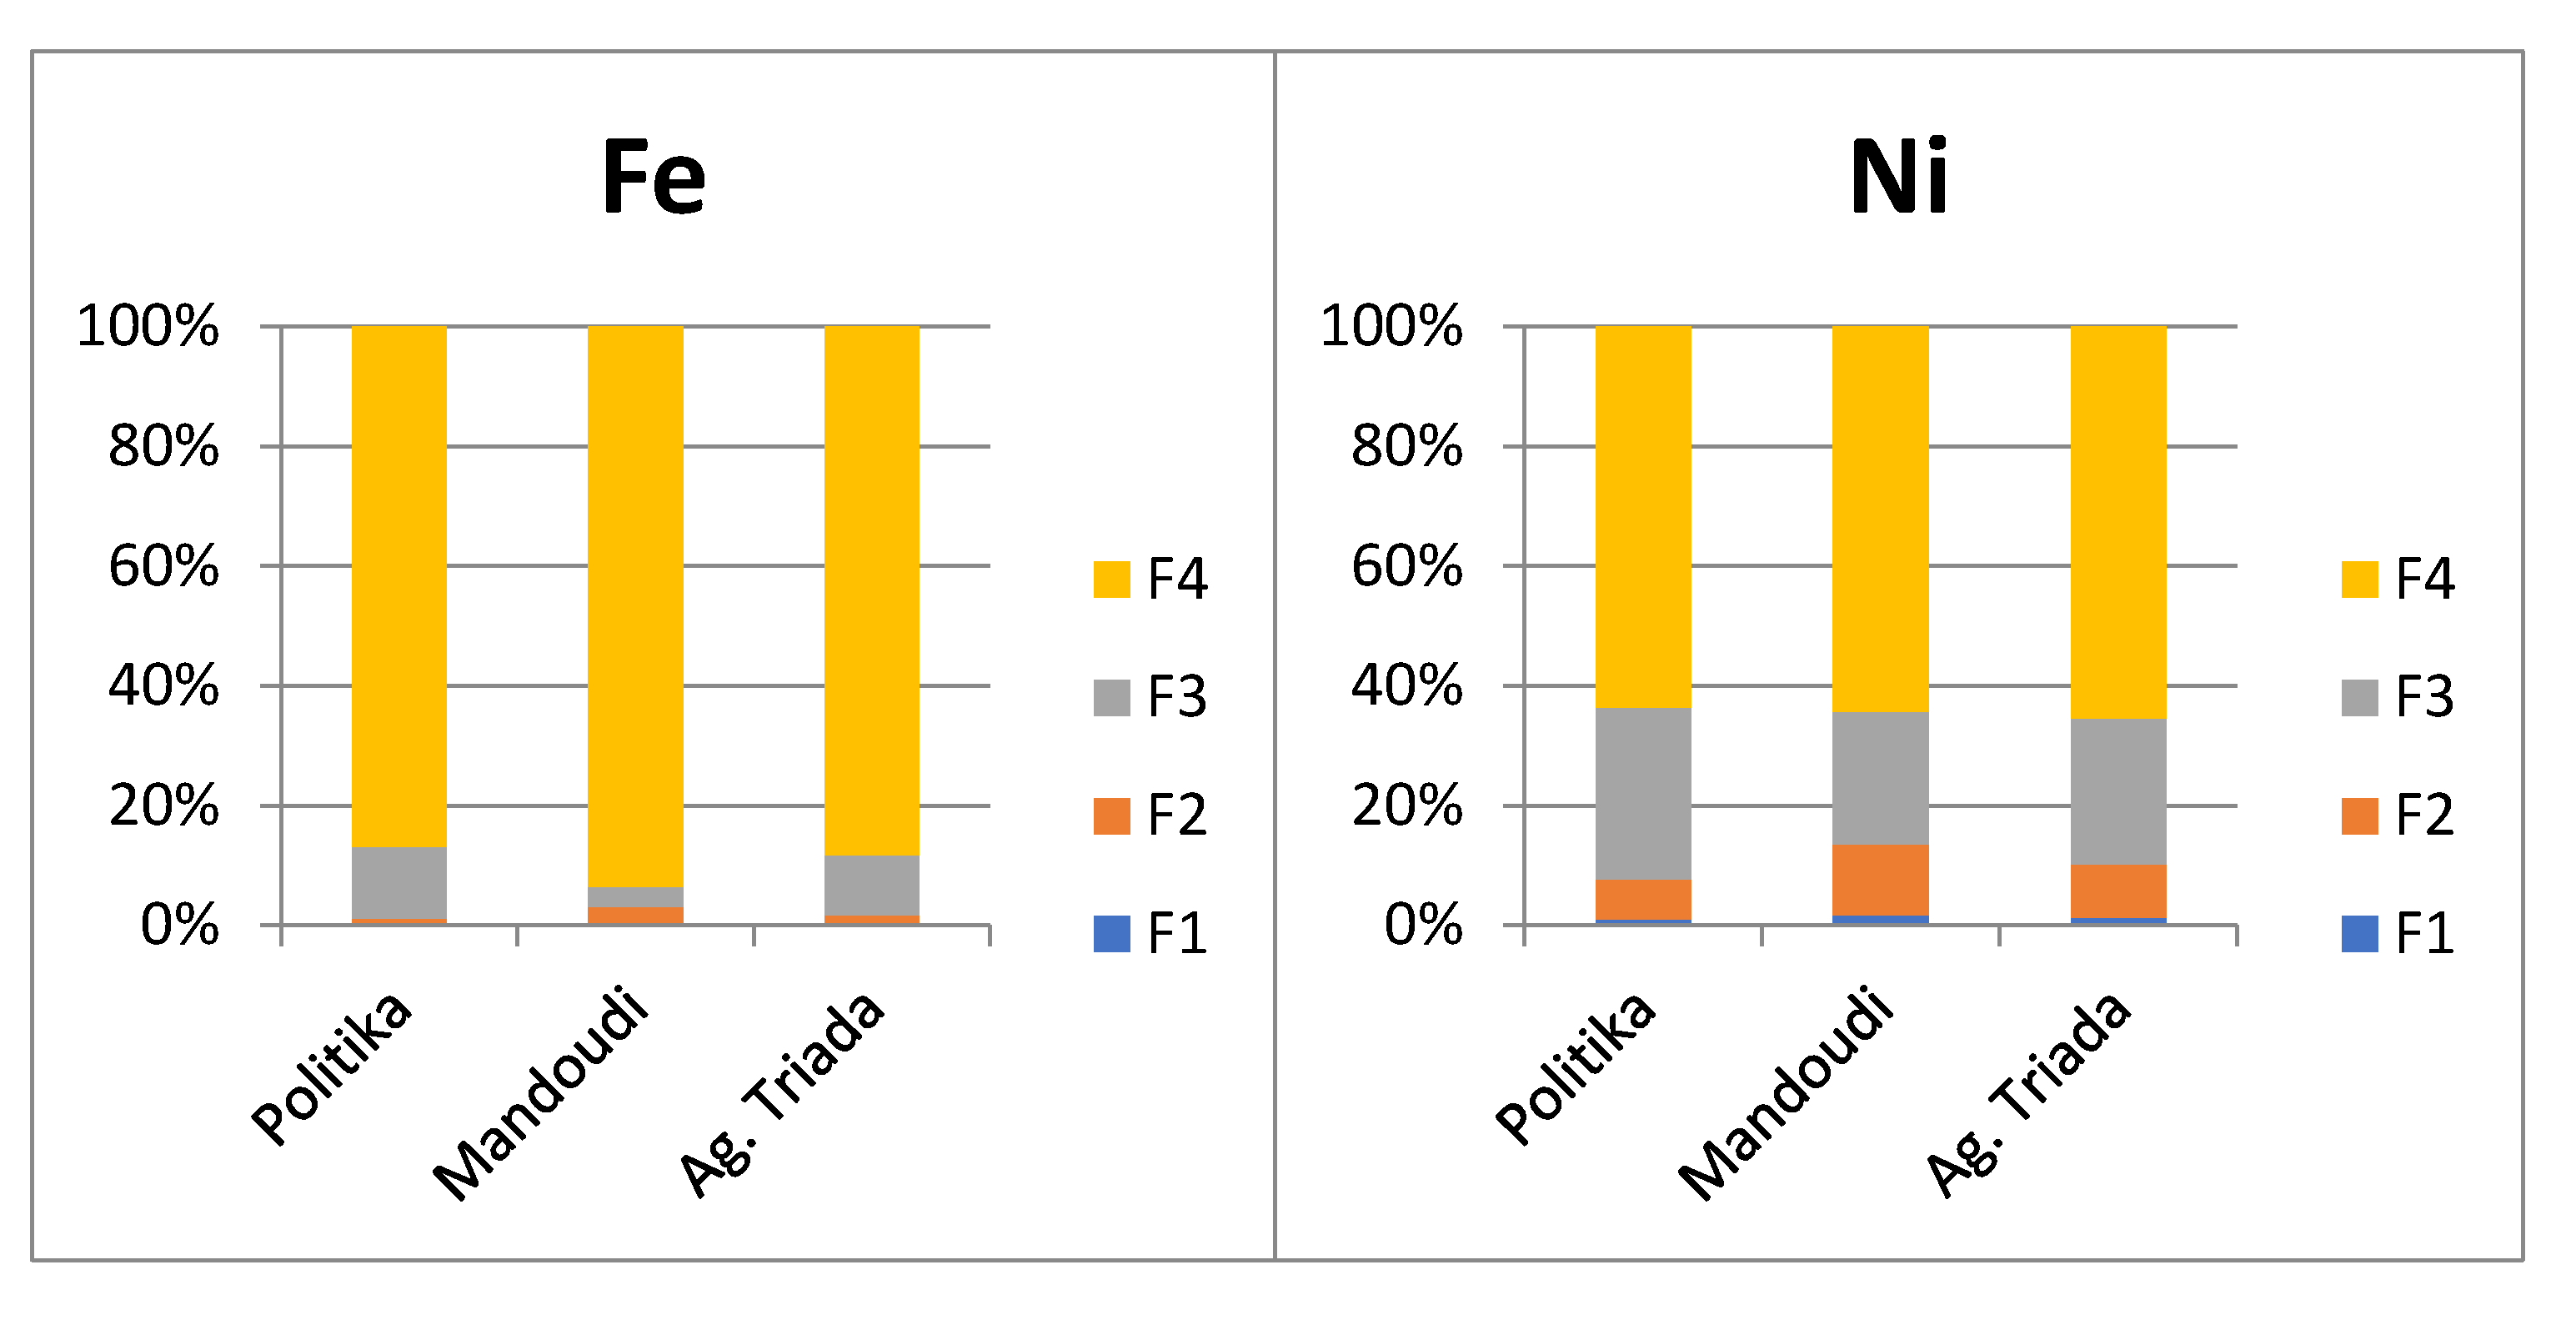
3.4. Chemical Partitioning of Fe, Mn, Ni, Cr, and Co

The chemical partitioning of Fe, Mn, Ni, Cr, and Co in the studied soils expressed as percentage of the total amount (i.e., the sum of the four fractions) is presented in Figure 2.

3.4.1. Iron

The most abundant chemical fraction of Fe was the residual (F4), reaching a mean of 90% of total Fe in the studied soils, followed by the oxidizable (F3), which showed discrete differences between the three areas and varied between 3.3 and 12.1% of the total Fe. Much lower Fe concentrations were extracted in the reducible fraction (F2), with an approximate mean percentage of 2% of the total. The easily available portion of Fe in the soils (F1) was very low and accounted for about 0.003% of the total Fe. The mean percentage recovery was 94.5%.

3.4.2. Manganese

As expected, most of the Mn in the studied soils was found in the reducible fraction (F2), presumably in oxide assemblages, representing nearly 59% of the total Mn in the studied soils. The concentration of Mn in the reducible fraction was followed by the Mn concentration in the residual (F4) and the oxidizable fractions (F3), with a mean contribution to the total of about 23 and 11%, respectively. Mn associated with the first chemical phase (F1) represented an accountable 6.5% mean portion of the total Mn. The calculated mean percentage recovery was 97%.

3.4.3. Nickel

Ni extracted in the residual fraction (F4) represented 65% of total Ni in the soils, followed by the concentration of Ni related to the oxidizable fraction (F3), which showed a mean percentage contribution of 25% to the total element concentration. Depending on the studied area, the reducible fraction of Ni ranged from 6.7 to 11.9%, while the available fraction was low, accounting for approximately 1.3% of the total Ni extracted from the soils. A mean recovery of 95% was reached.

3.4.4. Chromium

The majority of Cr in the studied soils was related to the residual fraction (F4), while the second most abundant fraction was the oxidizable fraction (F3), which contributed 83 and 15% to the total Cr extracted by the BCR procedure, respectively. Much lower Cr concentrations were extracted in the reducible phase (F2), partitioned as 2%, whereas the available Cr (F1) was only 0.11% of total Cr. An acceptable mean recovery of 92% was calculated.

3.4.5. Cobalt

Co was more or less equally distributed between the reducible (F2), oxidizable (F3), and residual (F4) fractions. Specifically, 32, 24, and 43% of total Co was extracted in the F2, F3, and F4 fractions, respectively. The remaining 1% corresponds to the available Co extracted in the first step (F1) of the applied protocol. The mean recovery of 91% was the lowest among the metals sequentially extracted.

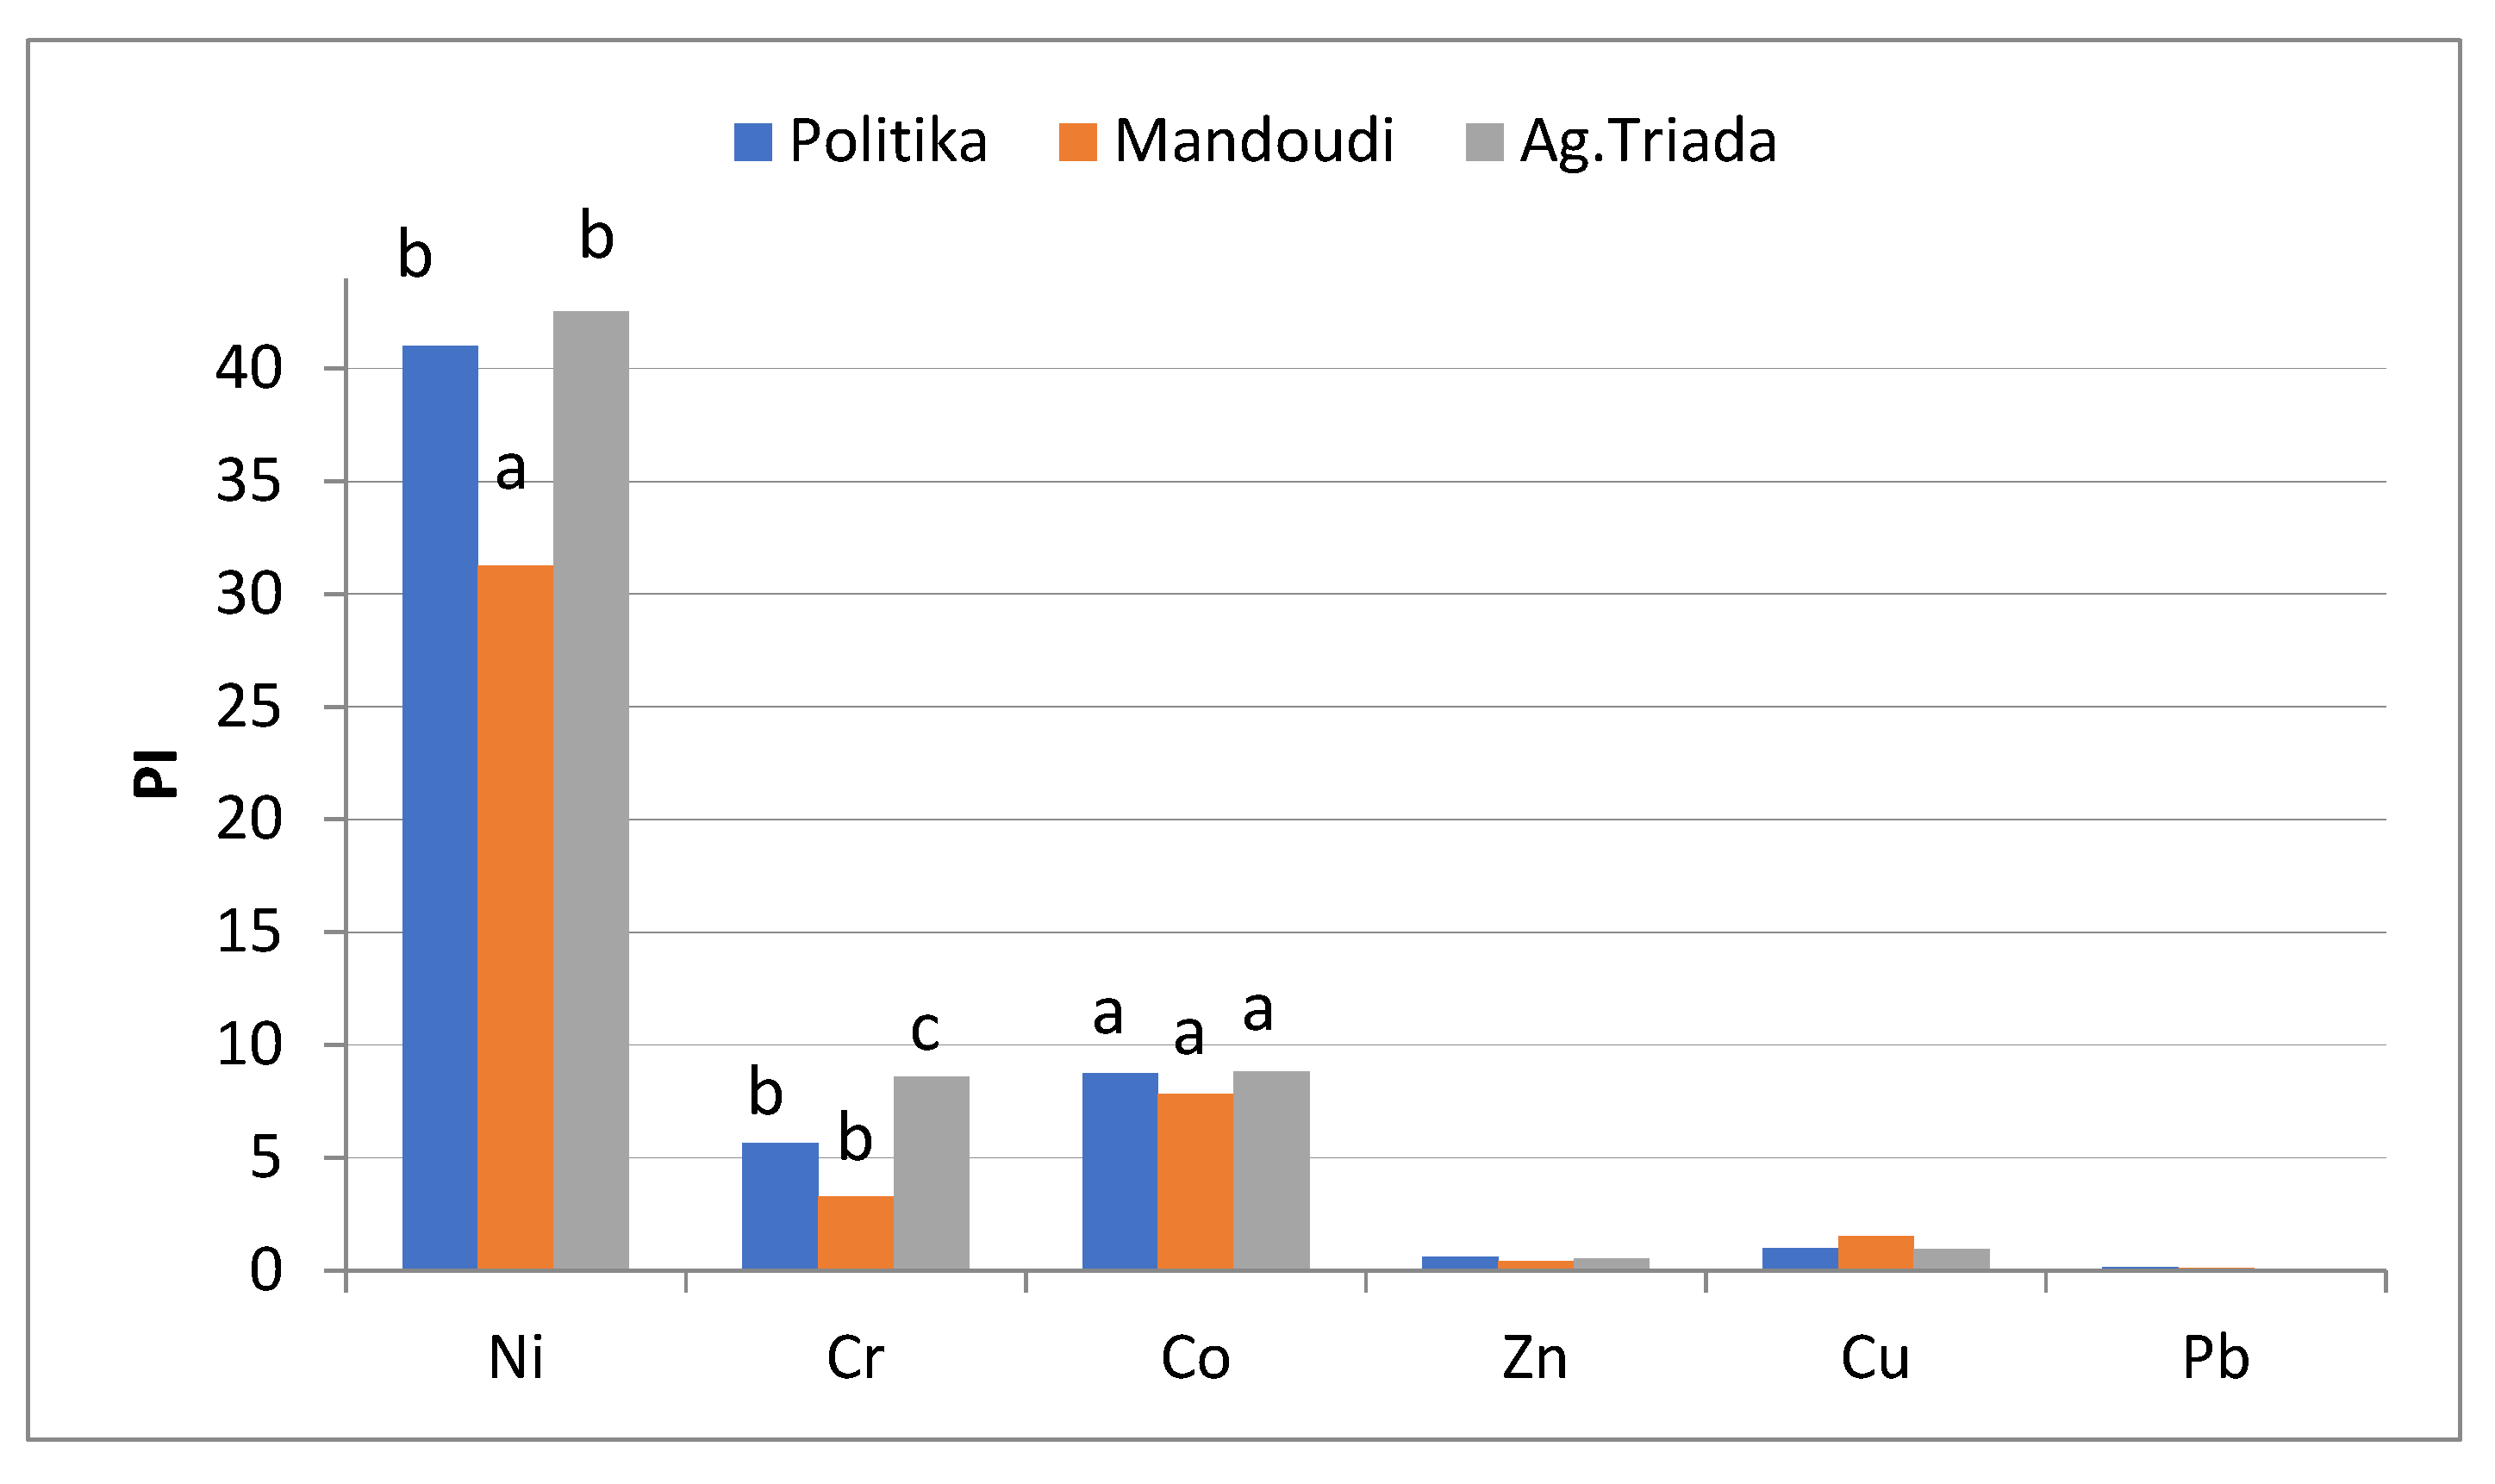
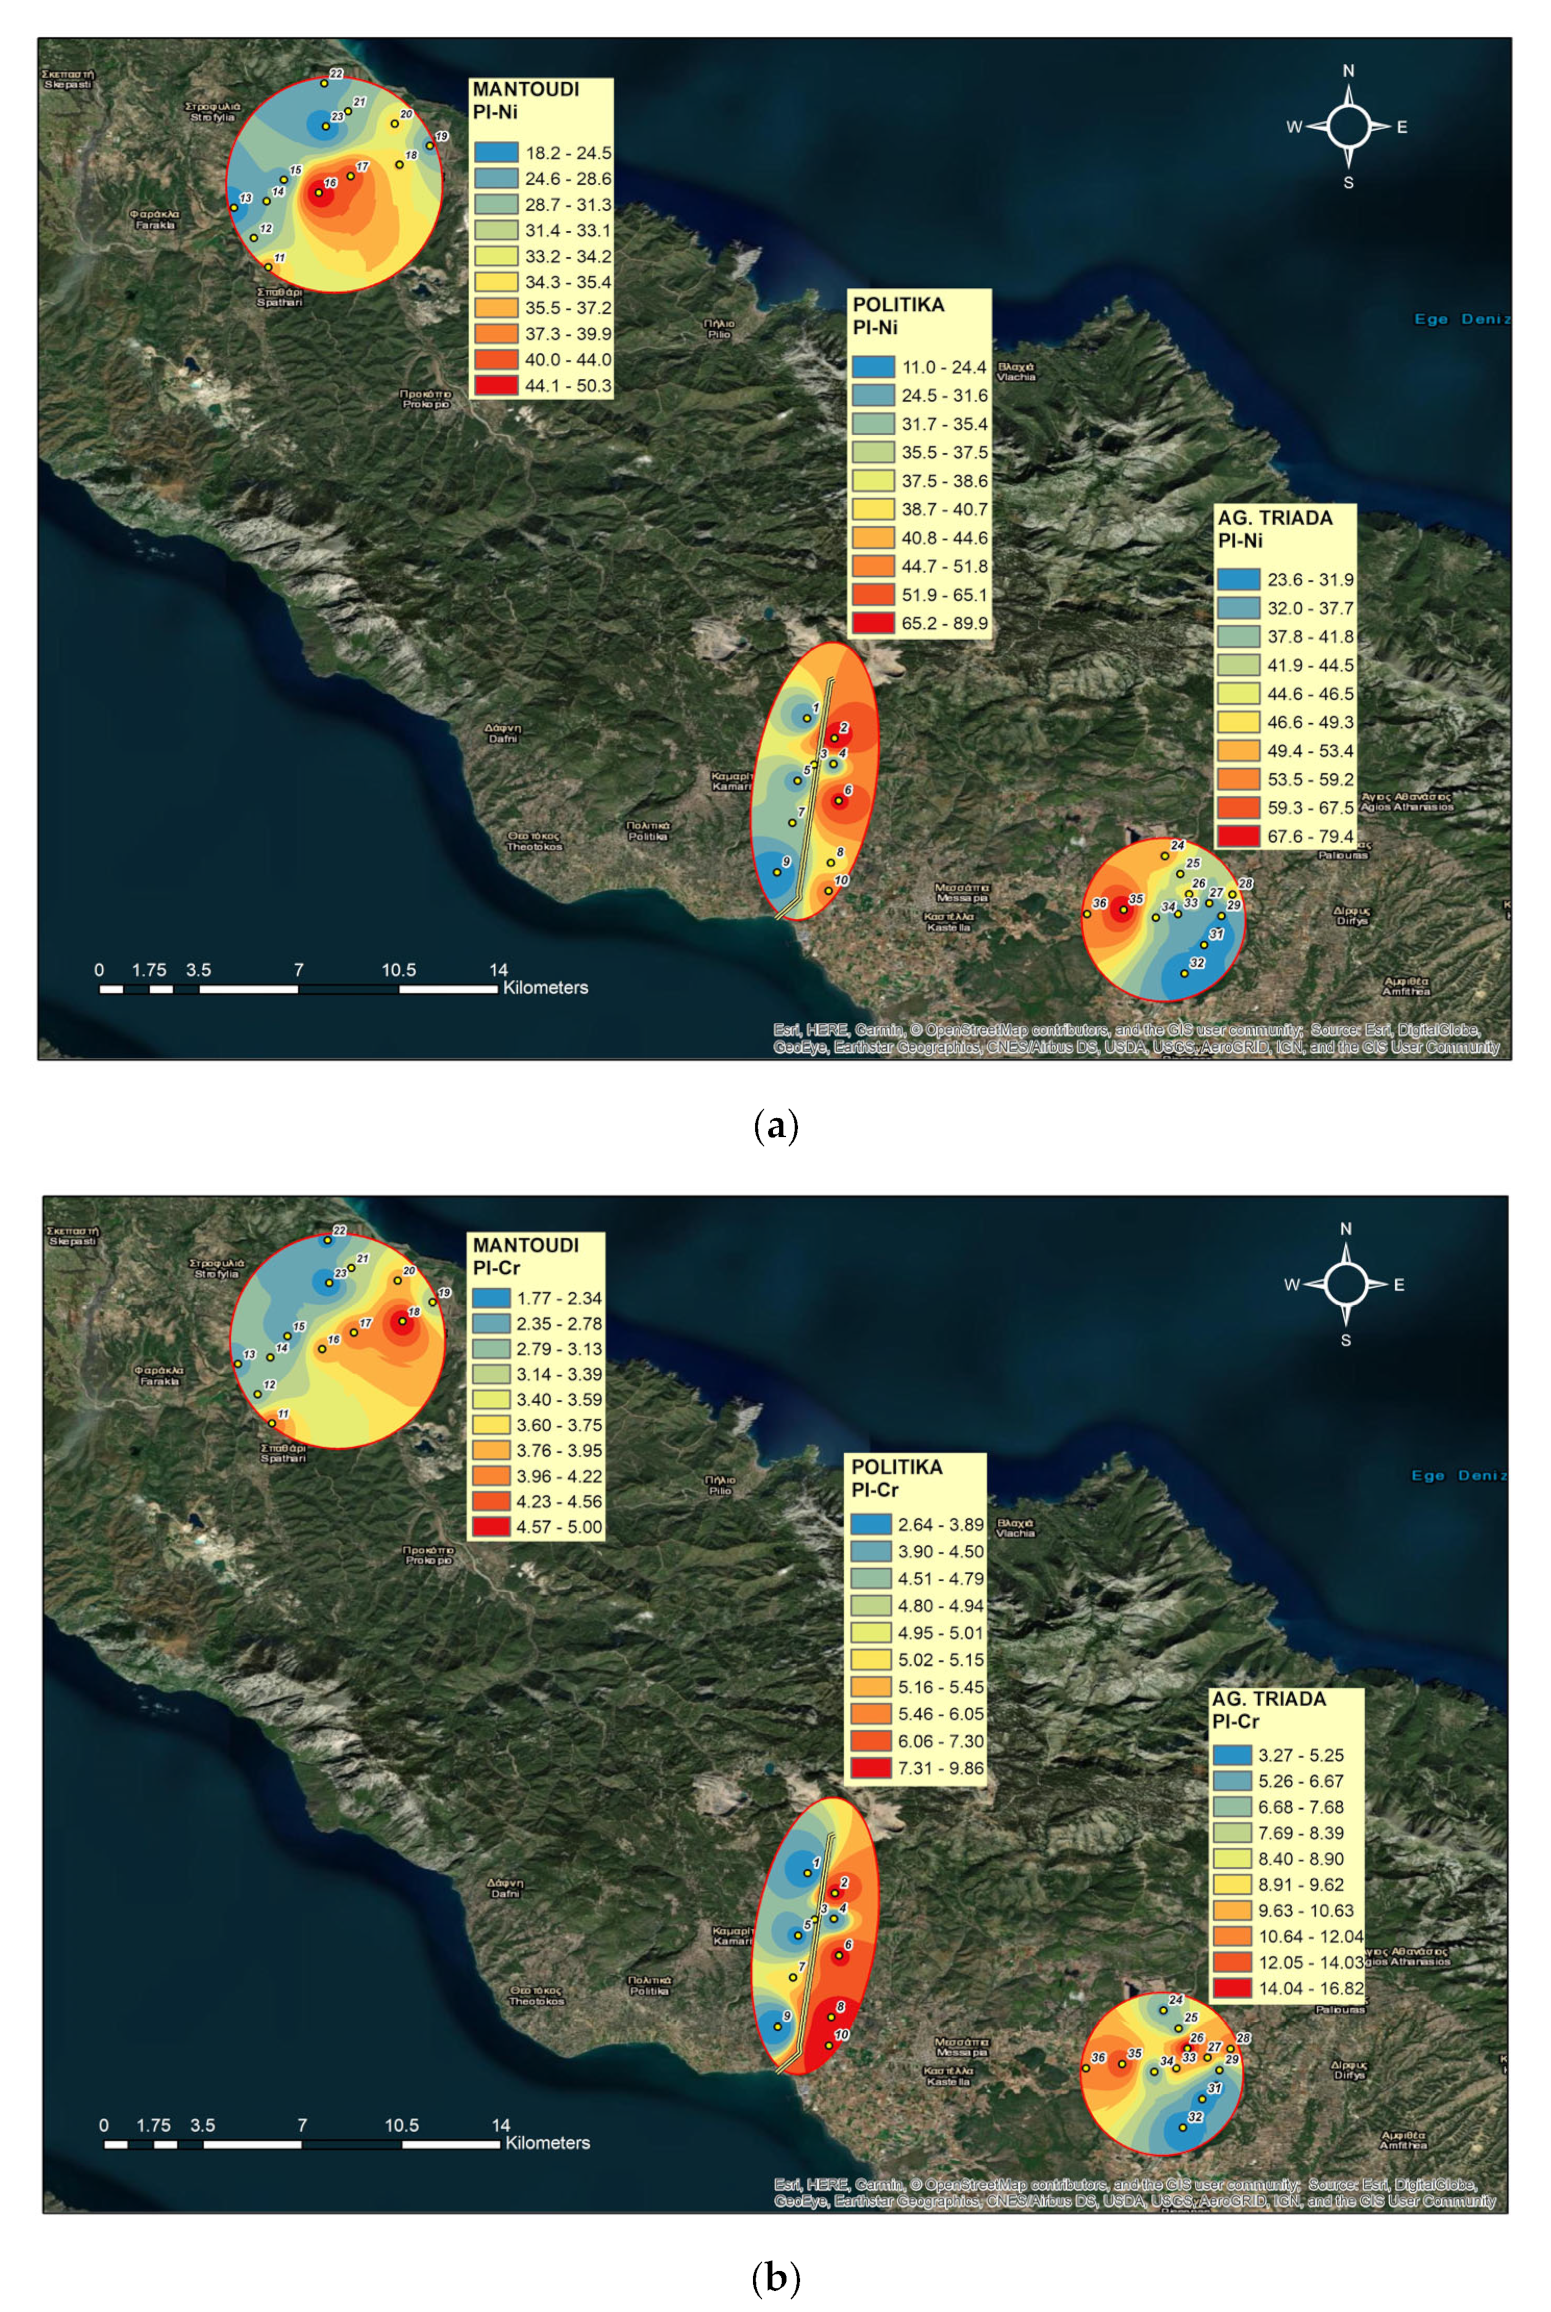
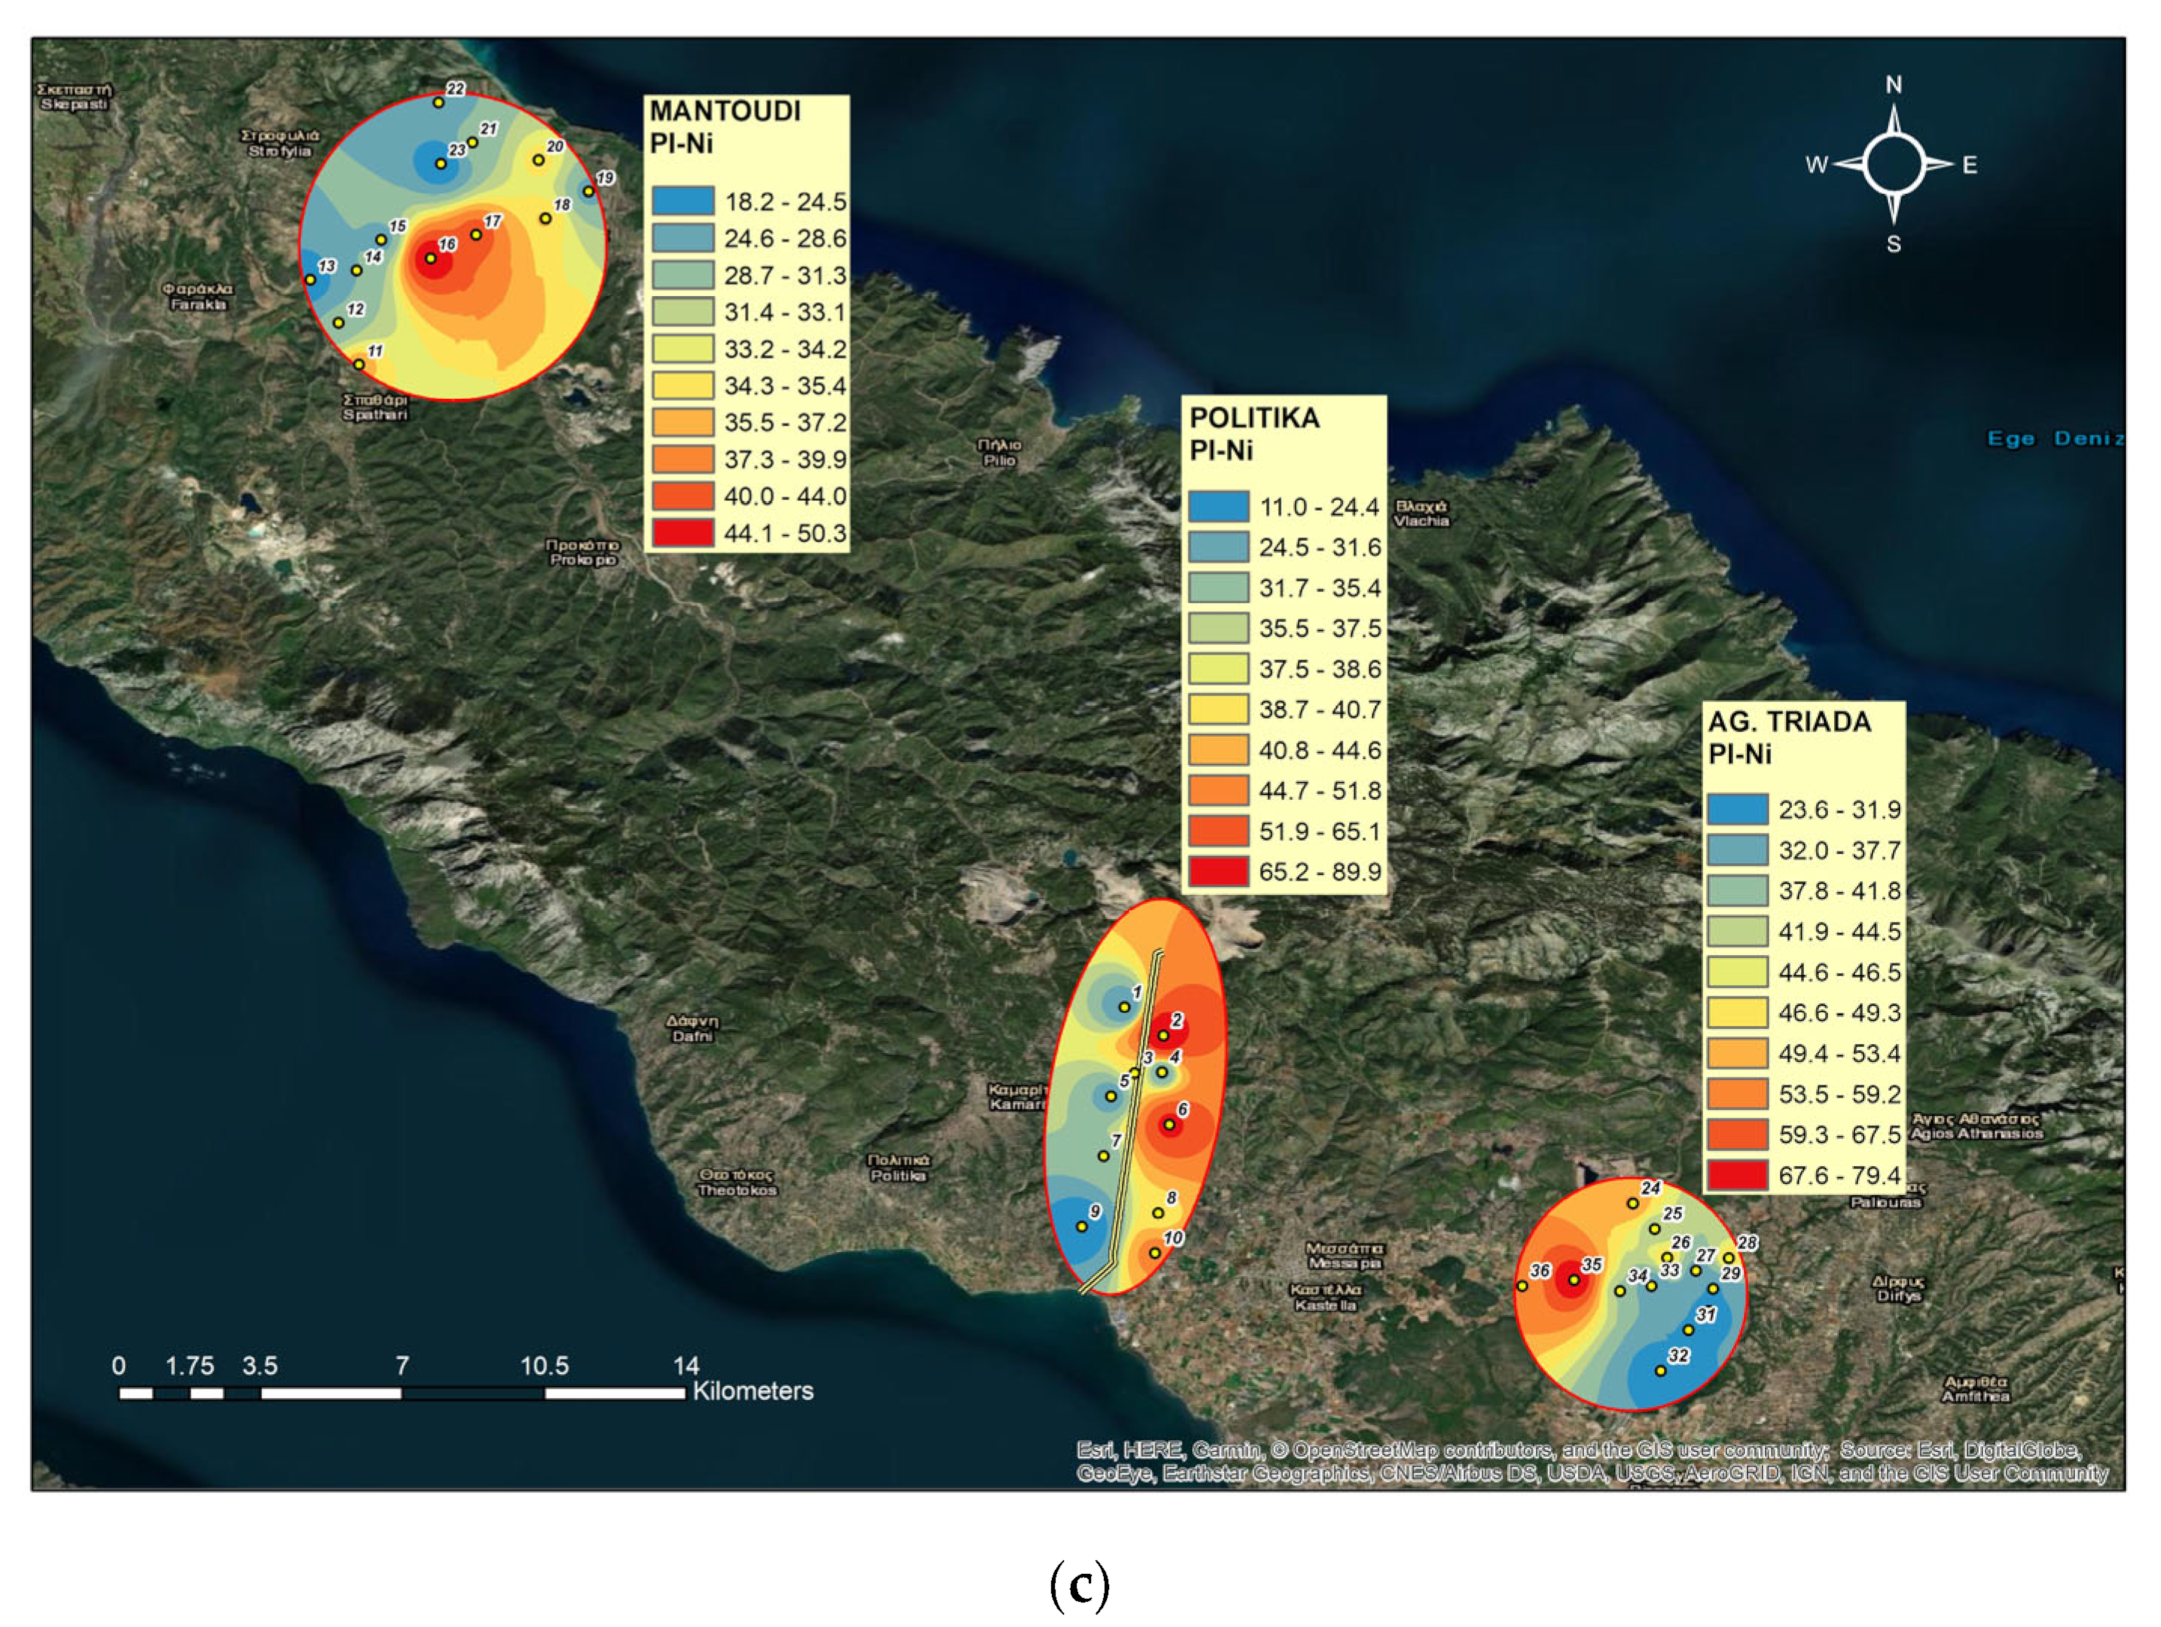
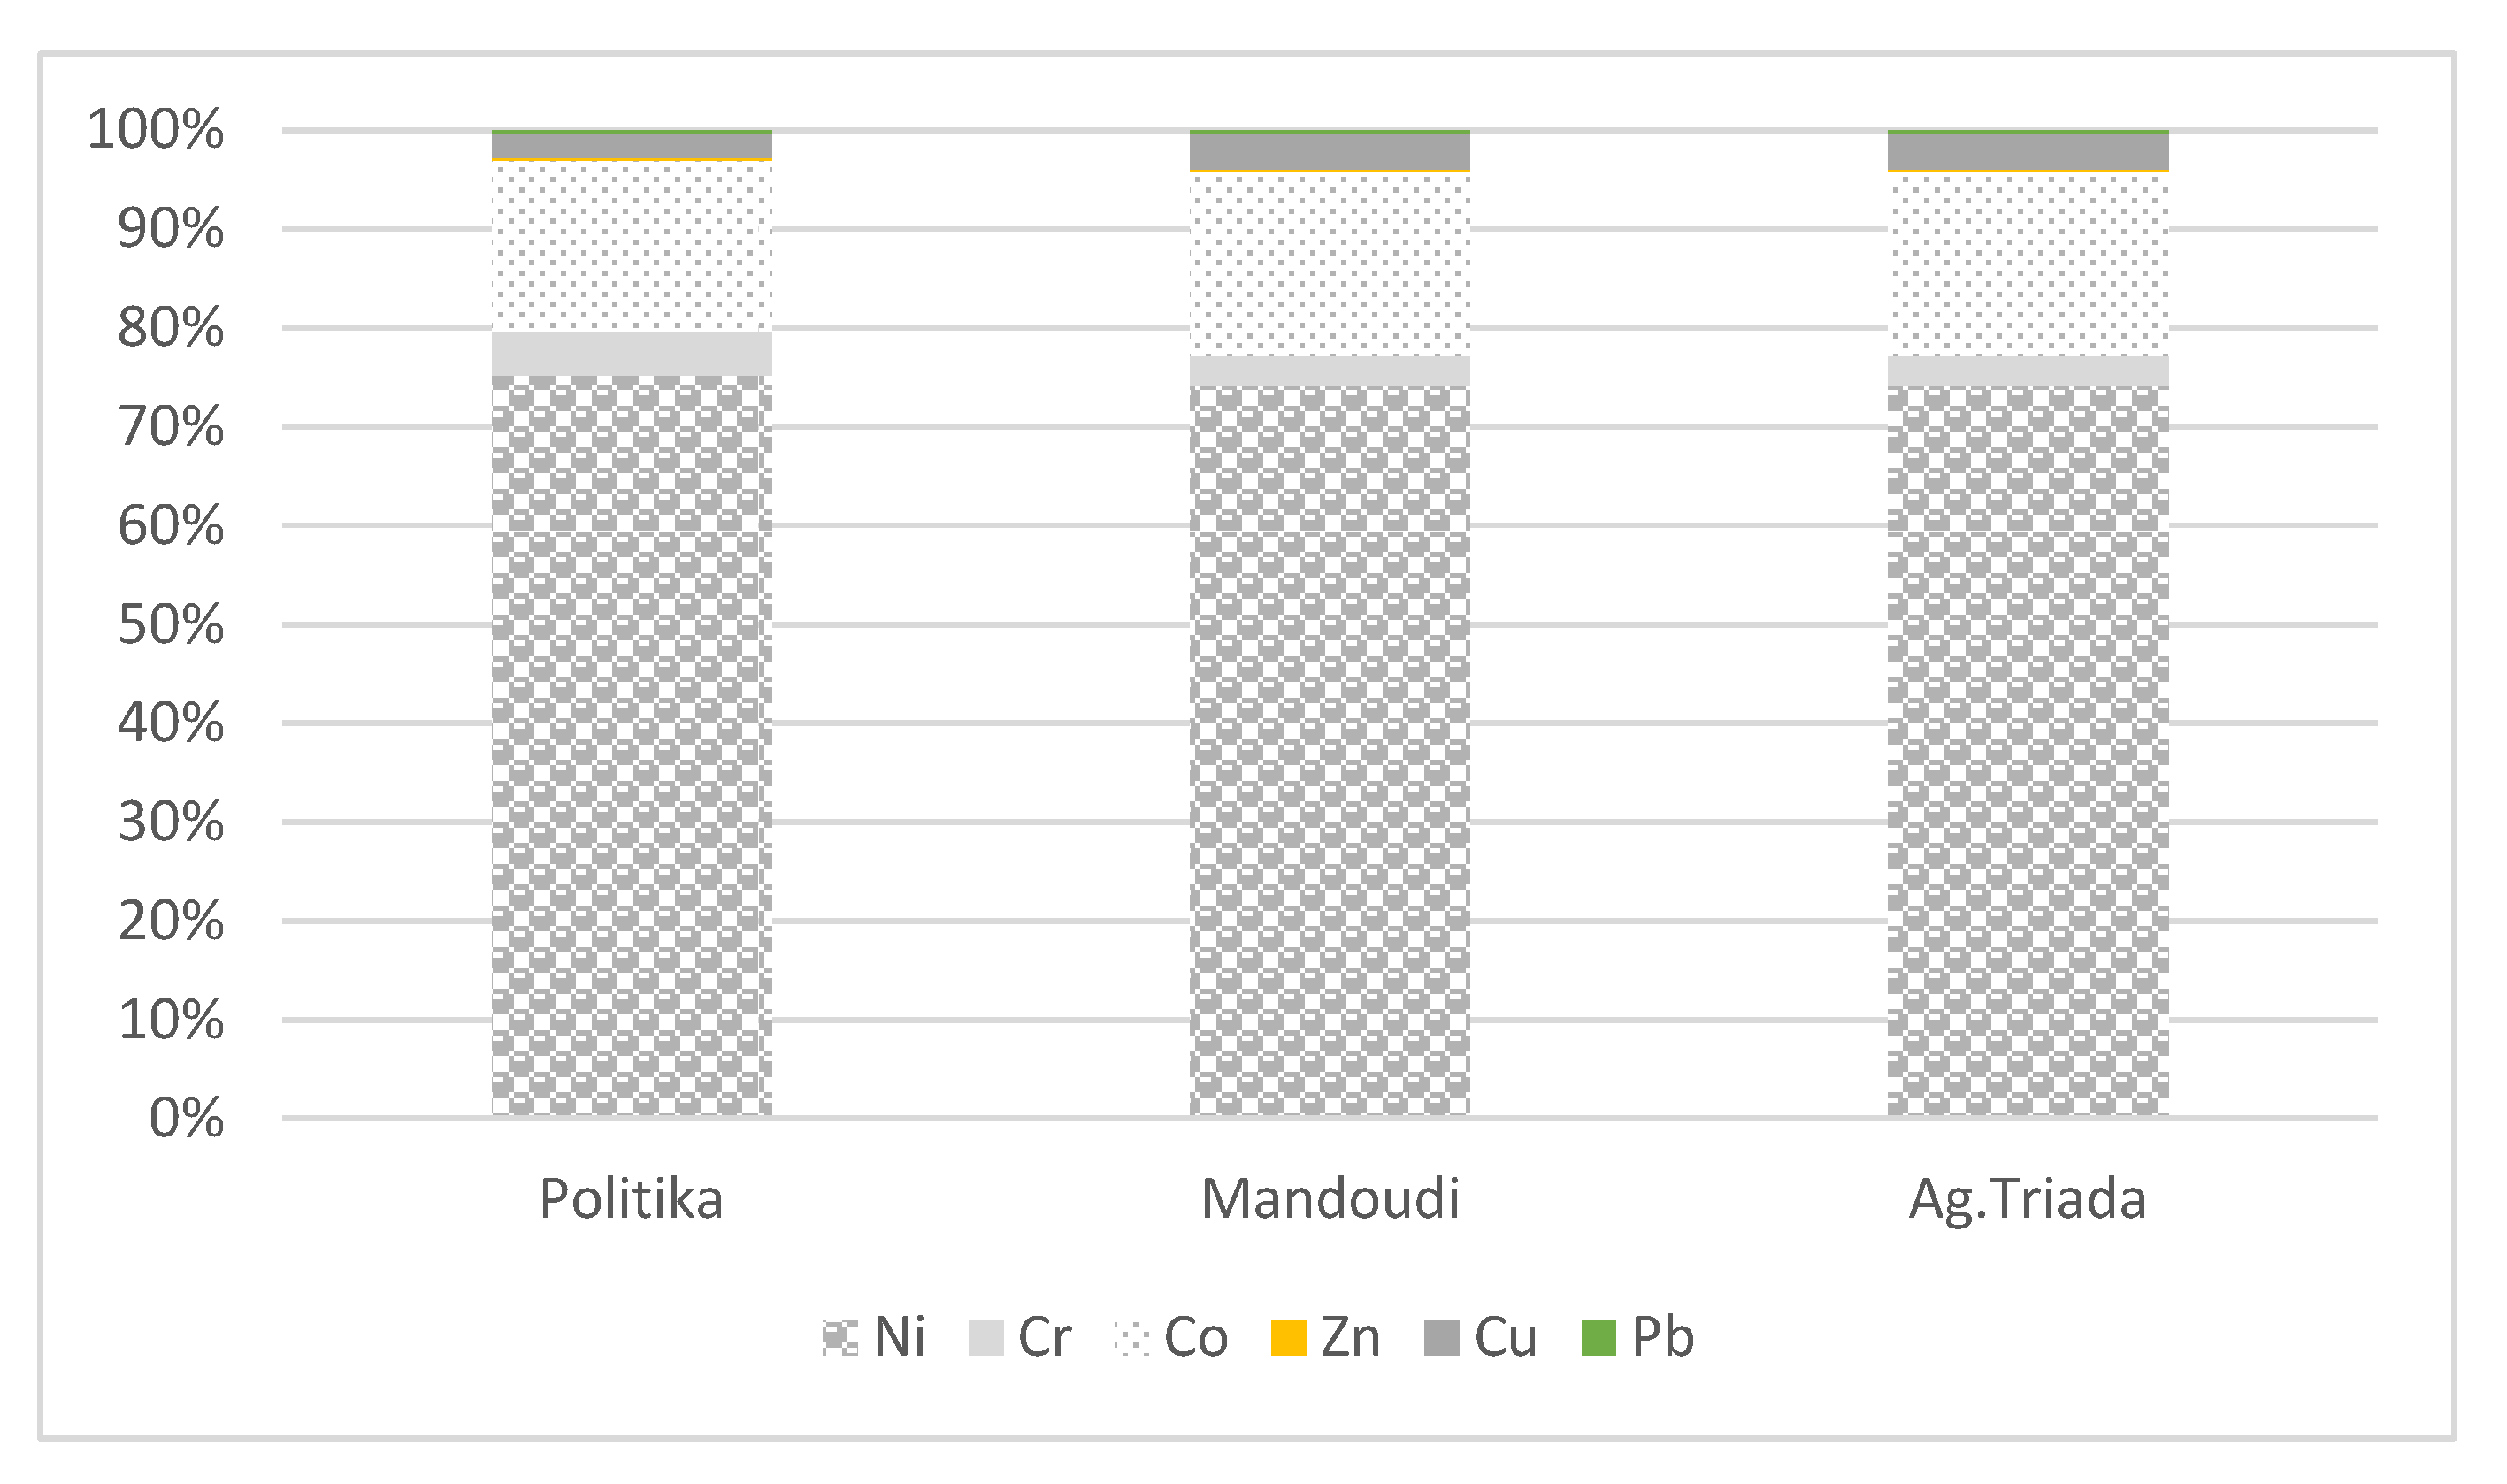
3.5. Single Pollution Index (PI)

The PIs for Ni, Cr, Co, Zn, Cu, and Pb are presented in Figure 3. Irrespective of the studied areas, Ni PI values were high to extremely high and ranged between 11.04 and 89.95, with a median value of 34.01. High PIs were also calculated for Cr and Co, ranging between 1.77 and 16.83 and 4.26 and 16.30, respectively, while the corresponding median values were 4.19 and 8.22. The significantly lower mean PI for Ni and Cr and the significantly higher PI for Cr were determined for the soils of Mantoudi and Ag. Triada, respectively, whereas no difference was observed amongst the three areas for Co PIs. More specifically, the lowest mean Ni PI was 31.24 (Mantoudi) and the highest was 42.53 (Ag. Triada); the respective PI values for Cr were 3.28 (Mantoudi) and 8.58 (Ag. Triada). All PI values for Zn and Pb were less than unity, but for Cu, PI values close to unity or ranging between 1 and 2 were commonly observed.

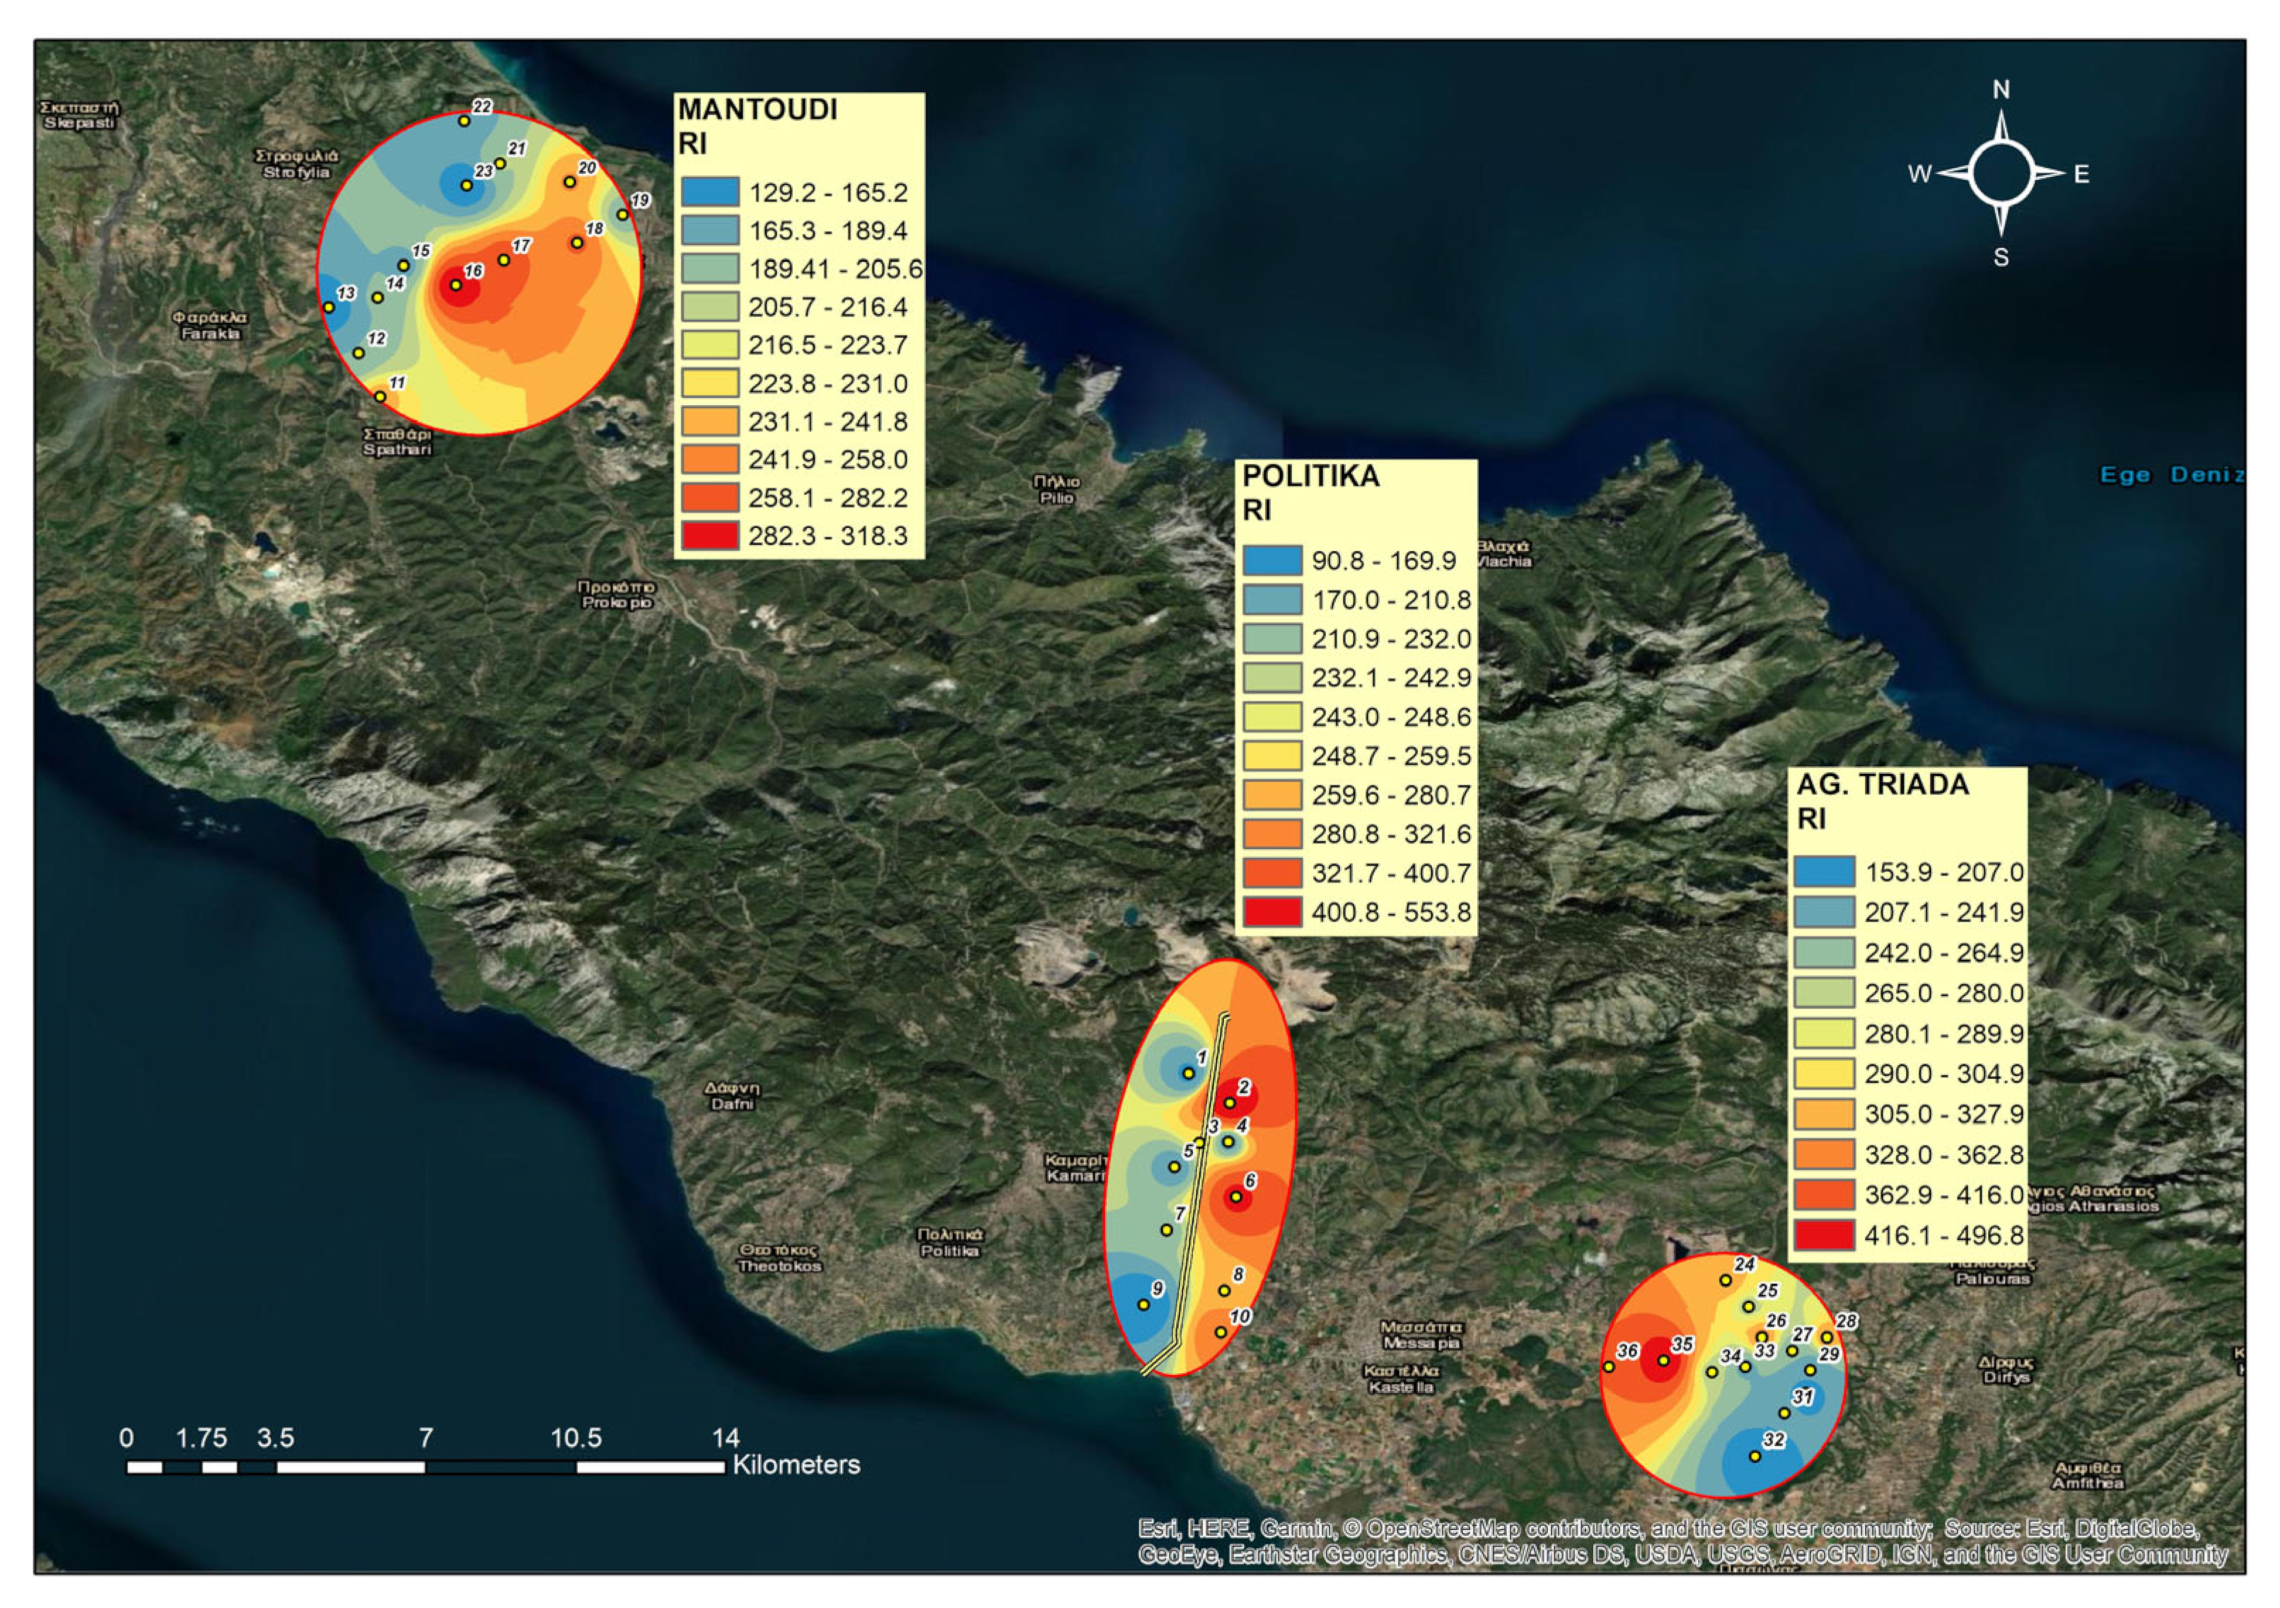
3.6. Potential Ecological Risk Index (RI)

Comparing mean RI values between the three areas, the potential ecological risk index is significantly higher for the agricultural soils of Ag. Triada than for soils of Mantoudi, whilst no difference among Politika and either Mantoudi or Ag. Triada soils was detected (Table 8).

3.7. Hazard Index (HI)

To assess non-carcinogenic health risks in the studied areas, the HI values for the studied metals were calculated. For all sampling sites, the HI values of Cr, Co, Zn, Cu, Pb, and Mn were <1. Specifically, the respective HI of the above metals for children were <0.1, <0.3, <0.01, <0.03, <0.12, and <0.21. For all of these metals, the HI values for adults ranged from 5 (Cr) to 30 (Zn) times lower than the HI for children. Only the mean hazard index of Ni for children was > 1. The descriptive statistics of Ni HI for children and adults and the comparison of means between the three areas are listed in Table 9. A first obvious result is that the Hazard index values of Ni were one order of magnitude higher for children than for adults. The mean HI for children was significantly higher for the agricultural soils of Ag. Triada compared to the soils of Mantoudi, whereas no significant differences between the soils of either Ag. Triada and Politika or Politika and Mantoudi were detected.

3.8. Life Cancer Risk (LCR)

To assess possible carcinogenic health risks in the studied areas, the LCRs of Ni, Cr, Co, and Pb were calculated. For all sampling sites, LCR values of Co, and Pb for children and adults were lower than 1 × 10⁻⁶ whereas the LCR of Cr ranged between 1.15 × 10⁻⁵ and 1.1 × 10⁻⁴, and between 2.47 × 10⁻⁵ and 2.34 × 10⁻⁶ for children and adults, respectively. For all sampling sites however, the possible carcinogenic risk of Ni either for children or for adults was always > 1.0 × 10⁻⁴, ranging from 5.9 × 10⁻³ to 4.3 × 10⁻² and from 6.0 × 10⁻⁴ to 4.7 × 10⁻³ for children and adults, respectively (Table 9). As shown in Table 9, LCR values of Ni were one order of magnitude higher for children than for adults. For both children and adults, comparison of mean LCR values between the three areas resulted in a significantly higher LCR being obtained for the agricultural soils of Ag. Triada when compared to the soils of Mantoudi, but no significant differences were observed between the soils of Ag. Triada and Politika or Politika and Mantoudi.

4. Discussion

4.1. Total and Bioavailable Metal Concentrations

For most of the studied PTEs, total concentrations were very high considering that the soils were under agricultural use. Specifically, Mn, Ni, Cr, and Co mean total concentrations exceeded the toxicity levels or threshold values proposed by many organizations for immediate remediation actions [35]. Copper, zinc, and lead mean total concentrations in the soils of the three areas were low, an expected finding since, in laterite soils, Cu, Zn, and Pb amounts are generally low [35]. Total iron concentrations in the soils of the three areas are relatively high, reflecting the parent material of the soils. Previous data related to the total metal concentrations in the greater study area are included in the articles of Economou-Eliopoulos et al. and Megremi et al. [15,48]. Specifically, the authors collected topsoil samples (0–20 cm) from sites located in the vicinity of the Ni laterite deposits, the mining excavations, and the ore beneficiation unit from the Psachna wider area at Euboea Island. The reported median concentrations of Ni, Cr, Mn, and Fe were 1800, 830, 1300, and 56,000 mg kg−1, respectively [15], and the mean Co, Zn, Cu, and Pb concentrations were 150, 50, 28, and 35 mg kg−1, respectively [48]. Since total metal concentrations in those studies were determined through aqua regia extraction, they are directly comparable to the results of our study. Though the soils examined by those two reports were not in the same areas as the soils of the present study, metal concentrations are similar (Table 6) due to the formation of the soils on similar parent materials and the diffused impact of the nearby operating mining activities.
Evaluating the soils in terms of fertility able to sustain agricultural production, Fe, Mn, Cu, and Ni DTPA concentrations are above critical values indicating adequately supplied soils [29,49]. However, median concentration values of the Zn bioavailable fraction in half of the sampling sites at Politika and Ag. Triada were above critical limits, and thus, soils can sustainably support the proper growth of most plants, whereas the soils of the Mantoudi area showed Zn deficiency.
Nevertheless, if soil health evaluation is to be performed in terms of metal toxicity, Mn and Ni DTPA concentrations in most soils in all studied areas are high to extremely high, pointing to potential toxicity to plants, especially the most vulnerable (Table 7). In particular, at all sampling sites, the Ni bioavailable concentration in soils was found to be much higher than the permissible limit of 2 mg kg−1, and the Mn bioavailable fraction in most cases was above the acceptable value of 10 mg kg−1 [50]. With few exceptions, the bioavailable concentrations of all other metals were below the critical limits as proposed by Kaur and Rani [50] (i.e., 20, 1, 5, 10, and 10 mg kg−1 for Fe, Cr, Cu, Zn, and Pb, respectively).
Significant correlations between the physicochemical properties of the soils and total and bioavailable metal concentrations were observed (Table 10). Soil organic carbon was significantly positively correlated to total Zn and Pb concentrations and to bioavailable Fe, Mn, Zn, and Co concentrations, suggesting a positive effect of S.O.C. on those metals’ mobility and availability [51]. Carbonates were significantly negatively related to total Fe, Mn, and Cu amounts in soils, indicating that higher carbonate content in soils reflects a lower total concentration of the three metals.
As indicated by the significant positive correlations appearing in Table 10, total metal concentrations were mainly associated with iron and manganese oxides, and to a lesser extent, aluminum oxides. This is commonly presented in soils, as Fe and Mn oxides, especially their amorphous and poorly crystalline forms, strongly adsorb metals, influencing their mobility in soil ecosystems. On the other hand, DTPA-extracted Fe, Mn, and Zn were significantly positively correlated to dithionite extractable aluminum.
The similar geological background of the soils in the three areas is reflected by the significant positive correlations between Fe, Mn, Ni, and Co, and Ni, Cr, and Co total concentrations (Table 10). Ni-laterite ores and their parent ophiolites have significant Cr, Fe, Ni, Mn, and Co contents and may be the major source for these metals in the studied soils.
Though the availability ratio, expressed as percentage of DTPA metal fraction to total metal concentration, of all metals is generally low, the observed significant positive correlations between the bioavailable and the total metal concentrations of Ni, Zn, and Cu suggest that both forms of these metals originate from the same sources, (i.e., the soil parent material and diffused airborne pollution) (Table 10).

4.2. Metal Fractionation in Soils

Except for Mn, the studied metals are related to the residual soil fraction, which accounts for 43% for Co and 90% for Fe of total metal concentrations in soils (Figure 2). This has been commonly recorded in similar studies, as for example in the publications of Mitrović et al. [52] and Davidson et al. [53] who found that Mn was strongly associated with the reducible fraction, while Fe, Ni, Cr, Co, Cu, Pb, and Zn were found to be mainly associated with the residual phase of the soil matrix. The readily available portion (F1 fraction) was generally low and measured between 0.003 for Fe and 1.3% for Ni. Only the Mn amount extracted in the first step of the BCR protocol was much higher and reached a mean value of 6.5% of the total concentration. The calcareous nature of the studied soils explains the low availability of the metals, since it is well established that carbonates restrict metals’ mobility [11,54,55].
Expressing, however, the availability and mobility of metals in the soil ecosystem as percentages of F1 concentration to total concentration does not portray the potential risks associated with the health of both the above and below surface ecosystems, especially in the case of very high total metal concentrations. In fact, the mean available 1.3% of the total Ni concentration corresponds approximately to 25 mg kg−1, a value high enough to raise environmental and health awareness. Considering the Mn availability and mobility, the concentration extracted in the first step of BCR showed a mean value of 91 mg kg−1, well above the toxicity threshold for many plants. Moreover, under specific soil conditions, part of the concentrations of metals determined in the reducible fraction of BCR (F2), can be mobilized in the soil ecosystem, affecting soil health and promoting uptake by plants. The soil texture in the studied areas is clay–loam to clay, a characteristic that can favor reductive conditions in soils, especially in microaggregates, under soil water flooding because of either extreme rainfall events or excessive irrigation. In this concept, and to better illustrate potential soil health and environmental risk issues, the sum of metal concentrations in the F1 and F2 fractions was calculated for Ni, Cr, Co, and Mn, and are presented in Table 11.

4.3. Single Pollution Indices for Ni, Cr, and Co

The spatial distribution of PI values for Ni, Cr, and Co is presented in Figure 4. For all three metals, a similar pattern appeared, almost identical for Ni and Co. Considerably higher Ni and Co PIs were observed in the Eastern Mantoudi soils—from southeast to northeast—in the eastern soils of Politika and the western soils of Ag. Triada. Minor deviations from this pattern are observed for Cr PIs calculated for the soils of Ag. Triada, which showed two peaks, one in the eastern and the other in the western part of the area.
Though for the calculation of PIs, the Reference A value of the Dutch system [35] normalized for the clay and the organic matter content of every soil sample was used, the main component of the equation is the total metal concentration. Hence, the PI values follow a similar trend as the total concentrations, providing, however, a concise classification index regarding the pollution of the studied soils with Ni, Cr, and Co. As has already been mentioned, the PIs of the three metals range from high to extremely high, pointing to severe soil pollution, higher in the agricultural soils of Ag. Triada and lower in the agricultural soils of Mantoudi. This situation is of greater concern, considering that PIs of Ni and Cr were >1 even when the Intervention C concentration values (i.e., 210 and 380 mg kg−1, for Ni and Cr, respectively) were used for their calculation, while the same was true for Co PIs when the Test B concentration value (i.e., 50 mg kg−1) was used.

4.4. Potential Ecological Risk Index (RI)

According to the equations used for RI calculation, the combination of the single pollution index and the toxic response factor of a metal determines the weight of its participation in the RI. In other words, the higher the PI and the T r i   of a metal, the greater its participation in the ecological risk due to the pollution of the soils with metals and vice versa. In the studied soils, Ni showed the highest PIs among the other metals, and it has a high T r i . Thus, irrespective of the area, Ni’s weightiness in RI was approximately 75%, followed by Co, which added a further 20% (Figure 5). Each of Cr and Cu contributed to RI another 3.5%, while the contribution of Zn and Pb was negligible.
Though RI was significantly higher for the soils of Ag. Triada compared to the soils of Mantoudi, median RI values that fall in the range between 200 and 300 in all areas indicate a considerable risk for living organisms (Table 2 and Table 8).
In Figure 6, the spatial distribution of RI values is presented. Such a representation of the results allows for a comprehensive perception of the environmental risk in the studied areas due to metal pollution. Accordingly, a considerable risk is obvious for approximately half of the agricultural soils of the Mantoudi area, while the rest show a moderate risk. Due to soil pollution, the considerable risk is higher for the Politika area, whereas for approximately 15% of the area, the environmental risk is classified as high. Among the three areas, the agricultural area of Ag. Triada is under the highest environmental pressure since, according to the spatial distribution of the RI values, 40% of the land shows high environmental risk and another 50% is under considerable risk. The main factors responsible for this are the parent material of the soils and the enrichment of the soils with metals due to dust transfer from mining activities, mainly excavation and transportation processes.
The major risk to the biota is imposed primarily by the high Ni concentration in the studied soils, accompanied by a high Co concentration, suggesting that prompt soil remediation actions should be proposed. Considering, however, the relatively low availability and mobility of Ni and Co indicated by the soil fractionation results and DTPA single extraction, the adoption of enhanced phytoremediation techniques to increase the mobility of the two metals in the soil ecosystem on the one hand, and growing tolerant plant species of economic value to ensure farmers income that can uptake considerable Ni and Co amounts on the other, can be suggested as a feasible action.

4.5. Human Health Assessment

As already noted in Section 2 and Section 3, the impact of metal concentrations in the studied soils on human health is assessed by the Hazard Index (HI) for non-carcinogenic effects and the Life Cancer Risk (LCR) for carcinogenic effects. HI values > 1, the threshold for regulatory actions, emerged only for Ni. Specifically, median HI values of Ni for children were >1 in the three studied areas, indicating that more than 50% of the studied soils can introduce increased non-carcinogenic health risks for children. According to the 40th percentile, this is also true for 60% of sampling sites, corresponding to 60% of the agricultural soils of the studied areas (Table 9). High HI values were also determined by Kamunda et al. [56] for inhabitants close to a gold mine in South Africa, while Diami et al. [57] and Kusin et al. [38] reported HI values < 1 when studying soil enrichment by metals in the vicinity of iron and bauxite ores, respectively.
In the present study, for the determination of HI, the total metal concentrations were used in agreement with Chonokhuu et al. [58] and Ahmad et al. [59], who determined the HI values by using total metal concentrations extracted by HNO3-HClO4-HF and HNO3-HF mixtures, respectively. However, the utilization of available metal concentrations has also been reported for HI calculation. For example, as was commented on in Kusin et al. [41], the use of total metal concentrations can lead to the overestimation of HI, and thus, it is necessary to incorporate the bioavailable metal fraction into the calculation of the average daily dose of ADD (named chronic daily intake (CDI) by that research team). Nevertheless, these authors did not specify the protocol followed for the determination of the bioavailable fraction. In the study of Diami et al. [57], the incorporation of bioavailable metal concentration into the Hi calculation was also proposed as preferable.
The spatial distribution of Ni HI values for children is shown in Figure 7. Such a representation helps in the identification of sub-areas within the studied areas that deserve higher attention and provisional measures to minimize the possibility of health implications for local children. Indeed, southwestern areas in Mantoudi, eastern areas in Politika, and practically all of the Ag. Triada area (with amplified intensity in the northwestern parts) showed HI values ranging from >1 to 1.9, from >1 to 2.2, and from >1 to 2.4, respectively.
Life cancer risk (LCR) values of Ni, either for children or for adults, were >1 × 10⁻⁴ (Table 9), pointing to increased possibilities for serious health impacts, especially for children that are more vulnerable and susceptible to Ni assimilation in their body’s tissues. Considering that total Ni concentrations were used for LCR calculation, the obtained LCR values were the highest that could be obtained. However, by incorporating in the ADD calculations the sum of F1 and F2 fractions that represent nearly 10% of the total metal Ni concentration (Table 3 and Table 9) and can be reasonably regarded as potentially bioavailable, all LCR values were reduced by one order of magnitude but yet remained high and above 1 × 10⁻⁴ for children, as well as for adults in 75% of sampling sites (indicated by the 25th percentile value, Table 9).

5. Conclusions and Future Perspectives

In this study, a holistic approach to displaying and discussing the effects of impaired soil health status on the environment and on human health was attempted for three agricultural areas in the vicinity of Fe-Ni mines. The findings showed that Ni, Co, Cr, and Mn concentrations in the soils were high to extremely high, producing high values for indicators used to assess either soil and local environmental conditions or potential health risks. The higher the degree of soil pollution, the heavier the adverse effects on the soil ecosystem, suppressing thus the ecosystem services that are directly linked to soil properties and soil functions and affecting adversely biodiversity and people’s welfare. Among the three areas, the least affected is Mantoudi. For the agricultural soils of the study, beyond the high PI and RI values, the potential high availability of Ni, Co, and Mn, as indicated by the sum of fractions F1 and F2 of the BCR, raises serious concerns for the safety of the food chain, considering that soil samples were collected from a depth of 0–20 cm, where most of the rhizosphere ecosystem interactively operates. The calculated HI and LCR values for Ni strongly suggest that comprehensive actions to inform and protect the local population must be implemented. In this framework, farmers must use protective apparatuses when performing cultivation practices, such as masks and proper clothing, and children should minimize their contact with the soil, by avoiding frequent visits to the fields. An important question to be answered is the relative contribution of the soil’s parent material and of airborne enrichment to the concentration of Ni, Co, Cr, and Mn, in the surface soils. For this, representative soil profiles should be studied in detail, and samples from every horizon or layer must be collected to determine the depth distribution of metal concentrations.

Author Contributions

Conceptualization, I.M. and I.Z.; methodology, I.M., I.Z. and D.I; software, O.K.; formal analysis, D.I, D.V. and I.Z.; investigation, D.I., D.G; resources, I.M., I.Z. and D.I.; data curation, D.I and I.Z.; writing—original draft preparation, I.M., I.Z., O.K. and D.G.; writing—review and editing, I.M, I.Z. and D.G.; visualization, O.K.; supervision, I.M. All authors have read and agreed to the published version of the manuscript.

Funding

This research received no external funding.

Data Availability Statement

The data presented in this study are available on request from the corresponding author.

Conflicts of Interest

The authors declare no conflict of interest.

References

  1. Li, C.; Zhou, K.; Qin, W.; Tian, C.; Qi, M.; Yan, X.; Han, W. A Review on Heavy Metals Contamination in Soil: Effects, Sources, and Remediation Techniques. Soil Sediment Contam. Int. J. 2019, 28, 380–394. [Google Scholar] [CrossRef]
  2. Jayakumar, M.; Surendran, U.; Raja, P.; Kumar, A.; Senapathi, V. A Review of Heavy Metals Accumulation Pathways, Sources and Management in Soils. Arab. J. Geosci. 2021, 14, 2156. [Google Scholar] [CrossRef]
  3. He, B.; Wang, W.; Geng, R.; Ding, Z.; Luo, D.; Qiu, J.; Zheng, G.; Fan, Q. Exploring the Fate of Heavy Metals from Mining and Smelting Activities in Soil-Crop System in Baiyin, NW China. Ecotoxicol. Environ. Saf. 2021, 207, 111234. [Google Scholar] [CrossRef]
  4. Bilias, F.; Nikoli, T.; Kalderis, D.; Gasparatos, D. Towards a Soil Remediation Strategy Using Biochar: Effects on Soil Chemical Properties and Bioavailability of Potentially Toxic Elements. Toxics 2021, 9, 184. [Google Scholar] [CrossRef] [PubMed]
  5. Atuchin, V.V.; Asyakina, L.K.; Serazetdinova, Y.R.; Frolova, A.S.; Velichkovich, N.S.; Prosekov, A.Y. Microorganisms for Bioremediation of Soils Contaminated with Heavy Metals. Microorganisms 2023, 11, 864. [Google Scholar] [CrossRef] [PubMed]
  6. Alloway, B.J. Sources of Heavy Metals and Metalloids in Soils. In Heavy Metals in Soils: Trace Metals and Metalloids in Soils and Their Bioavailability, Environmental Pollution; Alloway., B.J., Ed.; Springer: Dordrecht, The Netherlands, 2012; Volume 22, pp. 11–50. [Google Scholar]
  7. Boskos, E.; Perraki, T.; Kolokotroni, K. The Ni and Cr distribution in the mineralogical phases of the nickeliferous laterites from Evia island. Min. Wealth 1996, 101, 9–26. [Google Scholar]
  8. Boskos, E.; Orphanoudaki, A.; Perraki, T.H. The Ni distribution in the mineral phases of Greek Fe–Ni laterite deposits. In Proceedings of the 3rd Congress of Mineral Wealth, Athens, Greece, 22–24 November 2000; Proceedings Vol. A; Technical Chamber of Greece: Athens, Greece, 2000; pp. 107–115. [Google Scholar]
  9. Eliopoulos, D.G.; Economou-Eliopoulos, M. Geochemical and Mineralogical Characteristics of Fe–Ni- and Bauxitic-Laterite Deposits of Greece. Ore Geol. Rev. 2000, 16, 41–58. [Google Scholar] [CrossRef]
  10. Montalván-Olivares, D.M.; Santana, C.S.; Velasco, F.G.; Luzardo, F.H.M.; Andrade, S.F.R.; Ticianelli, R.B.; Armelin, M.J.A.; Genezini, F.A. Multi-Element Contamination in Soils from Major Mining Areas in Northeastern of Brazil. Environ. Geochem. Health 2021, 43, 4553–4576. [Google Scholar] [CrossRef]
  11. Kabata-Pendias, A. Trace Elements in Soils and Plants; CRC Press: Boca Raton, FL, USA, 2000. [Google Scholar] [CrossRef]
  12. Tsadilas, C.D.; Rinklebe, J.; Selim, H.M. (Eds.) Nickel in Soils and Plants; CRC Press: Boca Raton, FL, USA, 2018. [Google Scholar] [CrossRef]
  13. Gasparatos, D.; Barbayiannis, N. The Origin of Nickel in Soils. In Nickel in Soils and Plants; CRC Press: Boca Raton, FL, USA, 2019. [Google Scholar]
  14. Alevizos, G. Mineralogy, Geochemistry and Origin of the Sedimentary Fe-Ni Ores of Lokris. Ph.D. Thesis, Technical University of Crete, Chania, Greece, 1997; p. 245. [Google Scholar]
  15. Economou-Eliopoulos, M. Apatite and Mn, Zn, Co-Enriched Chromite in Ni-Laterites of Northern Greece and Their Genetic Significance. J. Geochem. Explor. 2003, 80, 41–54. [Google Scholar] [CrossRef]
  16. Kumar, O.; Singh, S.K.; Singh, A.P.; Yadav, S.N.; Latare, A.M. Effect of Soil Application of Nickel on Growth, Micronutrient Concentration and Uptake in Barley (Hordeum vulgare L.) Grown in Inceptisols of Varanasi. J. Plant Nutr. 2017, 41, 50–66. [Google Scholar] [CrossRef]
  17. Shahzad, B.; Tanveer, M.; Rehman, A.; Cheema, S.A.; Fahad, S.; Rehman, S.; Sharma, A. Nickel; Whether Toxic or Essential for Plants and Environment—A Review. Plant Physiol. Biochem. 2018, 132, 641–651. [Google Scholar] [CrossRef]
  18. Lerdau, M. Mineral Nutrition of Plants: Principles and Perspectives. Second Edition. By Emanuel Epstein and, Arnold J Bloom. Sunderland (Massachusetts): Sinauer Associates. $79.95. Xiv + 400 p; Ill.; Author and Subject Indexes. ISBN: 0-87893-172-4. 2005. Q. Rev. Biol. 2005, 80, 359. [Google Scholar] [CrossRef]
  19. Genchi, G.; Carocci, A.; Lauria, G.; Sinicropi, M.S.; Catalano, A. Nickel: Human Health and Environmental Toxicology. Int. J. Environ. Res. Public Health 2020, 17, 679. [Google Scholar] [CrossRef] [PubMed]
  20. Economou-Eliopoulos, M.; Megremi, I.; Atsarou, C.; Theodoratou, C.; Vasilatos, C. Spatial Evolution of the Chromium Contamination in Soils from the Assopos to Thiva Basin and C. Evia (Greece) and Potential Source(s): Anthropogenic versus Natural Processes. Geosciences 2013, 3, 140–158. [Google Scholar] [CrossRef]
  21. OPEKEPE (in Greek). The Greek Payment Agency. Development of a Unified System for Geospatial Soil Data and the Delineation of the Rural Areas of the Country. Ministry of Rural Development and Food. 2014. Available online: https://iris.gov.gr/SoilServices (accessed on 10 February 2022).
  22. IUSS Working Group WRB. World Reference Base for Soil Resources. In International Soil Classification System for Naming Soils and Creating Legends for Soil Maps, 4th ed.; International Union of Soil Sciences (IUSS): Vienna, Austria, 2022; Available online: https://www.isric.org/sites/default/files/WRB_fourth_edition_2022-12-18.pdf (accessed on 25 January 2023).
  23. Bouyoucos, G.J. A Recalibration of the Hydrometer Method for Making Mechanical Analysis of Soils 1. Agron. J. 1951, 43, 434–438. [Google Scholar] [CrossRef]
  24. Nelson, D.W.; Sommers, L.E. Total carbon, organic carbon and organic matter. In Methods of Soil Analysis, Part. 2, Chemical and Microbiological Properties; Page, A.L., Miller, R.H., Keeney, D.R., Eds.; ASA-SSSA: Madison, WI, USA, 1982. [Google Scholar]
  25. Roussos, P.A.; Gasparatos, D.; Kyriakou, C.; Tsichli, K.; Tsantili, E.; Haidouti, C. Growth, nutrient status, and biochemical changes of sour orange plants subjected to sodium chloride stress. Commun. Soil Sci. Plant Anal. 2013, 44, 805–816. [Google Scholar] [CrossRef]
  26. Mehra, O.P. Iron Oxide Removal from Soils and Clays by a Dithionite-Citrate System Buffered with Sodium Bicarbonate. Clays Clay Miner. 1958, 7, 317–327. [Google Scholar] [CrossRef]
  27. Schwertmann, U.; Taylor, R.M. Iron oxides. In Minerals in Soil Environments, 2nd ed.; Soil Science Society of America: Wisconsin, MA, USA, 1989; pp. 379–438. [Google Scholar]
  28. Gasparatos, D.; Haidouti, A. comparison of wet oxidation methods for determination of total phosphorus in soils. J. Plant Nutr. Soil Sci. 2001, 164, 435–439. [Google Scholar] [CrossRef]
  29. Chatzistathis, T.; Papaioannou, A.; Gasparatos, D.; Molassiotis, A. From Which Soil Metal Fractions Fe, Mn, Zn and Cu Are Taken up by Olive Trees (Olea Europaea L., Cv. ‘Chondrolia Chalkidikis’) in Organic Groves? J. Environ. Manag. 2017, 203, 489–499. [Google Scholar] [CrossRef]
  30. Rauret, G.; López-Sánchez, J.F.; Sahuquillo, A.; Rubio, R.; Davidson, C.; Ure, A.; Quevauviller, P. Improvement of the BCR Three Step Sequential Extraction Procedure Prior to the Certification of New Sediment and Soil Reference Materials. J. Environ. Monit. 1999, 1, 57–61. [Google Scholar] [CrossRef]
  31. Kalyvas, G.; Gasparatos, D.; Papassiopi, N.; Massas, I. Topsoil Pollution as Ecological Footprint of Historical Mining Activities in Greece. Land Degrad. Dev. 2018, 29, 2025–2035. [Google Scholar] [CrossRef]
  32. Zafeiriou, I.; Gasparatos, D.; Megremi, I.; Ioannou, D.; Massas, I.; Economou-Eliopoulos, M. Assessment of Potentially Toxic Element Contamination in the Philippi Peatland, Eastern Macedonia, Greece. Minerals 2022, 12, 1475. [Google Scholar] [CrossRef]
  33. Webster, R.; Oliver, M.A. Geostatistics for Environmental Scientists; John Wiley & Sons, Ltd.: Hoboken, NJ, USA, 2007. [Google Scholar] [CrossRef]
  34. Tobler, W.R. A Computer Movie Simulating Urban Growth in the Detroit Region. Econ. Geogr. 1970, 46, 234. [Google Scholar] [CrossRef]
  35. Netherlands Ministry of Housing, Physical Planning and Environment (Netherlands MHPPE). Annexes Circular on Target Values for Soil Remediation; MHPPE: The Hague, The Netherlands, 2000. [Google Scholar]
  36. Hakanson, L. An Ecological Risk Index for Aquatic Pollution Control. A Sedimentological Approach. Water Res. 1980, 14, 975–1001. [Google Scholar] [CrossRef]
  37. Aendo, P.; Netvichian, R.; Thiendedsakul, P.; Khaodhiar, S.; Tulayakul, P. Carcinogenic Risk of Pb, Cd, Ni, and Cr and Critical Ecological Risk of Cd and Cu in Soil and Groundwater around the Municipal Solid Waste Open Dump in Central Thailand. J. Environ. Public Health 2022, 2022, 3062215. [Google Scholar] [CrossRef] [PubMed]
  38. Kusin, F.M.; Azani, N.N.M.; Hasan, S.N.M.S.; Sulong, N.A. Distribution of Heavy Metals and Metalloid in Surface Sediments of Heavily-Mined Area for Bauxite Ore in Pengerang, Malaysia and Associated Risk Assessment. Catena 2018, 165, 454–464. [Google Scholar] [CrossRef]
  39. Wei, Z.; Van Le, Q.; Peng, W.; Yang, Y.; Yang, H.; Gu, H.; Lam, S.S.; Sonne, C. A Review on Phytoremediation of Contaminants in Air, Water and Soil. J. Hazard. Mater. 2021, 403, 123658. [Google Scholar] [CrossRef]
  40. Okonkwo, S.I.; Idakwo, S.O.; Ameh, E.G. Heavy Metal Contamination and Ecological Risk Assessment of Soils around the Pegmatite Mining Sites at Olode Area, Ibadan Southwestern Nigeria. Environ. Nanotechnol. Monit. Manag. 2021, 15, 100424. [Google Scholar] [CrossRef]
  41. US Environmental Protection Agency (USEPA). Supplemental Guidance for Developing Soil Screening Levels for Superfund Sites, OSWER 9355; Office of Emergency and Remedial Response: Washington, DC, USA, 2002. [Google Scholar]
  42. US Environmental Protection Agency (USEPA). Integrated Risk Information System of the US Environmental Protection Agency; Office of Emergency and Remedial Response: Washington, DC, USA, 2012. [Google Scholar]
  43. Johnson-Beebout, S.E.; Lauren, J.G.; Duxbury, J.M. Immobilization of Zinc Fertilizer in Flooded Soils Monitored by Adapted DTPA Soil Test. Commun. Soil Sci. Plant Anal. 2009, 40, 1842–1861. [Google Scholar] [CrossRef]
  44. Bhatt, M.K.; Raverkar, K.P.; Chandra, R.; Pareek, N.; Labanya, R.; Kumar, V.; Kaushik, S.; Singh, D.K. Effect of Long-term Balanced and Imbalanced Inorganic Fertilizer and FYM Application on Chemical Fraction of DTPA-extractable Micronutrients and Yields under Rice–Wheat Cropping System in Mollisols. Soil Use Manag. 2020, 36, 261–273. [Google Scholar] [CrossRef]
  45. Dhaliwal, S.S.; Sharma, V.; Kaur, J.; Shukla, A.K.; Hossain, A.; Abdel-Hafez, S.H.; Gaber, A.; Sayed, S.; Singh, V.K. The Pedospheric Variation of DTPA-Extractable Zn, Fe, Mn, Cu and Other Physicochemical Characteristics in Major Soil Orders in Existing Land Use Systems of Punjab, India. Sustainability 2021, 14, 29. [Google Scholar] [CrossRef]
  46. Barman, M.; Datta, S.P.; Rattan, R.K.; Meena, M.C. Critical Limits of Deficiency of Nickel in Intensively Cultivated Alluvial Soils. J. Soil Sci. Plant Nutr. 2019, 20, 284–292. [Google Scholar] [CrossRef]
  47. Contin, M.; Miho, L.; Pellegrini, E.; Gjoka, F.; Shkurta, E. Effects of Natural Zeolites on Ryegrass Growth and Bioavailability of Cd, Ni, Pb, and Zn in an Albanian Contaminated Soil. J. Soils Sediments 2019, 19, 4052–4062. [Google Scholar] [CrossRef]
  48. Megremi, I. Distribution and bioavailability of Cr in central Euboea, Greece. Open Geosci. 2010, 2, 103–123. [Google Scholar] [CrossRef]
  49. Kumar, D.; Ramani, V.P.; Patel, K.C.; Shukla, A.K. Establishing Critical Limits for Nickel in Soil and Plant for Predicting the Response of Spinach (Spinacia Oleracea). J. Indian Soc. Soil Sci. 2021, 69, 105–110. [Google Scholar] [CrossRef]
  50. Kaur, R.; Rani, R. Spatial Characterization and Prioritization of Heavy Metal Contaminated Soil-Water Resources in Peri-Urban Areas of National Capital Territory (NCT), Delhi. Environ. Monit. Assess. 2006, 123, 233–247. [Google Scholar] [CrossRef]
  51. Parvin, A.; Moniruzzaman, M.; Hossain, M.K.; Saha, B.; Parvin, A.; Suchi, P.D.; Hoque, S. Chemical Speciation and Potential Mobility of Heavy Metals in Organic Matter Amended Soil. Appl. Environ. Soil Sci. 2022, 2022, 2028860. [Google Scholar] [CrossRef]
  52. Mitrović, M.; Blanusa, T.; Pavlović, M.; Pavlović, D.; Kostić, O.; Perović, V.; Jarić, S.; Pavlović, P. Using Fractionation Profile of Potentially Toxic Elements in Soils to Investigate Their Accumulation in Tilia sp. Leaves Urban Areas Differ. Pollut. Levels. Sustain. 2021, 13, 9784. [Google Scholar] [CrossRef]
  53. Davidson, C.M.; Urquhart, G.J.; Ajmone-Marsan, F.; Biasioli, M.; da Costa Duarte, A.; Díaz-Barrientos, E.; Grčman, H.; Hossack, I.; Hursthouse, A.S.; Madrid, L.; et al. Fractionation of Potentially Toxic Elements in Urban Soils from Five European Cities by Means of a Harmonised Sequential Extraction Procedure. Anal. Chim. Acta 2006, 565, 63–72. [Google Scholar] [CrossRef]
  54. Lafuente, A.L.; González, C.; Quintana, J.R.; Vázquez, A.; Romero, A. Mobility of Heavy Metals in Poorly Developed Carbonate Soils in the Mediterranean Region. Geoderma 2008, 145, 238–244. [Google Scholar] [CrossRef]
  55. Ospina-Alvarez, N.; Głaz, Ł.; Dmowski, K.; Krasnodębska-Ostręga, B. Mobility of Toxic Elements in Carbonate Sediments from a Mining Area in Poland. Environ. Chem. Lett. 2014, 12, 435–441. [Google Scholar] [CrossRef] [PubMed]
  56. Kamunda, C.; Mathuthu, M.; Madhuku, M. Health Risk Assessment of Heavy Metals in Soils from Witwatersrand Gold Mining Basin, South Africa. Int. J. Environ. Res. Public Health 2016, 13, 663. [Google Scholar] [CrossRef] [PubMed]
  57. Diami, S.M.; Kusin, F.M.; Madzin, Z. Potential Ecological and Human Health Risks of Heavy Metals in Surface Soils Associated with Iron Ore Mining in Pahang, Malaysia. Environ. Sci. Pollut. Res. 2016, 23, 21086–21097. [Google Scholar] [CrossRef]
  58. Chonokhuu, S.; Batbold, C.; Chuluunpurev, B.; Battsengel, E.; Dorjsuren, B.; Byambaa, B. Contamination and Health Risk Assessment of Heavy Metals in the Soil of Major Cities in Mongolia. Int. J. Environ. Res. Public Health 2019, 16, 2552. [Google Scholar] [CrossRef]
  59. Ahmad, W.; Alharthy, R.D.; Zubair, M.; Ahmed, M.; Hameed, A.; Rafique, S. Toxic and Heavy Metals Contamination Assessment in Soil and Water to Evaluate Human Health Risk. Sci. Rep. 2021, 11, 17006. [Google Scholar] [CrossRef] [PubMed]
Figure 1. The study area, consisting of the three delineated agricultural areas, and the sampling sites.
Environments 10 00150 g001
Figure 2. Percentage fraction participation of Fe, Ni, Co, Mn, and Cr in the studied soils of the three areas. F1: exchangeable/acid soluble; F2: reducible; F3: oxidizable; F4; residual fraction.
Environments 10 00150 g002aEnvironments 10 00150 g002b
Figure 3. Single Pollution Indices (different lowercase letters indicate significant differences).
Environments 10 00150 g003
Figure 4. Spatial distribution of (a) Ni, (b) Cr, and (c) Co Single Pollution Indices (PI).
Environments 10 00150 g004aEnvironments 10 00150 g004b
Figure 5. Percentage of ecological risk factor for single metal pollution E r i to total RI.
Environments 10 00150 g005
Figure 6. Spatial distribution of Potential Ecological Risk Index (RI).
Environments 10 00150 g006
Figure 7. Spatial distribution of Ni Hazard Index for children.
Environments 10 00150 g007
Table 1. a, b, and c values for the studied Potential Toxic Elements (PTEs).
Metal/ValueNiCrCoZnCuPb
a10502501550
b120.2830.61
c0001.50.61
Table 5. Soil Properties. Different lowercase letters indicate significant differences (p < 0.05). Comparisons of means are valid between areas.
Area Sand
(g kg−1)
Silt
(g kg−1)
Clay
(g kg−1)
pH
(1:1)
E.C.
(μS cm−1)
O.C.
(g kg−1)
CaCO3eq
(g kg−1)
Feo
(mg kg−1)
Fed
(mg kg−1)
Mno
(mg kg−1)
Mnd
(mg kg−1)
Alo
(mg kg−1)
Ald
(mg kg−1)
Mean322 b286 b392 a7.24 a1002 ab26.77 b154.6 b1121.7 a16,864.50 a613.3 a851.75 a912.7 a640.15 a
Politika
(n = 10)
Median3083003927.2273221.23165.31071.015,420.00629.1793.75841.5489.25
St.dev6342520.1759516.8792.2441.57274.14138.5217.66374.4342.40
Mean254 a297 b449 a7.34 a692 a10.95 a67.6 a1624.2 b12,465.77 a865.2 b877.50 a905.4 a538.73 a
Mantoudi
(n = 13)
Median2473084357.356719.7569.71564.212.085883.8857.50946.8565.00
St.dev84751070.192115.5154.5531.12635.58196.9193.71190.4146.13
Mean334 b234 a432 a7.42 a1004 b12.67 a141.3 b1379.5 ab15,291.14 a707.2 ab743.46 a943.7 a643.54 a
Ag. Triada
(n = 13)
Median3442284487.4178410.50118.91123.212,690.00606.6727.50910.8702.00
St.dev6943800.224876.83107.3505.56571.93385.9248.88315.5249.25
Feo, Mno, Alo: extracted by ammonium oxalate; Fed, Mnd and Ald: extracted by sodium bicarbonate dithionite.
Table 6. Total Potential Toxic Elements (PTEs) concentrations. Different lowercase letters indicate significant differences (p < 0.05). Comparisons of means are valid between areas.
Fe
(mg kg−1)
Mn
(mg kg−1)
Ni
(mg kg−1)
Cr
(mg kg−1)
Cu
(mg kg−1)
Zn
(mg kg−1)
Pb
(mg kg−1)
Co
(mg kg−1)
Politika
Mean51,800.00 a1360.38 a1946.88 ab711.43 a41.09 a51.68 a15.39 b122.02 a
Median48,390.001427.501774.06636.0739.6638.1813.50124.37
Std13,109.52216.17928.11312.099.8034.497.9039.82
Min37,890.00971.88510.00327.8630.5631.295.0057.42
Max82,210.001627.503490.001173.5762.25145.2532.25182.25
25th45,630.001196.251449.38472.1432.6333.8310.6398.50
75th53,980.001536.882132.501000.7142.9449.5119.63145.17
Mantoudi
Mean54,533.08 a1675.43 b1682.31 a445.88 b62.05 b38.52 a9.99 b121.76 a
Median56,880.001684.381630.63460.0059.9439.038.88123.75
Std8167.26279.48485.7190.5018.244.826.8423.95
Min38,400.001242.501050.00257.1441.2530.733.6385.83
Max68,730.002254.382926.25580.71108.1945.6331.75181.75
25th54,530.001497.501316.88390.0049.4433.105.83108.00
75th57,900.001853.131907.50505.7168.6944.5910.98131.42
Ag. Triada
Mean51,363.08 a1322.16 a2220.67 b1156.37 c40.60 a49.89 a3.63 a136.21 a
Median49,310.001256.882086.88998.5739.6943.933.50126.75
Std12,548.97471.38731.40569.979.8919.762.5634.23
Min33,080.00726.251358.13475.0022.0627.730.2590.33
Max72,860.002202.133780.632444.2959.9492.538.75184.58
25th41,080.001091.881667.50675.7134.8132.861.30114.75
75th60,630.001533.752736.871403.5747.1981.137.53172.42
Table 7. Diethylenetriamine Pentaacetic Acid (DTPA) Potential Toxic Elements (PTEs) extracted concentrations. Different lowercase letters indicate significant differences (p < 0.05). Comparisons of means are valid between areas.
Fe
(mg kg−1)
Mn
(mg kg−1)
Ni
(mg kg−1)
Cr
(mg kg−1)
Cu
(mg kg−1)
Zn
(mg kg−1)
Co
(mg kg−1)
Politika
Mean16.95 b34.79 b16.87 b0.08 a1.53 a4.45 b0.83 c
Median14.0327.5718.150.081.381.240.90
Std8.2522.274.510.020.549.480.28
Min7.7717.889.100.050.900.250.37
Max36.5093.2222.980.102.3731.251.18
25th13.3420.9214.960.061.130.670.58
75th20.5738.1419.810.092.013.060.95
Mantoudi
Mean11.38 a19.08 a10.46 a0.12 a2.62 b0.95 a0.26 a
Median11.2914.228.540.112.320.710.20
Std3.5212.068.400.021.700.870.16
Min6.187.244.250.091.170.330.09
Max17.2343.5237.480.157.683.440.62
25th8.3410.847.700.101.510.430.16
75th12.9424.3210.260.142.911.000.31
Ag. Triada
Mean11.50 a22.43 ab17.23 b0.12 a2.76 b2.88 b0.55 b
Median11.5418.8017.980.122.392.260.55
Std3.037.976.660.021.211.640.20
Min7.209.906.230.080.990.870.24
Max16.8936.0427.620.155.125.560.90
25th9.5617.8614.460.112.081.660.42
75th12.9828.4419.320.133.084.120.69
Table 8. Descriptive statistics for the Potential Ecological Risk Index (RI) in the three studied areas. Different lowercase letters indicate significant differences (p < 0.05). Comparisons are valid between areas.
Politika (N = 10)Mantoudi (N = 13)Ag. Triada (N = 13)
Mean266.5 ab210.2 b279.4 a
Median237.2194.5269.4
Std140.855.492.4
Min90.8129.2153.9
Max553.8318.3497.0
25th173.2180.0210.9
75th322.5244.0329.6
Table 9. Hazard Index (HI) and Life Cancer Risk (LCR) values. Different lowercase letters indicate significant differences (p < 0.05). Comparisons of means are valid between areas.
HI IndexLCR Index
NiNiNiNi
ChildAdultChildAdult
Politika
Mean1.248 ab0.135 ab0.0227 ab0.0024 ab
Median1.1370.1230.02060.0022
Std0.5950.0640.01080.0012
Min0.3270.0350.00590.0006
Max2.2370.2420.04060.0044
25th0.9290.1040.01690.0018
75th1.3670.1480.02480.0027
Mantoudi
Mean1.078 a0.117 a0.0196 a0.0021 a
Median1.0450.1130.01900.0020
Std0.3110.0330.00570.0006
Min0.6730.0730.01220.0013
Max1.8760.2030.03400.0036
25th0.8440.0920.01530.0016
75th1.2230.1330.02220.0024
Ag. Triada
Mean1.423 b0.154 b0.0258 b0.0028 b
Median1.3380.1450.02430.0026
Std0.4690.0510.00850.0009
Min0.8710.0940.01580.0017
Max2.4230.2630.04300.0047
25th1.0690.1160.01940.0021
75th1.7540.1900.03180.0034
Table 10. Significant correlations.
ClayO.C.CaCO3Fet1MntNitCrtCutZntPbtCotFeav2MnavNiavCravZnavFed3Feo4
Clay
O.C.
CaCO3
Fet **/−
Mnt ***/−***/+
Nit ***/+
Crt ***/+
Cut ***/-*/+***/+
Znt ***/+ */+
Pbt ***/+ **/+
Cot ***/+**/+***/+***/+
Feav ***/+ ***/+***/+
Mnav ***/+ ***/+***/+ ***/+
Niav */+ ***/+***/+ ***/+
Crav
Cuav ***/+
Znav ***/+ ***/+***/+ ***/+***/+
Pbav
Coav*/-**/+ */+***/+**/+*/-
Fed */+ */+*/+
Feo ***/−***/+***/+ */+***/+ **/+
Mnd */−*/+***/+ */+ */+ */+*/+
Mno*/+ ***/−***/+***/+ ***/+ **/+ ***/+
Ald **/+ */+ **/+ **/+***/+ ***/+**/+
Alo */+*/− ***/+*/+ **/+**/+ ***/+*/+**/+
O.C.: Organic Carbon; 1: extracted by aqua regia; 2: extracted by DTPA; 3: extracted by sodium bicarbonate dithionote; 4: extracted by ammonium oxalate; ***: p < 0.001; **: p < 0.01; *: p < 0.05. The observed values showed that the risk of Ni, Co, and Mn, and, to a lesser extent of Cr, to show high mobility in the soil ecosystem is considerable, and measures to reduce such risk should be deployed. The sum of Ni, Cr, and Co concentrations in the two first steps of BCR increased in the order Ag. Triada > Mantoudi > Politika, indicating a corresponding increasing potential availability of these metals. However, due to the high variability of the values, no significant differences were detected between the three areas except for the significantly higher F1 + F2 concentration of Cr in Ag. Triada and Mantoudi soils compared to Politika soils. On the contrary, Mn potential availability (expressed as F1 + F2 sum) was significantly higher in the soils of Mantoudi, whereas no difference depicted between the soils of Politika and Ag. Triada. These results follow the same pattern as the respective mean total Ni, Cr, Co, and Mn concentrations (Table 6), showing that the increased total metal concentrations led to increased potential metal availability (F1 + F2 fractions).
Table 11. Exchangeable/acid soluble (F1) + reducible (F2) concentrations for Mn, Ni, Cr, and Co. Different lowercase letters indicate significant differences (p < 0.05). Comparisons of means are valid between areas.
MnNiCrCo
Politika (N = 10)
Mean877.83 a150.84 a7.47 b32.27 a
Median881.74107.346.4026.46
Std165.46113.285.4223.07
Mantoudi (N = 13)
Mean1081.06 b205.38 a11.71 a39.05 a
Median1048.5218.9211.8440.16
Std244.969.503.1910.90
Ag. Triada (N = 13)
Mean823.13 a220.41 a13.27 a43.01 a
Median818.56221.5213.2840.20
Std347.18118.768.3320.57
Disclaimer/Publisher’s Note: The statements, opinions and data contained in all publications are solely those of the individual author(s) and contributor(s) and not of MDPI and/or the editor(s). MDPI and/or the editor(s) disclaim responsibility for any injury to people or property resulting from any ideas, methods, instructions or products referred to in the content.

