Article

Contribution of Stormwater Outfalls to Microplastic Pollution in a Subtropical Estuary Using Data Collected with the Assistance of Citizen Scientists

1
Department of Biology, University of Central Florida, 4000 Central Florida Blvd., Orlando, FL 32816, USA
2
Florida Fish and Wildlife Conservation Commission, Fish and Wildlife Research Institute, 100 Eighth Ave SE, St. Peterburg, FL 33701, USA
3
Marine Discovery Center, 520 Barracuda Blvd., New Smyrna Beach, FL 32169, USA
4
Indian River Lagoon National Estuary Program, 1235 Main Street, Sebastian, FL 32958, USA
5
Florida Department of Environmental Protection, Indian River Lagoon Aquatic Preserves, 3300 Lewis St., Fort Pierce, FL 34981, USA
6
Martin County Board of County Commissioners, 2401 SE Monterey Rd., Stuart, FL 34996, USA
7
Smithsonian Marine Station, 701 Seaway Dr., Fort Pierce, FL 34949, USA
8
Department of Chemistry and Nanoscience Technology Center, University of Central Florida, 4000 Central Florida Blvd., Orlando, FL 32816, USA
*
Author to whom correspondence should be addressed.
Environments 2023, 10(10), 181; https://doi.org/10.3390/environments10100181
Submission received: 22 August 2023 / Revised: 9 October 2023 / Accepted: 11 October 2023 / Published: 13 October 2023

Abstract

:
Stormwater outfalls are frequently listed as sources of microplastic (MP) contamination into aquatic systems. To date, few studies have been undertaken to determine if stormwater outfalls are MP hotspots in estuaries. This study compared the surface waters adjacent to and at least one kilometer away from stormwater outfalls of a subtropical estuarine system: the Indian River Lagoon (IRL) on the east coast of Florida, USA. Citizen scientists collected water samples monthly for 12 months from stormwater outfalls (n = 24) and control sites (n = 6). Overall, 958 MPs were identified from 1800 L of water, with the most found in the fall months during hurricane season. Stormwater outfalls (mean: 0.53 MP/L) were found to discharge smaller MPs (GLM: p = 0.0008) in significantly higher amounts compared to control sites (GLM: p = 0.02), documenting stormwater as a point-source pollutant in this system. Two types of stormwater outfalls drained into the IRL—closed culverts and open drainage channels—with no difference in MP abundances between the two (GLM: p = 0.60). Microfibers dominated collections (89%). Using ATR-FTIR for polymer identification, 80% of the materials found were plastic; polypropylene (29%), polyethylene (18%), and polyethylene terephthalate (18%) were the most abundant polymers found.

1. Introduction

Plastic pollution is currently among the most pervasive threats to our global ecosystem, and the demand for and production of plastic products continue to increase at a rate of 8% per year [1]. Over 300 metric tons (Mt) of plastic are produced each year [1] and an estimated 8 Mt enters the oceans annually [2]. Microplastics (MPs) are defined as plastic pieces < 5 mm. In aquatic environments, MPs are effectively bioaccumulated across trophic levels due to their small size and buoyancy [3,4,5,6]. Aquatic organisms known to accumulate MPs include oysters [7], fulmars [8,9], osprey [10], amphibians [11], mussels [12,13], whales [14,15], sea turtles [16,17], and fish [18,19,20,21]. Many commercially important species accumulate MPs [22], as do planktonic organisms [23,24]. A number of ecotoxicological responses to MPs have been reported in many aquatic species, including cytotoxicity, mortality, neurotoxicity, and genotoxicity [25]. In fish, MP ingestion disrupts the gut microbiome, causes inflammation, intestinal complications, and increases oxidative stress [26,27,28].
Up to 80% of plastics introduced into marine environments originate from land-based activities such as agriculture and construction [29]. Additionally, human activities, including littering, add MPs into freshwater systems that eventually are deposited into marine environments [30]. Wastewater treatment plants are known point-sources of MPs that leach contaminants into streams and marine environments [31,32,33]. Microbeads, primary MPs from cosmetic and personal care products, have been found in wastewater discharge [34]. Wastewater is commonly discharged directly into coastal waters after being treated and filtered, and up to 99% of MP contaminants can be removed from effluents via filtration [35,36,37]. However, the large volume of daily discharge still leads to a substantial amount of MP pollution [31].
Stormwater is recognized as a pathway and source of MPs and contaminants in aquatic systems [38,39], having more of an impact than wastewater effluents in areas with high rainfall [40,41,42]. Chen et al. [42] estimated the Huangpu River watershed in eastern China had an MP load of 8.50 × 10¹⁴ particles per year from stormwater overflow, about six times larger than the local wastewater treatment plant effluent. Airborne MPs are concentrated into rain droplets to create “plastic rain” [43]. Other pathways include rainwater transporting contaminated surface runoff. Most of the MPs in stormwater come from daily-use plastic items and road dust, which is comprised mainly of tire particles and road paint [44,45]. Rain events influence the number of pollutants and road dust in stormwater [46]. Hitchcock [47] observed an MP abundance increase of 40-fold during a storm. Land activities and population density influence the pollutant load transported through stormwater [42].
Estuaries act as gateways, carrying freshwater and pollutants to marine environments. Multiple studies have found estuaries to be MP hotspots [48,49,50], likely because of the multiple freshwater inputs, and the unique hydrodynamics. Tributaries carry plastics into marine environments, which is often driven by onshore activities and rainfall. The shorelines of Hong Kong have been described as an MP hotspot. Hong Kong is a highly populated city with over 7 million people. The onshore activities being carried out by the Pearl River estuary are likely causes of the MP accumulation [51], and Cheung et al. [52] found the estuary to influence marine plastic debris on nearby beaches. The Yangtze River estuary was first described as an MP hotspot by Zhao et al. [49] after recording MP concentrations up to 4137.3 ± 2461.5 n/m3 in estuarine surface waters. Charleston Harbor, an estuary in South Carolina, found 6.6 ± 1.3 particles/L in the surface waters [50]. Interestingly, Winyah Bay, another estuary in South Carolina, recorded 30.8 ± 12.1 particles/L in surface waters [50]. Winyah Bay has a higher population and greater drainage area compared to Charleston Harbor, and the higher MP loads in Winyah Bay are likely from the Yadkin Pee-Dee River Basin inputs [50].
Citizen science is the involvement of volunteers to help with collecting or analyzing data for research purposes. Studies utilizing citizen scientists in plastics research are becoming increasingly common due to the mutual benefits both parties receive [53]. Crowd-sourced data, such as The Big Microplastic Project [54], rely on volunteers to follow a protocol from their website, conduct individual surveys, identify, and record the collected plastic particles. Through crowd sourcing, data were collected from 55 different countries [54]. The downside to crowd sourcing is the inability to check for accuracy, and there are likely misidentified objects and protocols that were not properly followed.
The Indian River Lagoon (IRL), located on the east coast of central Florida, is an Estuary of National Significance and generates USD 7.6 billion per year in revenue [55]. A recent year-long study of the IRL by Walters et al. [48] found an average of 1.5 MPs/liter of surface water, with 44% of samples containing MPs. Lagoon-wide, 70% of filter-feeding oysters contained MPs with an increase in the more urbanized southern lagoon. While this study included 35 locations that spanned the 250 km long estuary, it did not control for proximity to stormwater outfalls, either as open channels or enclosed pipes. The purpose of our study is to determine if stormwater outfalls are adding a significant amount of MP pollutants to this system. To better understand the impact of stormwater outfalls on IRL plastics, our study was run monthly for 12 months at 24 stormwater outfalls plus six control sites (minimum of 1 km from the outfall). Samples were processed in the laboratory following NOAA guidelines [56] with the assistance of citizen scientists. It is essential to understand the regional vectors of MP pollutants to be able to manage this problem. This is especially important in areas protected for their significance to tourism and ecosystem services. Determining the sources of these pollutants is necessary to develop effective management strategies and mitigate future contamination.

2. Materials and Methods

2.1. Study Location and Sampling Methods

The IRL is comprised of three interconnected water bodies, the Indian River Lagoon, Banana River Lagoon, and Mosquito Lagoon, that extend from Ponce de Leon Inlet (New Smyrna Beach) in the north to Jupiter Inlet in the south. The climate is characterized by long, warm summers with mild winters. The IRL is a shallow system with an average depth of 1.22 m [57]. Freshwater rivers, canals, and creeks flow into the IRL and mix with the saline marine water from five Atlantic Ocean inlets to create a brackish environment. Construction and development restrict water circulation, leading to long residence times and an increase in the number of regions susceptible to nutrient loading [55]. Rapid urbanization and population increase have contributed to the poor water quality in the IRL [57]. Moreover, in the last decade, approximately 95% of seagrass populations have died from high nitrogen concentrations and low light availability [58]. Furthermore, intertidal oyster reef acreage declined by 63% between 1943 and 2021 [59]. Increased annual temperatures and salinity levels may additionally be driving the regional tropicalization of fish species [60].
Monthly water samples were collected from 30 sites (Figure 1) during the first week of each month between August 2020 and August 2021. All stormwater outfall sites discharged into the IRL and were located from county maps and discussions with county stormwater managers. Sites were accessible on public lands and were selected by using a random number generator (random.org) and grouped into north, central, and south regions with 8 from each region (Figure 1). Two control sites were also included per region. Although not used to select the stormwater sites, outfalls were later grouped into one of two categories for analyses: culvert (n = 17) or open outfall (n = 7). Culverts had water enclosed in a pipe or cement structure that drained into the IRL, while open outfalls were channels or ditches with water visibly emptying into the estuary.

2.2. Sample Collection and Processing

Water samples were collected by trained citizen scientists associated with the University of Central Florida (UCF) and partnering non-profit organizations. Citizen ages ranged from 16 to 80, and the majority of participants were college students or college-educated retirees. Volunteers were recruited through social media and word-of mouth. Most undergraduate students were focused on degrees in Biology or Environmental Studies, while most retirees were already engaged in working with these non-profits to improve the IRL and wanted to play a more active role. A requirement of participation was reliable transportation and a 12-month commitment to the project. Workshops lasted 3–6 h and educated citizens on MP pollution, field sampling procedures, and MP inspection in the laboratory. All participants were required to pass an MP accuracy test using microscopy. After individuals successfully completed the training, citizen scientists independently collected monthly water samples. MP identification was completed at UCF or under direct observation of a supervisor at associated non-profit agencies.
At each field location, five 1 L bottles of surface water were collected using marine-grade, high-density polyethylene terephthalate containers. The 24 stormwater samples were collected within 1 m of the opening of the stormwater outfall. The 6 control sites were collected from at least 1 km away from any stormwater outfall.
Bottles were rinsed three times prior to collection with 0.45 µm filtered deionized (DI) water in the laboratory and an additional three times in the field with site water before sampling to reduce potential contamination. Samples were collected from the top 5 cm of the surface water without disturbing the lagoon bottom.
In the laboratory, the NOAA procedures [56] for processing MPs were carefully followed. Water samples were separately filtered through 0.45 µm nitrocellulose filter papers using vacuum filtration. The filters had a grid pattern of 3 mm × 3 mm squares, which were used, along with rulers, to measure the MP sizes by comparing the particles to the known dimensions of the gridded filter paper. MPs were measured based on the lengths of their most extended points. Filters were then placed individually in closed, labeled Petri dishes. Each filter was next inspected under a Leica EZ4 microscope at 20–35× magnification to allow observation of MPs as small as 0.001 mm. The abundance, dimensions, type, and color of each MP on each filter were recorded. MP “types” included fiber, fragment, foam, film, and nurdle (microbead).
During each inspection session, 3–5 blank filters were set around the observation area to correct for potential airborne MP contamination [61]. Each blank filter was dampened with 0.45 µm filtered DI water to allow airborne contaminants to adhere to the filters. Blank filters were inspected after each session, and the contamination rate was calculated as contamination per minute (see Craig et al., 2022 [7]).
Due to the scope of this project and our efforts to include citizen scientists, each of the 3 regions collected and processed MP samples at their respective facilities. The Marine Discovery Center collected from the northern region, the University of Central Florida from the central region, and the Florida Department of Environmental Protection from the southern region. Citizen scientists from all locations were trained in MP water collection, microscopic observations, and were closely monitored by the project leads. To maximize consistency and accuracy, the project leads used the same training guides and data sheets and performed quality control by randomly selecting and reinspecting ≥10% of the samples in each region. If any observers were incorrect on more than 10% of their results or if a single sample was either ≥50% higher or lower than the correct value, all Petri dishes assigned to that individual were reanalyzed by the science team.

2.3. Fourier-Transform Infrared Spectroscopy

We used Attenuated Total Reflection Fourier-Transform Infrared Spectroscopy (ATR-FTIR) to identify the polymer composition on 10% of the randomly selected samples from the samples that had at least 1 MP. We analyzed MPs that ranged in size from 0.5 mm to 18 mm. A Shimadzu IRSpirit-T spectrophotometer (Shimadzu, Kyoto, Japan) was used for these analyses. MPs were scanned in the 600 cm−1 to 4000 cm−1 range. Spectra were then matched to the Shimadzu Reference Library using differential derivative point matching (ATIR-FTIR Polymer and Polymer Additives Database #: 220-93143-07, 2020). Only responses that had a 70% or higher match with the standards database were deemed reliable and used in our analyses [62].

2.4. Statistical Methods

Statistical analyses were performed using R 4.0.3 and RStudio version 4.0.3 [63,64]. MP abundance data had a high presence of zeros; therefore, zero-inflated negative binomial generalized linear models (GLM) were used to determine significant differences in MP density. “MP size” data did not meet the assumptions of normality and were log-transformed to meet that assumption required by a GLM. A Kruskal–Wallis test was conducted to compare the MPs/L at culverts and open outfalls. For the analyses, seasons were grouped meteorologically as: spring (March–May), summer (June–August), fall (September–November), and winter (December–February).

3. Results

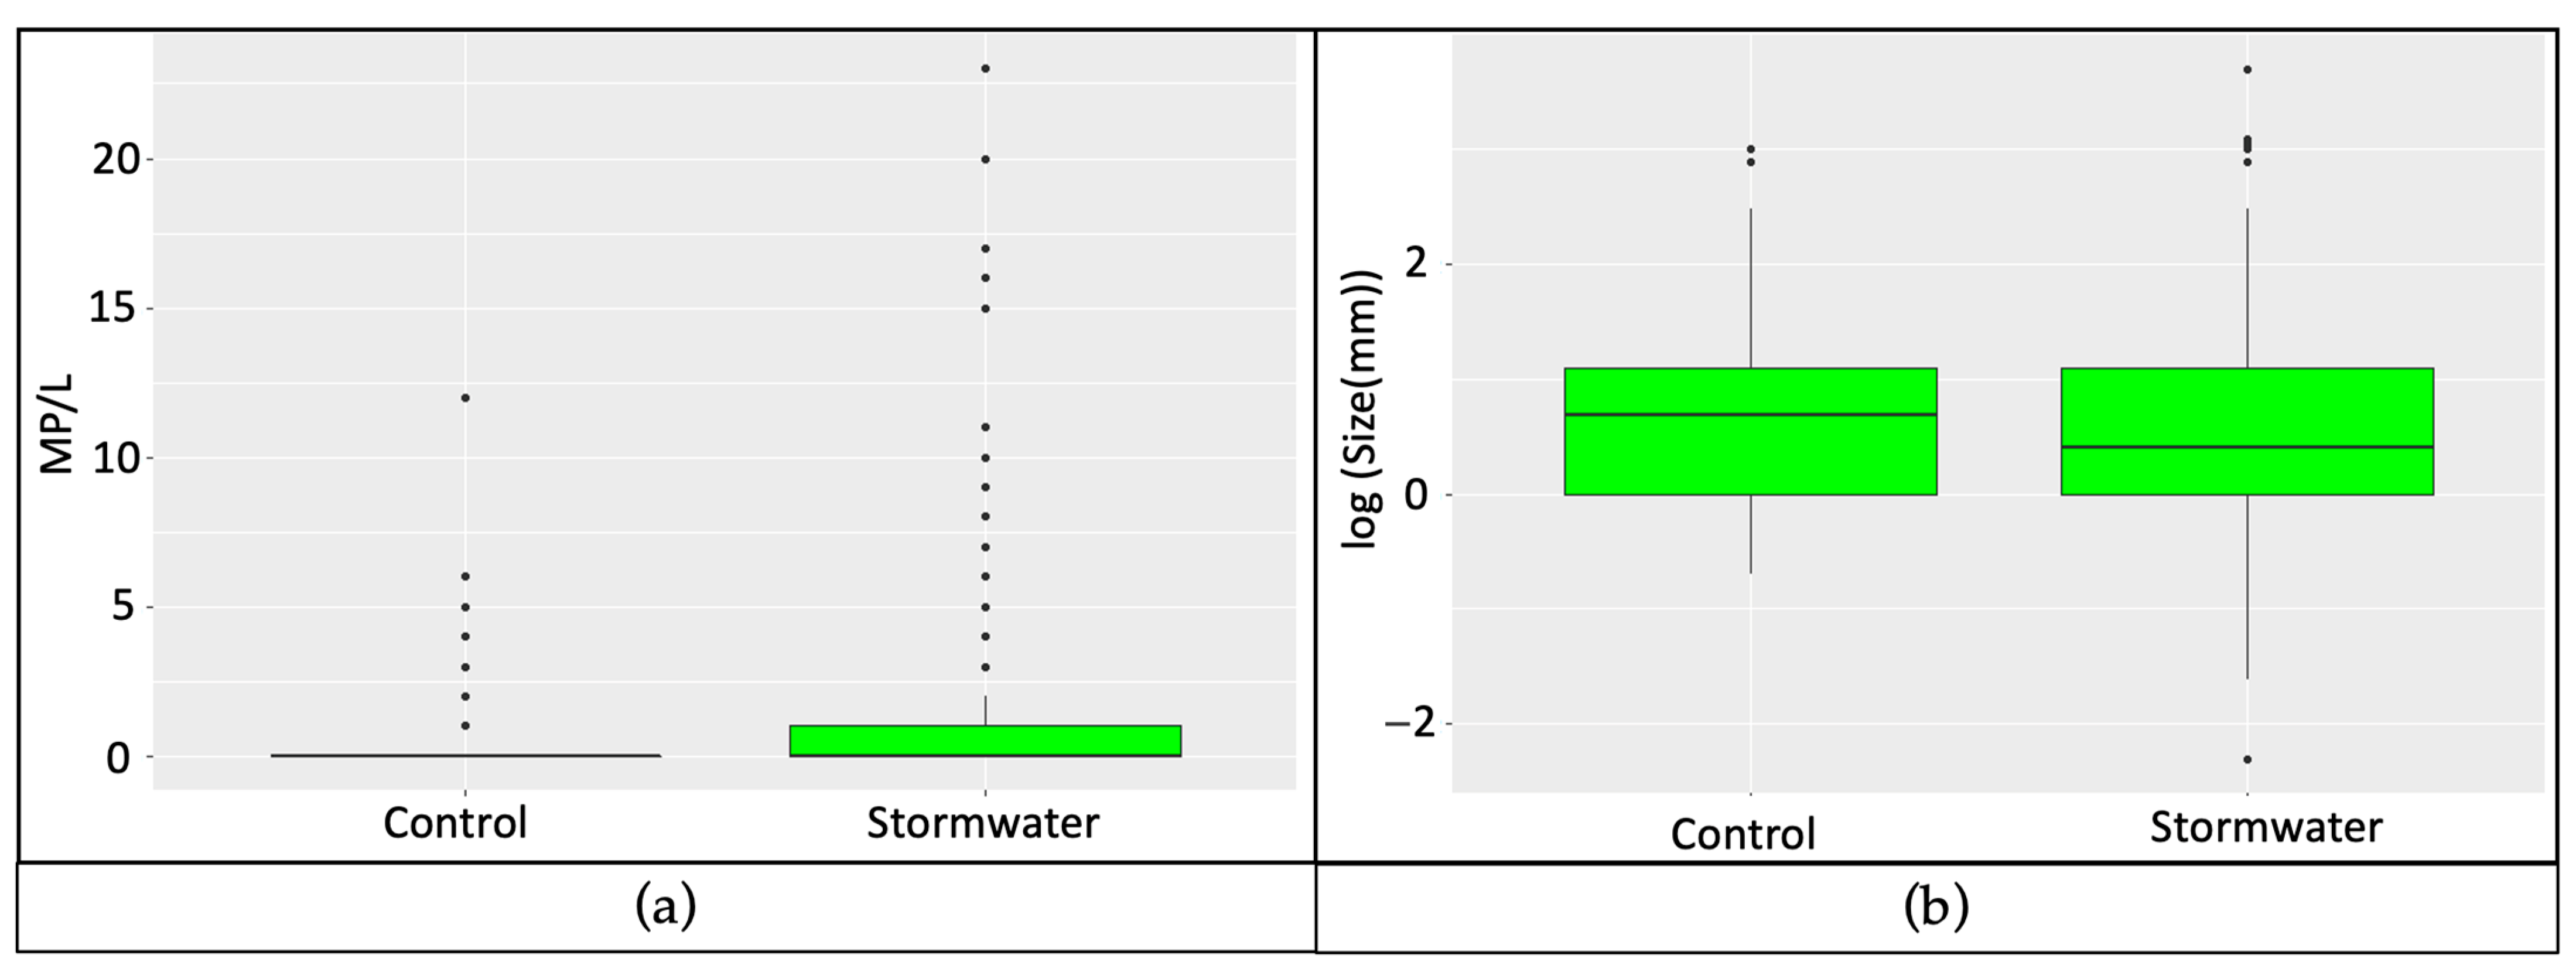
A total of 958 MPs were identified from 1800 L of water. There were more MPs per liter of water (GLM: p = 0.020) found at stormwater outfalls throughout the year when compared to control locations (stormwater: 0.56 ± 1.62; control: 0.04 ± 1.05; mean ± S.D.; Figure 2). The average contamination rate/minute for the blanks was 0.005 ± 0.018 MPs. Each sample took between 1 and 10 min for the microscopic examination.
At the stormwater site (central region, culvert) with the highest number of MPs recorded, the density was 62.84 MP/L in October, while the largest density of MPs in the control sites was 16.86 MP/L in the same month and region.
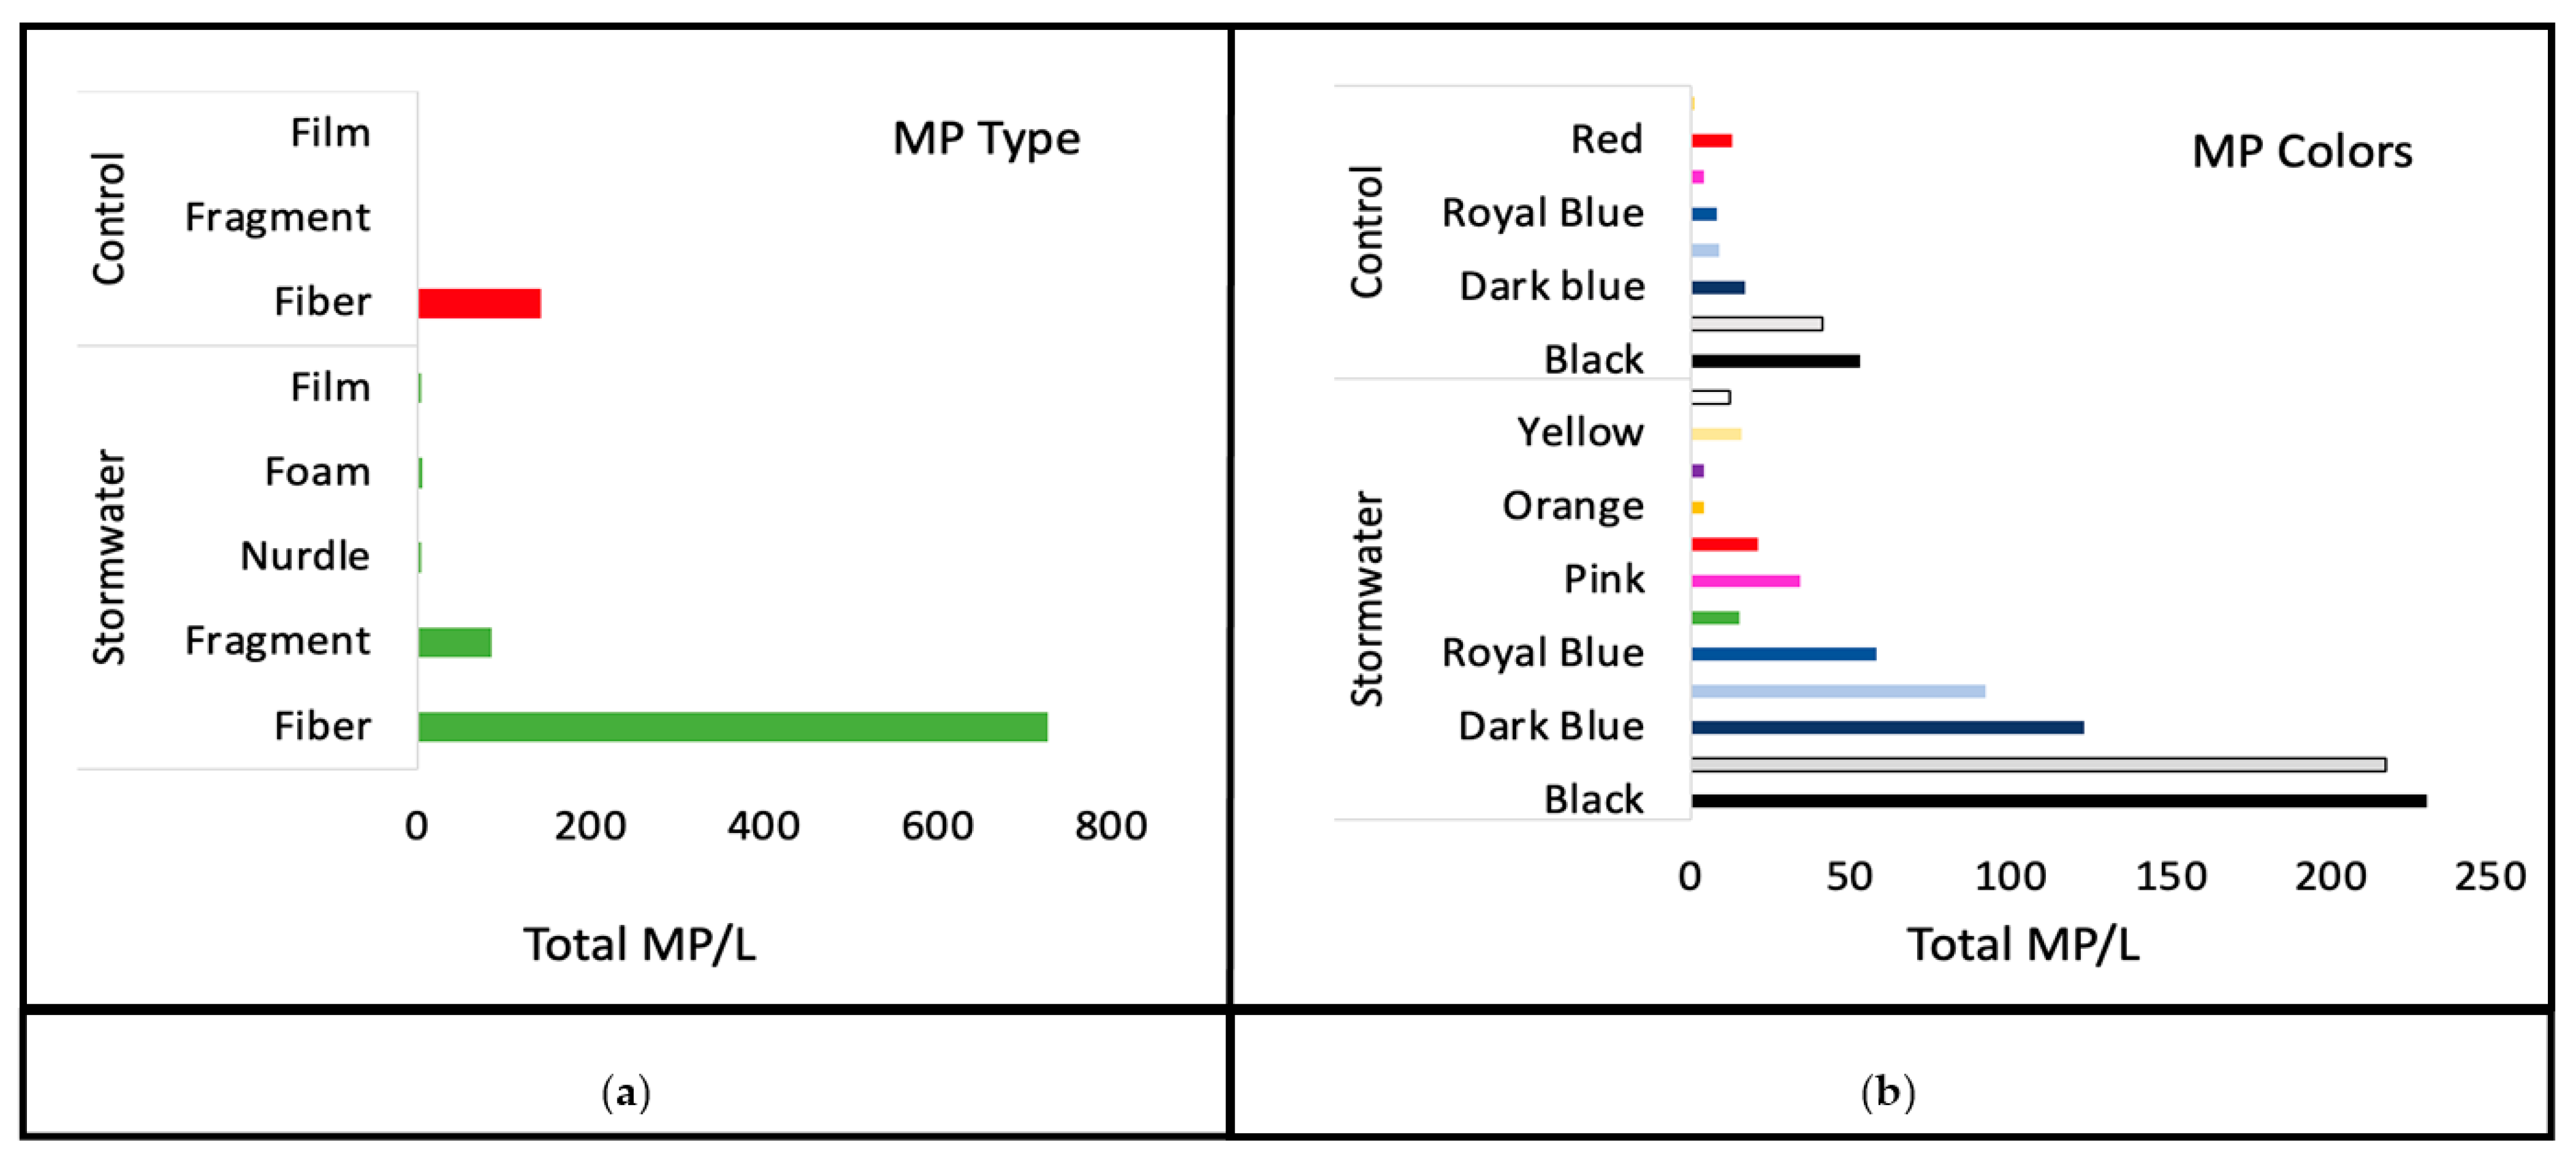
MPs were smaller in stormwater sites (GLM: p = 0.008) with a mean length of 2.72 ± 3.05 mm at the control sites versus 2.33 ± 2.98 mm for the stormwater sites (Figure 2). Microfibers dominated all collections (~89%; Figure 3). Moreover, fibers accounted for ~97% of MPs, fragments ~1%, and films ~1% at the control sites. At the stormwater outfalls, fibers composed ~88% of the total MP particles, followed by fragments (~10%), foam (~0.7%), film (~0.7%), and nurdles (~0.5%). The most common MP colors from the outfalls were black (28%) and clear (26%). Black was also the most abundant MP color from the control sites (36%; Figure 3), and both site types had the same top five MP colors (black, clear, dark blue, light blue, royal blue).
When the two types of outfalls were compared, culverts and open outfalls had similar MP densities (GLM: p = 0.60). There was no difference in MP densities between the two types of stormwater outfalls (Kruskal–Wallis test: p = 0.439).
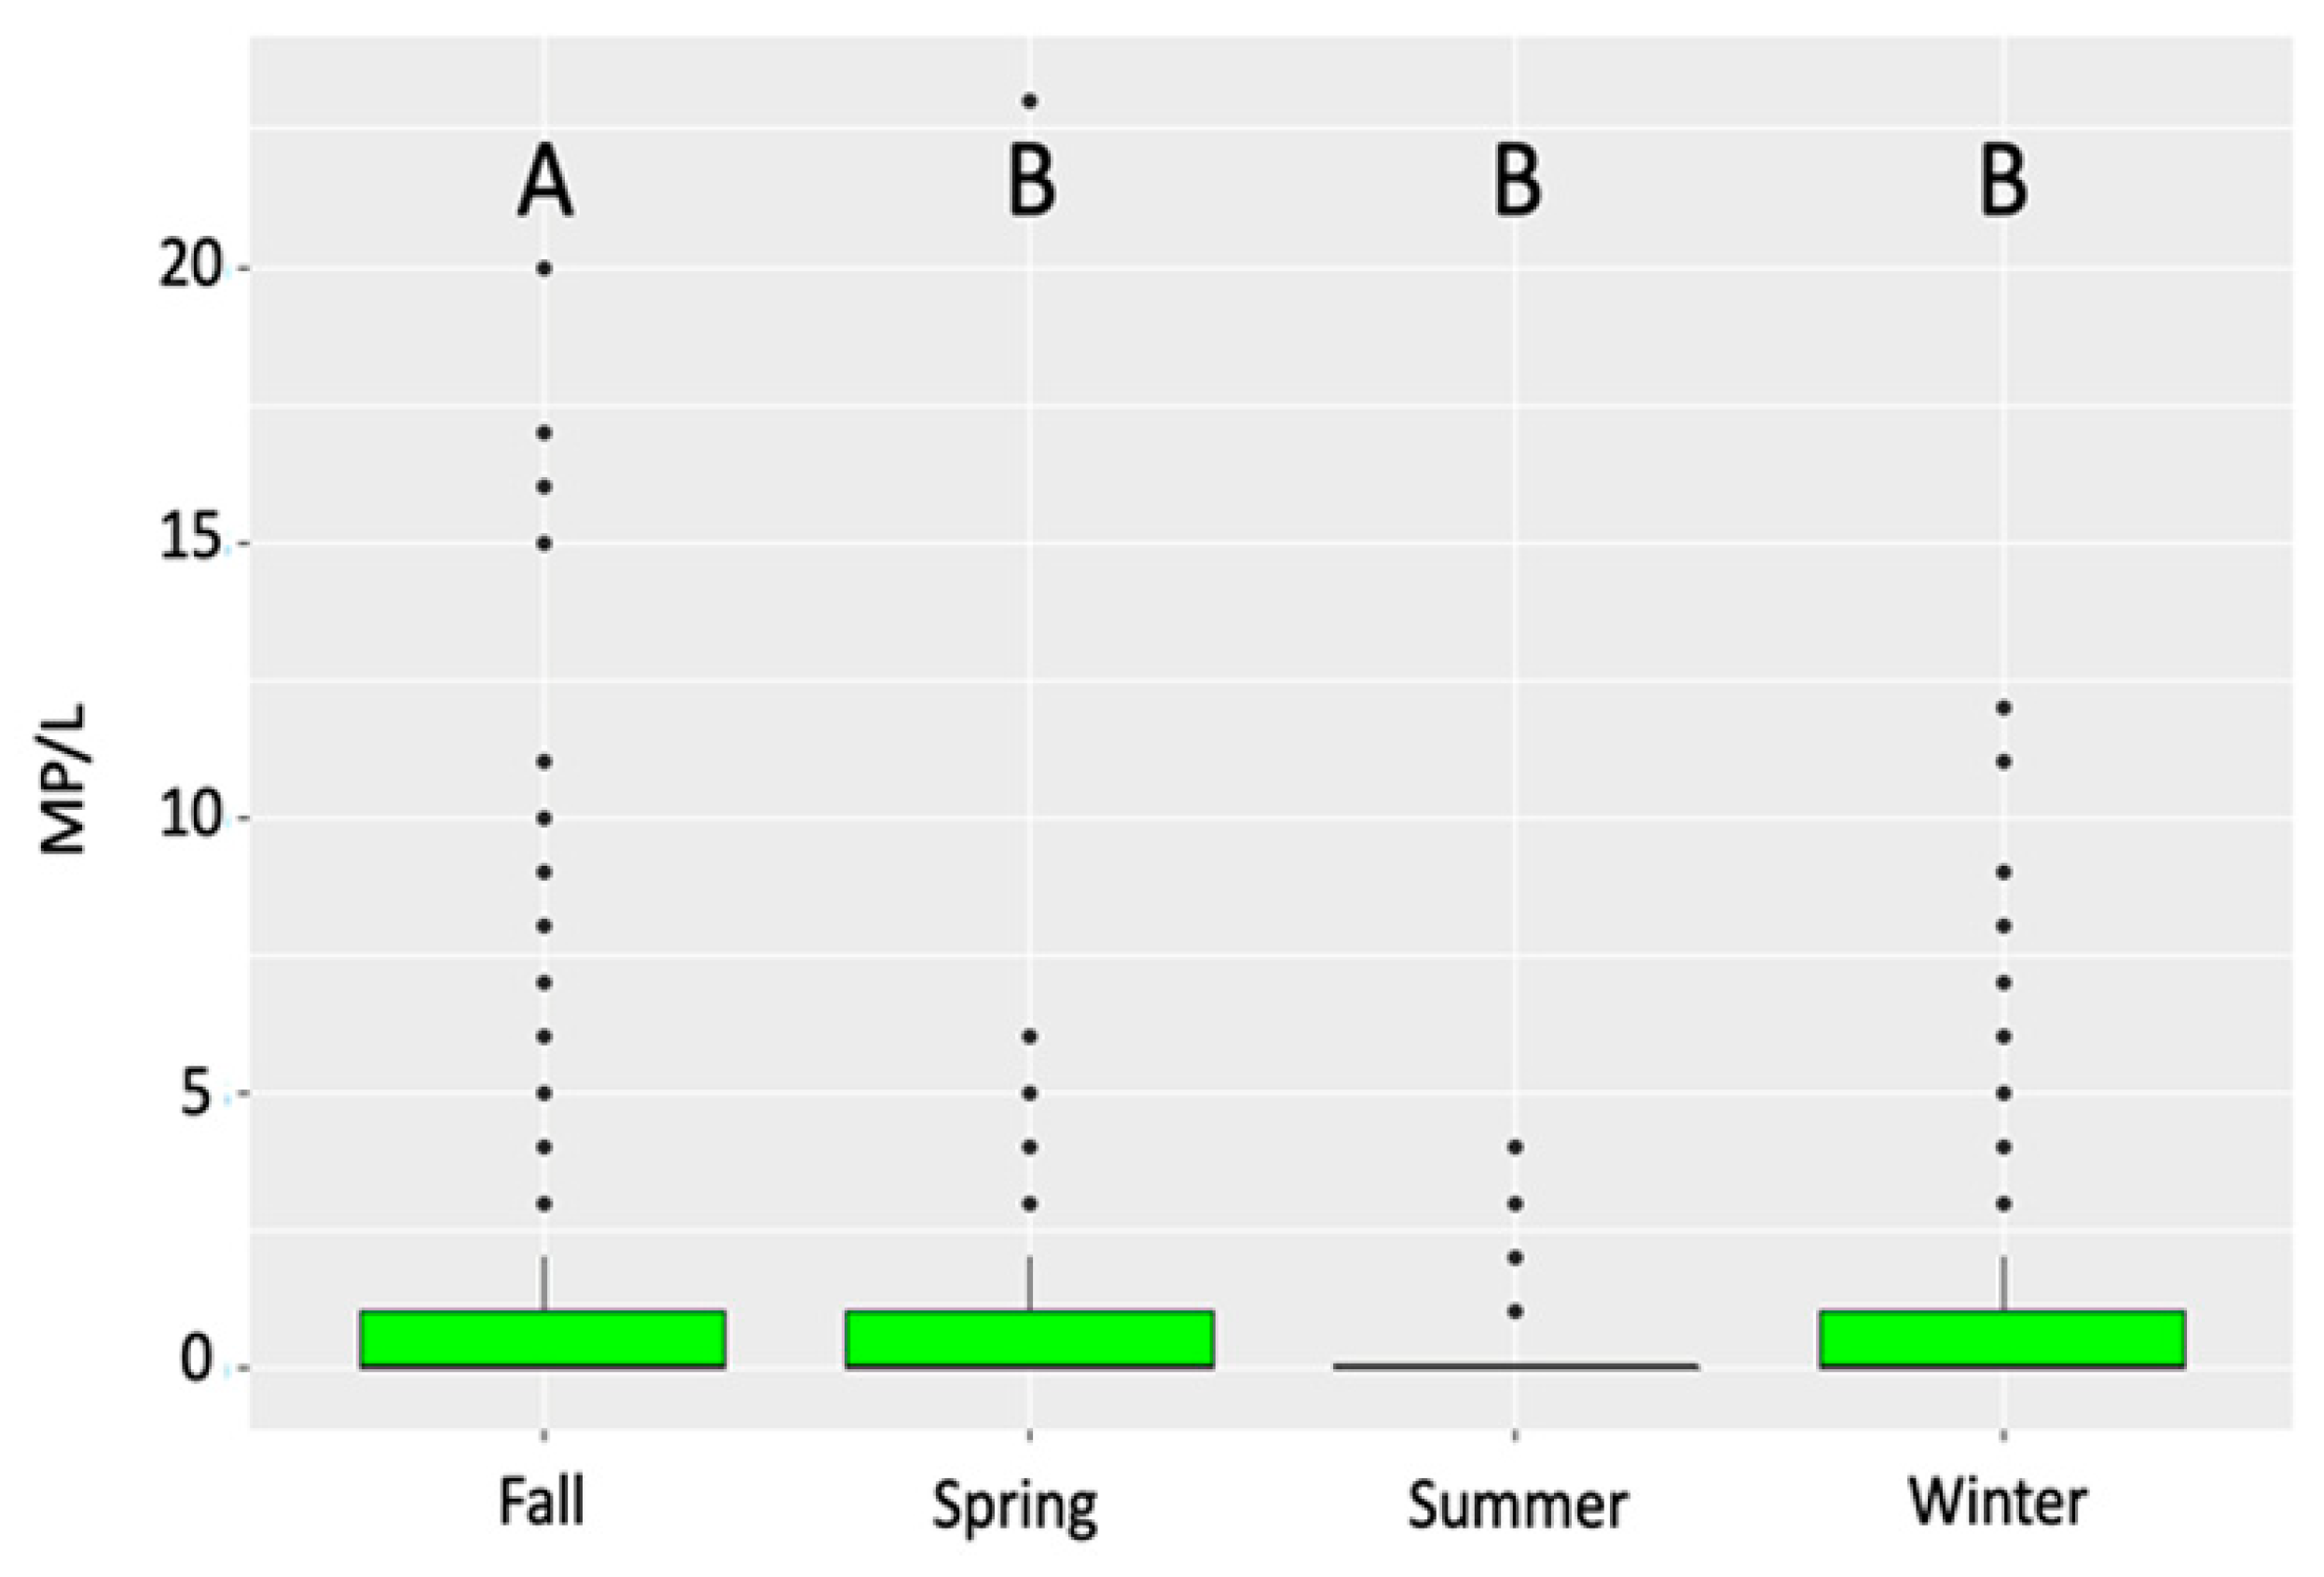
Similar densities of MPs were found in the north and central regions for stormwater outfalls, while the lowest densities were found in the south region (GLM: p < 0.001). The southern stormwater sites and southern control sites did not differ in MP densities. Overall, significantly more MPs were found in October, which contained significantly more MP/L than the next highest month—September (GLM: p = 0.008). With seasons, fall had more MP/L than winter (GLM: p = 0.006), spring (GLM: p < 0.001), and summer (GLM: p < 0.001) (Figure 4).
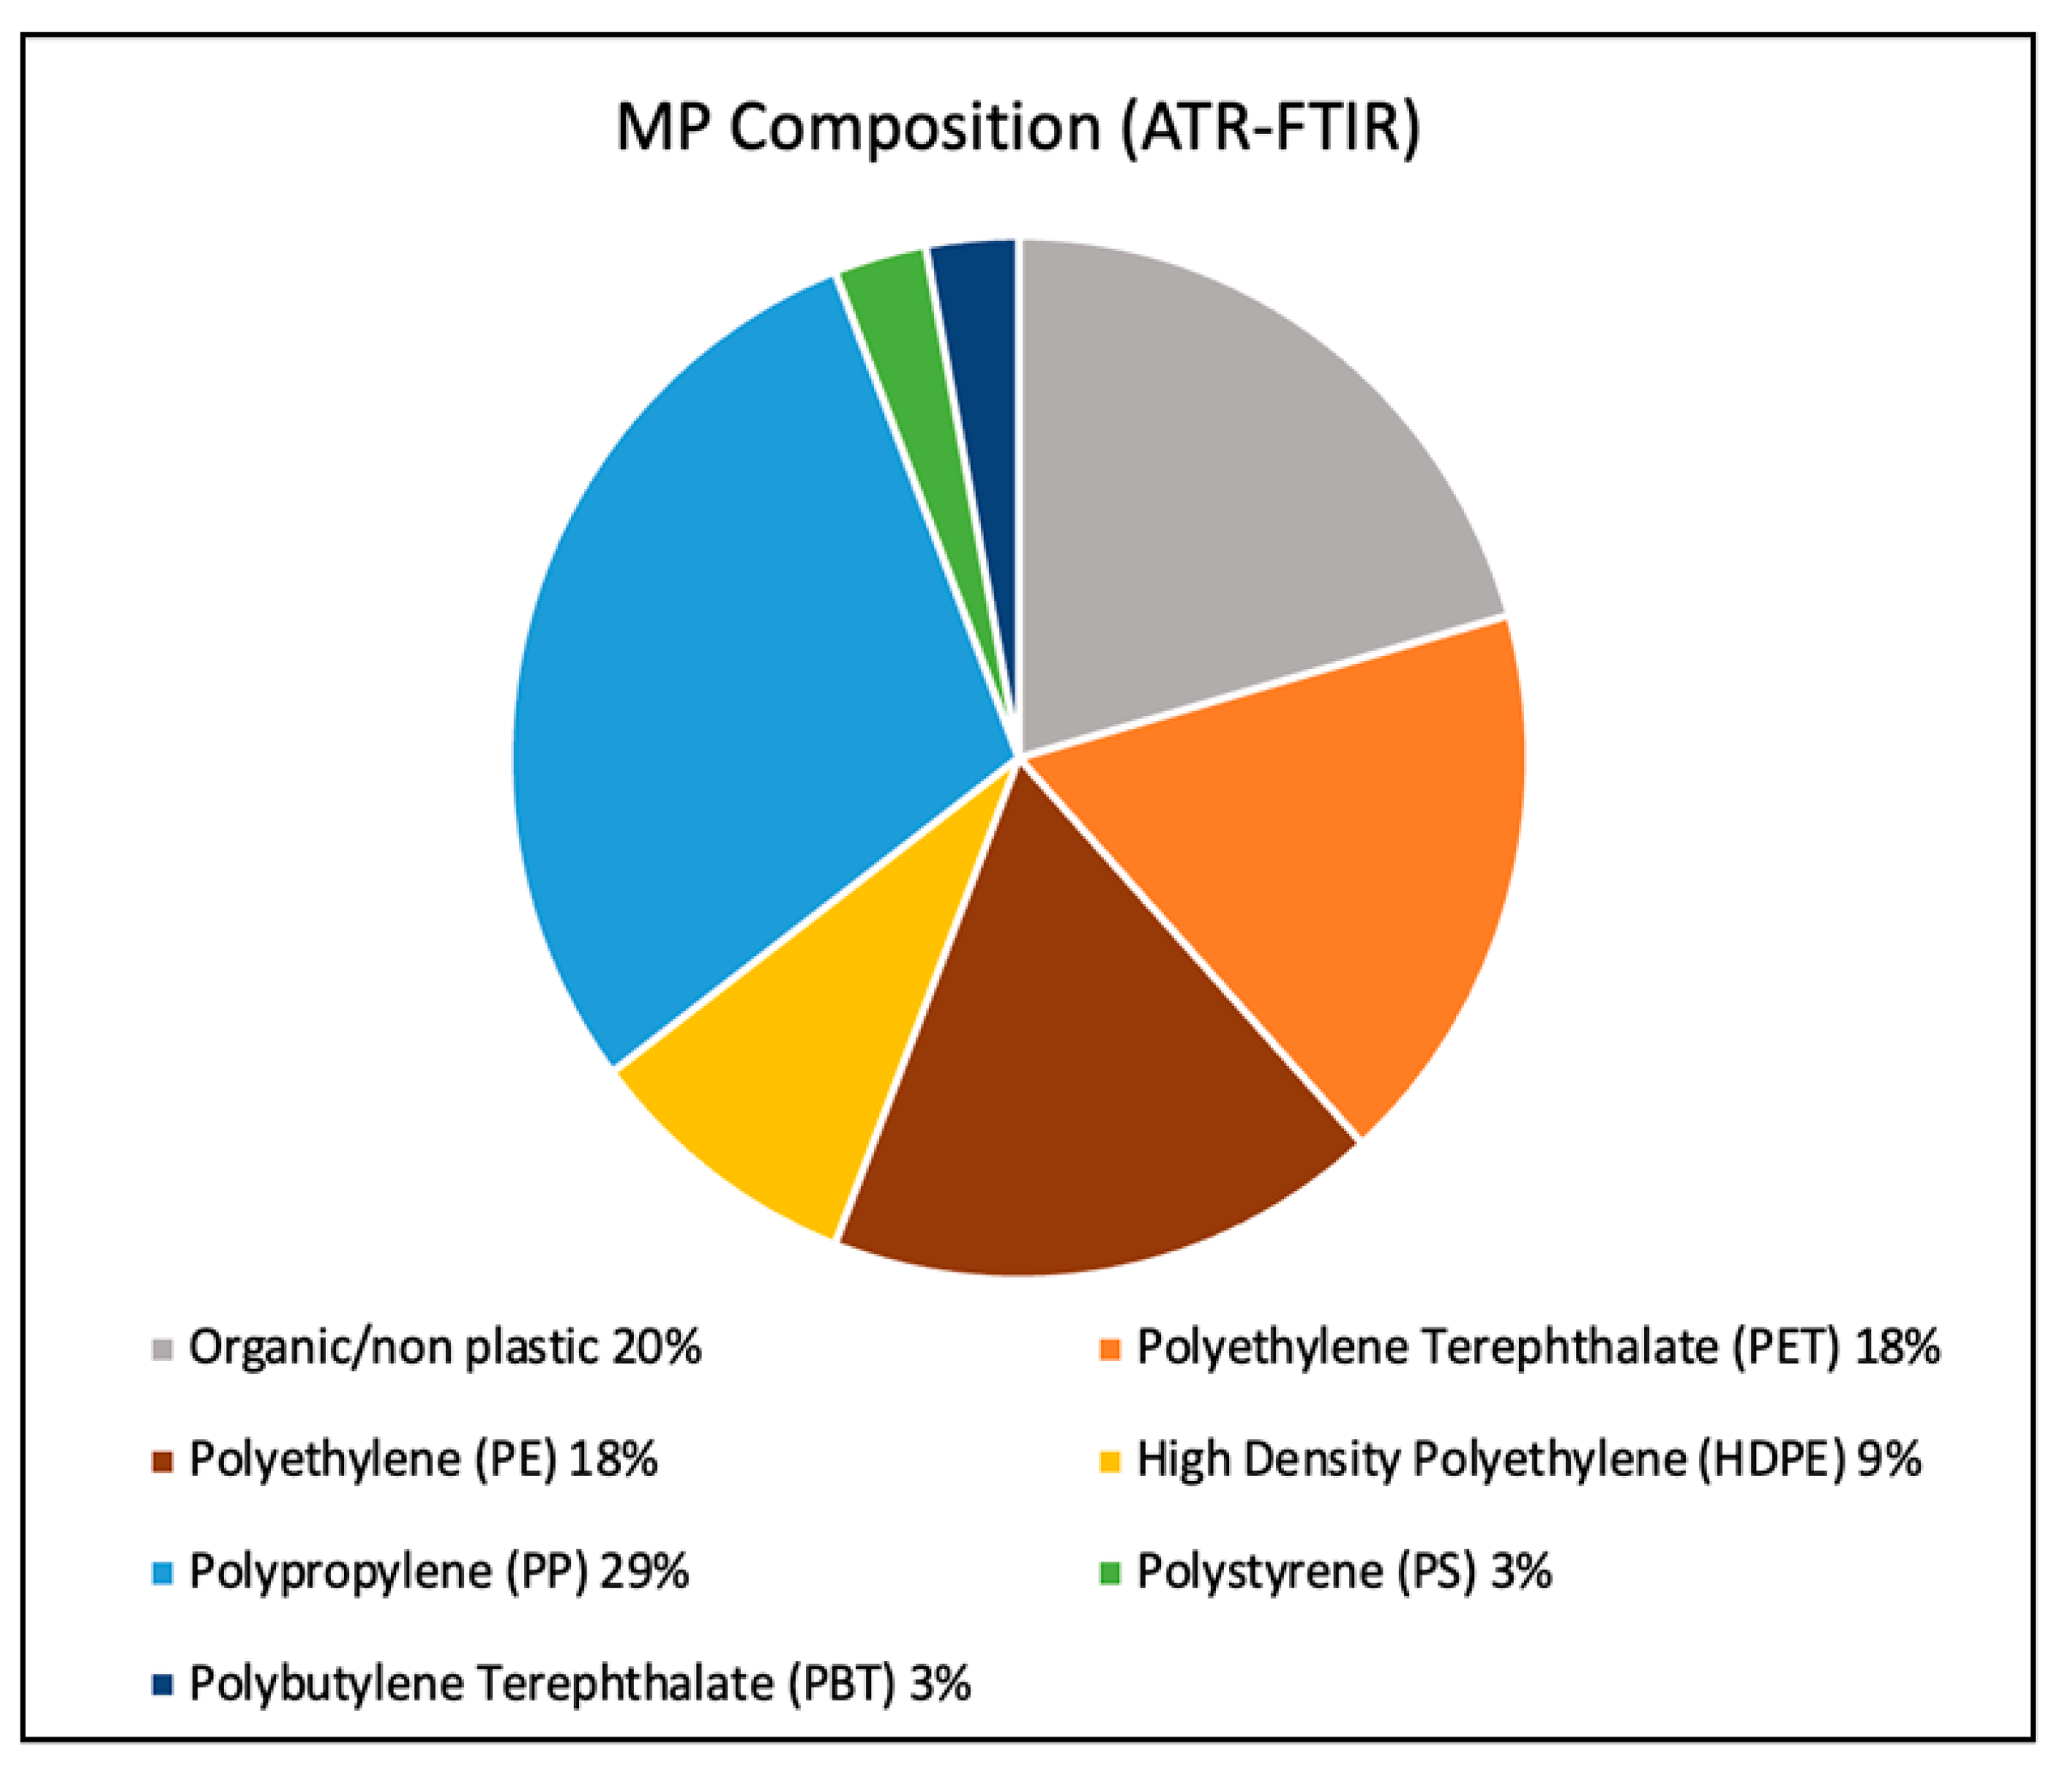
Of the 34 MPs identified using ATR-FTIR (Figure 5), 20% were organic compounds including cellulose and protein groups. Polypropylene (PP) was the most common plastic material (29%) followed by polyethylene (PE; 18%) and polyethylene terephthalate (PET; 18%). PET is commonly referred to as polyester, a material often used in the manufacturing of clothing. We found PP fragments in clear, green, and black colors (n = 5 for each), and clear PE fragments (n = 4). Other non-fibers included three clear high-density polyethylene (HD-PE) fragments and one white polystyrene fragment.
Twenty-seven workshops trained 72 citizen scientists who dedicated 1042 h of their time to this project. At the federal volunteer value of USD 24.04 per hour in 2021, this project thus received USD 250,437 in match from the community. With QA/QC protocols in place to track inaccuracy, we are confident in the validity of the collected data. Of the 72 volunteers, Petri dishes had to be reanalyzed for only one individual (1.4% of total volunteers). This individual consistently misidentified and overinflated MP counts in their observed samples. This error was discovered after QA/QC was performed on the samples. Consequently, all of the samples completed by this volunteer were reanalyzed by members of the science team.

4. Discussion

The Indian River Lagoon (IRL) has already been described as an MP hotspot with MP accumulations reported in the literature from both surface waters (1.5 MP/L) and within the tissues (2.2 MP/individual), feces (0.33 ± 0.15 MP/mg biodeposit weight), and pseudofeces (0.28 ± 0.15 MP/mg biodeposit weight) of the filter-feeding oyster Crassostrea virginica [65]. This is the first study to investigate stormwater as a source that adds MPs to the IRL. From sampling 1800 L of water, a total of 958 MPs (0.53 MP/L) were recorded. Approximately eighty-five percent (n = 813) of the total MPs entered the IRL through stormwater outfalls, 66% (n = 544) via closed culverts, and the remainder through open outfalls. MPs (n = 145) were, however, found at the control sites. The control sites were located adjacent to land, and therefore direct contamination from land-based activities, including roads within meters of the IRL, was likely. Contamination at both stormwater and control sites from airborne MPs was additionally possible [66].
It is interesting that the mean density (0.53 MP/L) was lower than that found by Walters et al. [48] of 1.47 ± 0.09 MP/L. This difference may be the result of the collection locations. Walters et al. [48] visited public parks for many collection sites, while the stormwater outfalls and controls were in more remote areas. Weather conditions may have also impacted the results, especially fall storms where both projects reported the highest MP densities. Major Hurricane Dorian (Category 5) in September 2019 and multiple tropical storms occurred during the study by Walters et al. [48], while Hurricanes Sally (Category 2) in September 2020 and Elsa (Category 1) in July 2021 occurred in Florida during the present study. The month of October had the overall highest number of MPs, followed by September. These months are categorized under the fall season in Florida (September–November). Fall is also known as hurricane season and associated “high water season” in parts of the IRL. Storms and associated winds generally move from east to west across the Atlantic Ocean during this season. Higher water levels increase the movement and distribution of MPs in coastal areas [67], likely through the abrasion of beach sediment and structural materials. Rainfall is, of course, a key variable during the Florida wet season, and it has a major influence on the abundance of MPs and other pollutants transported by stormwater [45]. A study from de Jesus Piñon-Colin et al. [68] found a direct positive correlation between rainfall (mm) and MPs in stormwater. The most MPs are added during the “first flush” [69], or the beginning of a rain event [38,42]. The results from Barrows et al. [70] indicated variable MP abundances and no correlation to rain events and concluded that stormwater was not an MP source in their area. Barrows et al. [70] noted diluted MP discharge from stormwater after a rain event. The reason for MP dilution in their samples was likely because of the first flush event. In the present study, rain events were not noted, and monthly rainfall data had no correlation with MP abundance at the sites.
A review of 11 papers by Shruti et al. [71] found that microfibers account for most of the MPs in stormwater, followed by fragments. These results are consistent with the findings in this study. Fibers likely originate from synthetic clothing fibers, boat lines, or from larger plastic materials. As clothing is worn, washed, and exposed to the elements, MP fibers are shed [72]. Synthetic fibers, including PET, polyamide (nylon), and PP, make up the largest portion of produced clothing fibers, with more than double the market share over natural fibers in 2020 [73]. This study quantified the MP contamination in surface waters, where fibers are more likely to occur due to their small size and buoyancy. Thirty-five percent of MPs that were processed using ATR-FTIR were either PP or PET fibers. Fifty percent of MPs in this study were ≤1.5 mm and 84.5% were ≤3.0 mm. Longer and larger MPs may pose more of a toxicological risk to biota [74], while smaller MPs are easily bioaccumulated and transferred across trophic levels [5,75]. Heavier MPs will sink and accumulate in the substrate [76,77], as will aged MPs after accumulating biofouling [78]. Quantifying the MP abundance in the substrate adjacent to stormwater outfalls would be valuable to obtain a more accurate representation of MP occurrence. For this study, we focused on quantifying the MPs in surface water, as stormwater effluents add new MPs to the water column.
PP and PE are among the most prevalent mass-produced plastic fibers and resins [1]. Through ATR-FTIR processing, we found PP (29%) was the most common MP found. These findings are similar to a review from Gago et al. [79], where PP and PE fibers were found to be the most common MP type in surface waters. Liu et al. [80] also found PP was the most common MP type in sediment and water samples from stormwater retention ponds, although most of the MPs were fragments. PE (18% of tested samples) was the second most abundant MP type found in this study and accounted for the largest tonnage of produced plastic materials [1]. PE, like PP, is used to make many everyday products including food packaging, household items, toys, and construction materials. Mak et al. [81] found a majority of MPs in stormwater and wastewater in Hong Kong, China, were PE (32.9%) followed by PP (20.3%). These results support the proposition that PP and PE are two of the most ubiquitous MP materials being circulated in marine environments. We found that all (n = 3) of the HD-PE samples identified were clear fragments, consistent with the sampling bottle material, posing a concern for potential contamination during collection and storage. For future studies, using glass bottles or alternative non-plastic materials may reduce potential MP contamination in the samples.
Both the stormwater outfalls and control sites had black fibers as the most abundant MP color and type. Black fragments may originate from car tire wear that is washed into storm drains during rain events [82,83,84]. However, more FTIR processing is necessary to determine the source of the black MPs in the samples. Tires are made up of a blend of materials and undergo changes in chemical composition when exposed to weathering and therefore can be difficult to determine [85]. Grbic et al. [41] used chemical identification to confirm 22% of MPs in stormwater studied in Lake Ontario were derived from tire/road wear. Further, the authors found fibers dominated in wastewater effluent, while rubbery tire materials were more common in stormwater. We found a total of 283 black MPs. Of those, n = 15 were fragments, and the remainder were fibers. There were no black fragments at the control sites. It is difficult to determine if these black MPs originated from tire wear since most of the MPs were fibers.
Unlike most wastewater infrastructure, culverts do not pass through a natural buffer, and directly discharge polluted water into aquatic environments. Culverts are not considered a best management practice (BMP) and do not attempt to improve water quality. Open outfalls are characterized by a stream that leads into the estuary, thus providing the opportunity for buffering or atmospheric MP depositions. There are now technologies being employed to prevent stormwater from carrying pollutants to marine environments. Retention ponds and stormwater wetlands are man-made depressions constructed to hold stormwater runoff, improve water quality, and avoid flooding. The hydraulic residence time facilitates absorption and allows natural processes including bacterial degradation and settling to break down the pollutants before they are carried downstream [86,87]. Retention ponds also create aquatic habitats for important species and increase connectivity, offsetting some of the impacts of urbanization [88,89]. These ponds may also act as a sink for MPs, nutrients, and pollutants [77,90,91]. Nonetheless, stormwater retention ponds and wetlands are, respectively, 85–99% and 28–55% effective at removing MPs from stormwater outflows [92]. Stormwater retention ponds provide multiple ecosystem services and should be considered for implementation in urban areas affected by polluted stormwater runoff.
There are differences in residence times in each section of the IRL due to the unique and varying geography. The tributaries that add freshwater into the IRL are considered a source of MPs, which circulate throughout the system before being flushed out by inlets [65]. The IRL’s circulation patterns and flushing have been impacted by the construction of large structures, including bridges and man-made islands [93]. The northern section of the IRL, including Mosquito Lagoon and Banana River, are considered “negative estuaries”, and experience stagnant water, limited connectivity, and long pollution residence times [93,94]. Water movement models of the northern IRL estimate renewal times of >230 days, compared to ≤7 days throughout the central and southern IRL [95]. Our results showed more MP/L being added at the north and central control and stormwater sites compared to the south (GLM: all p < 0.0001). Long retention times and continuous MP additions contribute to the northern IRL forming an MP hotspot. Mosquito Lagoon and the northern IRL do not have freshwater tributary inputs that would encourage water circulation or contribute to MP accumulation, suggesting stormwater could be a main source of MP pollutants in this section. Other studies found the southern IRL to be a hotspot with the highest abundance of MPs recorded [48,65], which was likely attributed to the major St. Lucie estuary inputs. Regional differences in MP abundance could have been due to weather patterns shortly before collection, and local land-based activities. MP loads tend to be highly variable across spatial and temporal scales.
MPs can be difficult for volunteers to positively identify. Therefore, sampling protocols, QA/QC, and oversight are essential. When conducted correctly, citizen science studies can provide valuable data with accurate results. Velde et al. [96] collected survey data from children and adult volunteers that were equivalent in quality to data collected by researchers. However, the study from Velde et al. [96] had citizen scientists identifying larger plastic debris. In our study, the citizen scientists that assisted were trained in MP identification and supervised, and sample data were checked, corrected as necessary, and validated by supervising researchers. In this study, we encountered few errors from our citizen scientists, except from one individual among the 72 participants, that required a complete reanalysis of the MPs in Petri dishes.
To reduce the chance of false identification of MPs, most citizen science studies [70,97,98,99] use volunteers to collect samples before sending the samples to a laboratory for researchers to process and identify MPs. Other studies did use citizen scientists to process samples and identify MPs, but they simplified the identification methods. Nel et al. [100] used Nile red staining in the MP samples to lower the chances of falsely identifying MPs in citizen scientist-led identification. A study by Hidalgo-Ruz and Thiel [101] trained school children (ages 8–16) from Chile to collect and identify macroplastics and MPs. MP samples were then sent to a laboratory to be reanalyzed. Hidalgo-Ruz and Thiel [101] adopted a simplified approach where the students would only quantify MPs > 1 mm. However, even with this simplification, students had low accuracy in identifying true MPs. The authors [101] recommended making an illustrative guide for identifying the MPs available, which we also found helpful in the present study. While their data were unreliable, the participants noted positive social and educational benefits from the experience [101]. While using citizen scientists contributes essential data, it also introduces the potential for challenges and inaccuracies that demand vigilant oversight during data review. Jones et al. [102] had highly accurate data (93%) obtained from citizen scientist students (ages: 15+) who collected and identified MPs on beaches in Ecuador. Studies that utilized citizen scientists for both collecting and processing the samples, as in ours, checked and corrected data. Therefore, citizen science projects with trained volunteers and QA/QC protocols yield reliable results. Through citizen science projects, the public becomes aware of current environmental issues, increasing their scientific literacy, and making them more likely to advocate for positive environmental change in their communities [53]. Additionally, utilizing citizen scientists can be beneficial to expanding the scale and geographic reach of research which would otherwise be financially unattainable.

5. Conclusions

Using citizen scientist volunteers, we were able to study sources of MP pollution across the entirety of the IRL and process 1800 L of water. Limited flushing and long residence times likely contribute to the IRL being an MP hotspot. Our results describe a persistent MP addition to the IRL through stormwater outfalls. Current MP reduction methods do not efficiently remove MPs [103]. This study confirms stormwater outfalls deposit plastic pollution directly into marine environments, and MP mitigation strategies focused on stormwater and water filtration should be a priority. Future research comparing the MP types in surface waters and surrounding sediment from stormwater outfalls could provide a more complete picture of stormwater deposits.

Author Contributions

Conceptualization, L.J.W., J.W., E.D. and L.H.S.; methodology, L.J.W.; software, C.A.C.; validation, S.J.B.; formal analysis, C.A.C. and S.J.B.; investigation, S.J.B., J.W., T.S.-T., E.D., L.H.S., D.W.F. and L.Z.; resources, L.J.W., J.W., E.D., L.H.S. and L.Z.; data curation, S.J.B., T.S.-T. and E.D.; writing—original draft preparation, S.J.B.; writing—review and editing, L.J.W., J.W., T.S.-T., E.D., C.A.C., L.H.S., D.W.F. and L.Z.; visualization, S.J.B.; supervision, L.J.W., J.W. and E.D.; project administration, L.J.W. and S.J.B.; funding acquisition, L.J.W., J.W., E.D. and L.H.S. All authors have read and agreed to the published version of the manuscript.

Funding

This work was funded by the IRL National Estuary Program [IRL 2020-16]. We thank the Marine Discovery Center, the University of Central Florida, and the Florida DEP Aquatic Preserves Program for hosting the north, middle, and south collection teams, respectively. We are grateful to all our citizen science volunteers, especially P. Sacks, T. Clark, E. Surmont, K. Fusco, J. Hassebrock, M. Holmquist, R. Beebe, W. Arndt, M. Racco, E. Loomis, and R. Moscatello.

Data Availability Statement

Data will be publicly available on the UCF STARS website upon publication.

Conflicts of Interest

The authors declare that they have no known competing financial interests or personal relationships that could have appeared to influence the work reported in this paper.

References

  1. Geyer, R.; Jambeck, J.; Law, K.L. Production, Use, and Fate of All Plastics Ever Made. Sci. Adv. 2017, 3, e1700782. [Google Scholar] [CrossRef] [PubMed]
  2. Law, K.L.; Starr, N.; Siegler, T.R.; Jambeck, J.; Mallos, N.; Leonard, G.B. The United States’ Contribution of Plastic Waste to Land and Ocean. Sci. Adv. 2020, 6, eabd0288. [Google Scholar] [CrossRef] [PubMed]
  3. Santos, R.A.S.; Machovsky-Capuska, G.E.; Andrades, R. Plastic Ingestion as an Evolutionary Trap: Toward a Holistic Understanding. Science 2021, 373, 56–60. [Google Scholar] [CrossRef] [PubMed]
  4. Goswami, P.; Vinithkumar, N.V.; Dharani, G. First Evidence of Microplastics Bioaccumulation by Marine Organisms in the Port Blair Bay, Andaman Islands. Mar. Pollut. Bull. 2020, 155, 111163. [Google Scholar] [CrossRef] [PubMed]
  5. Li, Z.-L.; Chao, M.; He, X.; Lan, X.; Tian, C.; Feng, C.; Shen, Z. Microplastic Bioaccumulation in Estuary-Caught Fishery Resource. Environ. Pollut. 2022, 306, 119392. [Google Scholar] [CrossRef] [PubMed]
  6. Wright, S.L.; Thompson, R.F.; Galloway, T.S. The Physical Impacts of Microplastics on Marine Organisms: A Review. Environ. Pollut. 2013, 178, 483–492. [Google Scholar] [CrossRef]
  7. Craig, C.; Fox, D.A.; Zhai, L.; Walters, L.J. In-Situ Microplastic Egestion Efficiency of the Eastern Oyster Crassostrea Virginica. Mar. Pollut. Bull. 2022, 178, 113653. [Google Scholar] [CrossRef]
  8. Herzke, D.; Anker-Nilssen, T.; Nøst, T.H.; Götsch, A.; Christensen-Dalsgaard, S.; Langset, M.; Fangel, K.; Koelmans, A.A. Negligible Impact of Ingested Microplastics on Tissue Concentrations of Persistent Organic Pollutants in Northern Fulmars off Coastal Norway. Environ. Sci. Technol. 2016, 50, 1924–1933. [Google Scholar] [CrossRef]
  9. Terepocki, A.K.; Brush, A.; Kleine, L.U.; Shugart, G.W.; Hodum, P.J. Size and Dynamics of Microplastic in Gastrointestinal Tracts of Northern Fulmars (Fulmarus Glacialis) and Sooty Shearwaters (Ardenna grisea). Mar. Pollut. Bull. 2017, 116, 143–150. [Google Scholar] [CrossRef]
  10. Carlin, J.; Craig, C.; Little, S.; Donnelly, M.; Fox, D.A.; Zhai, L.; Walters, L.J. Microplastic Accumulation in the Gastrointestinal Tracts in Birds of Prey in Central Florida, USA. Environ. Pollut. 2020, 264, 114633. [Google Scholar] [CrossRef] [PubMed]
  11. Hu, L.; Hinton, D.E.; Shi, H. Microplastics in Small Waterbodies and Tadpoles from Yangtze River Delta, China. Environ. Sci. Technol. 2018, 52, 8885–8893. [Google Scholar] [CrossRef] [PubMed]
  12. Li, J.; Qu, X.; Su, L.; Zhang, W.; Yang, D.; Kolandhasamy, P.; Li, D.; Shi, H. Microplastics in Mussels along the Coastal Waters of China. Environ. Pollut. 2016, 214, 177–184. [Google Scholar] [CrossRef]
  13. Mathalon, A.; Hill, P.W. Microplastic Fibers in the Intertidal Ecosystem Surrounding Halifax Harbor, Nova Scotia. Mar. Pollut. Bull. 2014, 81, 69–79. [Google Scholar] [CrossRef] [PubMed]
  14. Moore, R.; Loseto, L.L.; Noel, M.; Etemadifar, A.; Brewster, J.D.; MacPhee, S.; Bendell, L.; Ross, P.N. Microplastics in Beluga Whales (Delphinapterus leucas) from the Eastern Beaufort Sea. Mar. Pollut. Bull. 2020, 150, 110723. [Google Scholar] [CrossRef]
  15. Lusher, A.; Hernandez-Milian, G.; O’Brien, J.; Berrow, S.; O’Connor, I.; Officer, R. Microplastic and Macroplastic Ingestion by a Deep Diving, Oceanic Cetacean: The True’s Beaked Whale Mesoplodon Mirus. Environ. Pollut. 2015, 199, 185–191. [Google Scholar] [CrossRef] [PubMed]
  16. Duncan, E.; Broderick, A.C.; Fuller, W.A.; Galloway, T.S.; Godfrey, M.H.; Hamann, M.T.; Limpus, C.J.; Lindeque, P.K.; Mayes, A.R.; Omeyer, L.C.M.; et al. Microplastic Ingestion Ubiquitous in Marine Turtles. Glob. Change Biol. 2018, 25, 744–752. [Google Scholar] [CrossRef]
  17. Caron, A.G.M.; Thomas, C.R.; Berry, K.L.E.; Motti, C.A.; Ariel, E.; Brodie, J. Ingestion of Microplastic Debris by Green Sea Turtles (Chelonia mydas) in the Great Barrier Reef: Validation of a Sequential Extraction Protocol. Mar. Pollut. Bull. 2018, 127, 743–751. [Google Scholar] [CrossRef]
  18. Park, T.; Kim, M.-K.; Lee, S.H.; Lee, Y.H.; Kim, M.; Song, H.Y.; Park, J.; Zoh, K.-D. Occurrence and Characteristics of Microplastics in Fish of the Han River, South Korea: Factors Affecting Microplastic Abundance in Fish. Environ. Res. 2022, 206, 112647. [Google Scholar] [CrossRef]
  19. Bessa, F.; Barría, P.; Neto, J.A.; Frias, J.; Henriques, B.; Sobral, P.; Marques, J.C. Occurrence of Microplastics in Commercial Fish from a Natural Estuarine Environment. Mar. Pollut. Bull. 2018, 128, 575–584. [Google Scholar] [CrossRef]
  20. Murphy, F.; Russell, M.; Ewins, C.; Quinn, B. The Uptake of Macroplastic & Microplastic by Demersal & Pelagic Fish in the Northeast Atlantic around Scotland. Mar. Pollut. Bull. 2017, 122, 353–359. [Google Scholar] [CrossRef]
  21. Romeo, T.; Pietro, B.; Pedà, C.; Consoli, P.; Andaloro, F.; Fossi, M.C. First Evidence of Presence of Plastic Debris in Stomach of Large Pelagic Fish in the Mediterranean Sea. Mar. Pollut. Bull. 2015, 95, 358–361. [Google Scholar] [CrossRef]
  22. Neves, D.; Sobral, P.; Ferreira, J.; Pereira, T. Ingestion of Microplastics by Commercial Fish off the Portuguese Coast. Mar. Pollut. Bull. 2015, 101, 119–126. [Google Scholar] [CrossRef]
  23. Bai, Z.; Wang, N.; Wang, M. Effects of Microplastics on Marine Copepods. Ecotoxicol. Environ. Saf. 2021, 217, 112243. [Google Scholar] [CrossRef]
  24. Desforges, J.-P.; Galbraith, M.; Ross, P.S. Ingestion of Microplastics by Zooplankton in the Northeast Pacific Ocean. Arch. Environ. Contam. Toxicol. 2015, 69, 320–330. [Google Scholar] [CrossRef]
  25. De Sa, L.C.; Oliveira, M.; Ribeiro, F.; Rocha, T.L.; Bishop, K. Studies of the Effects of Microplastics on Aquatic Organisms: What Do We Know and Where Should We Focus Our Efforts in the Future? Sci. Total Environ. 2018, 645, 1029–1039. [Google Scholar] [CrossRef]
  26. Kurchaba, N.; Cassone, B.J.; Northam, C.; Ardelli, B.F.; Lemoine, C. Effects of MP Polyethylene Microparticles on Microbiome and Inflammatory Response of Larval Zebrafish. Toxics 2020, 8, 55. [Google Scholar] [CrossRef]
  27. Pedà, C.; Caccamo, L.; Fossi, M.C.; Gai, F.; Andaloro, F.; Genovese, L.; Perdichizzi, A.; Romeo, T.; Maricchiolo, G. Intestinal Alterations in European Sea Bass Dicentrarchus Labrax (Linnaeus, 1758) Exposed to Microplastics: Preliminary Results. Environ. Pollut. 2016, 212, 251–256. [Google Scholar] [CrossRef]
  28. Huang, J.-N.; Zhang, Y.; Xu, L.; He, K.; Wen, B.; Yang, P.-W.; Ding, J.; Li, J.; Ma, H.; Gao, J.-Z.; et al. Microplastics: A Tissue-Specific Threat to Microbial Community and Biomarkers of Discus Fish (Symphysodon aequifasciatus). J. Hazard. Mater. 2021, 424, 127751. [Google Scholar] [CrossRef]
  29. Derraik, J.G.B. The Pollution of the Marine Environment by Plastic Debris: A Review. Mar. Pollut. Bull. 2002, 44, 842–852. [Google Scholar] [CrossRef]
  30. Weixiang, L.; Li, X.; Tong, J.; Xiong, W.; Zhu, Z.; Gao, X.; Li, S.; Jia, M.; Yang, Z.; Liang, J. Effects of Environmental and Anthropogenic Factors on the Distribution and Abundance of Microplastics in Freshwater Ecosystems. Sci. Total Environ. 2023, 856, 159030. [Google Scholar]
  31. Murphy, F.; Ewins, C.; Carbonnier, F.; Quinn, B. Wastewater Treatment Works (WwTW) as a Source of Microplastics in the Aquatic Environment. Environ. Sci. Technol. 2016, 50, 5800–5808. [Google Scholar] [CrossRef]
  32. Long, Z.; Pan, Z.; Wang, W.; Ren, J.; Yu, X.; Lin, L.; Lin, H.; Chen, H.; Jin, X. Microplastic Abundance, Characteristics, and Removal in Wastewater Treatment Plants in a Coastal City of China. Water Res. 2019, 155, 255–265. [Google Scholar] [CrossRef] [PubMed]
  33. McCormick, A.R.; Hoellein, T.J.; Mason, S.A.; Schluep, J.; Kelly, J.M. Microplastic Is an Abundant and Distinct Microbial Habitat in an Urban River. Environ. Sci. Technol. 2014, 48, 11863–11871. [Google Scholar] [CrossRef] [PubMed]
  34. Cheung, P.K.; Fok, L. Characterisation of Plastic Microbeads in Facial Scrubs and Their Estimated Emissions in Mainland China. Water Res. 2017, 122, 53–61. [Google Scholar] [CrossRef] [PubMed]
  35. Mason, S.A.; Garneau, D.; Sutton, R.; Chu, Y.; Ehmann, K.; Barnes, J.W.; Fink, P.; Papazissimos, D.; Rogers, D.L. Microplastic Pollution Is Widely Detected in US Municipal Wastewater Treatment Plant Effluent. Environ. Pollut. 2016, 218, 1045–1054. [Google Scholar] [CrossRef]
  36. Ziajahromi, S.; Neale, P.A.; Rintoul, L.; Kookana, R.S. Wastewater Treatment Plants as a Pathway for Microplastics: Development of a New Approach to Sample Wastewater-Based Microplastics. Water Res. 2017, 112, 93–99. [Google Scholar] [CrossRef] [PubMed]
  37. Carr, S.; Liu, J.; Tesoro, A.G. Transport and Fate of Microplastic Particles in Wastewater Treatment Plants. Water Res. 2016, 91, 174–182. [Google Scholar] [CrossRef]
  38. Do, T.; Park, Y.; Lim, B.; Kim, S.; Chae, M.-Y.; Chun, C.-H. Effect of the First-Flush Phenomenon on the Quantification of Microplastics in Rainwater. Mar. Pollut. Bull. 2023, 187, 114559. [Google Scholar] [CrossRef] [PubMed]
  39. Brooks, J.M.; Stewart, C.J.; Haberstroh, C.; Arias, M.E. Characteristics and Fate of Plastic Pollution in Urban Stormwater Ponds. Environ. Pollut. 2023, 320, 121052. [Google Scholar] [CrossRef]
  40. Boucher, J.; Faure, F.; Pompini, O.; Plummer, Z.; Wieser, O.; de Alencastro, L.F. (Micro) Plastic Fluxes and Stocks in Lake Geneva Basin. Trends Anal. Chem. 2019, 112, 66–74. [Google Scholar] [CrossRef]
  41. Grbic, J.; Helm, P.A.; Athey, S.N.; Rochman, C.M. Microplastics Entering Northwestern Lake Ontario Are Diverse and Linked to Urban Sources. Water Res. 2020, 174, 115623. [Google Scholar] [CrossRef]
  42. Chen, H.; Jia, Q.; Zhao, X.; Li, L.; Nie, Y.-H.; Liu, H.; Ye, J. The Occurrence of Microplastics in Water Bodies in Urban Agglomerations: Impacts of Drainage System Overflow in Wet Weather, Catchment Land-Uses, and Environmental Management Practices. Water Res. 2020, 183, 116073. [Google Scholar] [CrossRef] [PubMed]
  43. Brahney, J.; Hallerud, M.; Heim, E.; Hahnenberger, M.; Sukumaran, S. Plastic Rain in Protected Areas of the United States. Science 2020, 368, 1257–1260. [Google Scholar] [CrossRef] [PubMed]
  44. Roychand, R.; Pramanik, B.K. Identification of Micro-Plastics in Australian Road Dust. J. Environ. Chem. Eng. 2020, 8, 103647. [Google Scholar] [CrossRef]
  45. Wei, L.; Yue, Q.; Chen, G.; Wang, J. Microplastics in Rainwater/Stormwater Environments: Influencing Factors, Sources, Transport, Fate, and Removal Techniques. TrAC Trends Anal. Chem. 2023, 165, 117147. [Google Scholar] [CrossRef]
  46. Monira, S.; Bhuiyan, M.A.; Haque, N.; Shah, K.N.; Gravina, R.J.; Al-Mamun, A.; Pramanik, B.K. Understanding the Fate and Control of Road Dust-Associated Microplastics in Stormwater. Chem. Eng. Res. Des. 2021, 152, 47–57. [Google Scholar] [CrossRef]
  47. Hitchcock, J.N. Storm Events as Key Moments of Microplastic Contamination in Aquatic Ecosystems. Sci. Total Environ. 2020, 734, 139436. [Google Scholar] [CrossRef]
  48. Walters, L.J.; Craig, C.; Dark, E.; Wayles, J.; Encomio, V.; Coldren, G.; Sailor-Tynes, T.; Fox, D.W.; Zhai, L. Quantifying Spatial and Temporal Trends of Microplastic Pollution in Surface Water and in the Eastern Oyster Crassostrea Virginica for a Dynamic Florida Estuary. Environments 2022, 9, 131. [Google Scholar] [CrossRef]
  49. Zhao, S.; Zhu, L.; Wang, T.; Li, D. Suspended Microplastics in the Surface Water of the Yangtze Estuary System, China: First Observations on Occurrence, Distribution. Mar. Pollut. Bull. 2014, 86, 562–568. [Google Scholar] [CrossRef]
  50. Gray, A.D.; Wertz, H.; Leads, R.R.; Weinstein, J.E. Microplastic in Two South Carolina Estuaries: Occurrence, Distribution, and Composition. Mar. Pollut. Bull. 2018, 128, 223–233. [Google Scholar] [CrossRef]
  51. Fok, L.; Cheung, P.K. Hong Kong at the Pearl River Estuary: A Hotspot of Microplastic Pollution. Mar. Pollut. Bull. 2015, 99, 112–118. [Google Scholar] [CrossRef]
  52. Cheung, P.K.; Cheung, L.T.O.; Fok, L. Seasonal Variation in the Abundance of Marine Plastic Debris in the Estuary of a Subtropical Macro-Scale Drainage Basin in South China. Sci. Total Environ. 2016, 562, 658–665. [Google Scholar] [CrossRef] [PubMed]
  53. Walker, D.W.; Smigaj, M.; Tani, M. The Benefits and Negative Impacts of Citizen Science Applications to Water as Experienced by Participants and Communities. Wiley Interdiscip. Rev. Water 2020, 8, e1488. [Google Scholar] [CrossRef]
  54. Results—Microplastic Survey. Available online: https://microplasticsurvey.org/results (accessed on 8 June 2023).
  55. Indian River Lagoon National Estuary Program. 2030 Comprehensive Conservation and Management Plan. 2019. Available online: https://onelagoon.org/management-plan/ (accessed on 15 June 2023).
  56. Arthur, C.; Baker, J.A.; Bamford, H.A. In Proceedings of the International Research Workshop on the Occurrence, Effects, and Fate of Microplastic Marine Debris, University of Washington Tacoma, Tacoma, WA, USA, 9–11 September 2008; NOAA: Washington, DC, USA, 2009.
  57. Lapointe, B.E.; Herren, L.W.; Debortoli, D.; Vogel, M.A. Evidence of Sewage-Driven Eutrophication and Harmful Algal Blooms in Florida’s Indian River Lagoon. Harmful Algae 2015, 43, 82–102. [Google Scholar] [CrossRef]
  58. Lapointe, B.E.; Herren, L.W.; Brewton, R.A.; Alderman, P. Nutrient Over-Enrichment and Light Limitation of Seagrass Communities in the Indian River Lagoon, an Urbanized Subtropical Estuary. Sci. Total Environ. 2020, 699, 134068. [Google Scholar] [CrossRef]
  59. Benson, G.W.; Donnelly, M.J.; Sacks, P.E.; Walters, L.J. Documenting Loss and Fragmentation of Intertidal Oyster (Crassostrea Virginica) Reefs in a Subtropical Estuary. Environments 2023, 10, 133. [Google Scholar] [CrossRef]
  60. Adams, D.; Edwards, D.; Schneider, J.; Searles, A. Range Expansion and Population Shifts of Estuarine Fishes in a Changing Subtropical Estuary. Mar. Ecol. Prog. Ser. 2023, SHIFT. [Google Scholar] [CrossRef]
  61. Cutroneo, L.; Reboa, A.; Besio, G.; Borgogno, F.; Canesi, L.; Canuto, S.; Dara, M.; Enrile, F.; Forioso, I.; Greco, G.; et al. Microplastics in Seawater: Sampling Strategies, Laboratory Methodologies, and Identification Techniques Applied to Port Environment. Environ. Sci. Pollut. Res. 2020, 27, 8938–8952. [Google Scholar] [CrossRef]
  62. Zhao, J.; Ran, W.; Jiang, T.; Liu, Y.; Liu, H.; Yin, X.; Cao, R.; Wang, Q. Microplastic Pollution in Sediments from the Bohai Sea and the Yellow Sea, China. Sci. Total Environ. 2018, 640–641, 637–645. [Google Scholar] [CrossRef]
  63. R: The R Project for Statistical Computing. (n.d.). Available online: https://www.r-project.org/ (accessed on 23 June 2023).
  64. Posit|The Open-Source Data Science Company. Posit. 2 October 2023. Available online: http://www.rstudio.com/ (accessed on 24 June 2023).
  65. Craig, C. Correlations in Microplastic Abundance between Water, the Eastern Oyster, Crassostrea Virginica, and Their Biodeposits in a Dynamic Florida Estuary; University of Central Florida: Orlando, FL, USA, 2021. [Google Scholar]
  66. Chen, G.; Feng, Q.; Wang, J. Mini-Review of Microplastics in the Atmosphere and Their Risks to Humans. Sci. Total Environ. 2020, 703, 135504. [Google Scholar] [CrossRef]
  67. Campanale, C.; Stock, F.; Massarelli, C.; Kochleus, C.; Bagnuolo, G.; Reifferscheid, G.; Uricchio, V.F. Microplastics and Their Possible Sources: The Example of Ofanto River in Southeast Italy. Environ. Pollut. 2020, 258, 113284. [Google Scholar] [CrossRef]
  68. Piñon-Colin, T.D.J.; Rodriguez-Jimenez, R.; Rogel-Hernández, E.; Álvarez-Andrade, A.; Wakida, F.T. Microplastics in Stormwater Runoff in a Semiarid Region, Tijuana, Mexico. Sci. Total Environ. 2020, 704, 135411. [Google Scholar] [CrossRef] [PubMed]
  69. Lee, J.S.H.; Bang, K.-H.; Ketchum, L.H.J.; Jk, C.; Yu, M.Y. First Flush Analysis of Urban Storm Runoff. Sci. Total Environ. 2002, 293, 163–175. [Google Scholar] [CrossRef] [PubMed]
  70. Barrows, A.P.W.; Christiansen, K.S.; Bode, E.T.; Hoellein, T.J. A Watershed-Scale, Citizen Science Approach to Quantifying Microplastic Concentration in a Mixed Land-Use River. Water Res. 2018, 147, 382–392. [Google Scholar] [CrossRef] [PubMed]
  71. Shruti; Pérez-Guevara, F.; Elizalde-Martínez; Kutralam-Muniasamy, G. Current Trends and Analytical Methods for Evaluation of Microplastics in Stormwater. Curr. Trends Anal. Methods Eval. Microplast. Stormwater 2021, 30, e00123. [Google Scholar] [CrossRef]
  72. Almroth, B.C.; Åström, L.; Roslund, S.; Petersson, H.; Johansson, M.; Persson, N.-K. Quantifying Shedding of Synthetic Fibers from Textiles; a Source of Microplastics Released into the Environment. Environ. Sci. Pollut. Res. 2017, 25, 1191–1199. [Google Scholar] [CrossRef]
  73. TextileExchange. Preferred Fiber & Materials Market Report 2021; TextileExchange: Lamesa, Texas, 2021. [Google Scholar]
  74. Zhao, Y.; Qiao, R.; Zhang, S.; Wang, G. Metabolomic Profiling Reveals the Intestinal Toxicity of Different Length of Microplastic Fibers on Zebrafish (Danio Rerio). J. Hazard. Mater. 2021, 403, 123663. [Google Scholar] [CrossRef]
  75. Bhatt, V.; Chauhan, J.S. Microplastic in Freshwater Ecosystem: Bioaccumulation, Trophic Transfer, and Biomagnification. Environ. Sci. Pollut. Res. 2022, 30, 9389–9400. [Google Scholar] [CrossRef] [PubMed]
  76. Xia, F.; Liu, H.; Zhang, J.; Wang, D. Migration Characteristics of Microplastics Based on Source-Sink Investigation in a Typical Urban Wetland. Water Res. 2022, 213, 118154. [Google Scholar] [CrossRef]
  77. Olesen, K.B.; Stephansen, D.A.; Van Alst, N.; Vollertsen, J. Microplastics in a Stormwater Pond. Water 2019, 11, 1466. [Google Scholar] [CrossRef]
  78. Van Melkebeke, M.; Janssen, C.R.; De Meester, S. Characteristics and Sinking Behavior of Typical Microplastics Including the Potential Effect of Biofouling: Implications for Remediation. Environ. Sci. Technol. 2020, 54, 8668–8680. [Google Scholar] [CrossRef]
  79. Gago, J.M.; Carretero, O.; Filgueiras, A.V.; Viñas, L. Synthetic Microfibers in the Marine Environment: A Review on Their Occurrence in Seawater and Sediments. Mar. Pollut. Bull. 2018, 127, 365–376. [Google Scholar] [CrossRef]
  80. Liu, F.; Vianello, A.; Vollertsen, J. Retention of Microplastics in Sediments of Urban and Highway Stormwater Retention Ponds. Environ. Pollut. 2019, 255 Pt 2, 113335. [Google Scholar] [CrossRef] [PubMed]
  81. Mak, C.W.; Tsang, Y.F.; Leung, M.; Fang, J.K.H.; Chan, K.M. Microplastics from Effluents of Sewage Treatment Works and Stormwater Discharging into the Victoria Harbor, Hong Kong. Mar. Pollut. Bull. 2020, 157, 111181. [Google Scholar] [CrossRef] [PubMed]
  82. Boucher, J.; Friot, D. Primary Microplastics in the Oceans: A Global Evaluation of Sources; IUCN: Gland, Switzerland, 2017. [Google Scholar] [CrossRef]
  83. Goßmann, I.; Halbach, M.; Scholz-Böttcher, B.M. Car and Truck Tire Wear Particles in Complex Environmental Samples—A Quantitative Comparison with “Traditional” Microplastic Polymer Mass Loads. Sci. Total Environ. 2021, 773, 145667. [Google Scholar] [CrossRef]
  84. Wik, A.; Dave, G. Occurrence and Effects of Tire Wear Particles in the Environment—A Critical Review and an Initial Risk Assessment. Environ. Pollut. 2009, 157, 1–11. [Google Scholar] [CrossRef]
  85. Ziajahromi, S.; Drapper, D.; Hornbuckle, A.; Rintoul, L.; Kookana, R.S. Microplastic Pollution in a Stormwater Floating Treatment Wetland: Detection of Tyre Particles in Sediment. Sci. Total Environ. 2020, 713, 136356. [Google Scholar] [CrossRef] [PubMed]
  86. Tixier, G.; Lafont, M.; Grapentine, L.; Rochfort, Q.; Marsalek, J. Ecological Risk Assessment of Urban Stormwater Ponds: Literature Review and Proposal of a New Conceptual Approach Providing Ecological Quality Goals and the Associated Bioassessment Tools. Ecol. Indic. 2011, 11, 1497–1506. [Google Scholar] [CrossRef]
  87. Schwartz, D.K.; Sample, D.J.; Grizzard, T.J. Evaluating the Performance of a Retrofitted Stormwater Wet Pond for Treatment of Urban Runoff. Environ. Monit. Assess. 2017, 189, 256. [Google Scholar] [CrossRef] [PubMed]
  88. Viol, I.L.; Mocq, J.; Julliard, R.; Kerbiriou, C. The Contribution of Motorway Stormwater Retention Ponds to the Biodiversity of Aquatic Macroinvertebrates. Biol. Conserv. 2009, 142, 3163–3171. [Google Scholar] [CrossRef]
  89. Hamer, A.; Smith, P.J.; McDonnell, M.D. The Importance of Habitat Design and Aquatic Connectivity in Amphibian Use of Urban Stormwater Retention Ponds. Urban Ecosyst. 2011, 15, 451–471. [Google Scholar] [CrossRef]
  90. Birch, G.F.; Matthai, C.; Fazeli, M.S. Efficiency of a Retention/Detention Basin to Remove contaminants from Urban Stormwater. Urban Water J. 2006, 3, 69–77. [Google Scholar] [CrossRef]
  91. Yazdi, M.N.; Scott, D.T.; Sample, D.J.; Wang, X. Efficacy of a Retention Pond in Treating Stormwater Nutrients and Sediment. J. Clean. Prod. 2021, 290, 125787. [Google Scholar] [CrossRef]
  92. Stang, C.; Mohamed, B.A.; Li, L.Y. Microplastic Removal from Urban Stormwater: Current Treatments and Research Gaps. J. Environ. Manag. 2022, 317, 115510. [Google Scholar] [CrossRef]
  93. Steward, J.S.; VanArman, J.A. Indian River Lagoon Joint Reconnaissance Report; CM–137; St. Johns River Water Management District: Palatka, FL, USA, 1987. [Google Scholar]
  94. Jiang, M. Modeling Water Residence Time and Connectivity in the Northern Indian River Lagoon. Estuaries Coasts 2023, 46, 1170–1189. [Google Scholar] [CrossRef]
  95. Smith, N.P. Tidal and Nontidal Flushing of Florida’s Indian River Lagoon. Estuaries 1993, 16, 739. [Google Scholar] [CrossRef]
  96. Van Der Velde, T.; Milton, D.A.; Lawson, T.J.; Wilcox, C.; Lansdell, M.; Davis, G.; Perkins, G.C.; Hardesty, B.D. Comparison of Marine Debris Data Collected by Researchers and Citizen Scientists: Is Citizen Science Data Worth the Effort? Biol. Conserv. 2017, 208, 127–138. [Google Scholar] [CrossRef]
  97. Bosker, T.; Behrens, P.; Vijver, M.G. Determining Global Distribution of Microplastics by Combining Citizen Science and In-Depth Case Studies. Integr. Environ. Assess. Manag. 2017, 13, 536–541. [Google Scholar] [CrossRef] [PubMed]
  98. Davis, W.; Murphy, A.G. Plastic in Surface Waters of the Inside Passage and Beaches of the Salish Sea in Washington State. Mar. Pollut. Bull. 2015, 97, 169–177. [Google Scholar] [CrossRef] [PubMed]
  99. Lots, F.A.E.; Behrens, P.; Vijver, M.G.; Horton, A.A.; Bosker, T. A Large-Scale Investigation of Microplastic Contamination: Abundance and Characteristics of Microplastics in European Beach Sediment. Mar. Pollut. Bull. 2017, 123, 219–226. [Google Scholar] [CrossRef]
  100. Nel, H.; Smith, G.H.S.; Harmer, R.; Sykes, R.; Schneidewind, U.; Lynch, I.; Krause, S. Citizen Science Reveals Microplastic Hotspots within Tidal Estuaries and the Remote Scilly Islands, United Kingdom. Mar. Pollut. Bull. 2020, 161, 111776. [Google Scholar] [CrossRef] [PubMed]
  101. Hidalgo-Ruz, V.; Thiel, M. Distribution and Abundance of Small Plastic Debris on Beaches in the SE Pacific (Chile): A Study Supported by a Citizen Science Project. Mar. Environ. Res. 2013, 87–88, 12–18. [Google Scholar] [CrossRef] [PubMed]
  102. Jones, J.; Guezou, A.; Medor, S.; Nickson, C.; Savage, G.; Alarcón-Ruales, D.; Galloway, T.S.; Muñoz-Pérez, J.P.; Nelms, S.E.; Porter, A.; et al. Microplastic Distribution and Composition on Two Galápagos Island Beaches, Ecuador: Verifying the Use of Citizen Science Derived Data in Long-Term Monitoring. Environ. Pollut. 2022, 311, 120011. [Google Scholar] [CrossRef] [PubMed]
  103. Krishnan, R.A.; Manikandan, S.; Subbaiya, R.; Karmegam, N.; Kim, W.; Govarthanan, M. Recent Approaches and Advanced Wastewater Treatment Technologies for Mitigating Emerging Microplastics Contamination—A Critical Review. Sci. Total Environ. 2023, 858, 159681. [Google Scholar] [CrossRef] [PubMed]
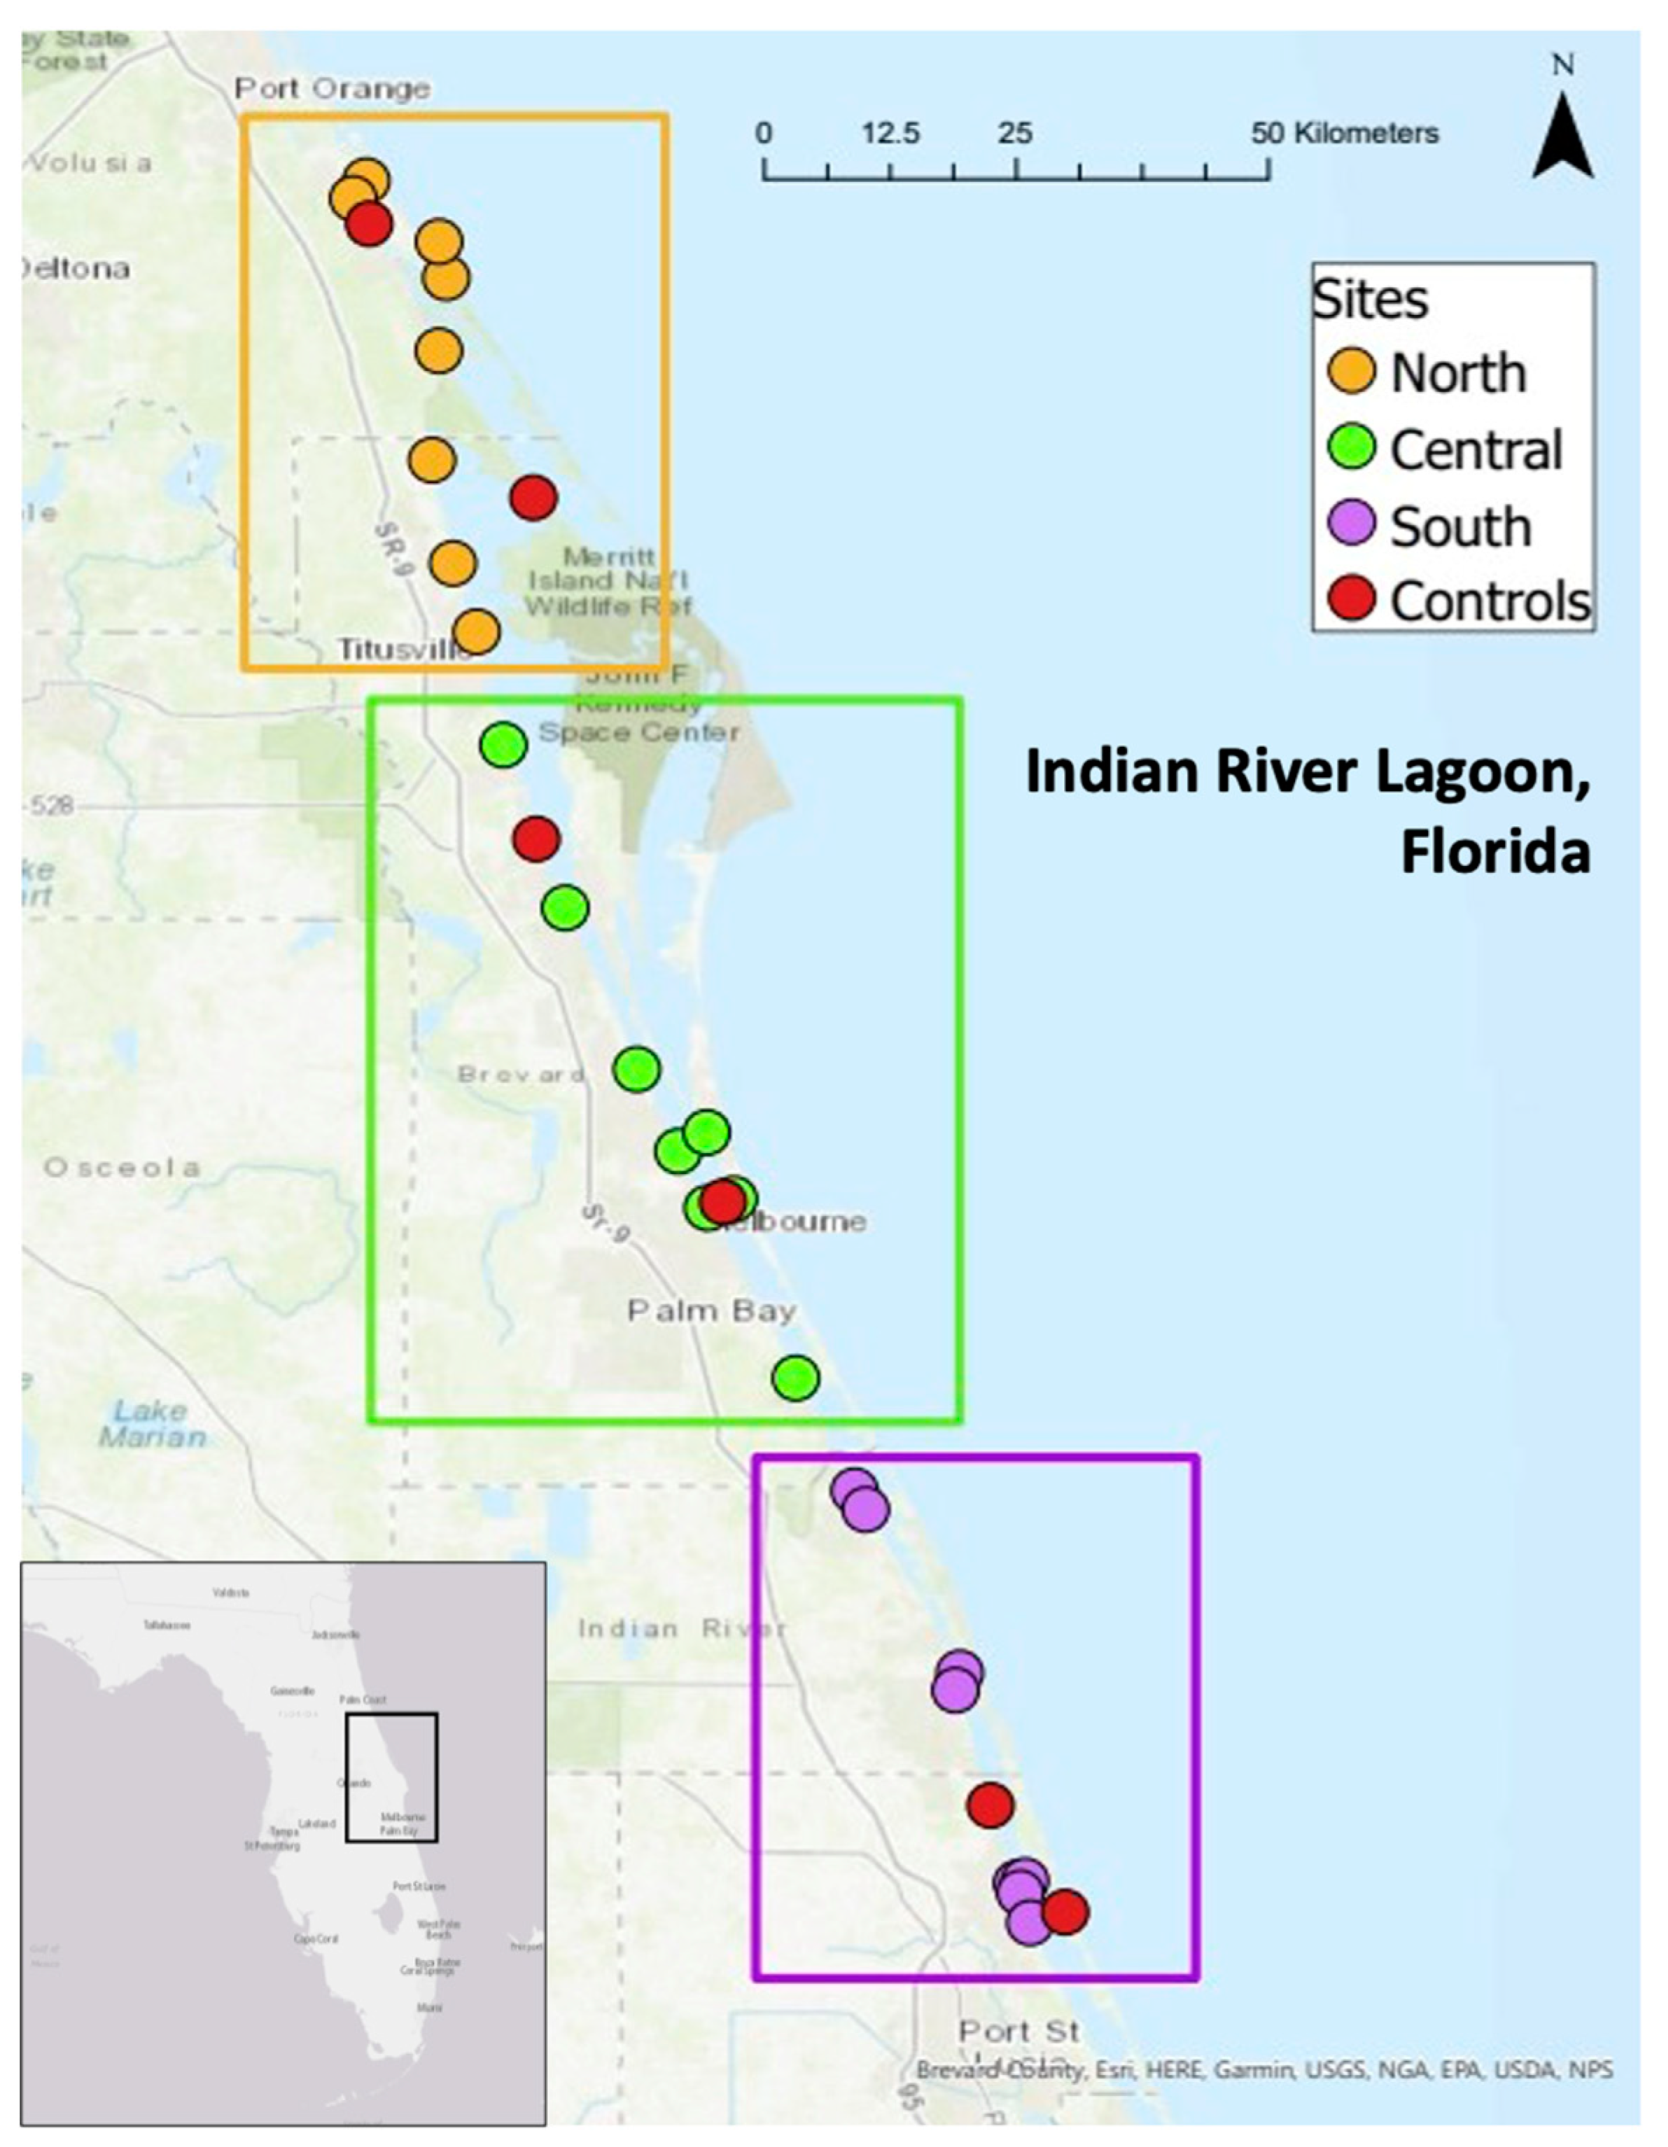
Figure 1. Water sampling locations in the Indian River Lagoon (IRL).
Environments 10 00181 g001
Figure 2. (a) MPs per L: control vs. stormwater sites (GLM: p = 0.02). (b) MP size was smaller at stormwater sites (GLM: p = 0.008).
Environments 10 00181 g002
Figure 3. (a) MP types categorized by “stormwater” and “control” sites; (b) MP colors from stormwater and control sites.
Environments 10 00181 g003
Figure 4. Winter (GLM: p = 0.006), spring (p < 0.001), and summer (p < 0.001) all had. Different letters at the top of the figure represent seasons that were different at the p < 0.05 level.
Environments 10 00181 g004
Figure 5. ATR-FTIR results.
Environments 10 00181 g005
Disclaimer/Publisher’s Note: The statements, opinions and data contained in all publications are solely those of the individual author(s) and contributor(s) and not of MDPI and/or the editor(s). MDPI and/or the editor(s) disclaim responsibility for any injury to people or property resulting from any ideas, methods, instructions or products referred to in the content.