Article

Factors Influencing the Intention to Use the Common Ticketing System (Spider Card) in Thailand

College of Public Administration, Huazhong University of Science and Technology, Wuhan 430074, China
*
Author to whom correspondence should be addressed.
Behav. Sci. 2019, 9(5), 46; https://doi.org/10.3390/bs9050046
Submission received: 20 March 2019 / Revised: 14 April 2019 / Accepted: 24 April 2019 / Published: 28 April 2019

Abstract

:
The Common Ticket, locally called the “Spider Card” is a contactless smartcard ticket used for public transportation systems in Thailand. The card is used for all modes of transportation and increases the convenience of public transit passengers while increasing public transport ridership. This research aimed to identify the determinant factors that impact passengers’ intention to use the Spider Card based on the unified theory of acceptance and use of technology (UTAUT) model by integrating perceived convenience and perceived sacrifice as part of the perceived value. A survey of public transit users in the Bangkok metropolitan area was conducted. The Partial Least Square-Structure Equation Modelling (PLS-SEM) technique was employed to examine the data. The results showed that perceived value, performance expectancy, and facilitating conditions are all significant factors. Perceived convenience and perceived sacrifice are significant antecedents for perceived value. Surprisingly, effort expectancy and social influence did not impact passengers’ intentions to use the Spider Card. The results also offer beneficial information for public transit authorities in order to comprehend what passengers desire from using these kinds of technology service systems.

1. Introduction

The technology of contactless smartcards has been adopted by transit agencies around the world for transit fare collection since 1990 [1,2]. Many cities have implemented this kind of technology scheme, making it integral to modern public transport systems [3]. Contactless smartcards offer opportunities for transport agencies to coordinate fare collections with other agencies, improve data collection about how riders use transit, and reduce fare fraud [4]. Moreover, passengers can make a journey that involves transfers within or between different transport modes through an all-in-one ticket [5]. This type of card offers advantages and makes it more convenient when compared to more traditional payment methods [6]. Integrated ticketing technology is a kind of contactless smartcard for a fare collection payment system used in public transport systems worldwide. Turner and Wilson [7], as well as other researchers, have explained the concept of integrated ticketing in that it can be paper or smart tickets that are suitable for use in multiple modes of transport. The advantages of these systems are provided to both public transit passengers and transport operators. Focusing on Asian countries, EZ-Link in Singapore, the Octopus card in Hong Kong or Touch ‘n Go in Malaysia are good examples of the success of adopting an integrated smartcard ticketing system for public transit services [8].
Thailand recently made the first integrated smartcard ticketing available for use in multi-modal public transit in mid-June of 2018, called the “Spider Card” and locally named the MANG-MOOM card (Thai for “Spider”) [9,10]. This multi-modal smartcard payment scheme is still a new service and was first officially launched in Thailand for the early stage. In order to achieve wider acceptance for using the integrated smartcard ticketing system in Thailand, this study aims to identify the dominant factors that influence passengers’ intention to use the Spider Card for public transportation in Thailand. The intention to use the integrated smartcard ticket is affected by many factors including performance, ease of use, and personal expectations, as well as the infrastructure facilitating the passengers, social impact, pricing, value perception and convenience, and travel time savings when using the Spider Card. More complete understanding of user intention and adoption of the integrated ticketing system is still needed as there have been limited published studies focused on the factors which might influence integrated ticketing usage behaviour. Moreover, researchers in the past five years have shown significant interest in mobile-payment adoption rather than smartcard ticketing adoption [6,11]. Several researchers have applied the unified theory of acceptance and use of technology (UTAUT) in various contexts [12,13,14,15]. Therefore, UTAUT could be appropriate for employment in this study. Prior studies have been carried out by utilising the role of perceived value, which is widely employed in the marketing industry to estimate the public transit passengers’ intention behaviour. The legitimacy of perceived value has also been assessed experientially [16,17,18]. Other researchers have developed their research framework by incorporating a perceived value construct into the determinant of UTAUT constructs in order to explore the intention of using information system technology [19,20]. This study is quantitative research. The results from this study will be used to make useful suggestions for government agencies and the transport policy authority in order to build a better understanding of passengers’ intention to use the Spider Card and ways to increase the ridership on public transit services and its usage.

1.1. Theoretical Foundation

1.1.1. Unified Theory of Acceptance and Use of Technology (UTAUT) and Its Dimensions

Several technology adoption theories have often been used for research studies in order to forecast personal different intention to adopt new technologies. A Unified Theory of Acceptance and Use of Technology (UTAUT) is a unified technology acceptance models formulated by Venkatesh, et al. [21], as a conceptual framework for understanding users’ intention and acceptance of technology in several contexts [22,23]. The UTAUT model integrates eight dominant models of acceptance and use of technology theories including the Theory of Reason Action (TRA) proposed by Fishbein and Ajzen [24], the Technology Acceptance Model (TAM) proposed by Davis [25] and Davis, et al. [26], the Theory of Planned Behavior (TPB) proposed by Ajzen [27], Combined TAM and TPB (C-TAM-TPB) proposed by Taylor and Todd [28], the Motivation Model (MM) proposed by Vallerand [29], the Model of PC Utilization (MPCU) proposed by Triandis [30], the Diffusion of Innovation Theory (DOI) proposed by Rogers [31], and Social Cognitive Theory (SCT) proposed by Bandura [32], which is connected to all eight theories above as the unified theory between the main factors and latent variables. The key determinant constructs affect the intended use of new technology perspectives, which can be determined by three constructs including performance expectancy, effort expectancy and social influence. Performance expectancy is defined as the degree to which an individual believes that using the system will help them to accomplish gains in job performance [21], while effort expectancy can be defined as the degree of ease associated with consumers’ use of technology which explains an individual’s perception of the level of difficulty or ease of using an IT system [21] as well as a being a predictor for an individual’s intention to use IT [33]. Social influence is the extent to which individuals perceive the degree of a certain behavior by important referents (e.g., family and friends) that they should use a particular technology [22]. Moreover, Venkatesh, et al. [21] indicated that facilitating conditions and behavioral intention also have a direct effect on usage behavior. Facilitating conditions are defined as the degree to which an individual believes that an organizational and technical infrastructure exists to support use of the system [22]. Also, there are four individual characteristics including gender, age, experience, and voluntariness of use as moderators of the UTAUT model [21], However, the moderating variables were not mentioned in this study.
The UTAUT has been used to explain behavioral intention and used in various contexts of information technology such as e/m-government services [33,34], e/m-payment [11,19,35,36], mobile technology [20], and transportation systems [13,37]. Previous studies have applied the UTAUT model to explore the context of transit fare payment technology adoption, as seen in Wu, et al. [37] where the UTAUT model was adopted to investigate citizens’ acceptance and use of iPass transit smartcard in Taiwan’s Kaohsiung MRT system. The results showed that most constructs of the UTAUT have a strong positive influence on behavioural intention. This study also takes facilitating conditions as one of the determinant factors affecting the intention to use the Spider Card. Previous studies have proven that facilitating conditions have a positive influence on technology adoption and intention [22].

1.1.2. The Role of Perceived Value

Perceived value is the major element of any successful marketing strategies. As first offered by Zeithaml [38], perceived value refers to an overall assessment of a product or service from the consumers based on perceptions of what is received and what is given. Numerous scholars have extended their understanding of perceived value as the ratio or trade-off between benefit and cost, e.g., [18,39,40,41], which is a value-for-money concept. In general, perceived value can be linked to the value that consumers believe they will get from buying certain products and services. This is done by comparing with other similar products and services in terms of the financial and non-financial aspects of purchased products and services [38,42]. Zeithaml [38] argued that some people view value as meaning a low price, while others see it as relative equality between the quality and price of a purchase. Another researcher, Lovelock [42] also suggested that perceived value may be considered a compromise between perceived benefits and perceived cost. Additionally, perceived value will probably be high when the perceived benefit is greater than any perceived cost. The opposite is also true [43].
A commonly accepted influence factor on behavioural intention and adoption is perceived value. A number of studies [16,18,43,44] revealed that perceived value could be impacted by various precursor variables. Focusing on the transportation context, Lai and Chen [16] examined the influence of perceived value on behavioural intentions for major transport facilities. Apparently, perceived value has a direct influence on behavioural intentions, as found in their study. Sumaedi, et al. [45] likewise identified the importance of perceived value for the intention of users of public transit in Jakarta, Indonesia. Therefore, it could be assumed that perceived value is a significant element of behavioural intentions to use common ticketing among passengers. Thus, the intention to use a common ticketing system will be high if passengers perceive high value.

1.1.3. Perceived Convenience

Convenience is typically considered and debated in marketing and consumer behaviour literature [46]. Convenience is also recognised as an aspect of consumers’ attitudes in terms of the time and effort needed for buying specific goods and services [46]. Yoon and Kim [47] described perceived convenience as the degree of convenience individuals realise when using services to complete a task measured by time, location and accomplishment. Moreover, Colwell, et al. [48] revealed that service convenience can be classified as a way to create added value for consumers by reducing the time and effort that they have to spend for products and services. When a product or service saves time for a consumer, it is deemed convenient. Conversely, a product or service is viewed as being convenient if it decreases the mental, emotive and physical drain felt by consumers. Based on the perspective provided by [46,47], in the context of transport services in this research, perceived convenience was defined as the degree of passengers’ recognition of convenience due to using the Spider Card as measured by less travel time and ease of inter-modality transport, in addition to time savings in comparison with conventional pay systems. Further, experiential research by Liu, et al. [49] likewise showed that perceived convenience has an affirmative impact on perceived value toward the behavioural intention of using mobile coupon applications.

1.1.4. Perceived Sacrifice

Perceived sacrifice typically concerns what must be surrendered or paid in order to gain certain goods or services [38]. As seen in the literature from previous studies, perceived sacrifice may be separated into monetary and non-monetary, such as time, search, and psychological costs [38,43,50]. A sacrifice is obvious if a consumer must use time and travel some distance to buy a product or service. Moreover, on the basis of Zeithaml’s (1988) work, perceived sacrifice is often revealed as an indicator of the perceived value. In previous works relating to transportation, an immediate and adverse bond between perceived sacrifice and perceived value is verifiable. For example, the study conducted by Wen, et al. [43] revealed that perceived sacrifice is noteworthy according to statistics, meaning it has a direct unfavourable impact on perceived value. This indicates that low perceived value could be a consequence of high perceived sacrifice. Quite the opposite, low perceived sacrifice could bring about high perceived value.

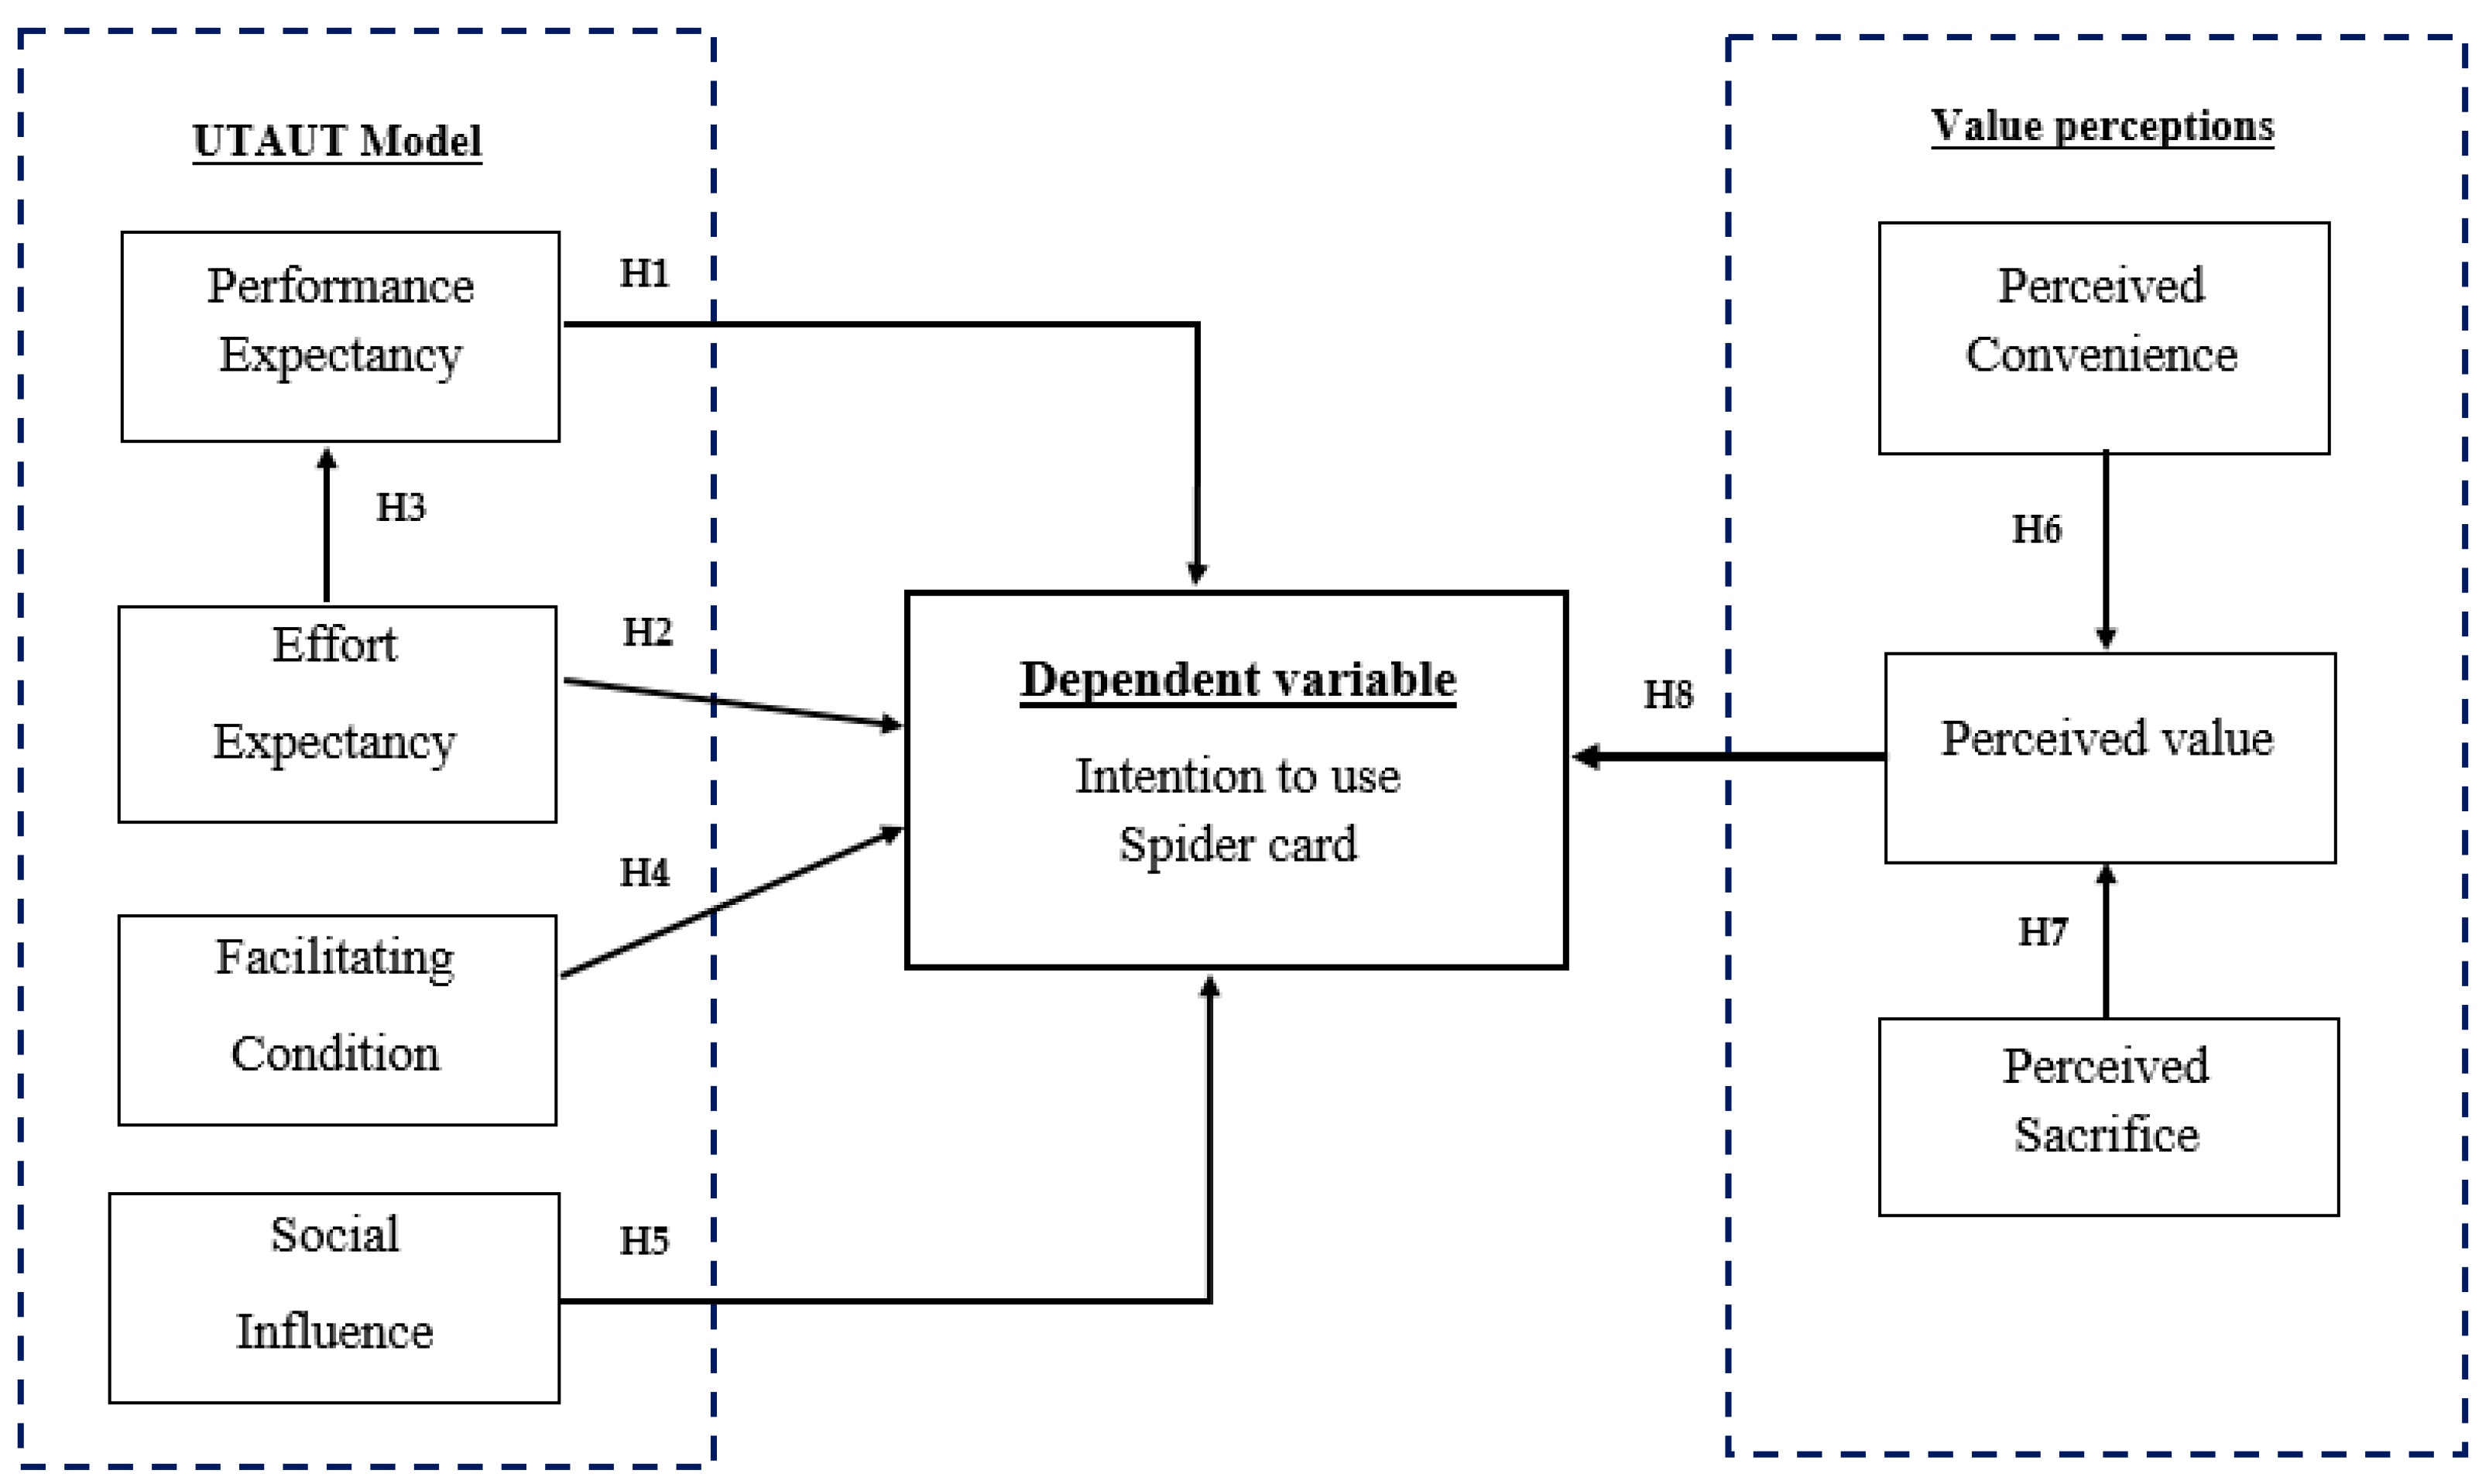
1.2. Conceptual Framework and Hypotheses

1.2.1. Performance Expectancy

One key construct from the UTAUT model is performance expectancy (PE) [21]. Performance expectancy is one of the most meaningful elements that can promptly affect behavioural intentions under many conditions according to past studies [12,13,14,33], including an empirical study in the context of an E-ticketing system [33]. Therefore, in this study, performance expectancy means users’ belief that using the Spider Card can offer benefits in daily life and increase relative advantages more than using traditional tickets. Thus, the study hypothesises that:
Hypothesis 1 (H1):
Performance expectancy will have a positive effect on intention to use Spider Card.

1.2.2. Effort Expectancy

A primary construct from UTAUT that can be deemed as the level of ease consumers should feel when using technology is called effort expectancy (EE), which can be utilised to support individuals’ awareness of the degree of struggle or comfort felt when using an IT system [18]. Previous research conducted by [13,20,21,37] have found that effort expectancy has a direct and significant effect on behavioural intentions. For this study, effort expectancy is explained as the belief among users that the Spider Card is easy to use and there are no difficulties identified in using this system. Assuming that users feel that they do not encounter any obstacles while using the Spider Card and that it is convenient, users will probably have higher expectations for achieving the expected performance [36]. Moreover, Herrero, et al. [15] also proved that effort expectancy is positively related to performance expectancy for the adoption of social network sites used in the tourism industry in Spain. Thus, the study hypothesises that:
Hypothesis 2 (H2):
Effort expectancy will have a positive effect on intention to use Spider Card.
Hypothesis 3 (H3):
Effort expectancy will have a positive effect on performance expectancy.

1.2.3. Facilitating Conditions

Based on UTAUT, facilitating conditions (FC) obviously affect usage behaviour [21]. However, previous studies have demonstrated a link with behavioural intentions in many settings. Bhuasiri, et al. [33] revealed that facilitating conditions are significant for impacting taxpayers’ incentive to use the e-tax filing and payment system. In this study, facilitating conditions describe a variety of factors that are able to facilitate the use of the Spider Card such as the location and way to top-up money, facility support from card operators and relevant agencies, and assistance available from ground staff as well as other things that are needed when using the Spider Card. Thus, the study hypothesises that:
Hypothesis 4 (H4):
Facilitating conditions will have a positive effect on intention to use Spider Card.

1.2.4. Social Influence

How much a person believes that it is vital for other people to consider that the individual should use new technology is called social influence (SI) [21]. Social influence in the current research is defined as societal stress by family and known associates who can influence the intent to use the Spider Card. Users also perceive that using the Spider Card can enhance their personal image. Previous studies have shown that social influence is a critical indicator of behavioural intention for technology adoption [19,33,51]. Empirical evidence from Wu, et al. [37] demonstrated that social influence has a significant and positive influence on the behavioural intention to use the iPass smartcard, which is used by the Kaohsiung MRT system. Thus, the study hypothesises that:
Hypothesis 5 (H5):
Social influence will have a positive effect on intention to use Spider Card.

1.2.5. Perceived Convenience

Consumers’ opinions relating to time and effort can be used to explain the concept of convenience in terms of buying or using goods and services [46]. Meanwhile, convenience is often detailed as several dimensions including time, place, and execution, as suggested by previous studies concerning technological innovation [47,49]. Liu, et al. [49] defines perceived convenience (PC) as consumer’s opinion that technology can be used to carry out tasks with more convenience in terms of time savings, location, and manner. Based on the perspective provided by the definition as mentioned above of perceived convenience, in the present study it is defined as passengers’ recognition of the convenience gained from using the Spider Card in the form of reduced travel time, convenience for inter-modality, time savings when compared with using tokens, coins or cash. Moreover, an empirical study from Liu, et al. [49] indicated that perceived convenience has positive effects on perceived value for the behavioural intention of using mobile coupon applications. Thus, this study hypothesises that:
Hypothesis 6 (H6):
Perceived convenience will have a positive effect on perceived value.

1.2.6. Perceived Sacrifice

What has been surrendered to get a product or service is called perceived sacrifice (PS) [38]. Perceived sacrifice may be categorised as monetary and non-monetary, such as time, search, and psychological costs, as detailed in previous studies. Thus, monetary prices in this study refer to the actual fare prices that passengers must pay if they use the Spider Card, while non-monetary prices refer to the time associated with usage. Furthermore, previous studies have proven that the effect of sacrifice aspects are negatively related to perceived value. The implication is that low perceived value could come from high perceived sacrifice. In the same way, low perceived sacrifice could cause high perceived value [43]. In the literature concerning passengers’ behavioural intention, it is demonstrated that perceived value is significantly affected by perceived sacrifice. Wen, et al. [43] found that perceived sacrifice was likely an indicator of perceived value. Similarly, Sumaedi, et al. [45] showed that perceived sacrifice is measurably important and has a direct, adverse impact on perceived value. Thus, the connection between perceived sacrifice and perceived value is noteworthy in this work. Thus, this study hypothesises that:
Hypothesis 7 (H7):
Perceived sacrifice will have a negative effect on perceived value.

1.2.7. Perceived Value

In research concerning technology adoption, perceived value (PV) is often employed to clarify passengers’ motivation and use in a variety of circumstances. Previous studies have found that perceived value may serve as an indicator of behavioural intention [44]. Lai and Chen [16] applied the perceived value construct to explore the relationship between passenger behavioural intentions in the public transportation context. Their research showed that perceived value has a significant, positive influence on behavioural intention. This is consistent with the recent study of Irtema, et al. [17], which examined the behavioural intention of public passengers in the capital city of Malaysia. The results indicated that perceived value had an effective impact on behavioural intention according to the existing literature and based on a study conducted by Lai and Chen [16]. Therefore, the study hypothesises that:
Hypothesis 8 (H8):
Perceived value will have a positive effect on intention to use the Spider Card.

1.3. Proposed Research Model

On the basis of the literature review and hypotheses presented above, the proposed research model is presented in Figure 1. This model illustrates the certain hypothesized relationships among the intention to use, the construct of the UTAUT model and the value perceptions aspect.

2. Materials and Methods

2.1. Measurement Instrument

Using the elements of the proposed model, all calculation items were designed to measure with a five-point Likert scale ranging from strongly disagree (1) and strongly agree (5). Existing literature was used to choose the constructs of the model, which were then adapted to reflect the transport users’ motivation to use the Spider Card in Thailand. Numerous items, primarily modified from instruments confirmed in previous studies were used to measure the eight constructs. These constructs were changed to conform to the context of this study. Items of performance expectancy, facilitating conditions and social influence were measured by the scale from Venkatesh, et al. [21], Wu, et al. [37] and Yeow and Loo [52]. Items of effort expectancy were developed from Venkatesh, et al. [21], Wu, et al. [37] and Davis [25]. Items of perceived convenience were modified from Yoon and Kim [47] and Liu, et al. [49]. Items of perceived sacrifice were adapted from Jen and Hu [18] and Wen, et al. [43]. Items of perceived value were revised from Liu, et al. [49] and items of intention to use the Spider Card were measured by scales derived from Venkatesh, et al. [21] and Wu, et al. [37]. The final scales and items are presented in Appendix A.

2.2. Samples and Data Collection

The Spider Card was first officially available for public transportation in the capital city of Thailand. Therefore, the people living, working, studying, or doing business in the Bangkok metropolitan area with access to public transportation were employed in this study. In order to prevent disturbing the respondents who use public transport, the research data was collected through an online survey created by Google Forms. Respondents could complete a survey at their convenience using the relatively autonomous online approach. Additionally, past research reinforces the suitability of using an online approach to carry out a survey more cost effectively and with time savings [49]. The online questionnaire was created using Google Forms and distributed from 13 October 2018 to 30 November 2018 via social network sites including Line application, Facebook, WeChat, and Twitter. People living, working, studying or doing business and having experience with public transportation usage in the Bangkok metropolitan area were invited to participate in the survey. Overall, 408 respondents completed the online questionnaire, with 20 of them being excluded because of the fallibility of answers. Three hundred-eighty-eight responses at a response rate of roughly 95 per cent comprised the final dataset. According to Cohen’s rule [53], a robust effect size for the sample size should be at least 10 times the amount of the hypotheses. The research model examined 8 hypotheses; therefore, a sample size of at least 80 is suggested. In this research, a final dataset of 388 fulfils this recommendation and is appropriate for appraising the links in the hypotheses. Among the participants, 70.4 percent were female and 29.6 percent were male. 81.44 percent of participants were between 25 and 45 years old. More than 97.16 percent possessed a bachelor’s degree education or higher, while 78.61 percent were government officers and company employees. More than 97.68 percent used the Spider Card less than 3–5 times per week. A detailed description of respondent characteristics is shown in Table 1.

2.3. Data Analysis Technique

This study employed the Partial Least Square-Structural Equation Modelling (PLS-SEM) technique performed on SmartPLS Version 2.0 (SmartPLS GmbH, Bönningstedt, Germany) [54] to test the proposed model hypotheses. Because of the small sample size and because the study assesses latent variables, the PLS-SEM approach is suitable for data analysis. The two-step method suggested by Chin [55] was used to assess the research model. Initially, the measurement model was examined to verify the dependability and legitimacy of the constructs. This was followed by checking the structural model to investigate the hypotheses. The evaluation of PLS-SEM and output reporting followed the approach outlined by Hair Jr, et al. [56].

3. Results

3.1. Measurement Model

Based on previous studies, the questionnaire items were established in English by the researcher. The phasing of the questions was modified according to the pre-test results and suggestions from transport and traffic policy analysts under Thailand’s Ministry of Transport. Afterwards, a linguistics specialist translated the questionnaire into Thai. Prior to conducting the survey, a pre-test of the questionnaire was done. Cronbach’s alpha was used to test the consistency of the questionnaire and consequently verify its contents [57]. Internal dependability was established using Cronbach’s alpha and Composite Reliability (CR) at a value of 0.70 or greater in order to evaluate the construct reliability.
Convergent validity is appraised utilising the CR and the Average Variance Extracted (AVE) gained from the valuation. The values for Cronbach’s alpha and CR in all concepts were higher than the 0.7 level suggested by Henseler, et al. [58], signifying the high dependability of the scales. Simultaneously, the AVE value for all concepts were beyond the 0.5 ceiling suggested by Hair Jr, et al. [56]. As seen from Table 2, the Cronbach’s alpha values ranged from 0.749 to 0.930 and the CR values ranged from 0.841 to 0.947. Furthermore, the AVE values ranged from 0.641 to 0.781. The internal reliability and convergent validity were suitable for this study, as indicated by the results. Examination of the square root of AVE and cross loading matrix was proposed by Fornell and Larcker [59], discriminant validity can be gauged. As seen in Table 3, the statistics highlighted in the corresponding correlation matrices are the square root of each latent construct’s AVEs. Compared to the total value of the inter-construct correlations, these values are higher. A convincing correlation with their own measures compared to other measures exists for all constructs, indicating that discriminant validity has been accomplished.

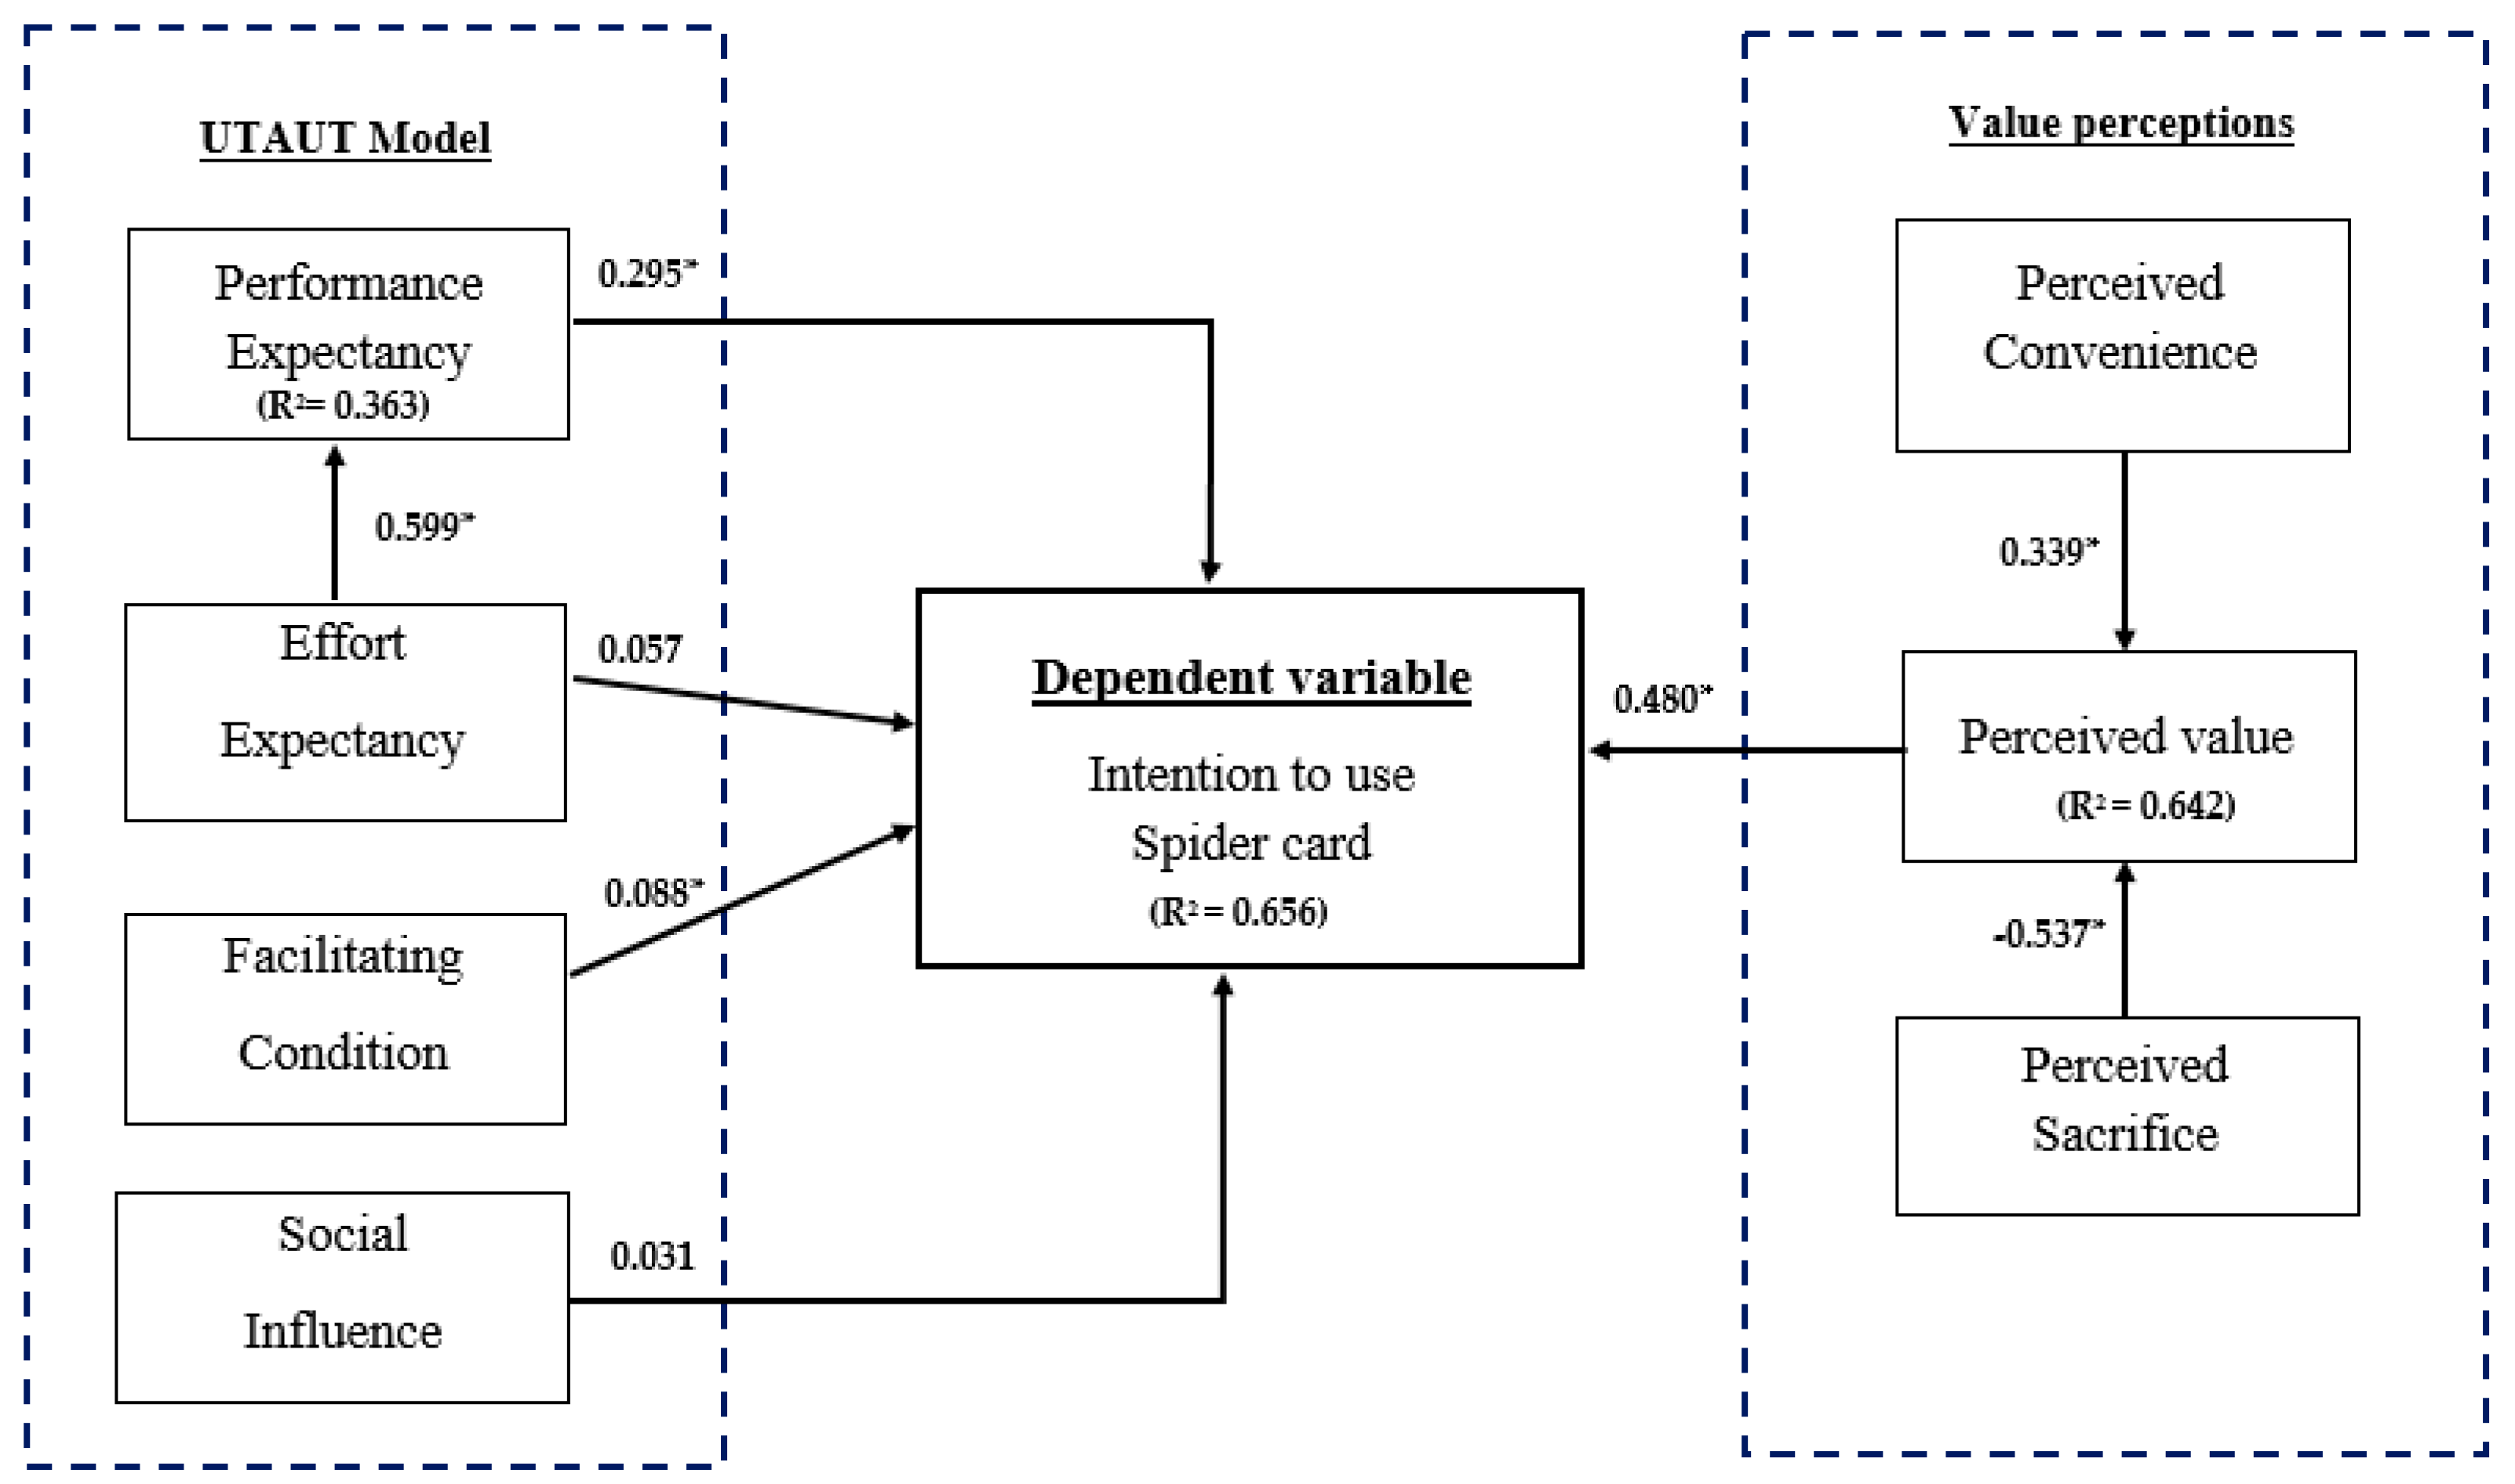
3.2. Hypotheses Testing

This study examined the factors affecting passengers’ intention to use the Spider Card for public transportation systems in Thailand. A bootstrap sampling procedure drawn from Efron and Tibshirani [60] with 388 cases was used to determine the significance of the path coefficients in the structural model. Table 4 shows a list of the structural estimates and hypotheses testing results. Six of eight hypotheses (H1, H3, H4, H6, H7, H8) were supported at the 0.05 level whereas the remaining two (H2 and H5) are not supported.
Figure 2 demonstrates the results of the standardised path coefficient for each hypothesis tested from the PLS-SEM analysis. The impartial variables of the full sample can be employed to explain 65.60 percent of the inconsistency for users’ intent to use the Spider Card. An assessment was carried out on the explanatory power of the model for each construct. The resulting R2 for perceived value and performance expectancy were 64.20 percent and 38.89 percent, respectively. The variations in the intention to use Spider Card can be used to clarify the variables in the research model.

4. Discussion and Implications

4.1. Discussion and Theoretical Implications

The findings in this study demonstrate that PE has a positive influence and is significant for the intention to use the Spider Card. It was found that people tend to use the Spider Card if they believe it is useful for their daily life and the fare payment scheme is more advantageous than using traditional or existing fare payment media. These findings are in line with previous smartcard and payment ticketing studies undertaken by Di Pietro, et al. [35], Loo, et al. [61] and Yeow and Loo [52], which found that PE is an imperative variable for predicting users’ intentions in the transportation context and also consistent with [13,19,33,62] which specified that PE is one of the dominant factors in technology intention and adoption aspects. This study also found that EE is the most significant factor affecting PE, but not with the behavioural intention to use the Spider Card. These findings might be due to the fact that most respondents basically travel with mass rapid transit services. For example, the BTS sky train uses the Rabbit Card (a store-value smartcard payment system), which is the same concept as the Spider Card. Thus, many people have already gained experience and familiarity with smartcard store-value tickets. Therefore, people might believe that there is no new technology that would make them feel that the common ticketing system is too complex or difficult to use. The same effect of EE associated through PE was also found in the work of Eyuboğlu and Sevim [54], which likewise indicated that perceived ease of use (e.g., EE) has a direct effect on perceived usefulness (e.g., PE) for the acceptance of contactless credit cards in Turkey. However, there is an inconsistency with Wu, et al. [37], who showed these variables have a significant and positive influence on behavioural intention to use the iPass smartcard for Taiwan’s MRT system.
Regarding FC, this study found that FC is significantly related to behavioural intention. This indicates that using the Spider Card is reinforced by individual opinions about the resources, infrastructure and support available from ticketing operators and associated agencies. Loo, et al. [61,63] and Wu, et al. [37] also identified that FC has a positive effect on the intention to use multipurpose smartcard and electronic ticketing technology. During the validation of the theoretical model, it was found that SI was not validated as a significant predictor of the intention to use in the context of this study. The analysis of the SI also proved to be relevant and have a positive relationship in the prediction of behavioural intention to use technology [13,19,33,37,64]. Conversely, this research was consistent with a previous study by Eyuboğlu and Sevim [62], which found comparable results investigating contactless credit cards.
In terms of the relationship between perceived value and behavioural intention, this finding was supported by the previous results in [16,43,45]. Sumaedi, et al. [45] likewise revealed similar results in terms of the impact of perceived value. Further, Wen, et al. [43] and Sumaedi, et al. [45] also established the impact of perceived sacrifice on perceived value as identified in this study. Since perceived convenience and perceived value are similarly increased with decreasing perceived sacrifices, for example, passengers have more convenience when transferring to another transit system, this boosts the intent to use the Spider Card while positively influencing its overall use. Thus, the cost to passengers for using common ticketing services should be taken into account by transit ticket operators for both monetary sacrifice and non-monetary sacrifice (e.g., time costs, search costs, convenience to top-up ticket). Last, it is obviously meaningful in terms of accessibility. The research results confirm that convenience is consistent with previous findings by Liu, et al. [49]. That study revealed a comparable connection between the influences of perceived convenience on perceived value. Transport users will be more willing to use the Spider Card if they believe it is more convenient than other means in terms of monetary benefits and time savings, as proven by the results.

4.2. Practical Implications

The current study sheds light on the links between behavioural intention and aspects of technology adoption, as well as between behavioural intention to use and value perceptions by exploring the concrete components of perceived value and technology adoption in transportation smartcard ticketing systems. This research offers significant suggestions. First, perceived value, facilitating conditions and performance expectancy are significant factors for passengers’ intention to use the Spider Card. The results likewise show that public transit passengers are more likely to use the Spider Card if they view it as being more beneficial than other means. It can also be seen that the perceived value influence has a more significant impact than the UTAUT constructs, signifying that users are more amenable to the Spider Card based on the degree of value it can or may afford. The inference is that public transit passengers concern about the level of value they will gain. Simply put, people care about whether the benefits of using the system outweigh any potential disadvantages.
The findings of this study have important implications for the Mass Rapid Transit Authority of Thailand (MRTA) who act as the Spider Card operator as well as being in charge of a central clearing house for the Spider Card ticketing system. MRTA could enhance passengers’ expectations by offering more advantageous perks and rewards, hence, transportation authorities and the MRTA should think about utilising effective marketing approaches. Moreover, MRTA should accelerate the process of allowing Spider Cards to be used for non-transit payment, such as in convenience stores or for bill payment services. Second, the factor of effort expectancy comprises the most significant factor involving performance expectancy, but not the behavioural intention to use the Spider Card. This also suggests that public transit passengers will be more motivated to use the Spider Card and perceive that it is more beneficial to them if they observe greater ease of use and more benefits compared to using other means. As suggested by the results, the MRTA should stress the ease and speed of using the Spider Card compared to traditional existing payment methods in transit systems, which will increase acceptance of the Spider Card usage. Further, it would be profitable if passengers knew more about the advantages and efficacy of integrated smartcard ticketing technology. Enhancing users’ acceptance of the Spider Card is necessary to increase the number of overall users. Third, this research also confirmed that facilitating conditions are influential factors affecting passengers’ intention to use the Spider Card. This shows that the MRTA should facilitate adequate payment as well as top-up ticket channels in various ways to facilitate passengers’ use of the Spider Card by considering online platforms or convenience stores so that it is more convenient for passengers. A far-reaching promotion to publicise the benefits of the common ticketing system and inspire the widespread use of the Spider Card should be coordinated by the transport authorities.

4.3. Limitations and Future Research

Despite the promise and usefulness of the findings in this study, various limitations were apparent. First, the research results obtained from the study may not be generalised to other countries as the data was collected only in Bangkok, Thailand. If the research model is operated in other countries, the findings may be different. Second, as the progress of integrated transit payment ticketing technology has only been launched in the capital city of Thailand, the results only reflected the residents of the capital city. If the Spider Card is used in other major cities of Thailand in the future, any subsequent research should consider using a larger sample with more diverse locations. Third, the data was collected from an online survey platform rather than a paper-based survey due to cost and time limitations as well as an inability to reach more groups of people who use public transportation in daily life. The results also revealed that most respondents knew about Spider Cards, but most of them did not have much experience using them. Therefore, users who have already adopted the system might have different perceptions. Finally, this study used cross-sectional data. However, understanding passengers’ intention to use the Spider Card should be a continuous process. Thus, longitudinal data would provide a better picture of this. A worthwhile pursuit for future study is to identify users’ continuous or discontinuous use of Spider Cards, also called a longitudinal study. The results of such research could enhance the value of this study. This study only examined the factors affecting the intention to use the Spider Card without examining the moderating effects of demographic variables. Future research should consider examining demographic variables such as age, gender, education level and personal income.

5. Conclusions

This study focused on passengers’ intention to use the common ticket locally known as the Spider Card in Thailand. Based on prior research, this study also serves as a bridge by extending the understanding of passengers’ behaviour in the public transportation context on technology acceptance in early adoption, as well as how perceived value can influence the intention to use the Spider Card. The results revealed that perceived value, performance expectancy and facilitating conditions have a positive influence on passengers’ intention to use the Spider Card. Besides, perceived value is the main determinant factor influencing behavioural intention. Perceived value is positively influenced by perceived convenience but negatively influenced by perceived sacrifice. Furthermore, effort expectancy is the most important factor affecting performance expectancy, but insignificant on behavioural intention to use the Spider Card. Nonetheless, this study identified that social influence was not deemed to be a substantial predictor of intention in the context of this study. Finally, this research indicated that the created model might appreciably impact comprehension of the factors that induce the utilisation of the Spider Card for public transportation systems in Thailand. The study’s findings may also be useful as a guideline for public transport authorities and ticket operators to comprehend passengers’ desires when utilising this specific type of technical service system.

Author Contributions

Conceptualization, Fasang Prayoonphan and X.X.; Data curation, F.P.; Formal analysis, F.P.; Methodology, F.P.; Project administration, X.X.; Supervision, X.X.; Visualization, X.X.; Writing—original draft, Fasang Prayoonphan; Writing—review and editing, F.P. and X.X.

Funding

This research received no external funding.

Conflicts of Interest

The authors declare no conflict of interest.

Appendix A

Table A1. Questionnaire items.
CodeQuestionnaire ItemsLoadingReferences
Performance expectancy [21,37,52]
PE1Spider Card is substantially beneficial for me when taking public transportation.0.863
PE2Using Spider Card enable me to access and exit public transit stations more quickly.0.855
PE3Spider Card is useful to me to pay for public transit fare.0.844
PE4Spider Card has more relative advantage than single journey cards or traditional bus tickets.0.837
Effort expectancy [21,25,37]
EE1It easy for me to use Spider Card. 0.865
EE2It easy to learn how to use Spider Card.0.882
EE3It easy for me to become skilful at using Spider Card.0.818
Facilitating conditions [21,37,52]
FC1The locations and the way to top-up money into the card is convenient and has facility support. 0.841
FC2Facility support from relevant agencies are important implication for me to use Spider Card.0.784
FC3The card operators have provided the resources necessary to support the use of Spider Card.0.857
Social influence [21,37]
SI1I use Spider card because it is a new popularity technology.0.907
SI2People who influence my behaviour will think that I should use Spider Card. 0.747
SI3I think I am more likely to use Spider Card if my friends and my family use it.0.748
Perceived convenience [47,49]
PC1Using Spider Card give me convenient when taking public transit systems.0.824
PC2Using Spider Card for the BMTA bus is more convenient compared with using the traditional ticket.
Paying the BMTA bus fare with Spider card give me more convenient than traditional ticket.
0.856
PC3Using Spider card for mass rapid transit is more convenient without carrying multiple transit cards.0.892
PC4Using Spider Card help me minimise the time for changing coins and queuing.0.856
Perceived sacrifice [18,43]
PS1The fare price is acceptable when travelling multiple routes. (Reverse coding)0.724
PS2Using Spider Card help me save travel time. (Reverse coding)0.863
PS3Using Spider Card help me reduce queuing times. (Reverse coding)0.856
Perceived value [49]
PV1Compare to the fee I need to pay, the use of Spider Card offer value for money.0.817
PV2Compare to the effort I need to put in, the use of Spider Card is beneficial to me.0.871
PV3Compare the time I need to spend, the use of Spider Card is worthwhile to me.0.915
PV4Overall, the use of Spider Card delivers me to good value.0.868
Intention to use Spider card [21,37]
IU1I intent to use Spider Card in the future.0.890
IU2I predict I would use Spider Card in the future.0.912
IU3If there was an opportunity, I would recommend others to use Spider Card.0.894
IU4I Plan to use Spider Card in the future next 3-6 months.0.863
IU5I will make an effort to use Spider Card when mass transit networks are completely connected.0.858

References

  1. Pelletier, M.-P.; Trépanier, M.; Morency, C. Smart card data use in public transit: A literature review. Trans. Res. Part C Emerg. Technol. 2011, 19, 557–568. [Google Scholar] [CrossRef]
  2. Mezghani, M. Study on Electronic Ticketing in Public Transport (Final Report); European Metropolitan Transport Authorities: Paris, France, 2008. [Google Scholar]
  3. Ellison, R.B.; Ellison, A.B.; Greaves, S.P.; Sampaio, B. Electronic ticketing systems as a mechanism for travel behaviour change? Evidence from Sydney’s Opal card. Trans. Res. Part A Policy Pract. 2017, 99, 80–93. [Google Scholar] [CrossRef]
  4. Quibria, N. The Contactless Wave: A Case Study in Transit Payments; Federal Reserve Bank of Boston: Boston, MA, USA, 2008. [Google Scholar]
  5. Blythe, P.T. Proceedings of the Institution of Civil Engineers-Municipal Engineer. In Improving Public Transport Ticketing Through Smart Cards; Thomas Telford Ltd.: London, UK, 2004; pp. 47–54. [Google Scholar]
  6. Ferreira, M.C.; Nóvoa, H.; Dias, T.G.; e Cunha, J.F. A Proposal for a Public Transport Ticketing Solution based on Customers’ Mobile Devices. Procedia Soc. Behav. Sci. 2014, 111, 232–241. [Google Scholar] [CrossRef] [Green Version]
  7. Turner, M.; Wilson, R. Smart and integrated ticketing in the UK: Piecing together the jigsaw. Comput. Law Secur. Rev. 2010, 26, 170–177. [Google Scholar] [CrossRef]
  8. Soh, C.; Chong, Y. Nanyang Business School Case. EZ-Link and NETS E-Payment: Creating a Standard and Building a Platform Innovation; Nanyang Business School: Singapore, 2013. [Google Scholar]
  9. Bangkok to Launch Integrated E-Ticketing for Public Transport, Thailand. Available online: https://www.globalmasstransit.net/archive.php?id=27554 (accessed on 15 December 2018).
  10. Mangmoom Card Usable on MRT from June 23. Available online: https://www.bangkokpost.com/news/general/1485958/mangmoom-card-usable-on-mrt-from-june-23 (accessed on 8 December 2018).
  11. Kaitawarn, C. Factor Influencing the Acceptance and Use of M-Payment in Thailand: A Case Study of AIS mPAY Rabbit. Rev. Int. Bus. Econ. Res. 2015, 4, 222. [Google Scholar]
  12. Baabdullah, A.; Dwivedi, Y.K.; Williams, M.D. Adopting An Extended UTAUT2 To Predict Consumer Adoption Of M-Technologies In Saudi Arabia; UKAIS: Oxford, UK, 2014; p. 5. [Google Scholar]
  13. Madigan, R.; Louw, T.; Dziennus, M.; Graindorge, T.; Ortega, E.; Graindorge, M.; Merat, N. Acceptance of Automated Road Transport Systems (ARTS): An Adaptation of the UTAUT Model. Trans. Res. Procedia 2016, 14, 2217–2226. [Google Scholar] [CrossRef] [Green Version]
  14. Morosan, C.; DeFranco, A. It’s about time: Revisiting UTAUT2 to examine consumers’ intentions to use NFC mobile payments in hotels. Int. J. Hosp. Manag. 2016, 53, 17–29. [Google Scholar] [CrossRef]
  15. Herrero, Á.; San Martín, H. Explaining the adoption of social networks sites for sharing user-generated content: A revision of the UTAUT2. Comput. Hum. Behav. 2017, 71, 209–217. [Google Scholar] [CrossRef]
  16. Lai, W.-T.; Chen, C.-F. Behavioral intentions of public transit passengers—The roles of service quality, perceived value, satisfaction and involvement. Trans. Policy 2011, 18, 318–325. [Google Scholar] [CrossRef]
  17. Irtema, H.I.M.; Ismail, A.; Borhan, M.N.; Das, A.M.; Alshetwi, A.B. Case study of the behavioural intentions of public transportation passengers in Kuala Lumpur. Case Stud. Trans. Policy 2018, 6, 462–474. [Google Scholar] [CrossRef]
  18. Jen, W.; Hu, K.-C. Application of perceived value model to identify factors affecting passengers’ repurchase intentions on city bus: A case of the Taipei metropolitan area. Transportation 2003, 30, 307–327. [Google Scholar] [CrossRef]
  19. Abrahão, R.d.S.; Moriguchi, S.N.; Andrade, D.F. Intention of adoption of mobile payment: An analysis in the light of the Unified Theory of Acceptance and Use of Technology (UTAUT). RAI Revista de Administração e Inovação 2016, 13, 221–230. [Google Scholar] [CrossRef] [Green Version]
  20. Alwahaishi, S.; Snášel, V. Acceptance and Use of Information and Communications Technology: A UTAUT and Flow Based Theoretical Model. J. Technol. Manag. Innov. 2013, 8, 61–73. [Google Scholar] [CrossRef]
  21. Venkatesh; Morris, M.G.; Davis, G.B.; Davis, F.D. User Acceptance of Information Technology: Toward a Unified View. MIS Q. 2003, 27, 425–478. [Google Scholar] [CrossRef]
  22. Venkatesh; Thong, J.Y.L.; Xu, X. Consumer acceptance and use of information technology: Extending the unified theory of acceptance and use of technology. MIS Q. Manag. Inf. Syst. 2012, 36, 157–178. [Google Scholar] [CrossRef]
  23. Tamilmani, K.; Rana, N.P.; Dwivedi, Y.K. A Systematic Review of Citations of UTAUT2 Article and Its Usage Trends. Conf. e-Bus. e-Serv. e-Soc. 2017, 10595, 38–49. [Google Scholar] [Green Version]
  24. Fishbein, M.; Ajzen, I. Belief, Attitude, Intention, and Behavior: An Introduction to Theory and Research. Philos. Rhetor. 1977, 10, 130–132. [Google Scholar]
  25. Davis, F.D. Perceived usefulness, perceived ease of use, and user acceptance of information technology. MIS Q. Manag. Inf. Syst. 1989, 13, 319–339. [Google Scholar] [CrossRef]
  26. Davis, F.D.; Bagozzi, R.P.; Warshaw, P.R. User Acceptance of Computer Technology: A Comparison of Two Theoretical Models. Manag. Sci. 1989, 35, 982–1003. [Google Scholar] [CrossRef]
  27. Ajzen, I. From intentions to actions: A theory of planned behavior. In Action Control: From Cognition to Behavior; Springer: Berlin, Heidelberg, 1985; pp. 11–39. [Google Scholar]
  28. Taylor, S.; Todd, P. Assessing IT Usage: The Role of Prior Experience. MIS Q. 1995, 19, 561–570. [Google Scholar] [CrossRef]
  29. Vallerand, R.J. Toward a hierarchical model of intrinsic and extrinsic motivation. In Advances in Experimental Social Psychology; Academic Press: San Diego, CA, US, 1997; Volume 29, pp. 271–360. [Google Scholar]
  30. Triandis, H.C. Interpersonal Behavior; Brooks/Cole Pub. Co.: Baltimore, MD, USA, 1977. [Google Scholar]
  31. Rogers, E.M. Diffusion of Innovations, 5th ed.; Free Press: Detroit, MI, USA, 2003. [Google Scholar]
  32. Bandura, A. Social Foundations of Thought and Action: A Social Cognitive Theory; Prentice-Hall: Upper Saddle River, NJ, USA, 1986. [Google Scholar]
  33. Bhuasiri, W.; Zo, H.; Lee, H.; Ciganek, A.P. User Acceptance of e-government Services: Examining an e-tax Filing and Payment System in Thailand. Inf. Technol. Dev. 2016, 22, 672–695. [Google Scholar] [CrossRef]
  34. Awuah, L.J. An Empirical Analysis of Citizens’ Acceptance Decisions of Electronic-Government Services: A Modification of the Unified Theory of Acceptance and Use of Technology (UTAUT) Model to Include Trust as a Basis for Investigation. Ph.D. Thesis, Capella University, Ann Arbor, MI, USA, 2012. [Google Scholar]
  35. Di Pietro, L.; Guglielmetti Mugion, R.; Mattia, G.; Renzi, M.F.; Toni, M. The Integrated Model on Mobile Payment Acceptance (IMMPA): An empirical application to public transport. Trans. Res. Part C Emerg. Technol. 2015, 56, 463–479. [Google Scholar] [CrossRef]
  36. Zhou, T.; Lu, Y.; Wang, B. Integrating TTF and UTAUT to explain mobile banking user adoption. Comput. Hum. Behav. 2010, 26, 760–767. [Google Scholar] [CrossRef]
  37. Wu, M.-Y.; Yu, P.-Y.; Weng, Y.-C. A study on user behavior for i pass by UTAUT: Using taiwan’s MRT as an example. Asia Pac. Manag. Rev. 2012, 17, 91–111. [Google Scholar]
  38. Zeithaml, V.A. Consumer perceptions of price, quality, and value: A means-end model and synthesis of evidence. J. Mark. 1988, 52, 2–22. [Google Scholar] [CrossRef]
  39. Sweeney, J.C.; Soutar, G.N. Consumer perceived value: The development of a multiple item scale. J. Retail. 2001, 77, 203–220. [Google Scholar] [CrossRef]
  40. Petrick, J.F. Development of a multi-dimensional scale for measuring the perceived value of a service. J. Leis. Res. 2002, 34, 119–134. [Google Scholar] [CrossRef]
  41. McDougall, G.H.; Levesque, T. Customer satisfaction with services: Putting perceived value into the equation. J. Serv. Mark. 2000, 14, 392–410. [Google Scholar] [CrossRef]
  42. Lovelock, C.H. Service Marketing, 4th ed.; Prentice Hall International: Upper Saddle River, NJ, USA, 2000. [Google Scholar]
  43. Wen, C.-H.; Lan, L.; Cheng, H.-L. Structural equation modeling to determine passenger loyalty toward intercity bus services. Trans. Res. Rec. J. Trans. Res. Board 2005, 1927, 249–255. [Google Scholar] [CrossRef]
  44. Jen, W.; Tu, R.; Lu, T. Managing passenger behavioral intention: An integrated framework for service quality, satisfaction, perceived value, and switching barriers. Transportation 2011, 38, 321–342. [Google Scholar] [CrossRef]
  45. Sumaedi, S.; Bakti, I.G.M.Y.; Yarmen, M. The empirical study of public transport passengers’behavioral intentions: The roles of service quality, perceived sacrifice, perceived value, and satisfaction (case study: Paratransit passengers in jakarta, indonesia). Int. J. Traffic Trans. Eng. 2012, 2, 83–97. [Google Scholar]
  46. Berry, L.L.; Seiders, K.; Grewal, D. Understanding service convenience. J. Mark. 2002, 66, 1–17. [Google Scholar] [CrossRef]
  47. Yoon, C.; Kim, S. Convenience and TAM in a ubiquitous computing environment: The case of wireless LAN. Electron. Commer. Res. Appl. 2007, 6, 102–112. [Google Scholar] [CrossRef]
  48. Colwell, S.R.; Aung, M.; Kanetkar, V.; Holden, A.L. Toward a measure of service convenience: Multiple-item scale development and empirical test. J. Serv. Mark. 2008, 22, 160–169. [Google Scholar] [CrossRef]
  49. Liu, F.; Zhao, X.; Chau, P.Y.; Tang, Q. Roles of perceived value and individual differences in the acceptance of mobile coupon applications. Internet Res. 2015, 25, 471–495. [Google Scholar] [CrossRef]
  50. Dodds, W.B.; Monroe, K.B.; Grewal, D. Effects of Price, Brand, and Store Information on Buyers’ Product Evaluations. J. Mark. Res. 1991, 28, 307–319. [Google Scholar]
  51. Gupta, A.; Dogra, N.; George, B. What determines tourist adoption of smartphone apps?: An analysis based on the UTAUT-2 framework. J. Hosp. Tour. Technol. 2018, 9, 48–62. [Google Scholar] [CrossRef]
  52. Yeow, P.H.P.; Loo, W.H. Acceptability of ATM and Transit Applications Embedded in Multipurpose Smart Identity Card: An Exploratory Study in Malaysia. Int. J. Electron. Gov. Res. 2009, 5, 37–56. [Google Scholar] [CrossRef]
  53. Cohen, J. Statistical Power Analysis for the Behavioral Sciences, 2nd ed.; Erlbaum Associates: Hillsdale, MI, USA, 1988. [Google Scholar]
  54. Ringle, C.M. SmartPLS 2.0 (M3). Available online: http://www.smartpls.de (accessed on 2 December 2018).
  55. Chin, W.W. The partial least squares approach to structural equation modeling. Mod. Methods Bus. Res. 1998, 295, 295–336. [Google Scholar]
  56. Hair Jr, J.F.; Hult, G.T.M.; Ringle, C.; Sarstedt, M. A Primer on Partial Least Squares Structural Equation Modeling (PLS-SEM); Sage Publications: Thousand Oaks, CA, USA, 2016. [Google Scholar]
  57. Cronbach, L.J. Coefficient alpha and the internal structure of tests. Psychometrika 1951, 16, 297–334. [Google Scholar] [CrossRef] [Green Version]
  58. Henseler, J.; Hubona, G.; Ray, P.A. Using PLS path modeling in new technology research: Updated guidelines. Ind. Manag. Data Syst. 2016, 116, 2–20. [Google Scholar] [CrossRef]
  59. Fornell, C.; Larcker, D.F. Evaluating structural equation models with unobservable variables and measurement error. J. Mark. Res. 1981, 18, 39–50. [Google Scholar] [CrossRef]
  60. Efron, B.; Tibshirani, R.J. An Introduction to the Bootstrap; CRC Press: Boca Raton, FL, USA, 1994. [Google Scholar]
  61. Loo, W.H.; Yeow, P.H.P.; Chong, S.C. User acceptance of Malaysian government multipurpose smartcard applications. Gov. Inf. Q. 2009, 26, 358–367. [Google Scholar] [CrossRef]
  62. Eyuboğlu, K.; Sevim, U. Determinants of Contactless Credit Cards Acceptance in Turkey. Int. J. Manag. Econ. Bus. 2017, 13, 331–346. [Google Scholar] [CrossRef]
  63. Loo, W.H.; Yeow, P.H.P.; Chong, S.C.C. Acceptability of Multipurpose Smart National Identity Card: An Empirical Study. J. Glob. Inf. Technol. Manag. 2011, 14, 35–58. [Google Scholar] [CrossRef]
  64. Escobar-Rodríguez, T.; Carvajal-Trujillo, E. Online drivers of consumer purchase of website airline tickets. J. Air Trans. Manag. 2013, 32, 58–64. [Google Scholar] [CrossRef]
Figure 1. The proposed research model.
Behavsci 09 00046 g001
Figure 2. Standardised path coefficients. (Note: * indicate the significant at the p < 0.05 level.)
Behavsci 09 00046 g002
Table 1. Demographic characteristic of the respondents.
DemographicsItemsFrequencyPercentage (%)
GenderMale11529.6
Female27370.4
AgeBelow 1710.26
17–24317.99
25–3521154.38
36–4510527.06
46–55246.19
56–64153.87
Above 6510.26
EducationMiddle school20.52
High school41.03
Diploma51.29
Bachelor’s Degree18848.45
Above Bachelor’s Degree18948.71
OccupationStudent225.67
Government Officer13434.54
Company Employee17144.07
Business Owner/Freelance4311.08
Housewife143.61
Others41.03
Personal income
Baht per month
(USD.)
Less than 10,000 Baht (312 USD.)205.15
* Note 1 USD = 32 Baht10,000–15,000 Baht (312–469 USD.)266.70
15,001–25,000 Baht (469–781 USD.)10627.32
25,001–35,000 Baht (781–1093 USD.)9825.26
35,001–50,000 Baht (1093–1562 USD.)7619.59
More than 50,000 Baht (1562 USD.)6215.98
Usage experience>0 and <3–5 times37997.68
(times per week)≥3–5 times92.32
Total = 388
Table 2. Results of all item loadings, reliability and convergent validity testing.
ConstructItemsLoadingsCronbach’s AlphaCRAVE
Performance expectancyPE10.8630.8720.9120.722
PE20.855
PE30.844
PE40.837
Effort expectancyEE10.8650.8160.8910.732
EE20.882
EE30.818
Facilitating conditionsFC10.8410.7750.8670.686
FC20.784
FC30.857
Social influenceSI10.9070.7890.8450.647
SI20.747
SI30.748
Perceived conveniencePC10.8240.8800.9170.735
PC20.856
PC30.892
PC40.856
Perceived sacrificePS10.7240.7490.8570.667
PS20.863
PS30.856
Perceived valuePV10.8170.8910.9240.754
PV20.871
PV30.915
PV40.868
Intention to useIU10.8900.9300.9470.781
IU20.912
IU30.894
IU40.863
IU50.858
Notes: CR = composite reliability; AVE = average variance extracted
Table 3. Discriminant validity statistics of each construct.
ConstructsPEEEFCSIPCPSPVIUMean (S.D.)
PE0.850
EE0.6030.855
FC0.4790.4770.829
SI0.3840.3930.4950.800
PC0.7510.5990.5650.4300.857
PS−0.580−0.497−0.482−0.464−0.6550.817
PV0.6120.5600.5340.5310.691−0.7590.868
IU0.6760.5580.5270.4650.772−0.6650.7580.884
Note: The average variance extracted (AVE) values for each latent construct are denoted by the underlined values on the diagonal, while the measures under the diagonal signify squared inter-construct correlations.
Table 4. Structural estimates and hypotheses testing results.
PathsStandard
Coefficient (β)
t-ValueResult
H1: PE → IU0.2924.972Supported
H2: EE → IU0.0591.328Not supported
H3: EE → PE0.5369.279Supported
H4: FC → IU0.0862.107Supported
H5: SI → IU0.0320.814Not supported
H6: PC → PV0.3407.130Supported
H7: PS → PV-0.53611.696Supported
H8: PV → IU0.4829.511Supported

