Visual Perception of Facial Emotional Expressions during Saccades


Abstract
:1. Introduction
2. Materials and Methods
2.1. Apparatus
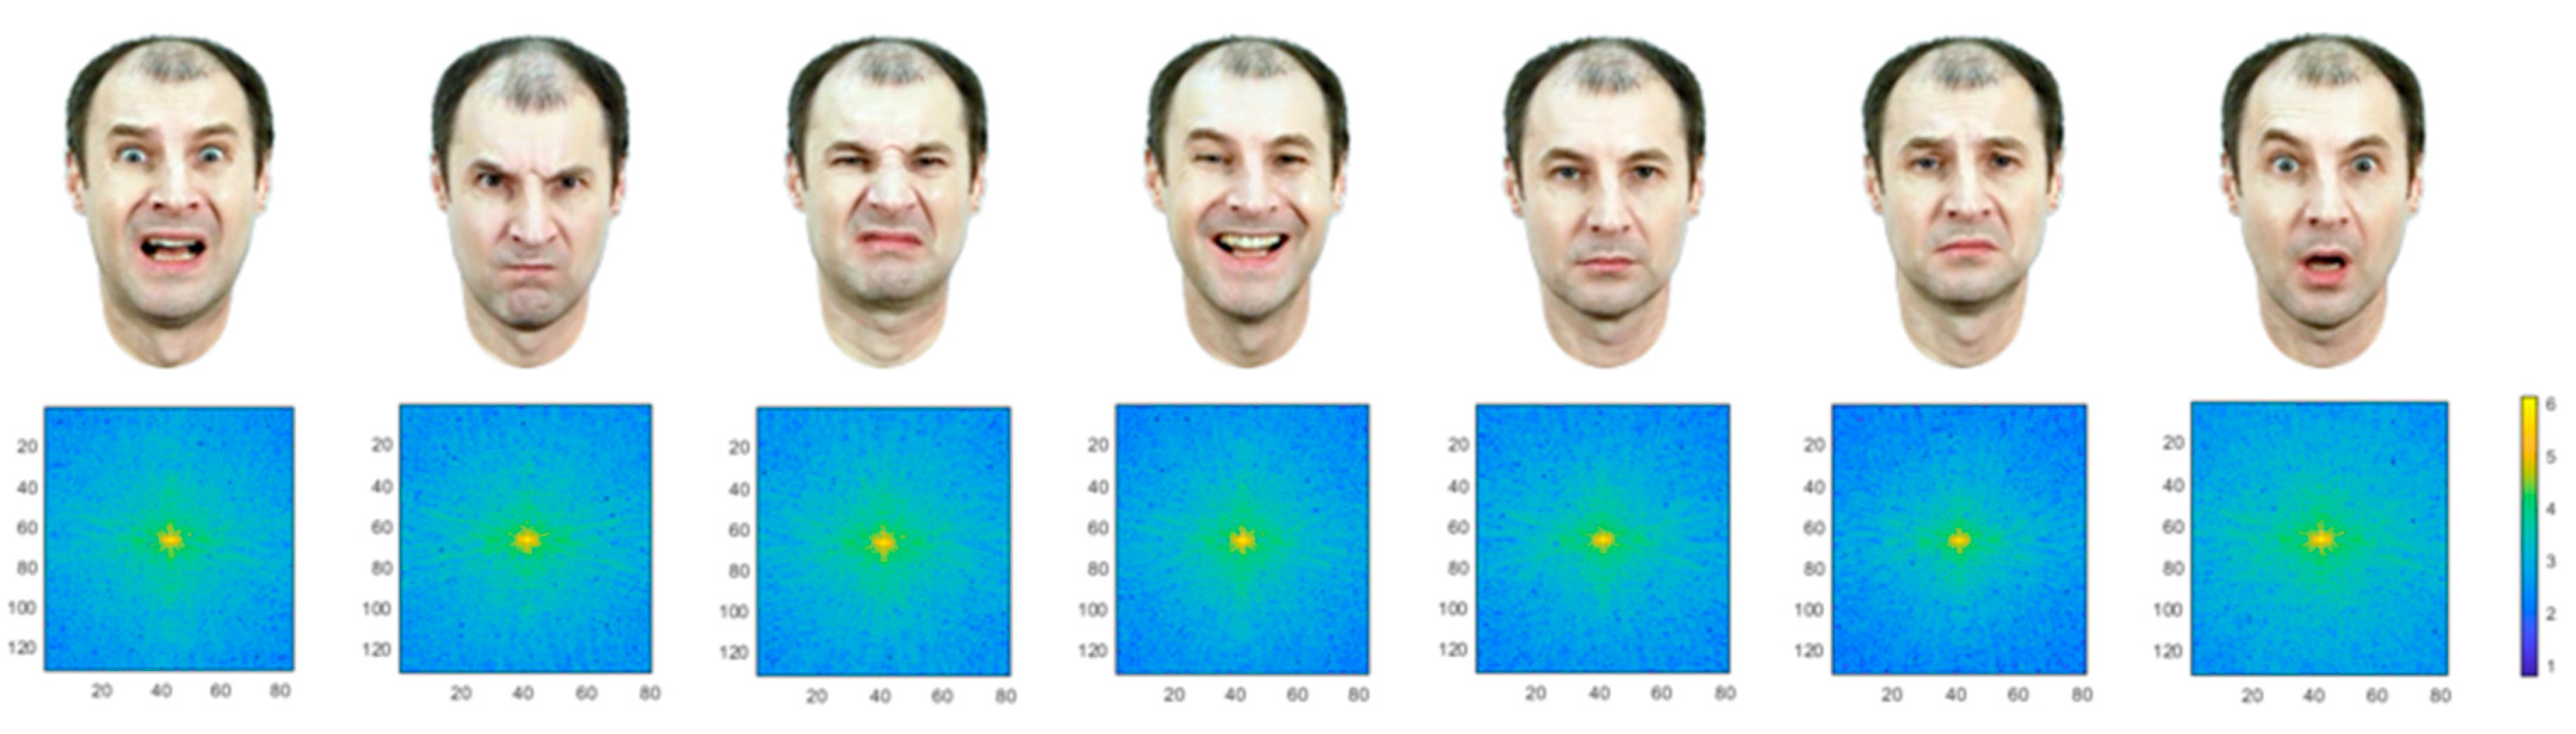
2.2. Photo Database
2.3. Participants
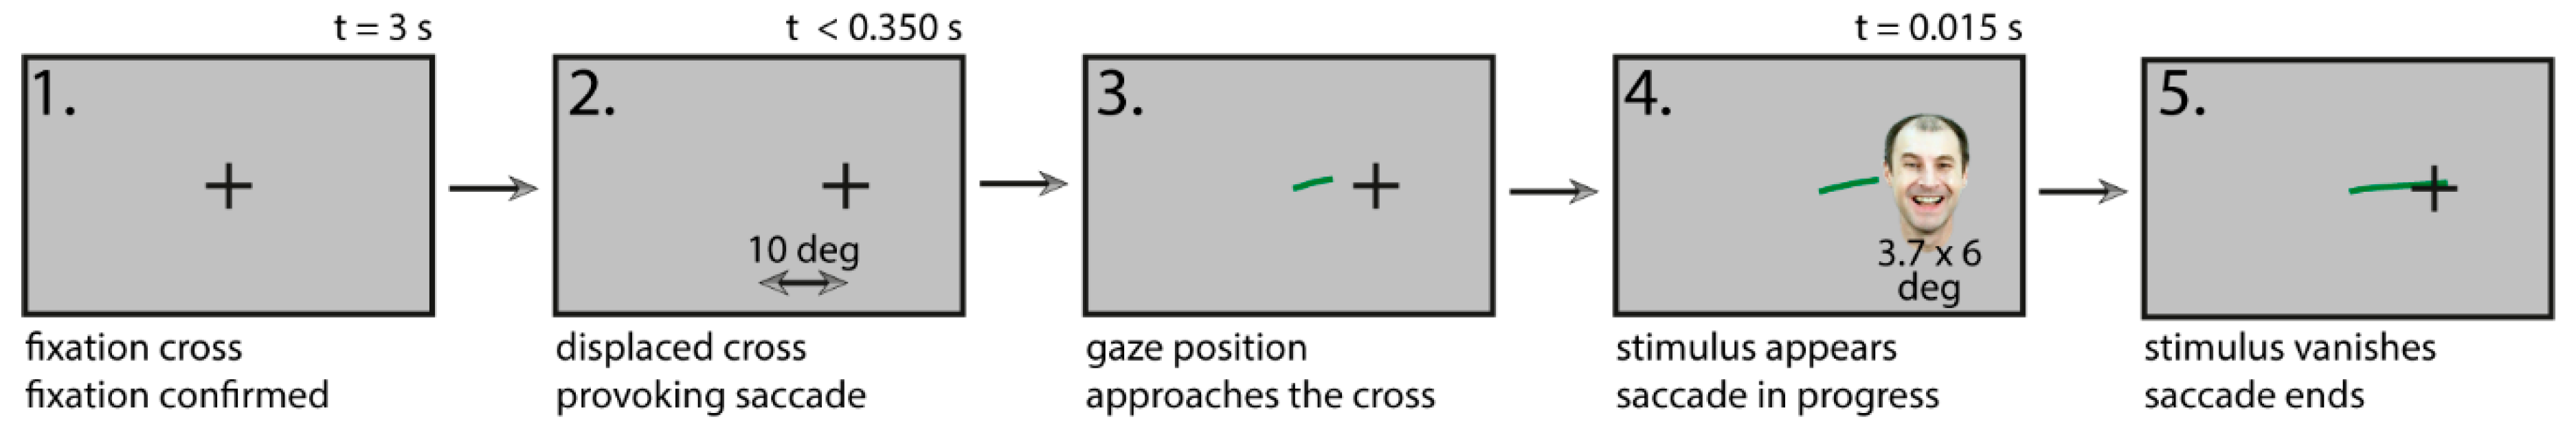
2.4. Procedure
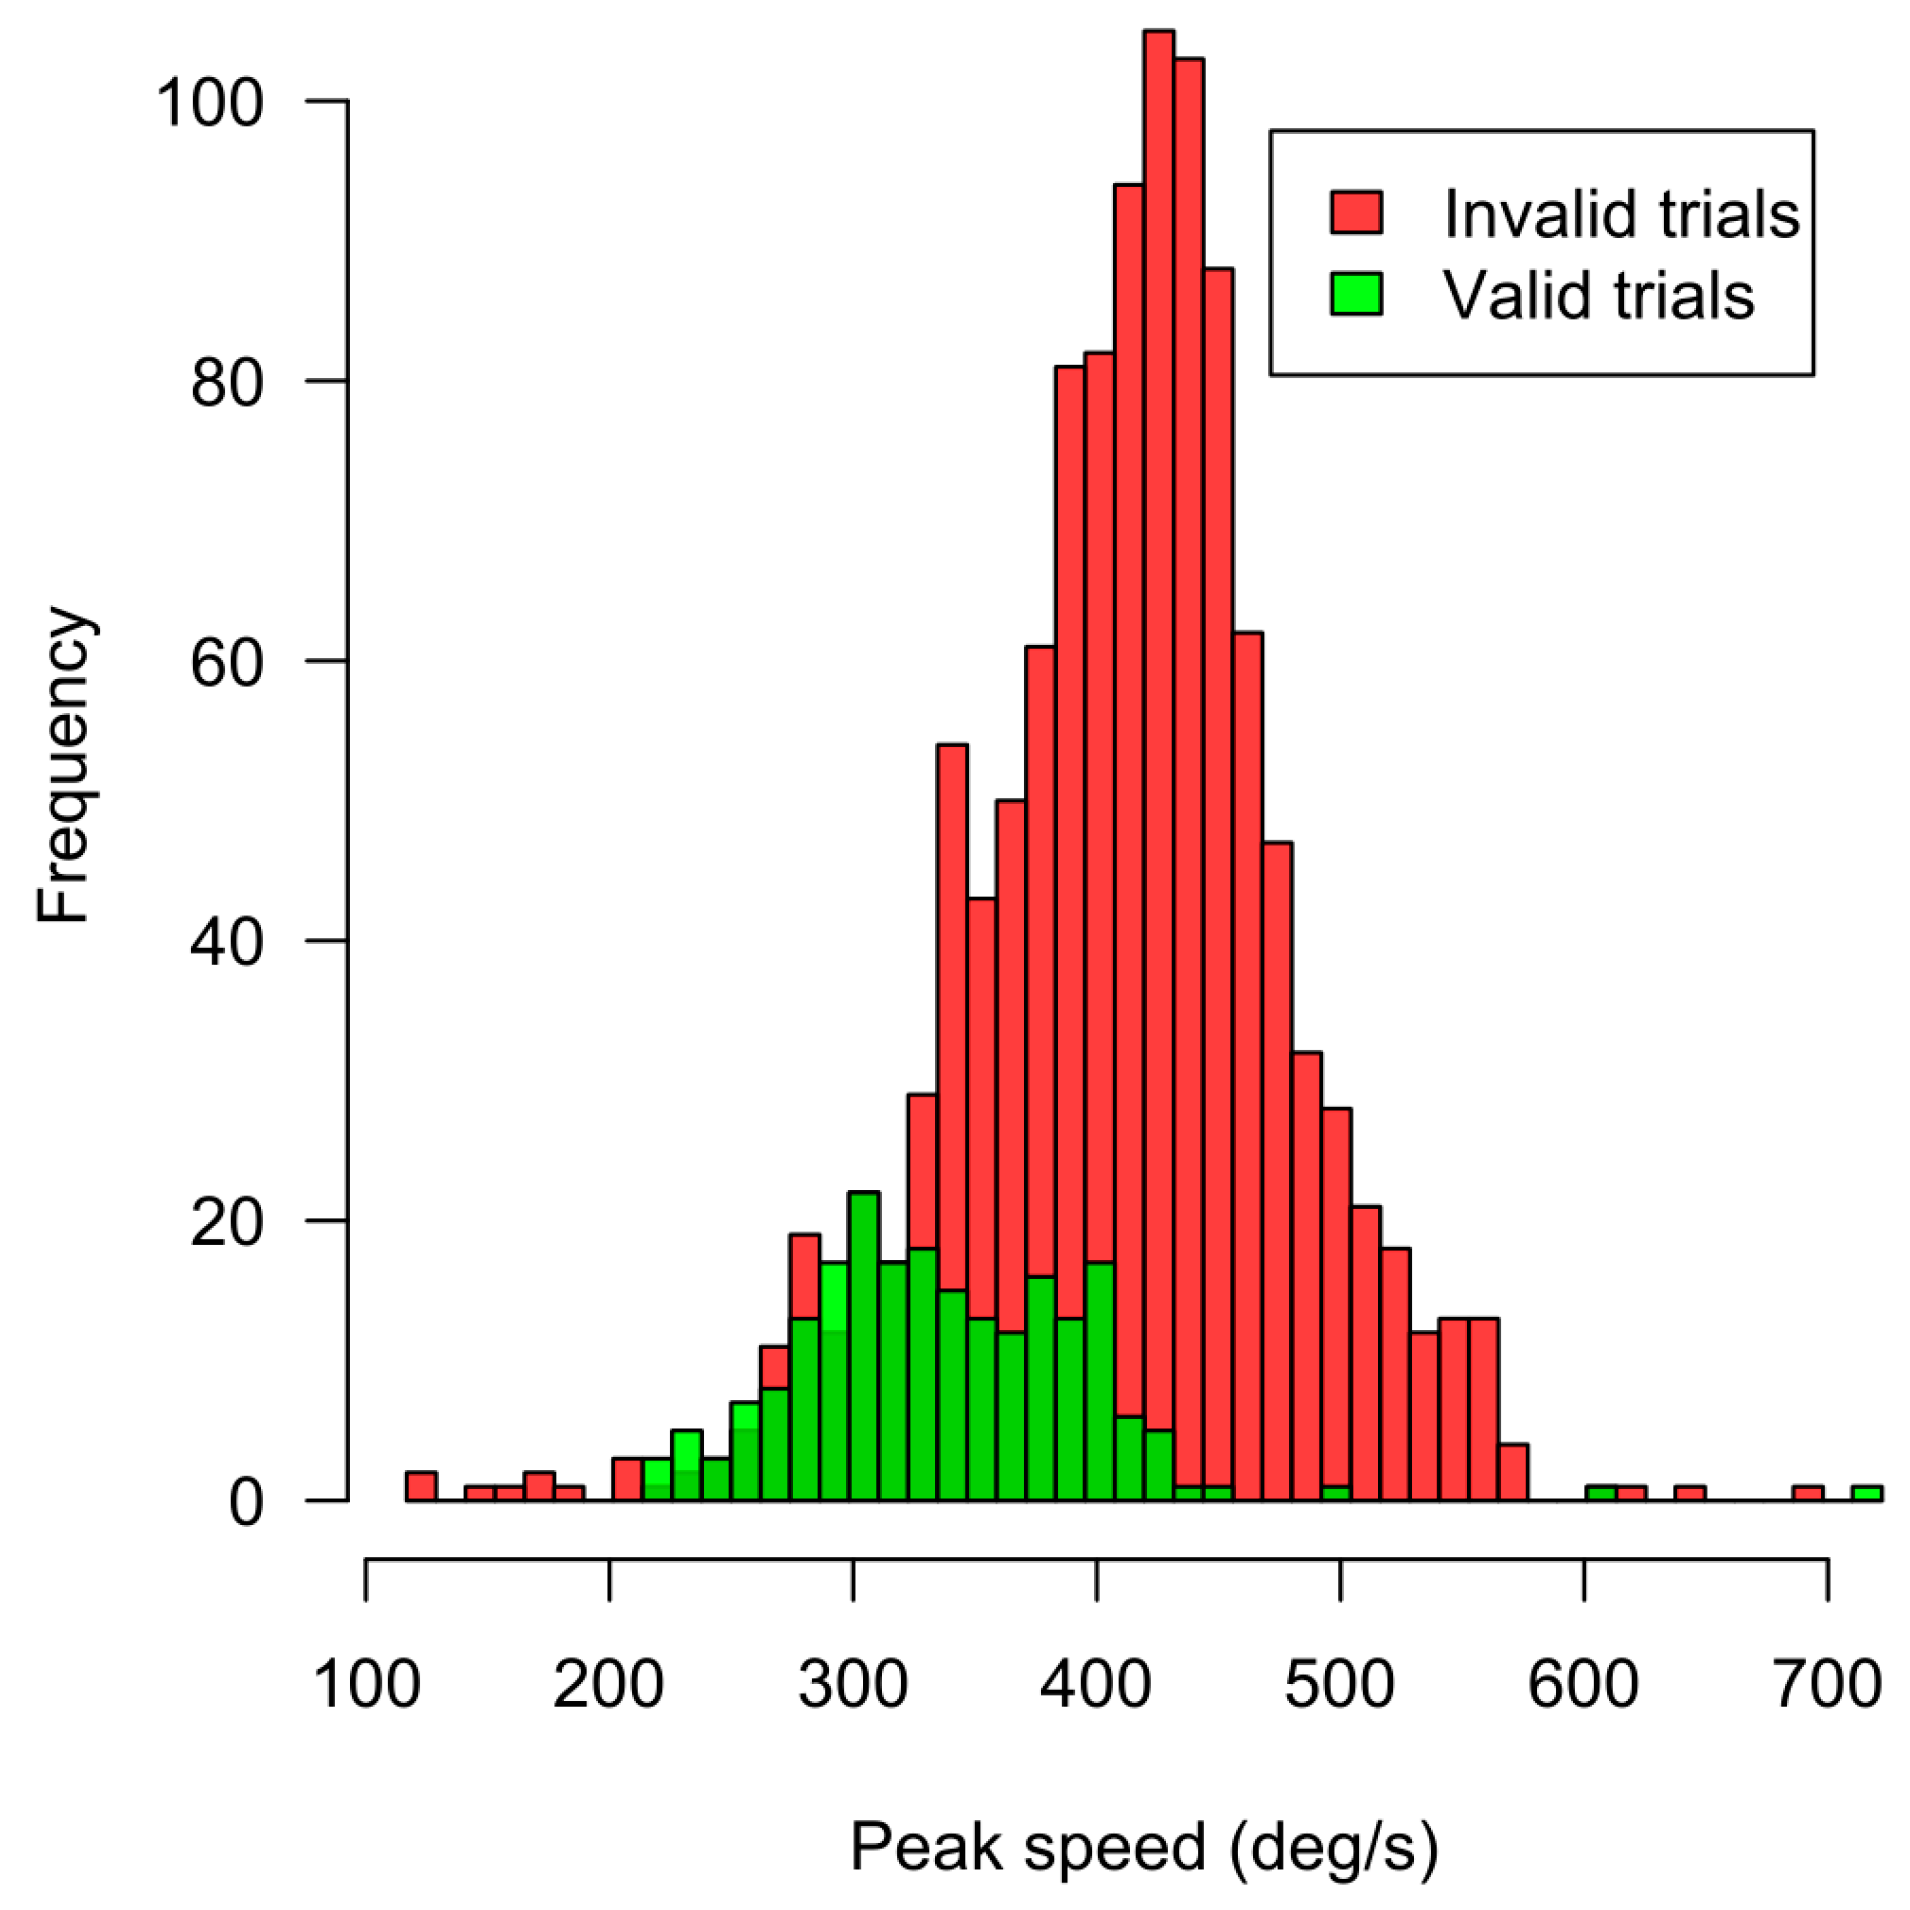
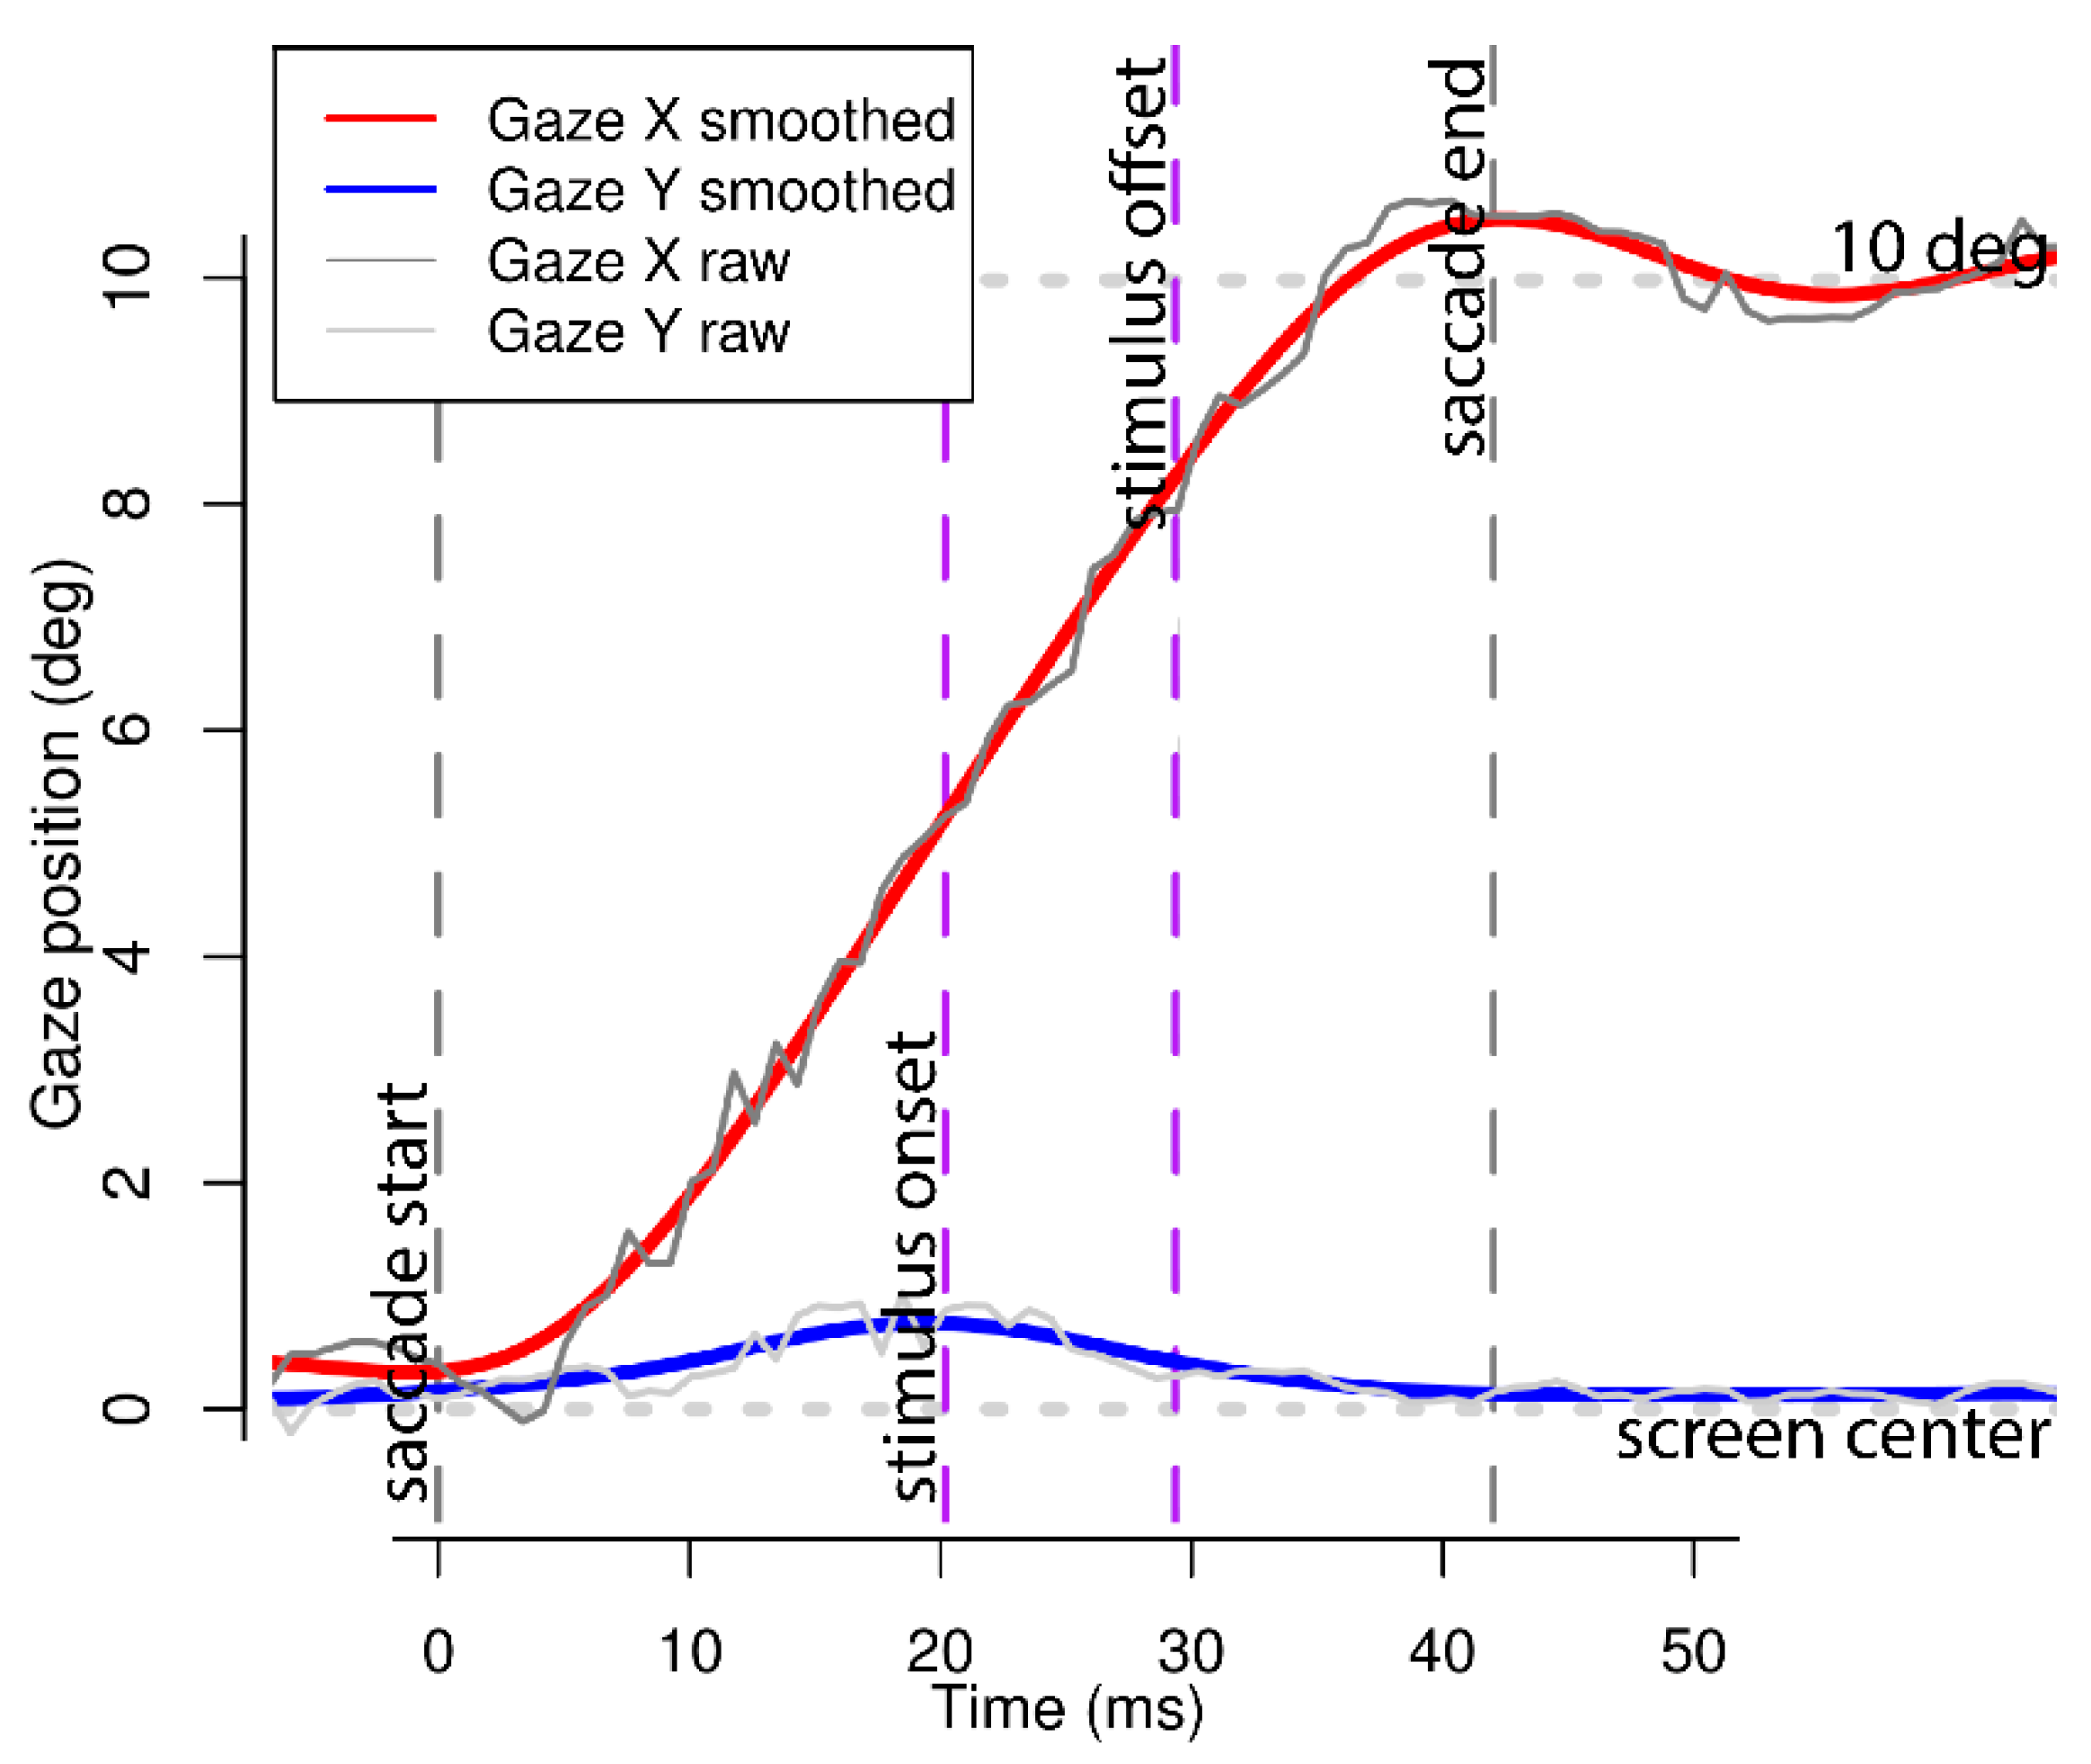
2.5. Data Validity
3. Results
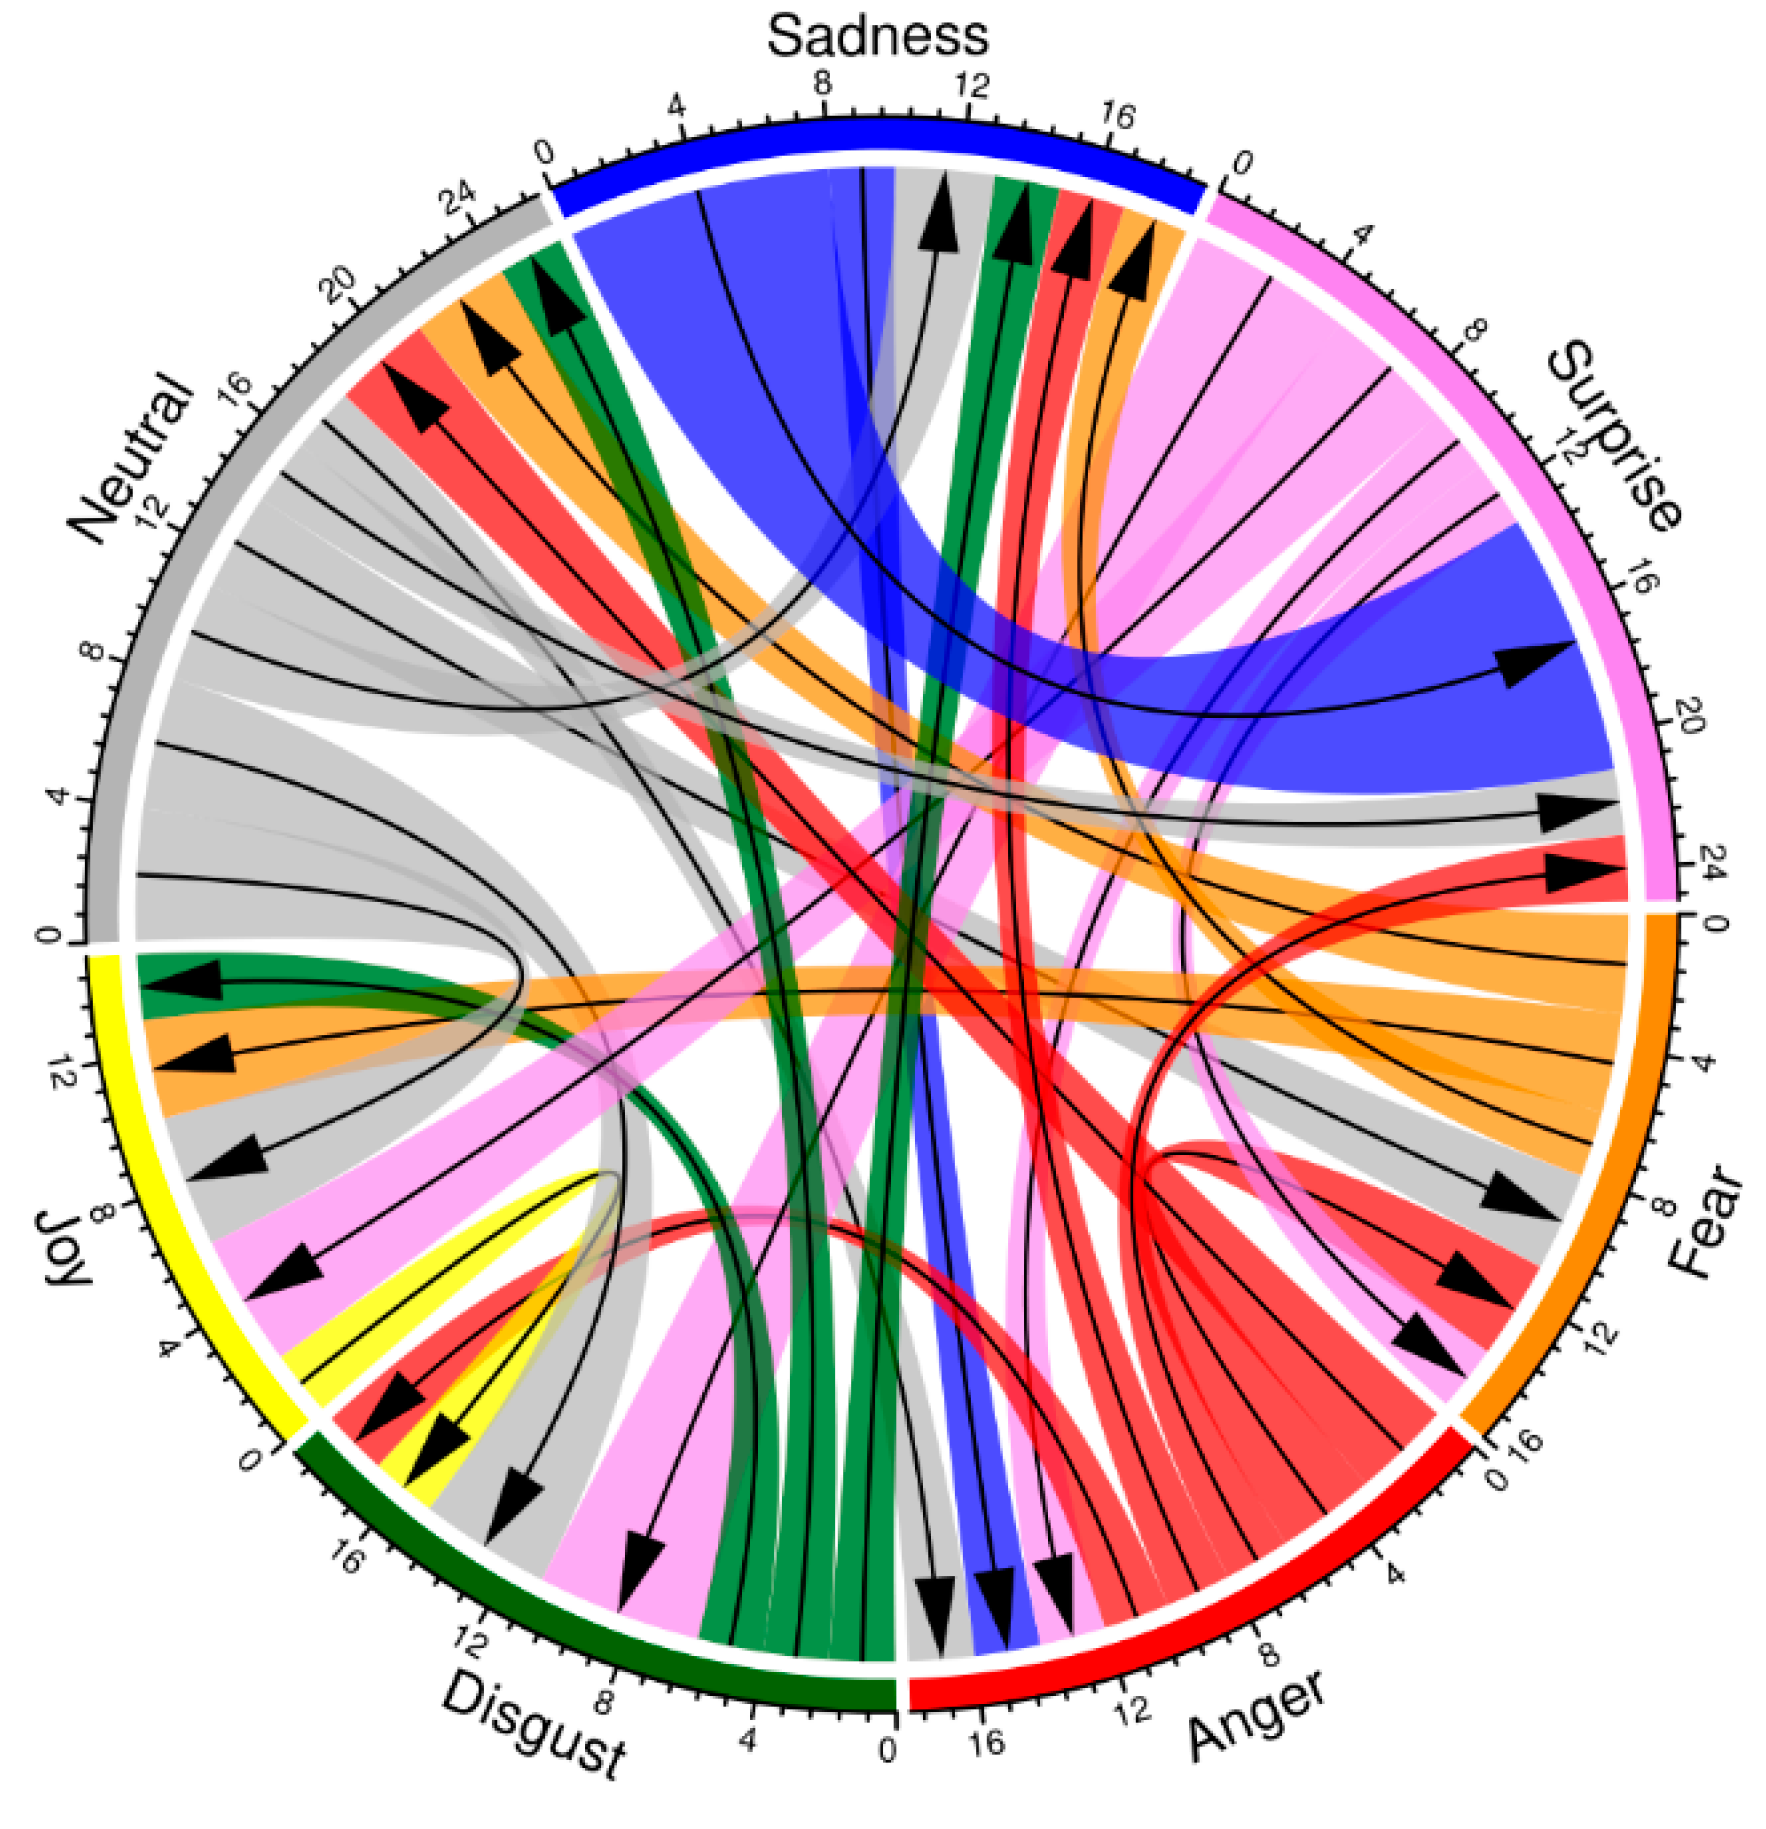
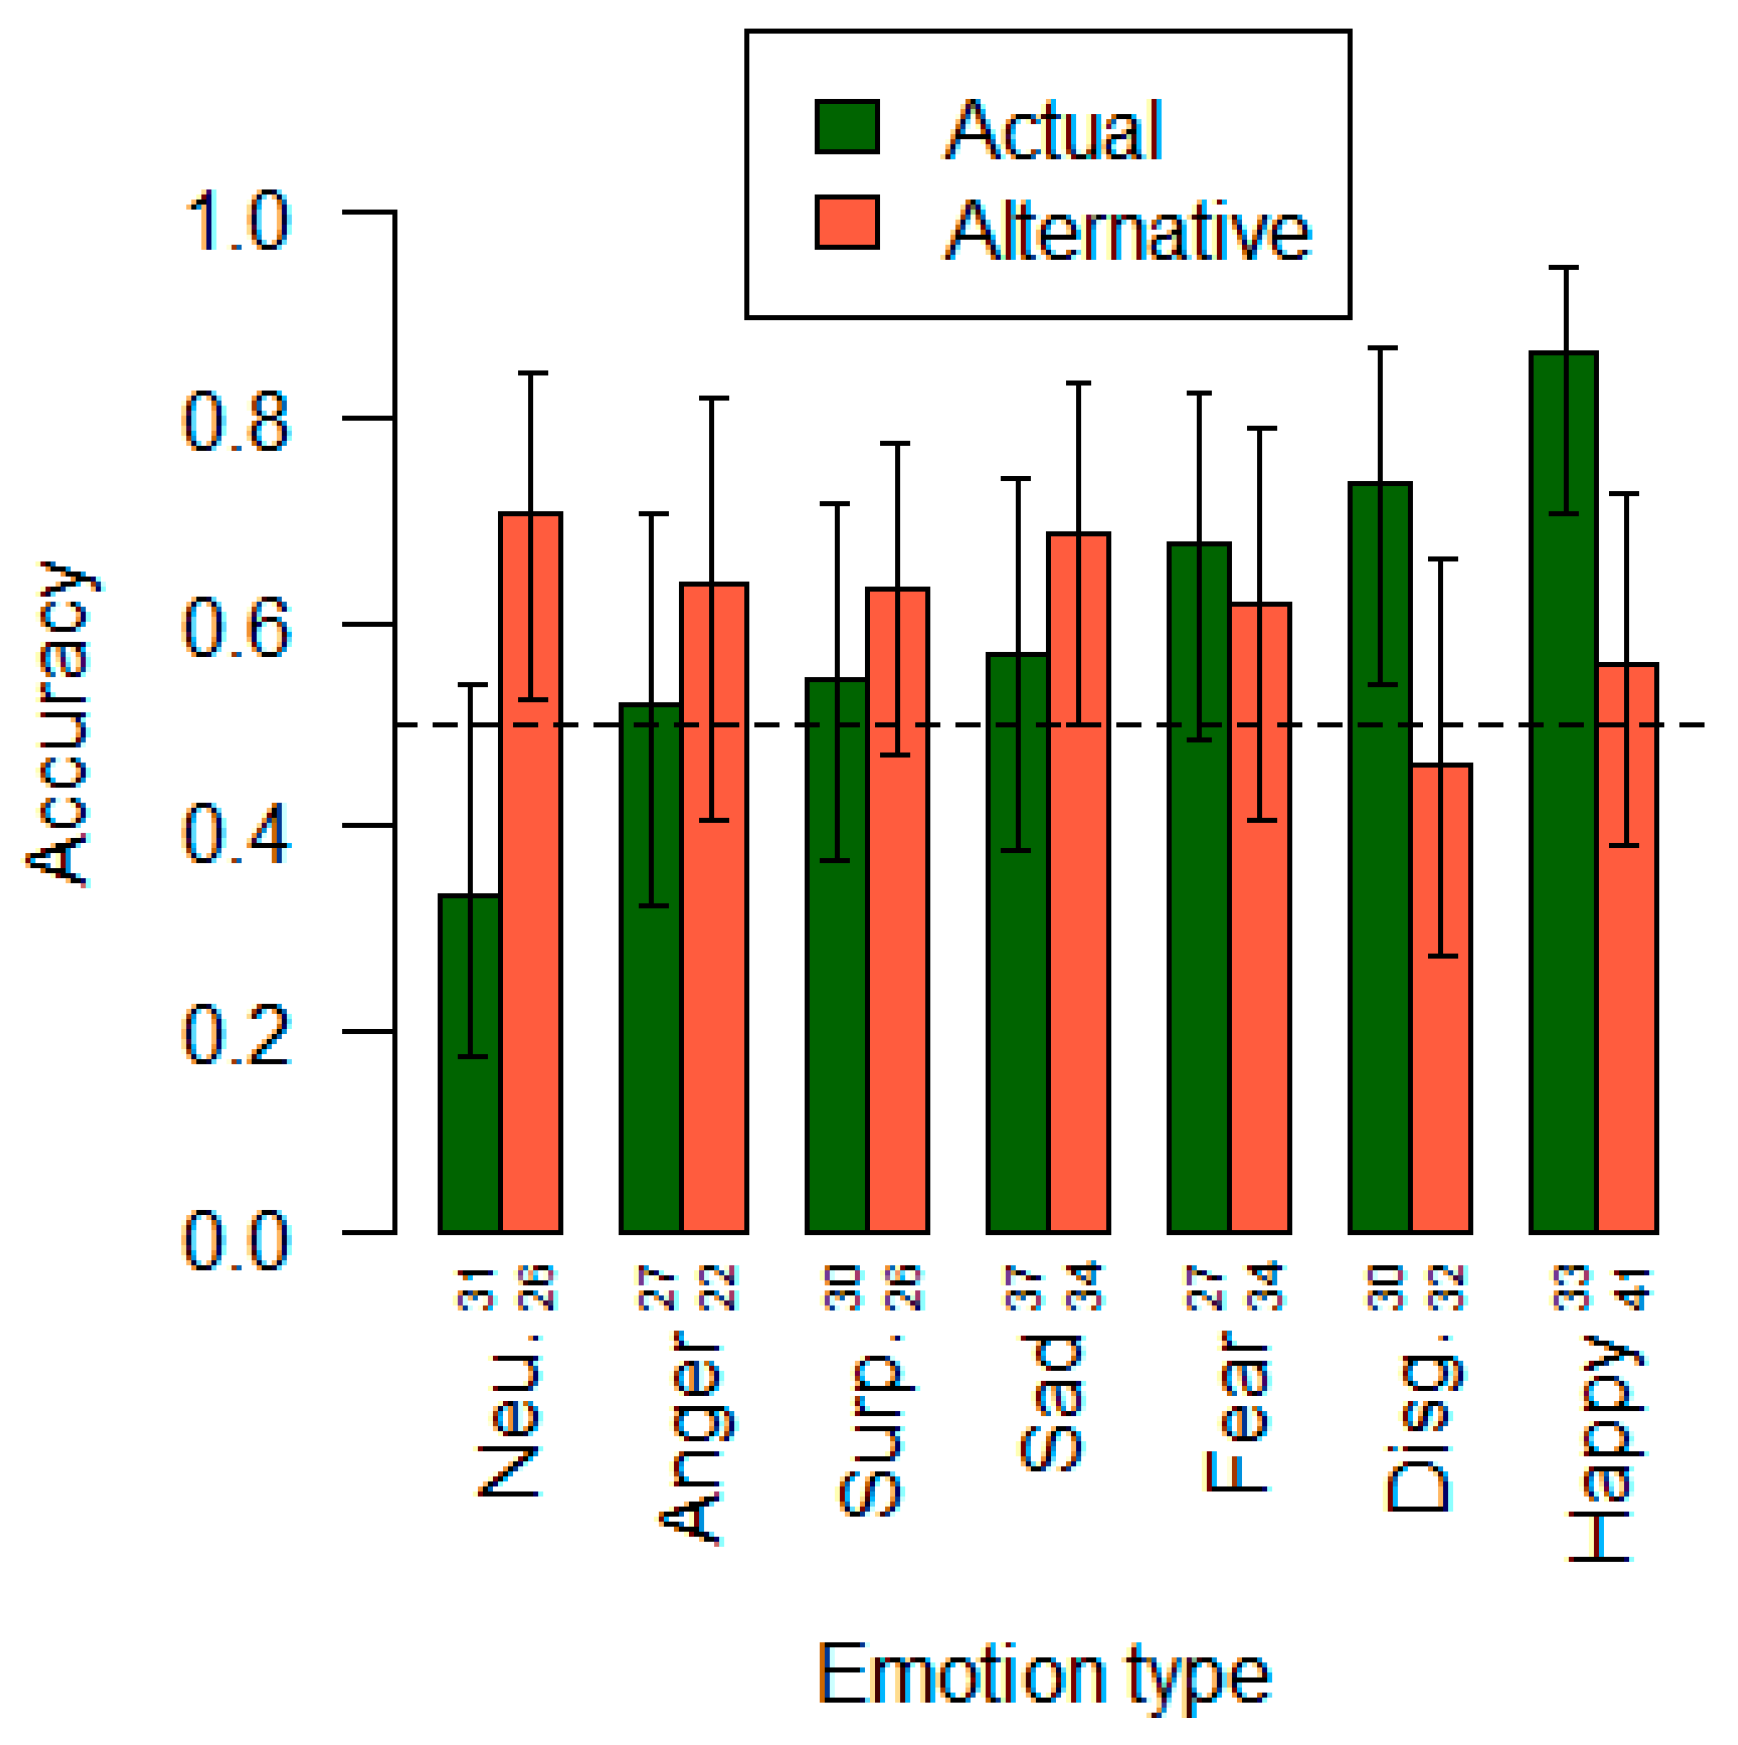
3.1. The Accuracy of Modality Identification in Facial Expression Stimuli
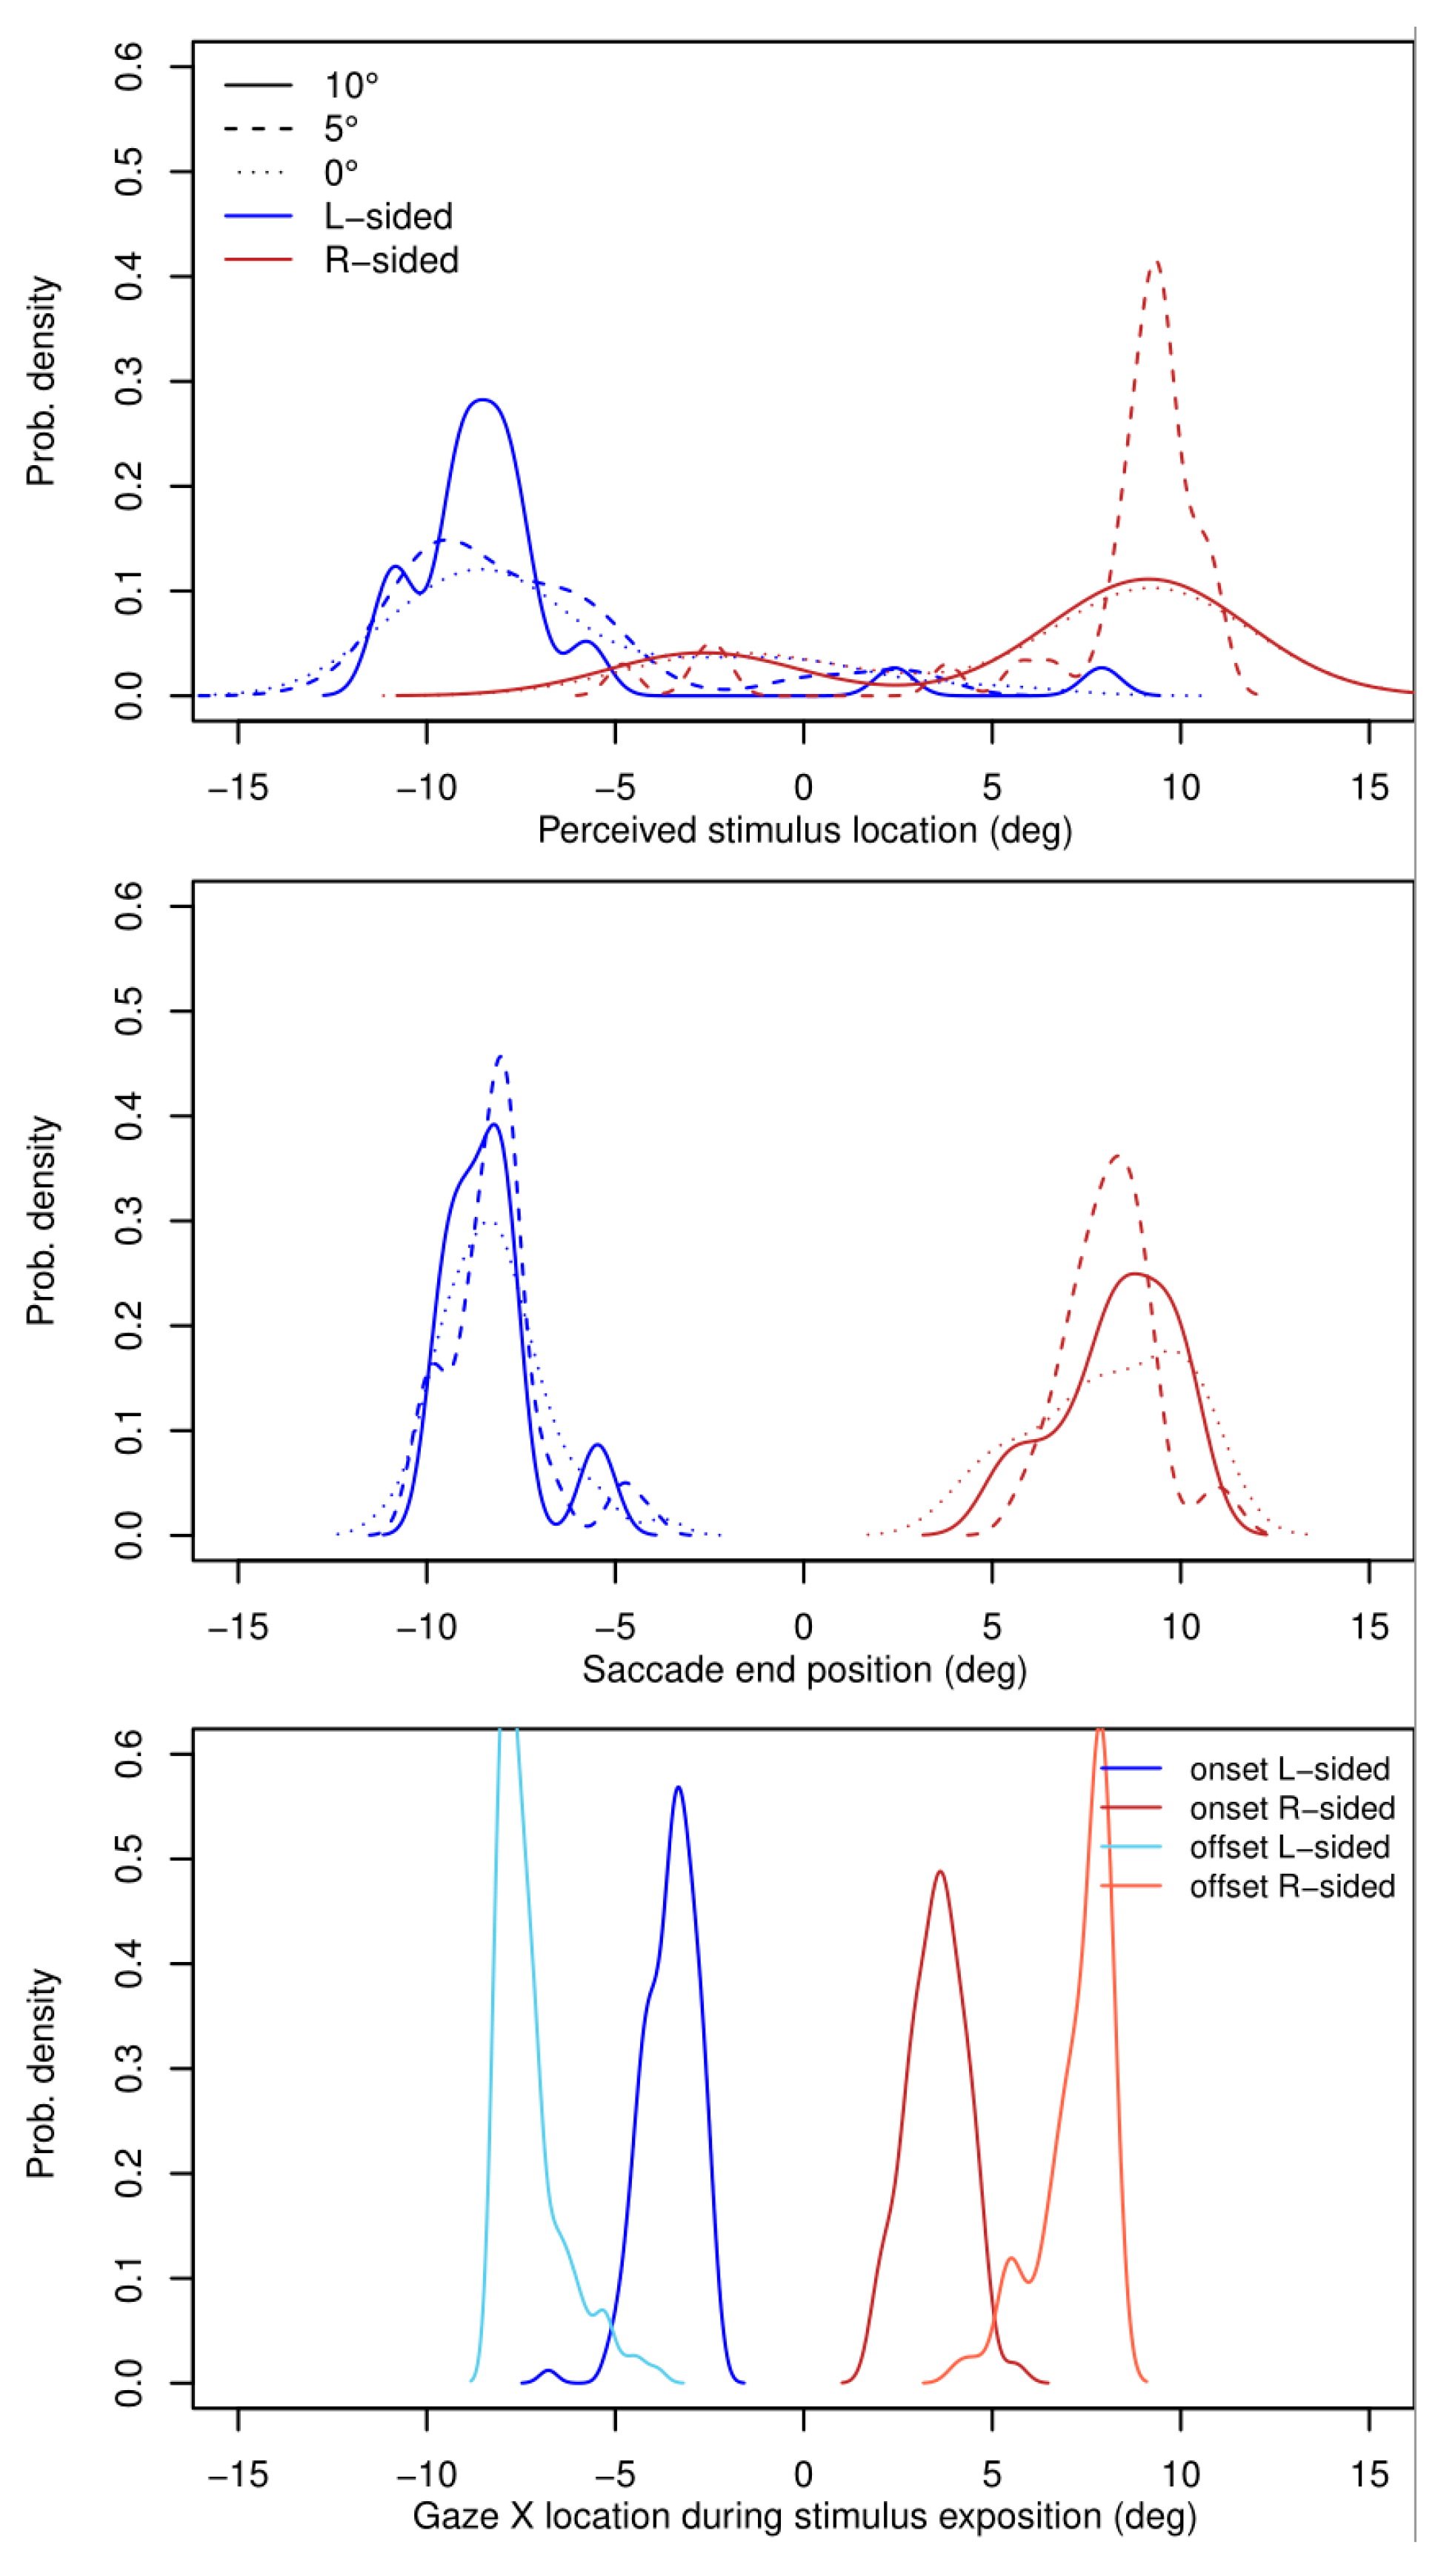
3.2. Perceived Localization of Face Images
4. Discussion
5. Conclusions
Author Contributions
Funding
Acknowledgments
Conflicts of Interest
References
- Latour, P.L. Visual threshold during eye movements. Vis. Res. 1962, 2, 261–262. [Google Scholar] [CrossRef]
- Volkmann, F.; Schick, A.; Riggs, L. Time course of visual inhibition during voluntary saccades. J. Opt. Soc. Am. 1968, 58, 562–569. [Google Scholar] [CrossRef] [PubMed]
- Zuber, B.L.; Stark, L. Saccadic suppression. Elevation of visual threshold associated with saccadic eye movements. Exp. Neurol. 1966, 16, 65–79. [Google Scholar] [CrossRef]
- Mitrani, L. Saccadic Eye Movements; BAN: Sofia, Bulgaria, 1973. [Google Scholar]
- Brooks, B.A.; Fuchs, A.F. Influence of stimulus parameters on visual sensitivity during saccadic eye movement. Vis. Res. 1975, 15, 1389–1398. [Google Scholar] [CrossRef]
- Campbell, F.W.; Wurtz, R.H. Saccadic omission: Why we do not see a grey-out during a saccadic eye movement. Vis. Res. 1978, 18, 1297–1303. [Google Scholar] [CrossRef]
- Cavanagh, P.; Hunt, A.R.; Afraz, A. Visual stability based on remapping of attention pointers. Trends Cogn. Sci. 2010, 14, 147–153. [Google Scholar] [CrossRef]
- Honda, H. Perceptual localization of visual stimuli flashed during saccades. Percept. Psychophys. 1989, 46, 162–174. [Google Scholar] [CrossRef]
- Ross, J.; Moroon, M.C.; Goldberg, M.E. Changes in visual perception at the time of saccades. Trends Neurosci. 2001, 24, 113–121. [Google Scholar] [CrossRef]
- Zherdev, I.Y.; Barabanschikov, V.A. Hardware-software system for study of complex images’ visual perception during saccadic eye movements in man. Exp. Psychol. 2014, 7, 123–131. [Google Scholar]
- Kurakova, O.A. Creating a new photo library of natural transitions between the basic emotional face expressions. In Human Face as a Means of Communication: Interdisciplinary Approach; Barabanschikov, V.A., Demidov, A.A., Diveev, D.A., Eds.; Kogito-Center: Moscow, Russia, 2012; pp. 287–309. [Google Scholar]
- Komogortsev, O.; Gobert, D.; Jayarathna, S.; Koh, D.; Gowda, S. Standartization of automated analyses of oculomotor fixation and saccadic behaviors. IEEE Trans. Biomed. Eng. 2010, 57, 2635–2645. [Google Scholar] [CrossRef]
- Barabanschikov, V.A. Perception of Face Expressions; Institute of Psychology RAS: Moscow, Russia, 2009. [Google Scholar]
- Barabanschikov, V.A. Face Expressions and Their Perception; Institute of Psychology RAS: Moscow, Russia, 2012. [Google Scholar]
- Izard, K. Psychology of Emotions; Piter: Saint-Petersburg, Russia, 2000. [Google Scholar]
- Ekman, P.; Friesen, U. Know a Liar by Their Face; Piter: Saint-Petersburg, Russia, 2010. [Google Scholar]
- Barabanschikov, V.A. Perception and Event; Aleteiia: Saint-Petersburg, Russia, 2002. [Google Scholar]
- Ekman, P. Psychological Sciences, Psychology of Deceit; Piter: Saint-Petersburg, Russia, 2010. [Google Scholar]
- Kurakova, O.A. The Effects of Categorical Perception in Transitional Face Expressions. Ph.D. Thesis, Institute of Psychology RAS, Moscow, Russia, 2013. [Google Scholar]
- Barabanschikov, V.A.; Khoze, E.G. Perception of quite face expressions. World Psychol. 2013, 1, 203–222. [Google Scholar]
- Kurakova, O.A.; Zhegallo, A.V. The effect of categorical perception of facial expressions: A diversity of manifestations. Exp. Psychol. 2012, 5, 22–38. [Google Scholar]
- Poth, C.H.; Schneider, W.X. Breaking object correspondence across saccades impairs object recognition: The role of color and luminance. J. Vis. 2016, 16, 1–12. [Google Scholar] [CrossRef] [PubMed]
- Zherdev, I.Y. Application of Adobe Flash platform in visual perception tachistoscopic studies: Hardware-software system. Neurocomp. Dev. appl. 2014, 6, 32–40. [Google Scholar]
- Honda, H. The time course of visual mislocalization and of extraretinal eye position signals at the time of vertical saccades. Vis. Res. 1991, 31, 1915–1921. [Google Scholar] [CrossRef]
- Matin, L.; Pearce, D.G. Visual perception of direction for stimuli flashed during voluntary saccadic eye movements. Science 1965, 148, 1485–1488. [Google Scholar] [CrossRef]
- Burr, D.C.; Ross, J.; Binda, P. Saccades compress space, time and number. Trends Cogn. Sci. 2010, 14, 528–533. [Google Scholar] [CrossRef]
- Lappe, M.; Awater, H.; Krekelberg, B. Postsaccadic visual references generate presaccadic compression of space. Nature 2000, 403, 892–895. [Google Scholar] [CrossRef]
- Barabanschikov, V.A.; Belopolskiy, V.I. Stability of the Visible World; Kogito-Center: Moscow, Russia, 2008. [Google Scholar]
- Hershberger, W. Saccadic eye movements and the perception of visual direction. Percept. Psychophys. 1987, 41, 35–44. [Google Scholar] [CrossRef]
- Gibson, J. The Ecological Approach to Visual Perception; Progress: Moscow, Russia, 1988. [Google Scholar]
- Gibson, J.J. The Senses Considered as Perceptual Systems; Houghton Mifflin: Boston, MA, USA, 1966. [Google Scholar]
- Warren, W.H.; Hannon, D.J. Eye movements and optical flow. J. Opt. Soc. Am. 1990, 7, 160–169. [Google Scholar] [CrossRef]
- Andreeva, E.A.; Vergiles, N.Y.; Lomov, B.F. On the functions of eye movements in the process of visual perception. Quest. Psychol. 1972, 1, 11–24. [Google Scholar]
- Andreeva, E.A.; Vergiles, N.Y.; Lomov, B.F. The mechanism of elementary eye movements as a tracking system. In Motor Components of Vision; Lomov, B.F., Vergiles, N.Y., Mitkina, A.A., Eds.; Nauka: Moscow, Russia, 1975; pp. 7–55. [Google Scholar]


| Min | Max | Mean | SD | |
|---|---|---|---|---|
| Saccade latency L-sided (ms) | 86 | 349 | 200 | 63 |
| R-sided (ms) | 92 | 334 | 194 | 66 |
| male (ms) | 86 | 349 | 182 1 | 61 |
| female (ms) | 105 | 337 | 223 1 | 59 |
| Saccade duration L-sided (ms) | 32 | 75 | 45 | 8 |
| R-sided (ms) | 30 | 65 | 44 | 7 |
| male (ms) | 30 | 75 | 45 | 8 |
| female (ms) | 32 | 65 | 43 | 7 |
| Saccade amplitude L-sided (deg) | 4.5 | 11.1 | 8.3 | 1.2 |
| R-sided (deg) | 4.9 | 14.7 | 8.1 | 1.6 |
| male (deg) | 4.6 | 11.1 | 8.3 | 1.2 |
| female (deg) | 4.5 | 14.7 | 8.1 | 1.5 |
| Peak saccade speed L-sided (deg/s) | 214.4 | 602.7 | 335.7 | 59.5 |
| R-sided (deg/s) | 219.7 | 722.2 | 338.7 | 65.0 |
| male (deg/s) | 218.6 | 494.0 | 338.7 | 48.2 |
| female (deg/s) | 214.4 | 722.2 | 333.8 | 77.6 |
| Average saccade speed L-sided (deg/s) | 87.4 | 294.7 | 190.2 | 35.0 |
| R-sided (deg/s) | 94.6 | 234.8 | 187.4 | 30.4 |
| male (deg/s) | 87.4 | 237.9 | 188.2 | 33.0 |
| female (deg/s) | 94.6 | 294.7 | 190.7 | 34.3 |
| Min | Max | % of Trials Filtered out | |
|---|---|---|---|
| Saccade latency (ms) | 75 | 20 | |
| Saccade latency (ms) | 350 | 33 | |
| Gaze X position at stimulus onset (deg) | |1.85| | 10 | |
| offset (deg) | |8.15| | 66 | |
| Stimulus duration (ms) | 6.9 1 | 2 | |
| Stimulus duration (ms) | 15.8 2 | 15 | |
| Trial invalid due to interruption for recalibration | 1 |
| Actual Stimulus Image | |||||||
|---|---|---|---|---|---|---|---|
| Fear | Anger | Disgust | Joy | Neutral | Sadness | ||
| Alternative choice image | Anger | 1.0 | |||||
| Disgust | 1.0 | 1.0 | |||||
| Happy | 1.0 | 0.11 | 1.0 | ||||
| Neutral | 0.30 | 1.0 | 0.11 | 0.0008 | |||
| Sadness | 1.0 | 1.0 | 1.0 | 0.24 | 1.0 | ||
| Surprise | 1.0 | 1.0 | 1.0 | 0.13 | 1.0 | 1.0 | |
| Actual Position | Perceived |
|---|---|
| 10 degrees left (deg) | −8.5 |
| Right (deg) | +7.9 |
| 5 degrees left (deg) | −7.8 |
| Right (deg) | +9.1 |
| Center with left-displaced target cross (deg) | −6.7 |
| Center with right-displaced target cross (deg) | +5.7 |
© 2019 by the authors. Licensee MDPI, Basel, Switzerland. This article is an open access article distributed under the terms and conditions of the Creative Commons Attribution (CC BY) license (http://creativecommons.org/licenses/by/4.0/).
Share and Cite
Barabanschikov, V.A.; Zherdev, I.Y. Visual Perception of Facial Emotional Expressions during Saccades. Behav. Sci. 2019, 9, 131. https://doi.org/10.3390/bs9120131
Barabanschikov VA, Zherdev IY. Visual Perception of Facial Emotional Expressions during Saccades. Behavioral Sciences. 2019; 9(12):131. https://doi.org/10.3390/bs9120131
Chicago/Turabian StyleBarabanschikov, Vladimir A., and Ivan Y. Zherdev. 2019. "Visual Perception of Facial Emotional Expressions during Saccades" Behavioral Sciences 9, no. 12: 131. https://doi.org/10.3390/bs9120131
APA StyleBarabanschikov, V. A., & Zherdev, I. Y. (2019). Visual Perception of Facial Emotional Expressions during Saccades. Behavioral Sciences, 9(12), 131. https://doi.org/10.3390/bs9120131