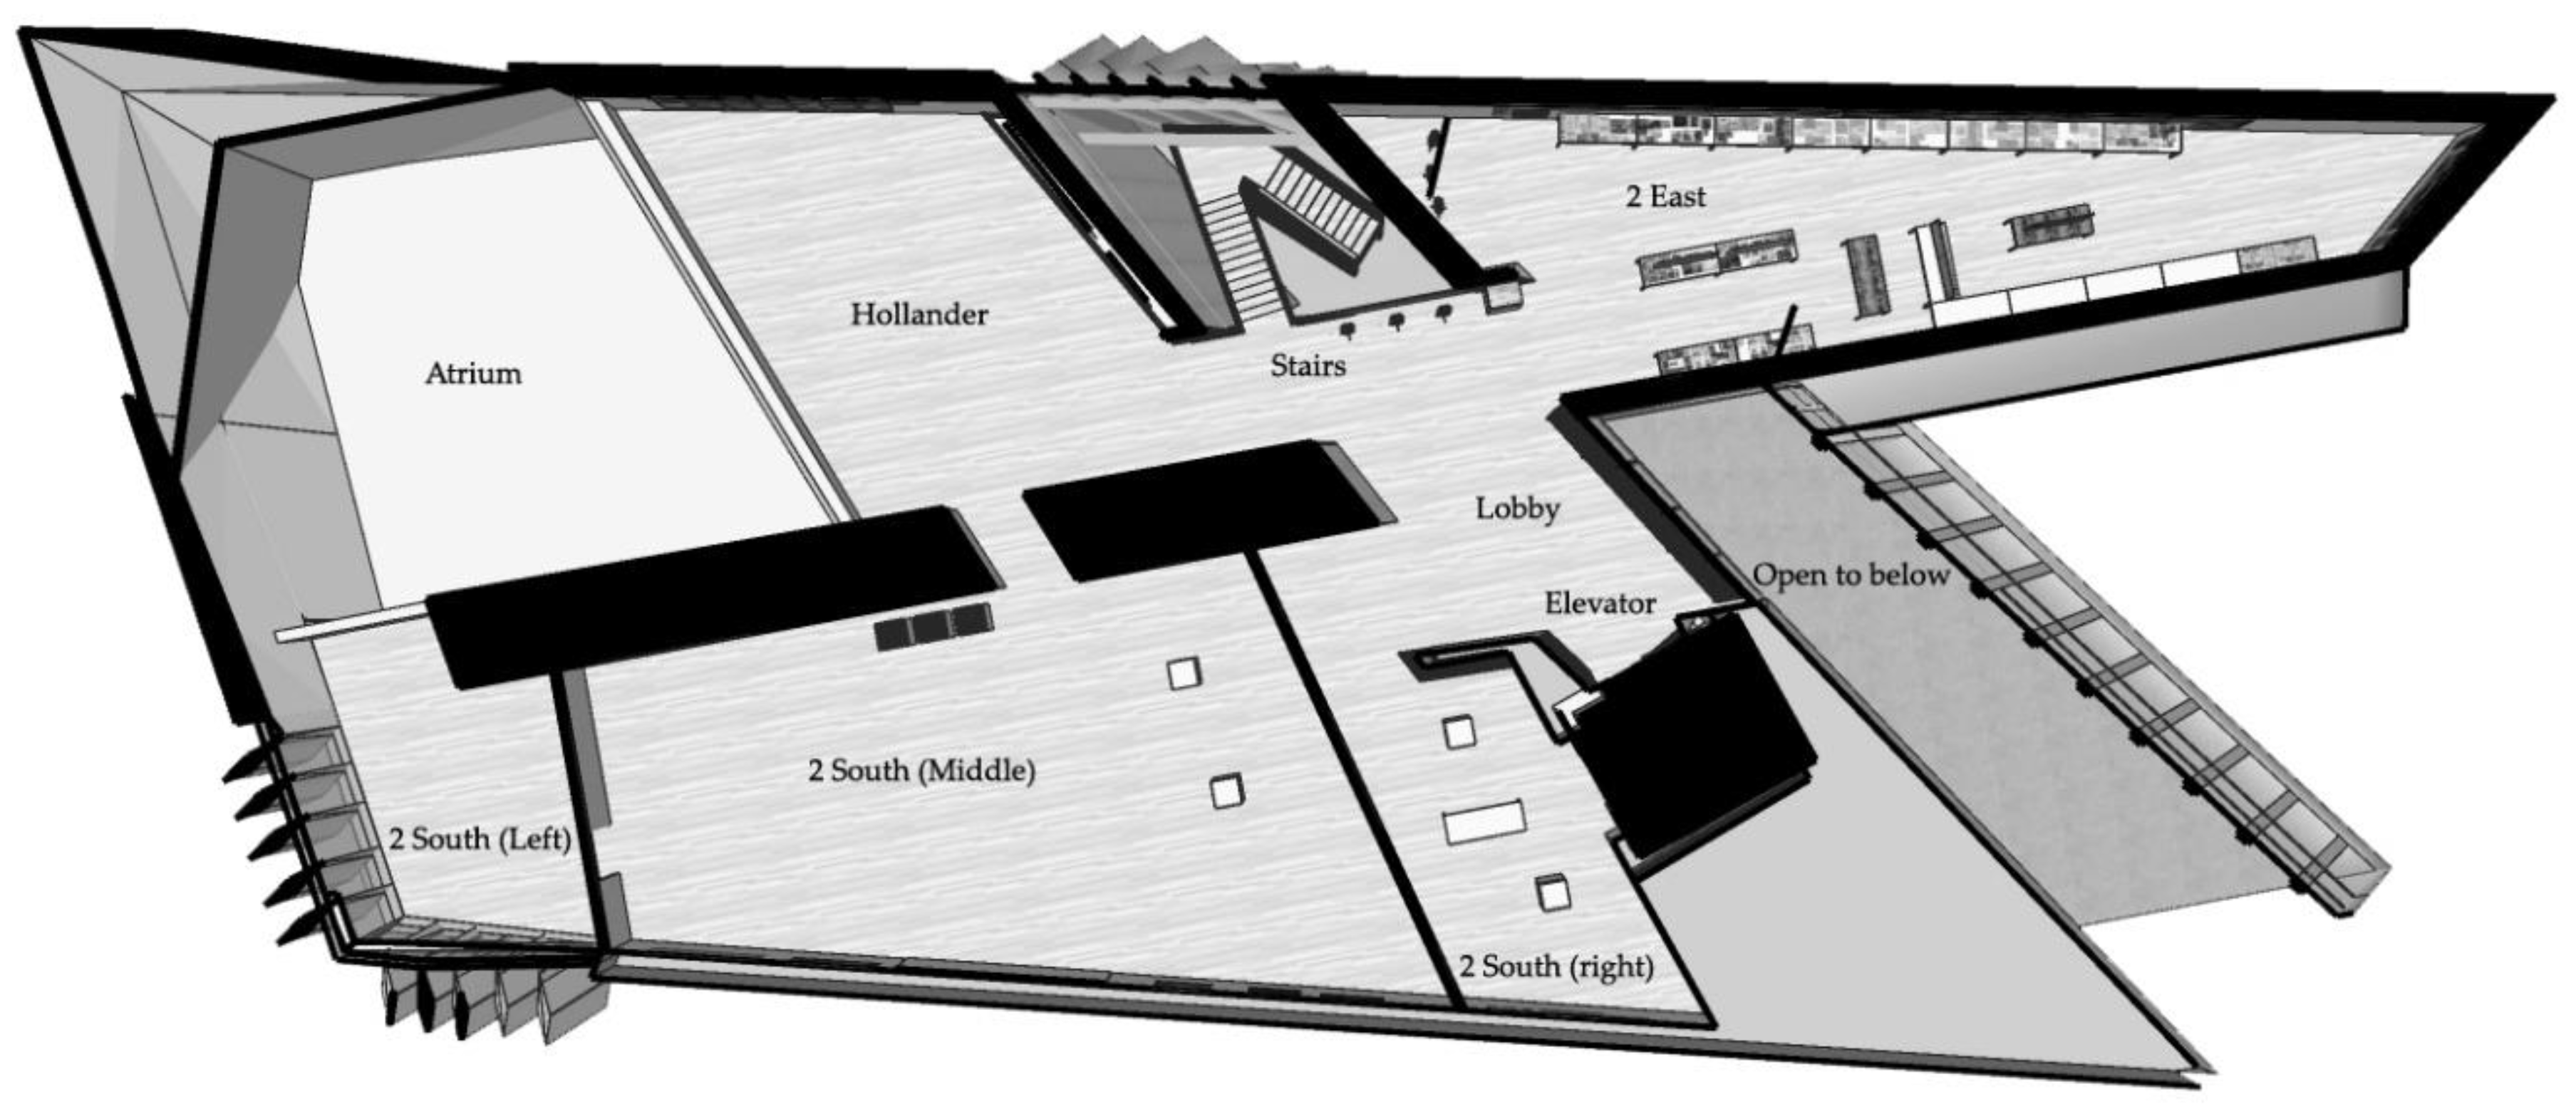
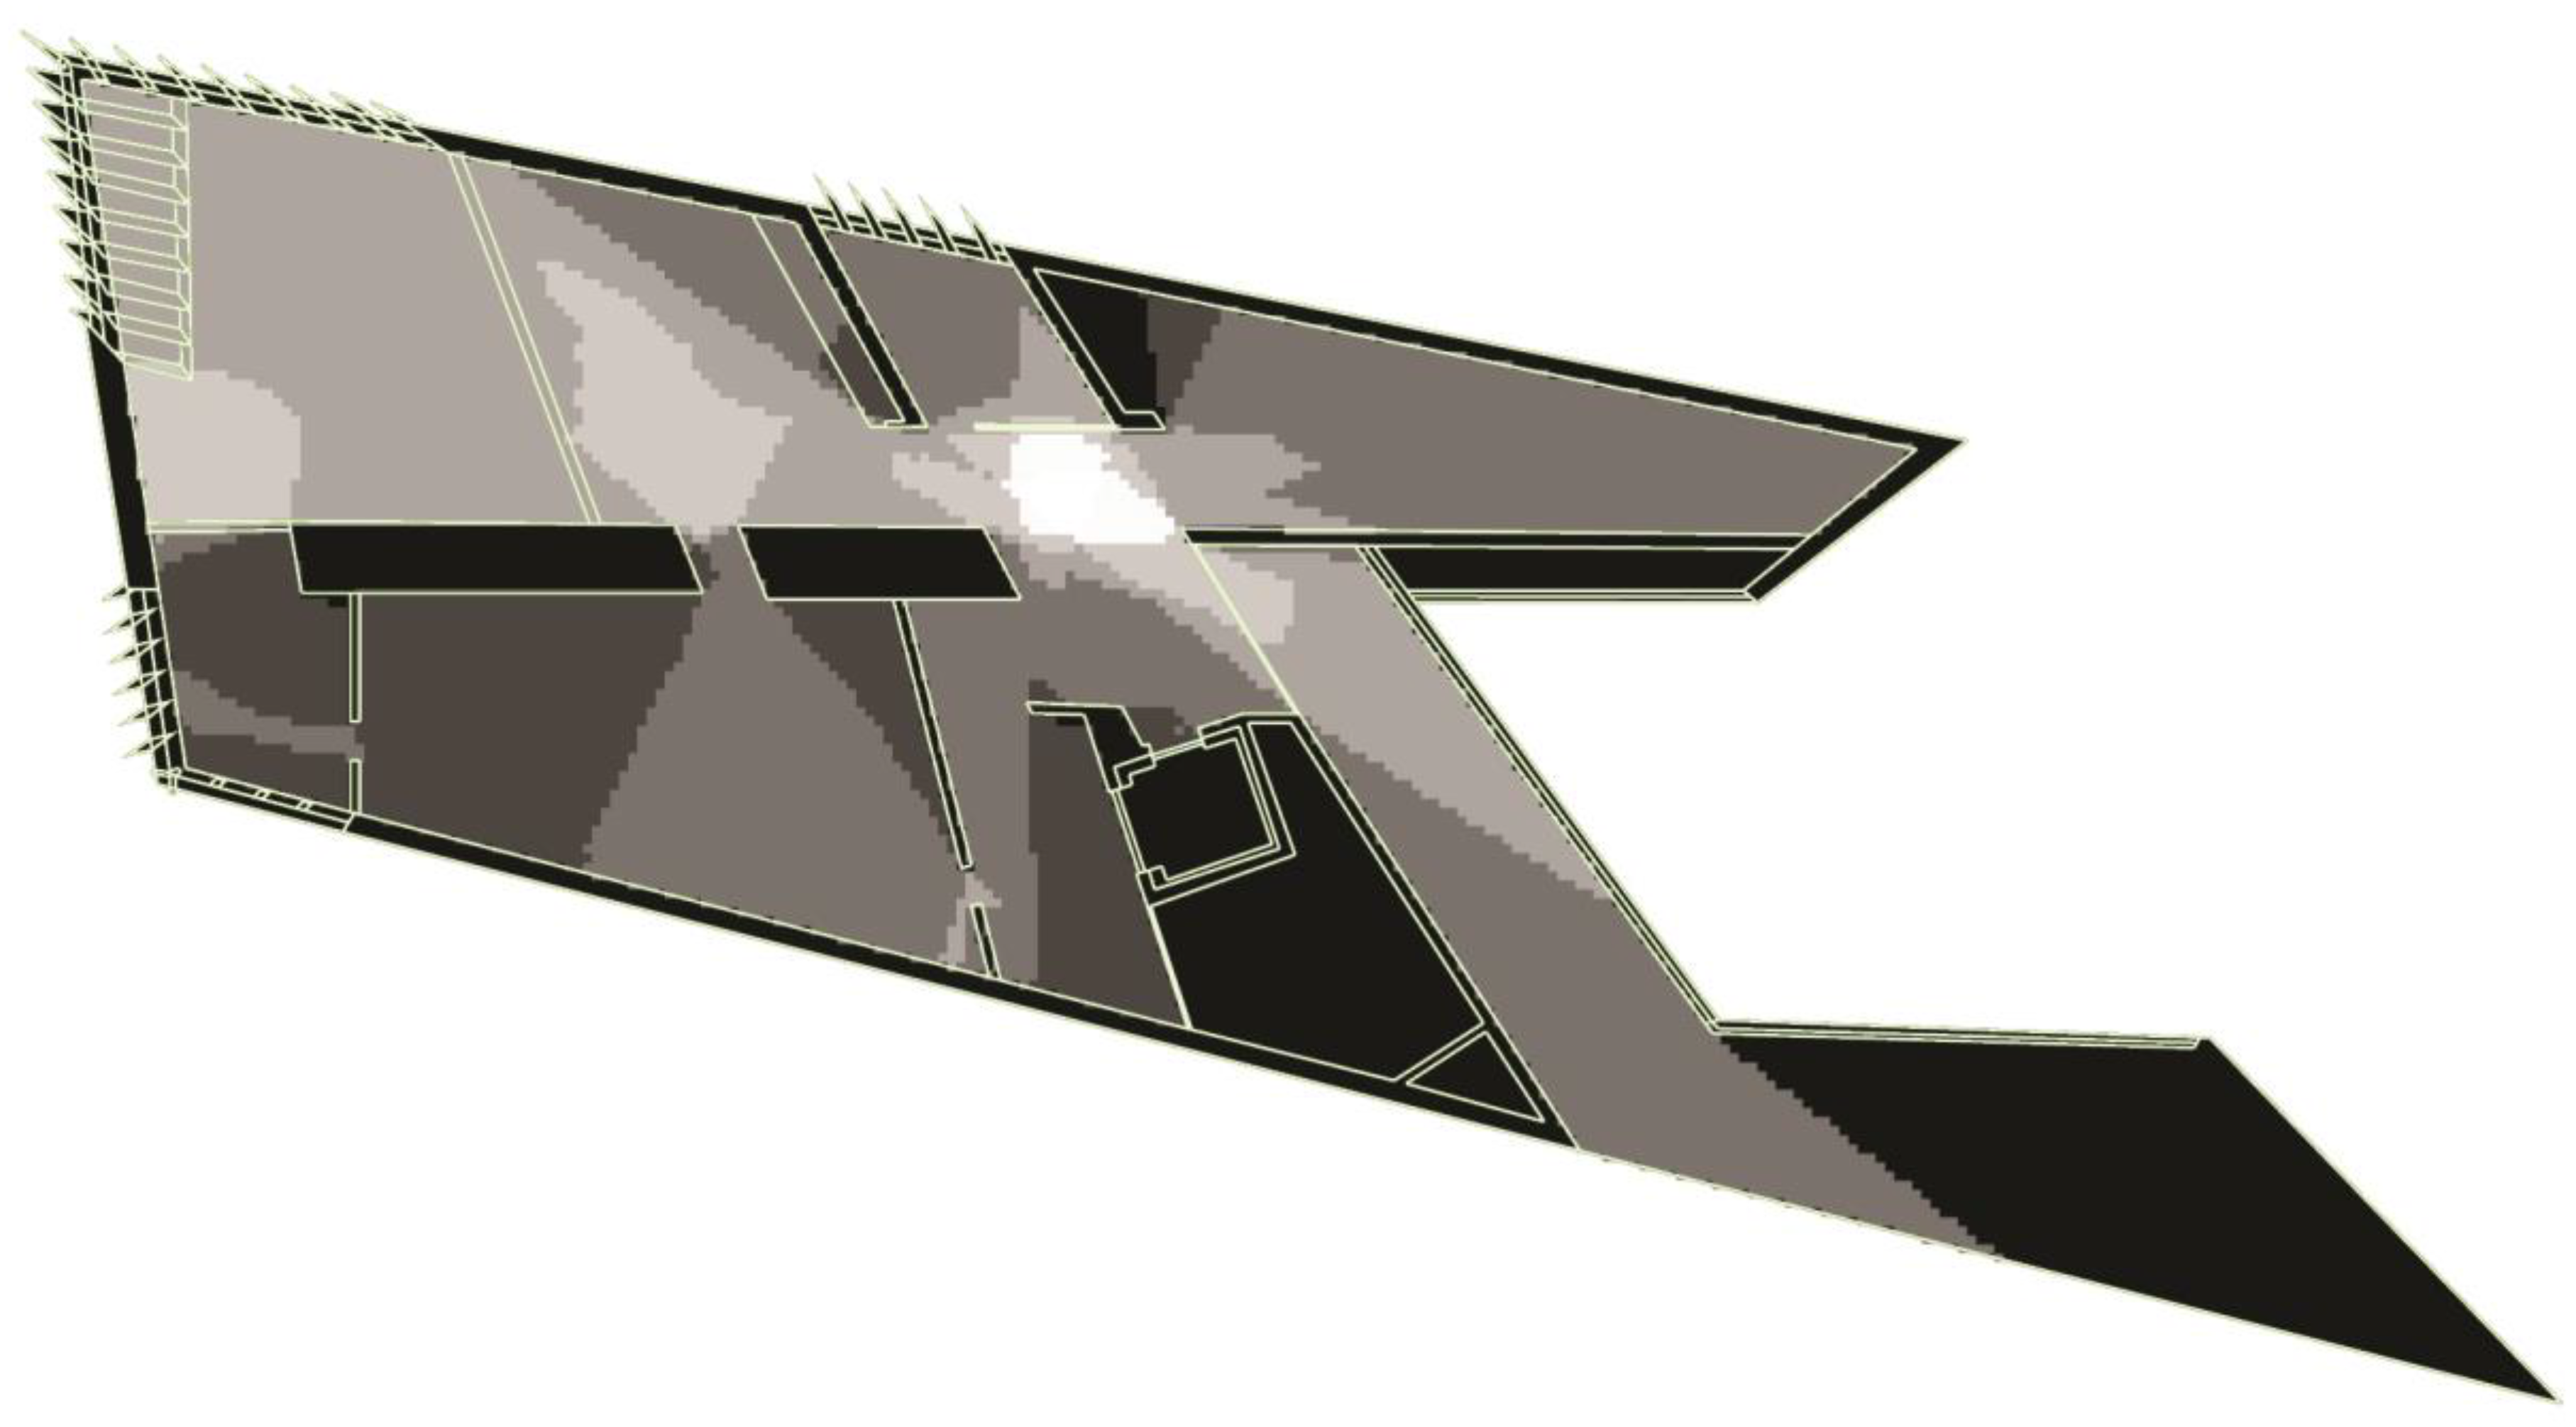
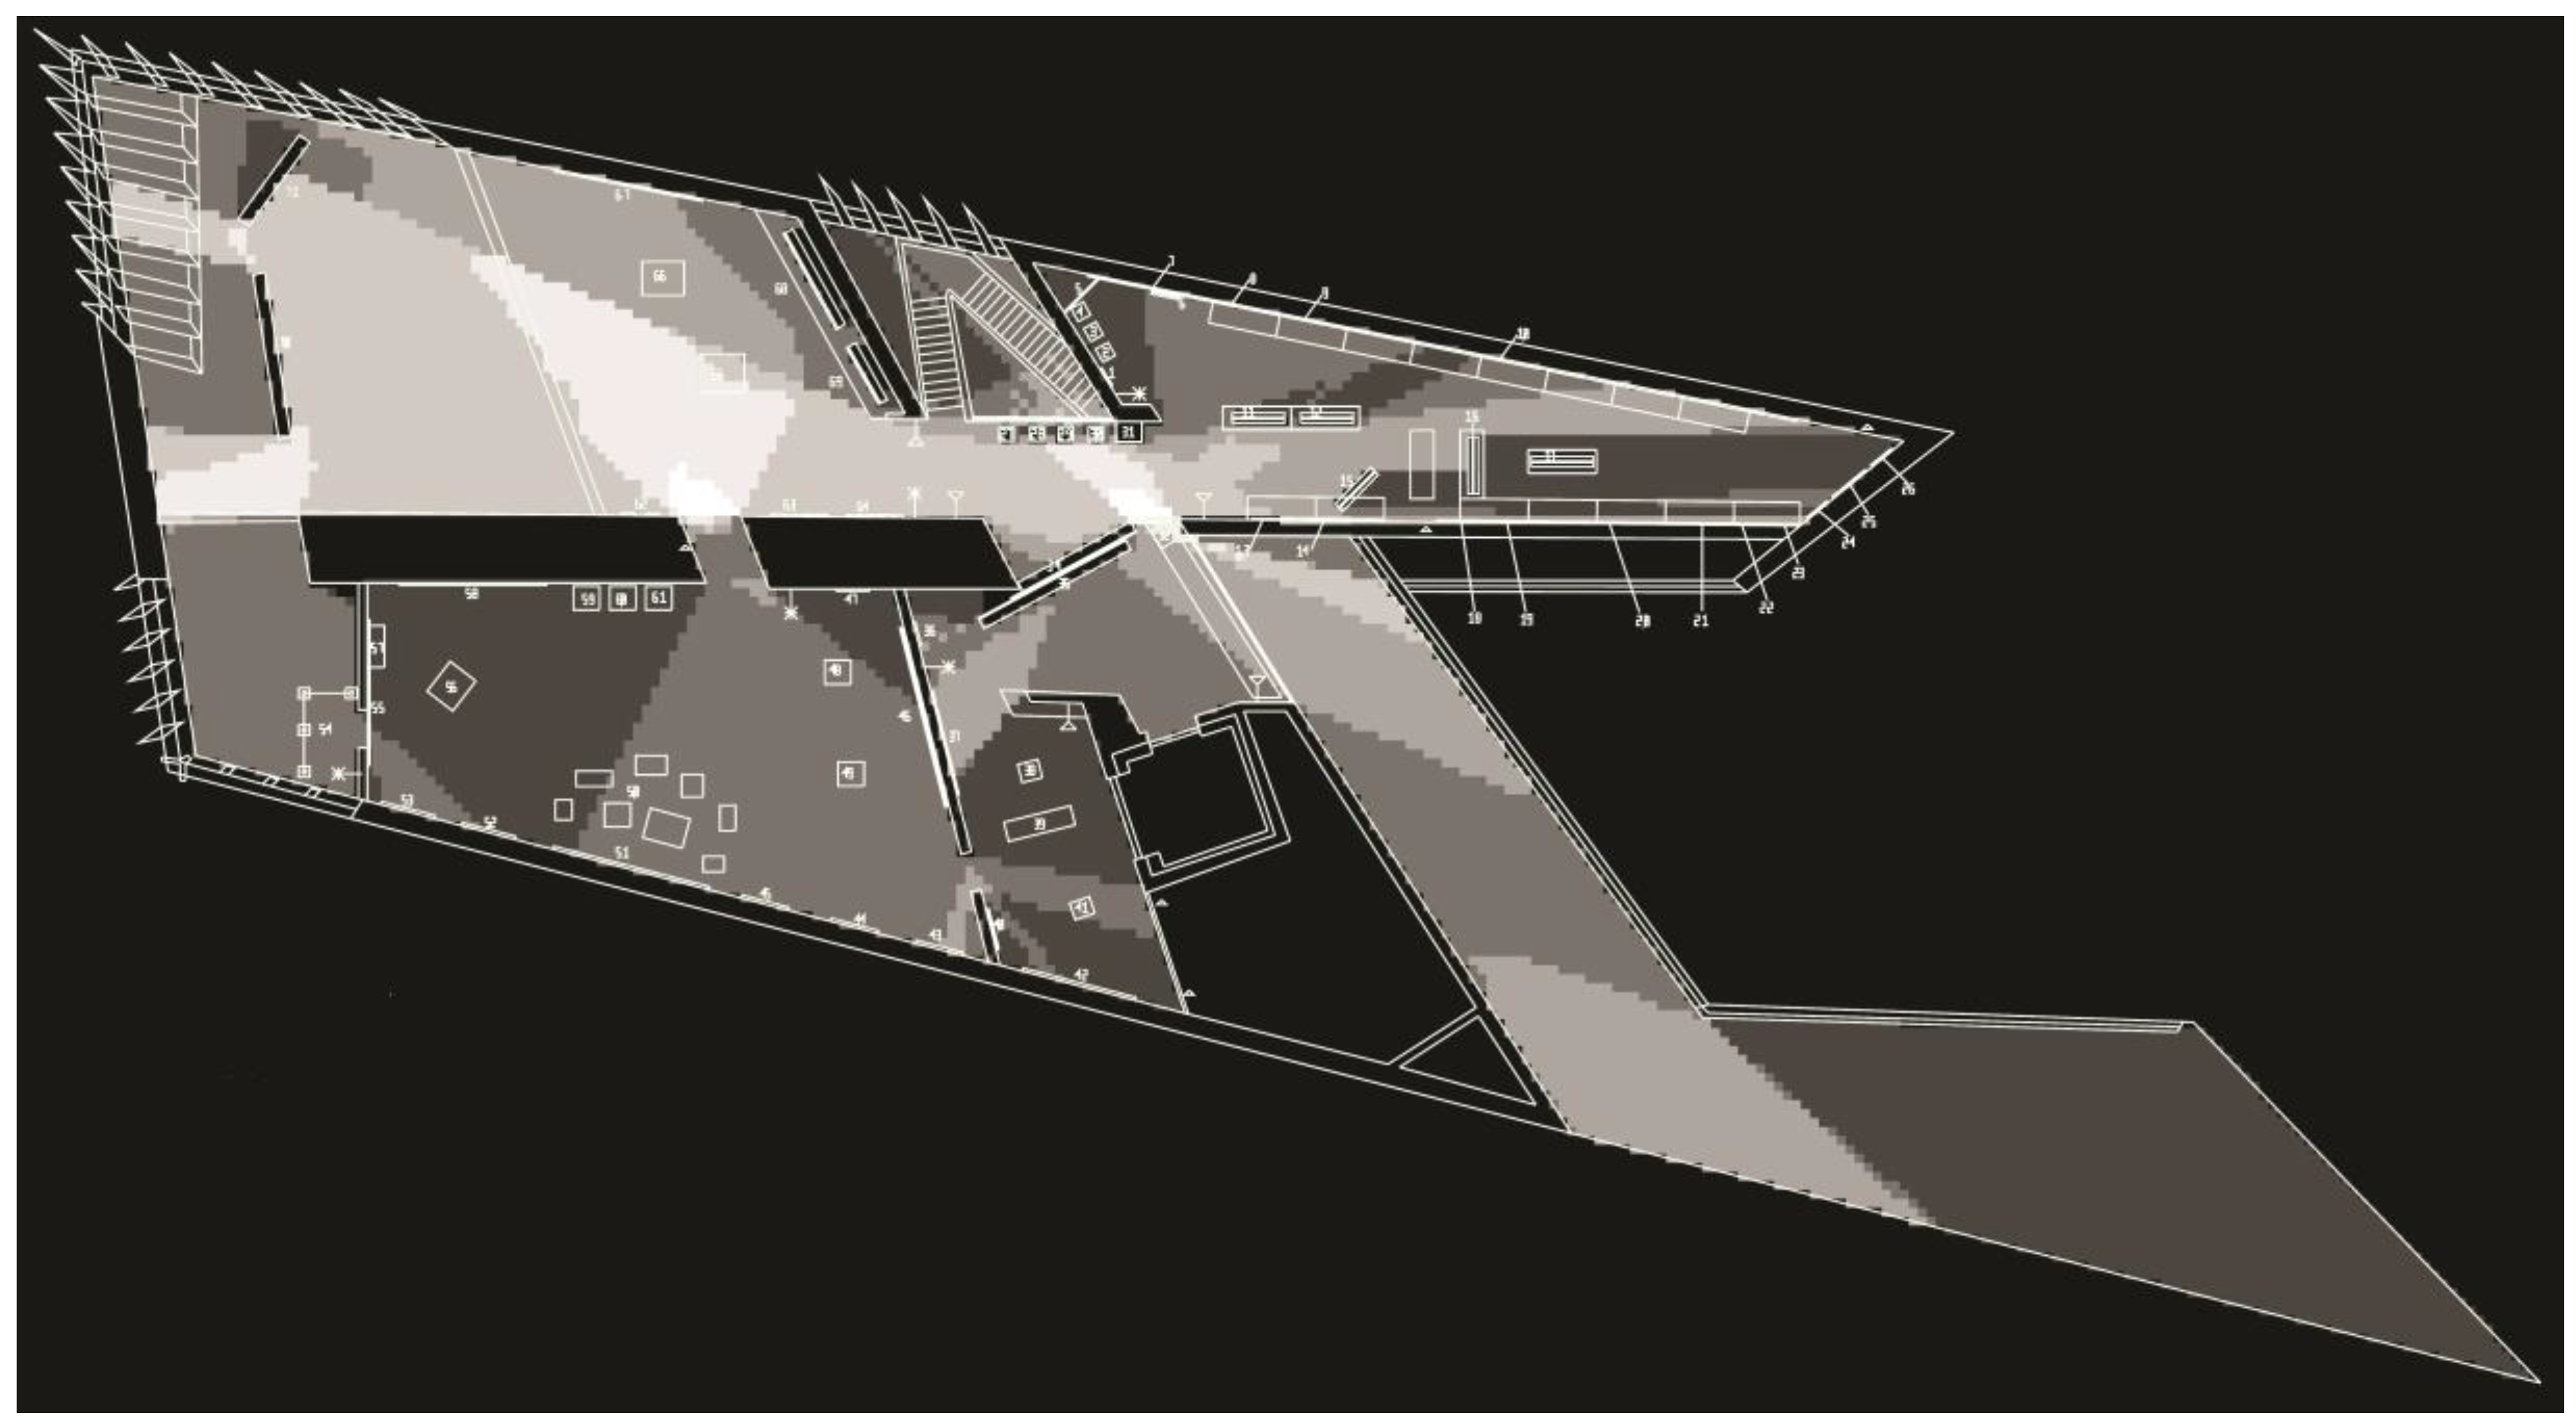
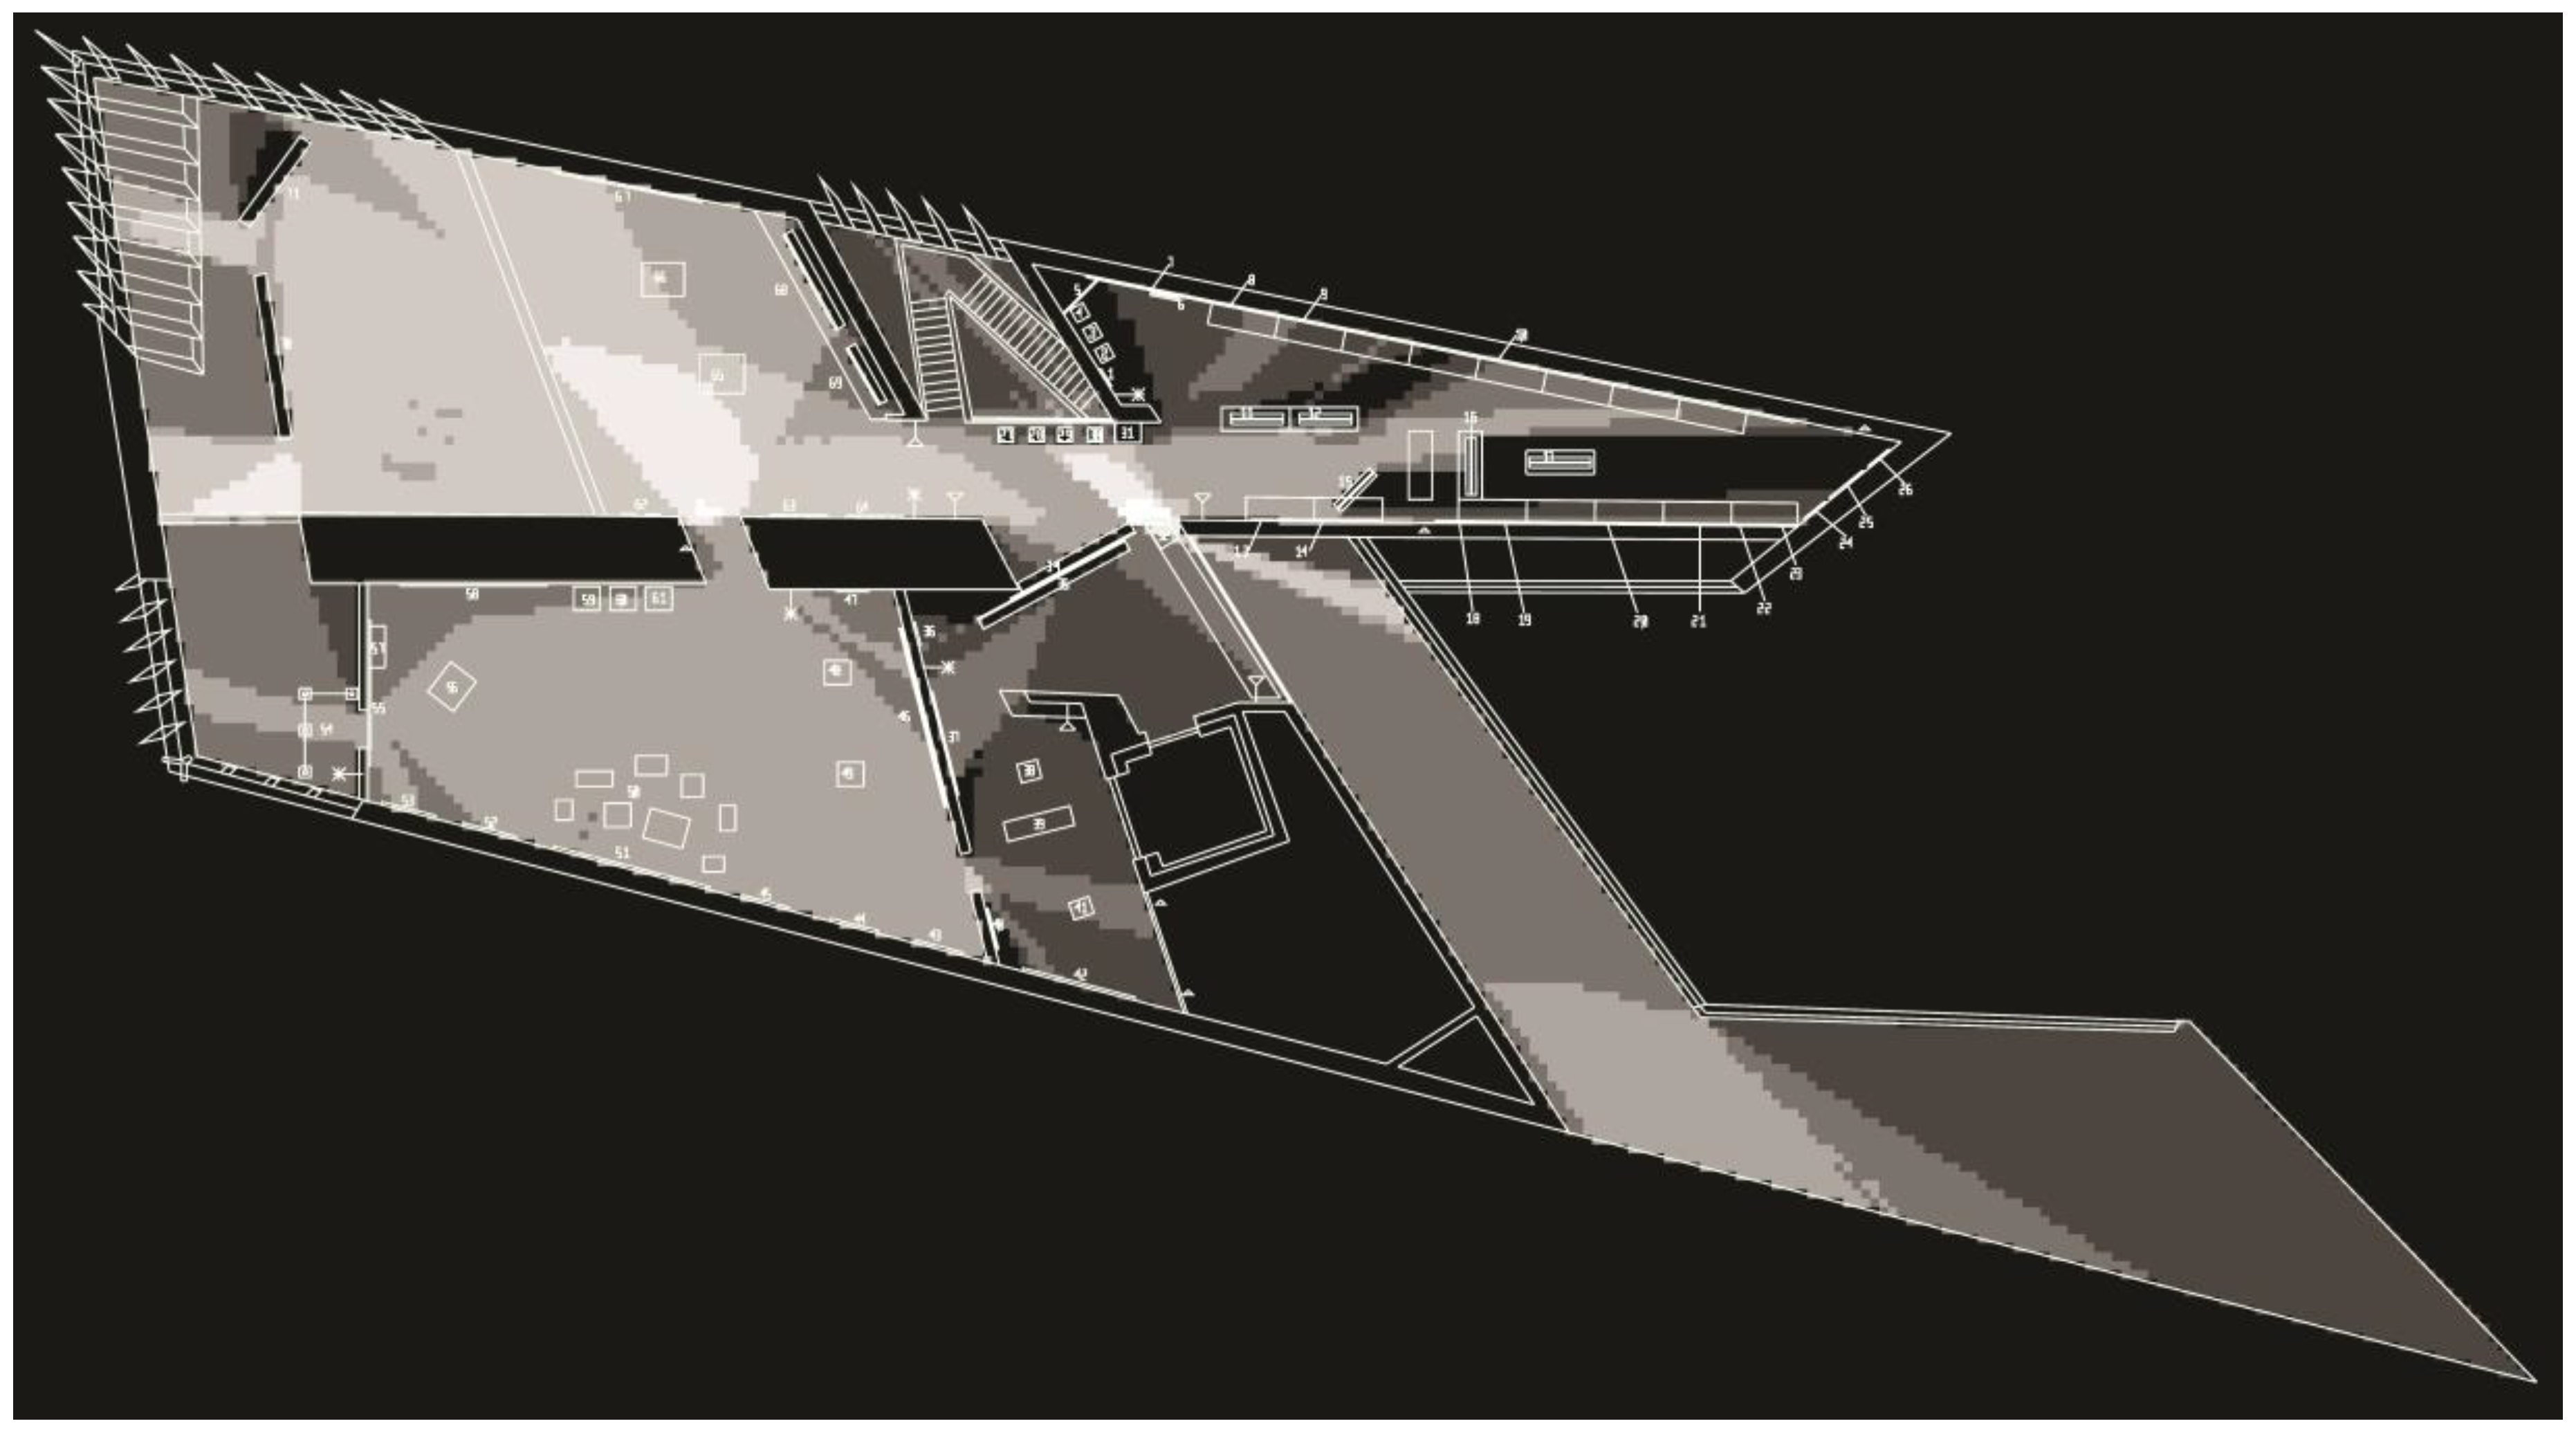
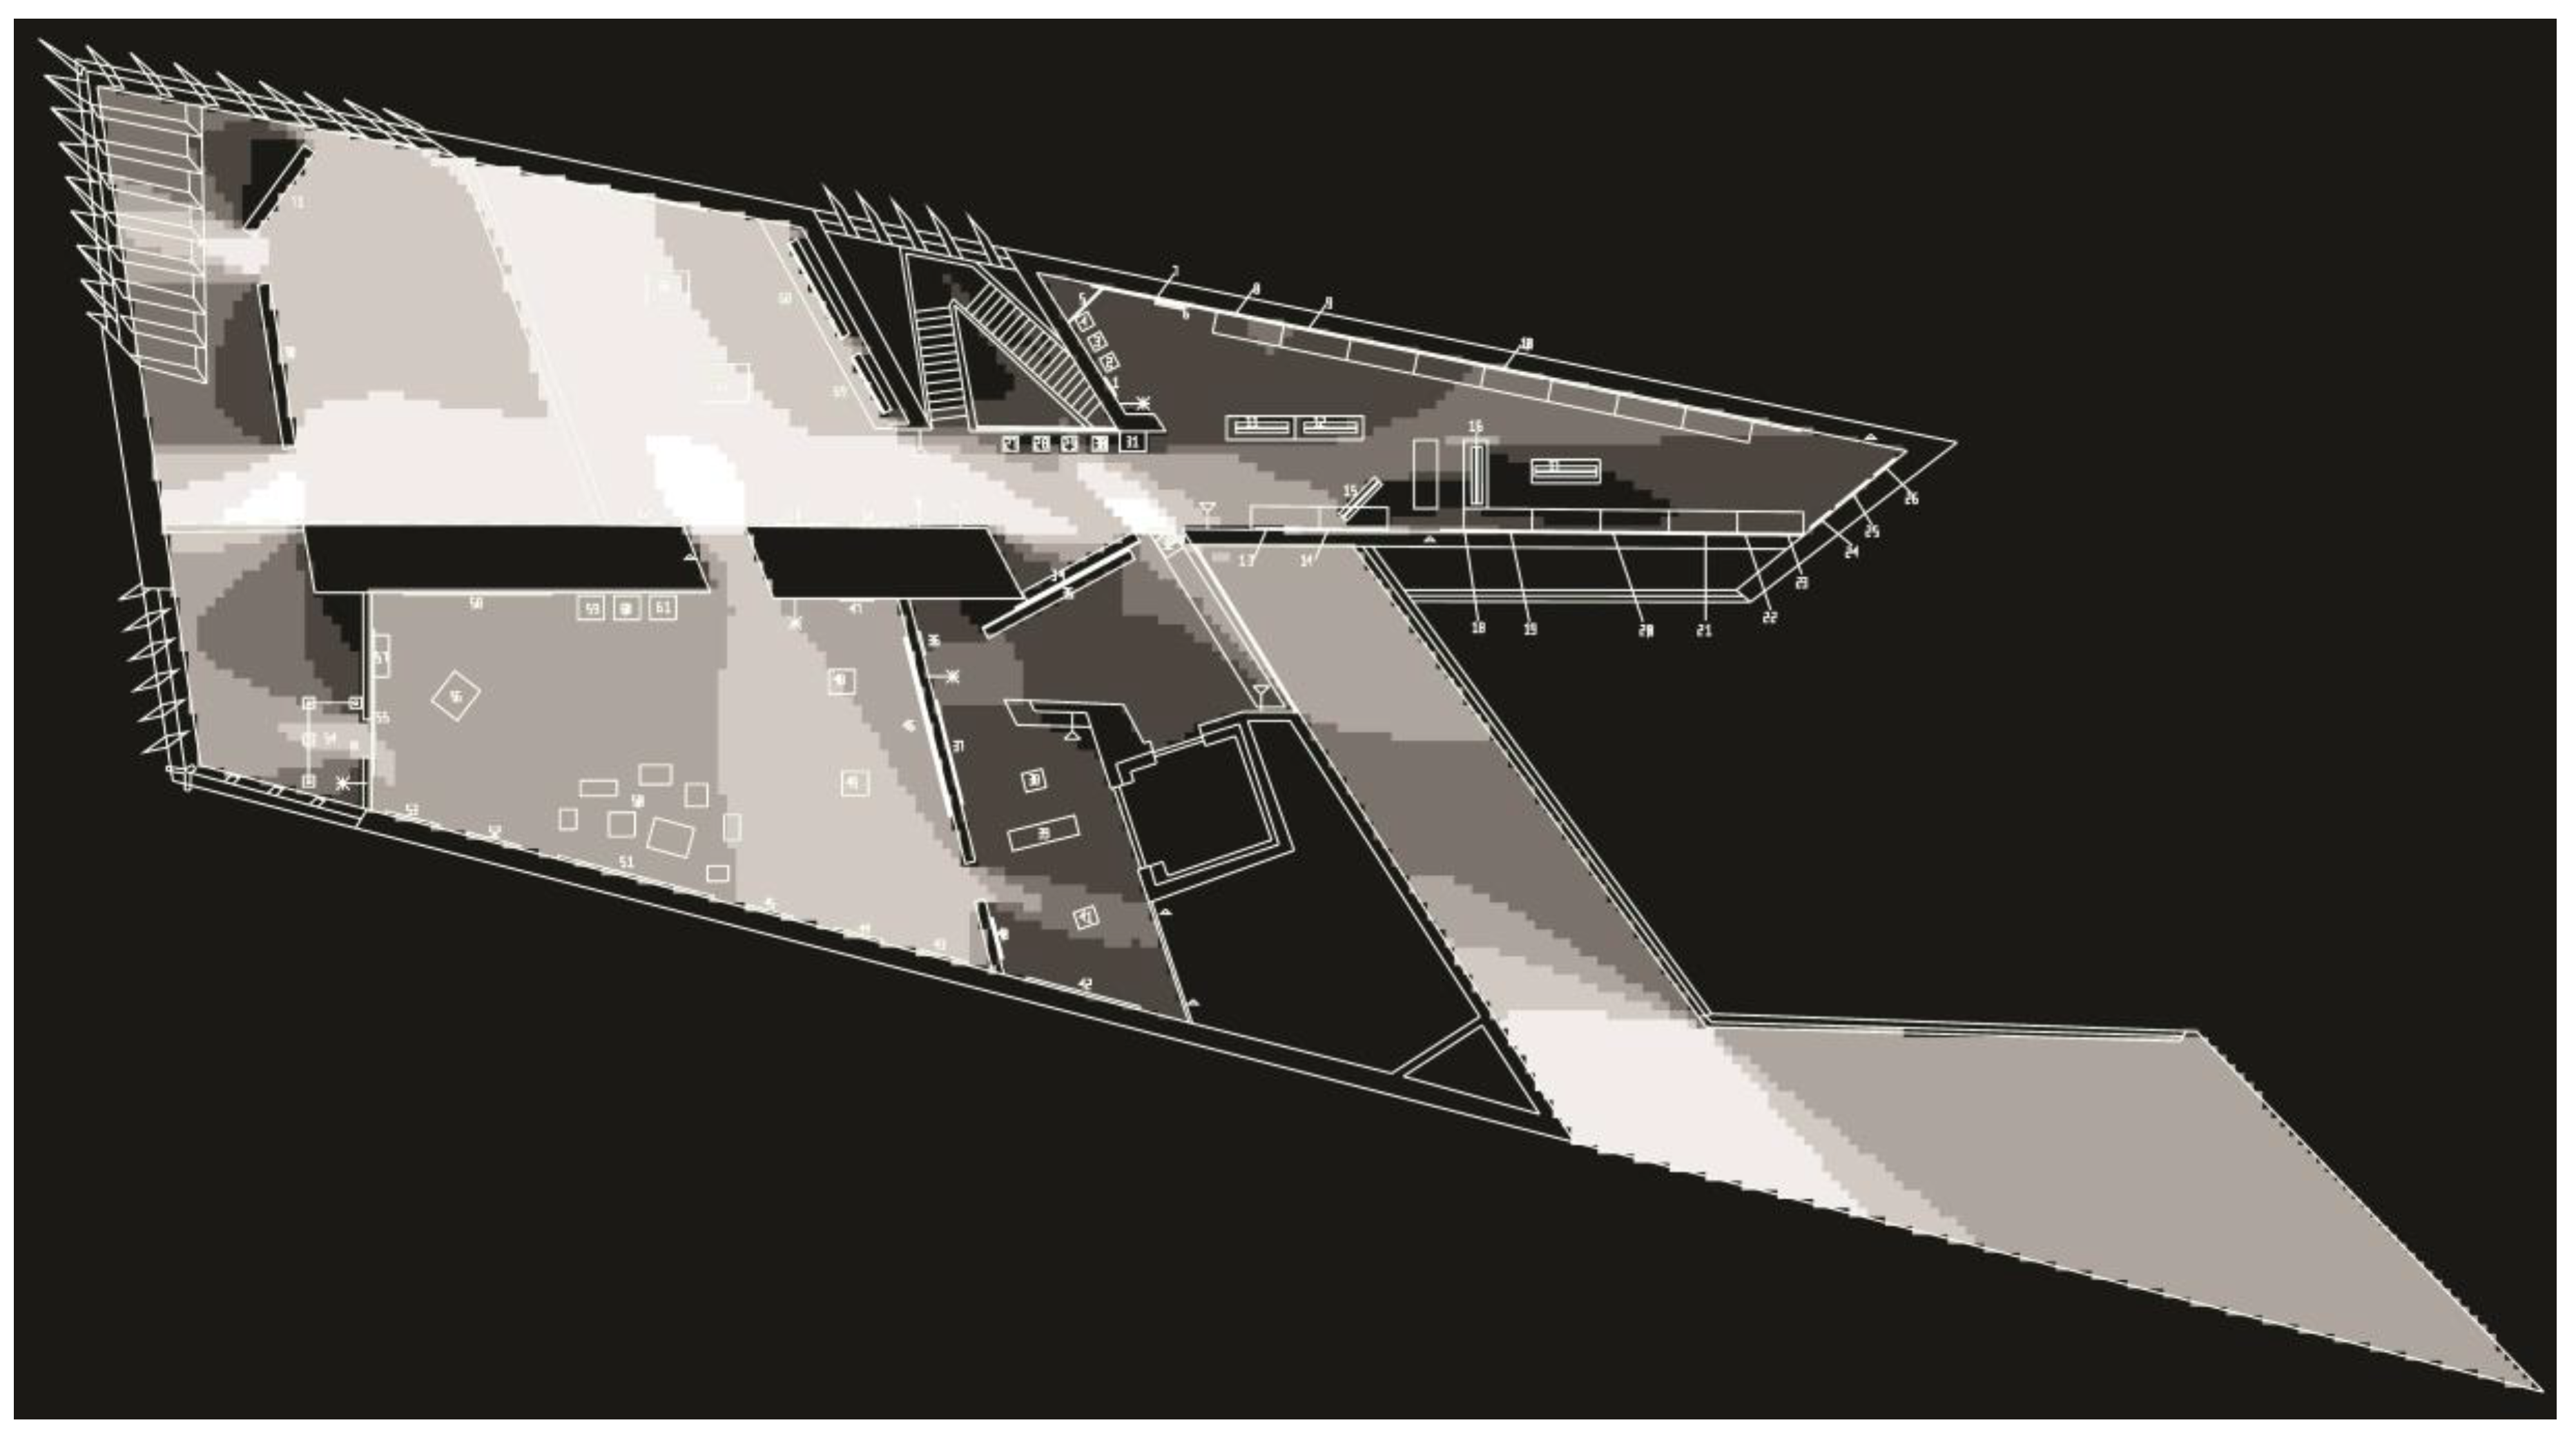
1.1. Movement Patterns in Museums
There is a growing interest in studying the positioning of exhibits in museums. User function of a museum is quite unique from other interior spaces, as visitors often inhabit the space for a short time and roam about freely with the primary purpose of viewing objects within the space [
1]. In their work on visitors’ movement in art galleries and exhibitions, Wineman and Peponis [
2] introduced a third category of movement that people follow in museums. They called it “spatially guided movement”. They believed that the structure of layouts has an impact on visitors’ movement choices, whereby certain exhibits might be visited more often others.
In addition to the importance of the structure of the layout, increased awareness of the characteristics which impact visitor movements within a museum, also known as visual saliency, is crucial for a curator designing future exhibitions [
1]. Visual saliency refers to cues or characteristics which attract or hold a viewer’s attention. Salience rating is the degree to which an object attracts human attention. Spatial decision-making of museum visitors may be impacted by two types of visual saliency: object-based and location-based [
1]. Object-based salience is influenced by perception of visual attractiveness of an individual piece. For example, a piece with high salience rating may attract viewers to an area of the gallery which may otherwise be less frequently visited. The Mona Lisa, for example, is a good example of an artwork with high salience rating located far away from the entrance of the Louvre in Paris. Location-based salience is reliant on the physical position of the piece within the gallery, as specified by the curatorial team [
1]. A work of art installed in a position with high visibility, such as spaces visible from multiple galleries or at the intersection of two galleries, may be noticed more frequently regardless of the object’s individual salience rating.
Some studies, however, suggested that our attention may not necessarily be impacted by the salience of the object, but more so by their location spatially. Janzen [
3] ran three experiments on participants using recognition tasks, and conscious and unconscious memory processes to investigate wayfinding behavior. Objects were positioned at different locations. Using a virtually designed environment, these objects were masked in one experiment and not masked in the other. Results showed that objects along decision points were recognized faster than others.
Regardless of the existing environmental conditions and/or maps, signs, or other wayfinding methods employed within an art gallery setting, “visitors must still use their spatial abilities to orient themselves in space” [
1]. To do so, visitors must seek out, process, and store information relevant to the perceived surroundings to execute a wayfinding task, even in the unrestricted form of exploratory movement experienced within a gallery space. The moment a visitor sets foot within a space and makes their first choice, cognitive information collection begins. From here, an initial mental map is constructed and is thereafter continuously adjusted as information of previous locations is stored and new information is presented, received, and reacted to. This acquired information becomes the visitor’s identifying characteristics of the spatial layout [
4]. Such characteristics will typically fall into one of five fundamental categories—paths, nodes, landmarks, districts, and edges—as defined by Kevin Lynch to devise a practical mental map [
5]. Lynch [
5] also introduced the term legibility to describe how different environmental layouts contribute to the development of cognitive mapping. Although these principles were originally designed for urban and city scales to explore cognitive mapping, they can be applied to scales of interior spaces and act as key features in a visitor’s experience and memory [
2].
1.2. The Use of Space Syntax in Studying Movement Patterns in Museums
There is growing interest among researchers for the use of advance techniques based on space syntax theory to evaluate the effect of spatial layouts on visitors’ movement within museums. Space syntax is a group of theories that examine the impact of spatial layouts on different human behavior. Since it was originated in the 1980s by Hiller and Hanson [
6], many studies documented the impact of spatial properties on different types of behaviors, such as wayfinding in hospitals [
1], employee performance in the workplace [
7,
8], or even preferences for selecting targets for crime [
9]. Two space syntax techniques are worth noting here. The axial line analysis is a popular method in measuring the depth of spaces within a structure, regardless of distances traveled. Syntactically, a space is described as “integrated” if it can be reached from all the other spaces in the building easily by going through a small number of rooms. Similarly, a space is described as “segregated” if it can be reached by going through a large number of spaces first, regardless of the distance traversed. Another popular technique, an isovist-based technique, measures different qualities of visibility polygons from all vantage points within a space. In simple terms, an isovist is a polygon that is drawn to cover the amount of visible information 360 degrees around a vantage point [
10]. In addition to the properties each visibility polygon has (e.g., area, perimeter, radial length, occlusivity, etc.), advancement in software now provides the ability to develop syntactic measures based on these visibility polygons by creating a grid of isovists at certain distances in a plan. This technique is known as visibility graph analysis (VGA), and results of this analysis include measures like visibility “integration” [
11].
Dosen and Ostwald [
12] examined the isovist properties of 24 variations they created for a virtual interior space in order to understand human perception of enclosure and exposure. The variations were the result of modifications in ceiling and roof angles, and window widths and heights, as well as the introduction of columns. An online survey was distributed to 159 participants from eight different universities. Interestingly, the authors found a strong positive correlation between plan isovist properties and respondents’ perception of exposure, and a strong negative correlation between plan isovist properties, along with the sum of sectional and plan isovist properties, and respondents’ perception of enclosure.
Li and Klippel [
13] used the visibility graph analysis technique to explore wayfinding patterns at a library where people expressed difficulty navigating its layout. Eight participants were asked to seek certain books from three different sections of the library. Arrangements of book stacks within these sections created different layouts that ranged in complexity and visibility. When the researchers conducted visibility graph analysis on all three library sections, results showed that participants, regardless of their familiarity with the library, spent longer at the section characterized with lower visibility. Lee, Ostwald, and Lee [
14] also used the visibility graph analysis technique by evaluating three pairs of residential aged care facilities in three different countries. Using these techniques allow one to observe cultural characteristics within different plans. For example, the VGA output of connectivity color-codes the plan from red (visually connected) to dark blue (least visually connected). The Korean VGA output, for example, showed that both buildings enjoyed a large volume of visibility from most locations, while the two Australian buildings showed a hierarchical pattern from visitors to nurses to residents.
Although movement patterns in museums are different from finding a book at a library, Tzortzi [
15] also used space syntax techniques to capture these patterns. In a comparison of the structural layout and positioning of exhibits in two different museums, Sainsbury and Castelvecchio, Tzortzi [
15] used space syntax to explain observed movement patterns of 100 visitors in both museums. Both museums were designed for permanent exhibits. The former, however, was designed to become a museum, while the latter was a historical building that was converted into a museum. Sainsbury museum is characterized with long, open vistas generated by two major axes that touch the periphery of the building. These two axes connect a series of open spaces via wide door openings. The second museum also has long vistas, but the views do not open into one another in the way the first museum does. One needs to approach the next space for the visitor to have maximum visibility of its content. In other words, a visitor may not anticipate what he or she will see ahead. Results of observations revealed how visitors in Sainsbury mostly occupied the left wing of the museum and not the major axis that marked the major spine of the structure. In space syntax terms, the most integrated part of the museum (the major axis) attracted one-fourth of the visitors. Interestingly, however, the local syntactic property “connectivity” was a strong predictor for visitors’ movement. This could be explained by visitors having trouble deciding on their route once they step inside the museum. Space syntax also showed that the overall layout of the museum was not “intelligible”. Intelligibility is a space syntax measure that results from correlating global measures, i.e., “global integration”, with local measures, i.e., “connectivity”. When the ratio is below 0.5, intelligibility is referred to as low, making navigation within the space a little more difficult. In the case of the second museum, the researcher created a justified graph, another space syntax technique, and found that the overall structure had a very deep tree form that created a single directional route making it easy for visitors to return to the starting point without going through spaces already visited.
In their review of the changes to the High Museum of Art in Atlanta, Zamani and Peponis [
16] discussed the changes to the co-visibility of exhibits through the use of visibility graph analysis. The study compared results from VGA analysis of the exhibits during four different phases that took place at the museum. The first three phases documented changes to the layout of the museum. The 1983 layout was first designed by architect Richard Meier, while the 1997 layout took place after the Olympics, and the 2003 layout marked a return to one more aligned with the original 1983 layout. The fourth phase took place when the modern expansion designed by Renzo Piano in 2005 was added to the museum. One of the differences between the expansion and the original museum is that it has 40-foot-wide clearances as opposed to the 21-foot grid of columns in the 1983 original building. The 1983 and the 2003 layouts were based on the idea of having a room within a room concept, where visitors would experience constant changes in visual patterns. The 1997 layout, however, was marked with exhibits following the periphery of the original structure and the existing columns acting as the internal divisions. Results of VGA showed how the co-visibilities of objects were 77% for 1983, 56% for 1997, and 100% for 2003. The 2005 layout appears to be more open with higher visual integration within the entire plan. However, when compared with the adjacent 1983 plan, the latter appears to be conceived as a choreography of co-visibility, social co-presence, and co-awareness [
16].
Wineman and Peponis [
2] tested two traveling science exhibitions curated by Carnegie Science Center. Both exhibits were adapted to two different open-plan exhibition halls (singular spaces) to assess visitor behavior patterns in relation to the exhibition content (which remained constant in both settings) versus spatial variables. By testing the same exhibit in different environments, this experiment evaluates how significant spatial variables affect “exploratory movement, visual contact, and active engagement with individual exhibits”. To do this, visitors in both settings were randomly selected to have their movement and behaviors unobtrusively tracked and recorded with attention to their contact and engagement with pieces featured in the exhibition, how long they visited, what order they made contacts and engagements, and so on to later assign behavior performance scores to visitors. These behavior performance scores, space syntax analysis (overall accessibility, overall visibility, mean depth and area, integration, connectivity, and intelligibility), and principles of mental mapping were used in conjunction to quantify the environment/visitors’ behaviors, to synthesize and calculate data, and to analyze the results for significant correlations to explain the data and justify the validity of hypotheses set forth.
Results of their experiment confirmed what previous experiments and literature proposed, such as informational spatial learning—the homeostatic process of becoming more comfortable and knowledgeable within an environment as the duration of stay increases. Furthermore, by comparing data of various methods, this study was able to confirm that “spatial variables produce more powerful effects on visitor behavior as the overall exploration time increases”. Lastly, this experiment was able to justify fundamental explanations for visitor behavior considering accessibility. In other words, more accessible pieces are more likely to have contacts, and more visible pieces will attract more engagement [
2].
In a large study of museums, Tzortzi [
17] analyzed layouts, visitors’ movement, and viewing rates in five large museums. The author used graph techniques from space syntax to better analyze the spatial configurations of these museums. He also used few variables based on observations: the tracking score gave the percentage of visitors in each space, while the mean tracking score for a museum showed whether visitors visited all spaces, and the tracking score differentiation showed how far spaces were visited. In Pompidou, Paris, where a main axis places galleries on both sides, movement was found globally structured but locally exploratory. The layout was highly hierarchical, where spaces led to other spaces, giving visitors multidirectional views. Although the plan is legible, visitors tended to miss parts of the museum. The Tate Modern in London also had a central axis; however, galleries were organized around its center. Although it is highly linear and people visited most of the spaces, there was a lot of backtracking generated as opposed to being exploratory. If one compares the main axis of these two museums, one finds that the axis brings people together at the Pompidou, while the axis at the Tate tends to distribute visitors to other galleries. The viewing rate at Tate was also noted to be different than the Pompidou, most likely because of the way exhibits were arranged.
More recently, Krukar and Dalton [
18] used an eye-tracking device to track what 32 participants really saw at an art gallery. After the participants visited the space, they were given a printed layout along with thumbnail pictures seen inside the gallery. It is worth noting here that two conditions were created where the location of the pictures changed. The authors investigated the total fixation time within a picture, the percentage of time spent, and the number of dwells each object received. Using the same visibility graph analysis reported earlier, the authors found that, in both settings, the amount of visibility area (known as isovist area) and visual connectivity were high predictors for the number of dwells, simply because it was more likely to fall in sight. Correlations with total dwell time were significant, but lower. The authors also reported, in a different paper, that they found that salience rating did not explain total dwell time.
