
The Effect of Musical Environments on Designers’ Attention: Persistent Music Listening Interferes with Attention


Abstract
1. Introduction
1.1. Attention and Attention Network Testing
1.2. Creative Thinking
1.3. The Mozart Effect and the Arousal Hypothesis
1.4. Purpose and Hypothesis
2. Materials and Methods
2.1. Participants
2.2. Methods
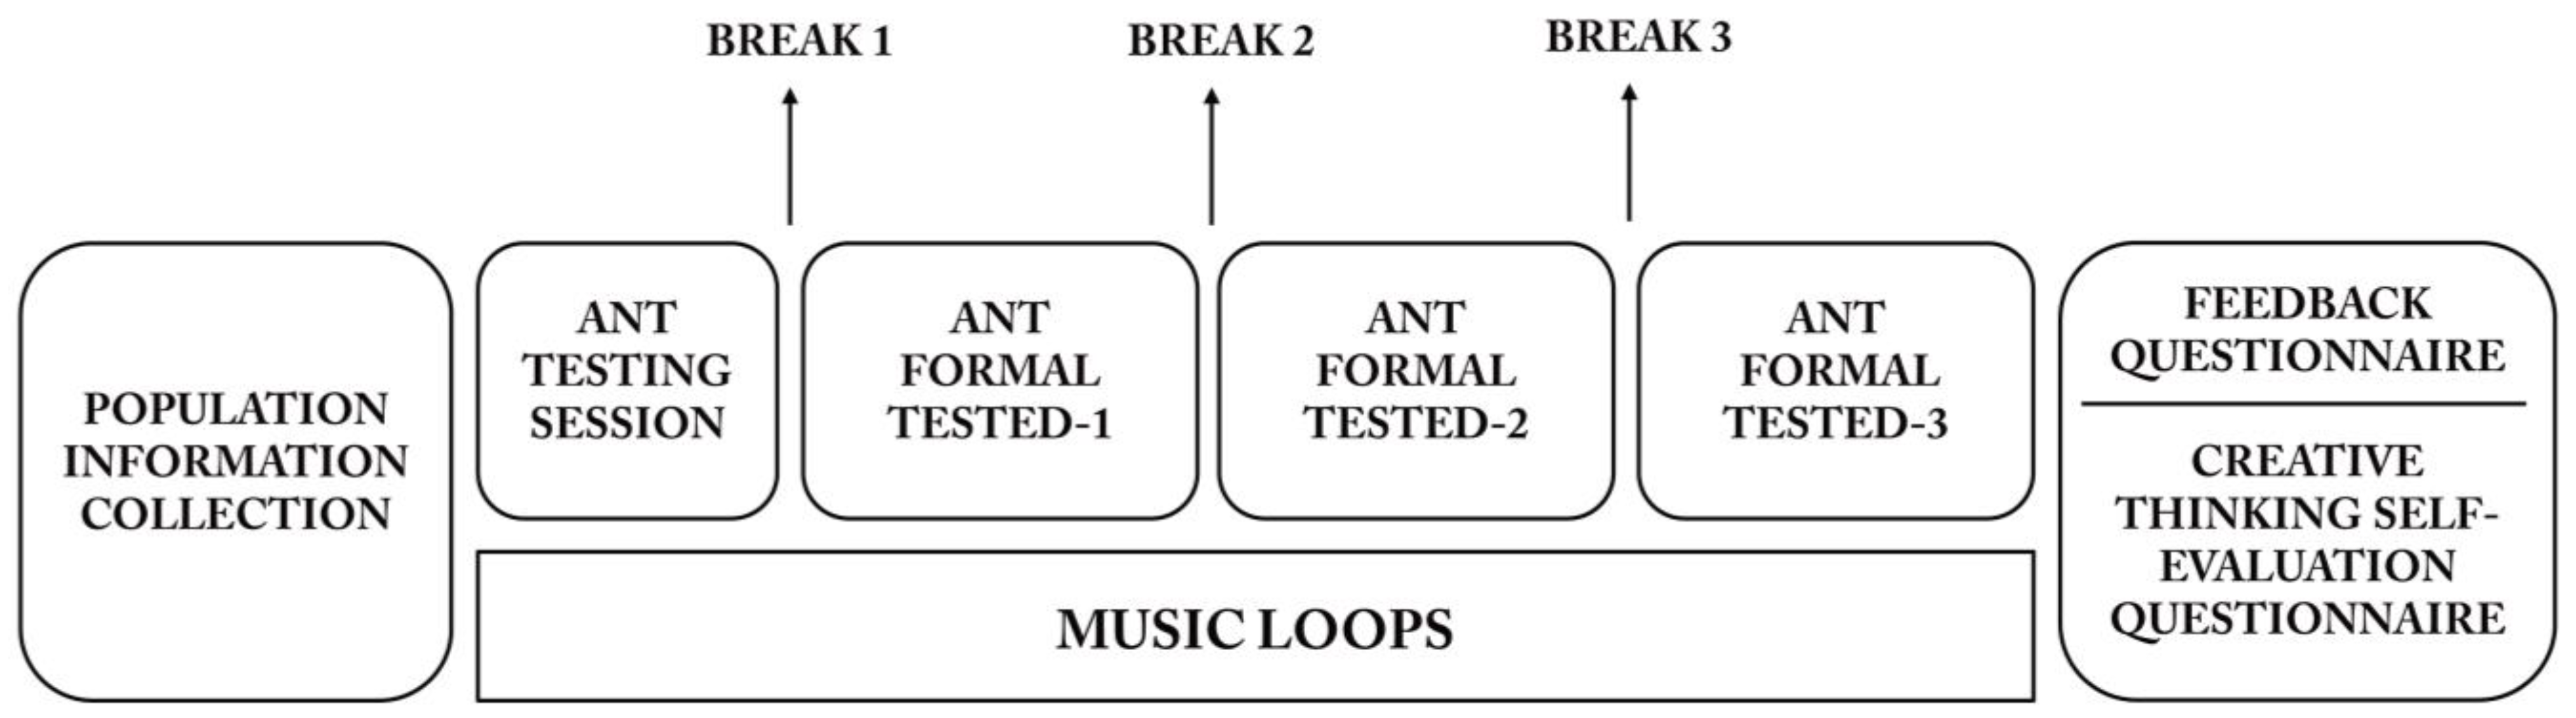
2.2.1. Procedure
2.2.2. Musical Stimulus
2.2.3. Questionnaire
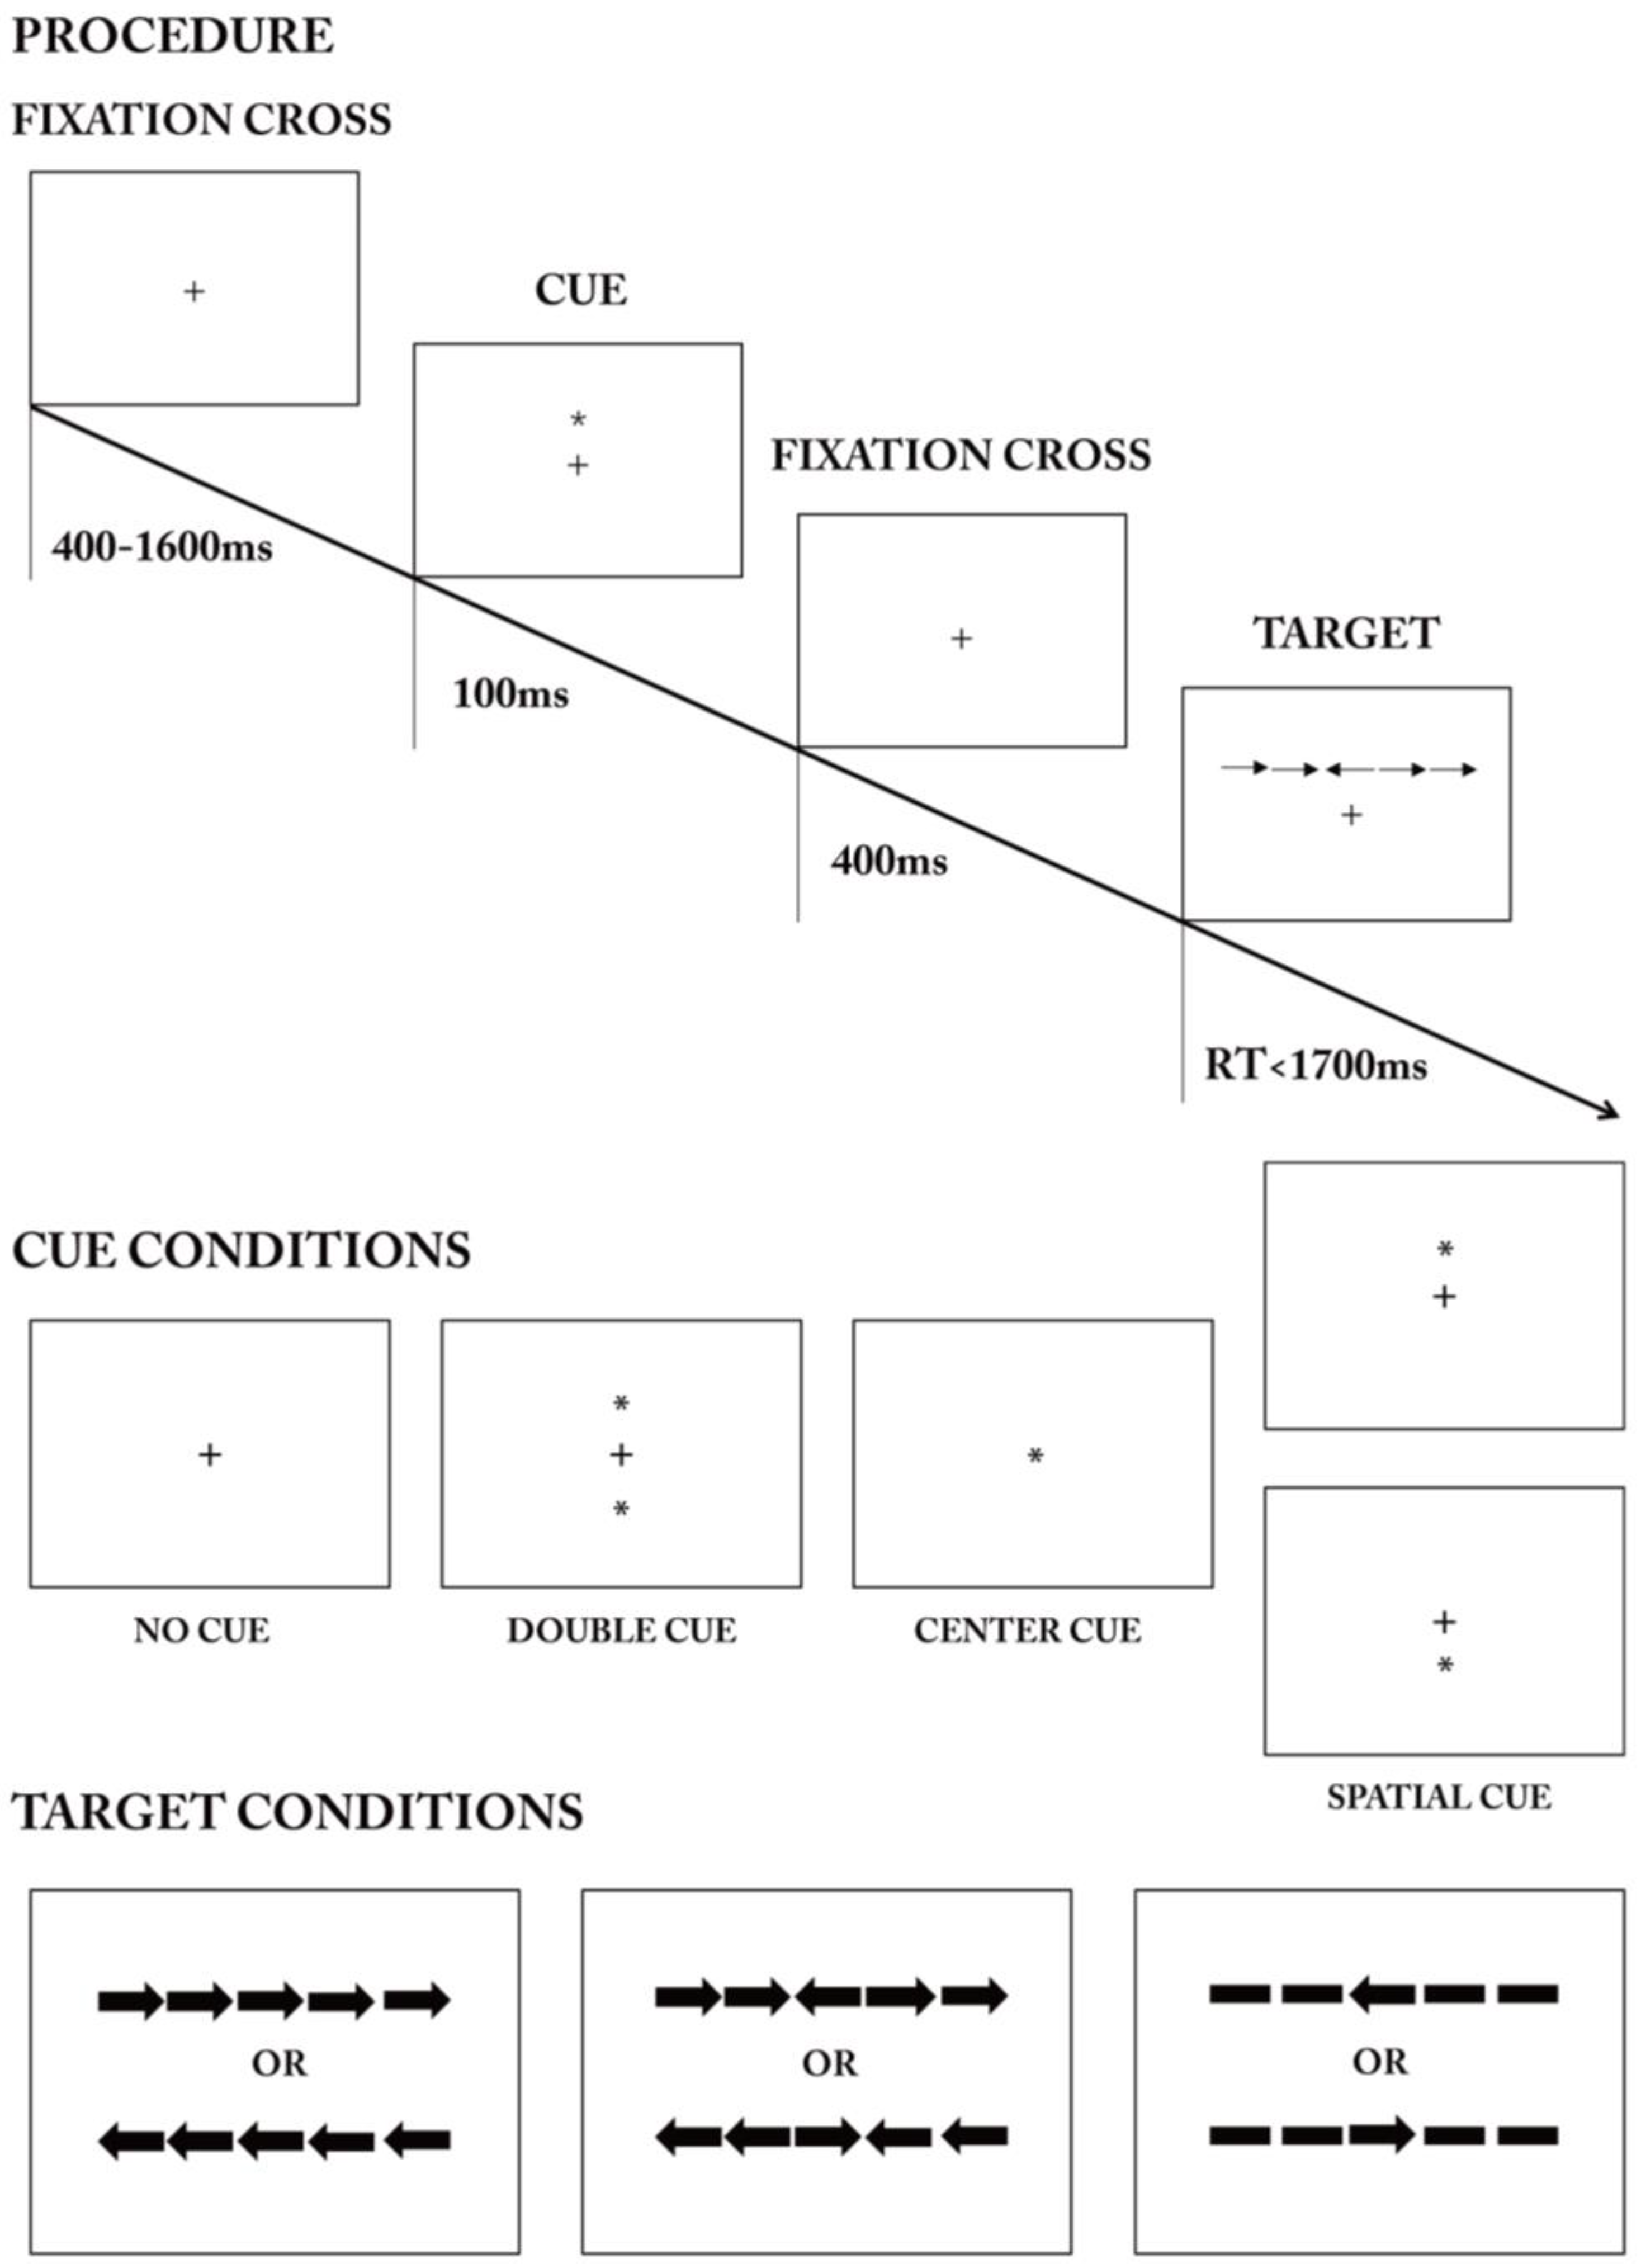
2.2.4. Attention Network Test
3. Results
3.1. Analysis of Background Music Perception
3.2. Creativity Scale
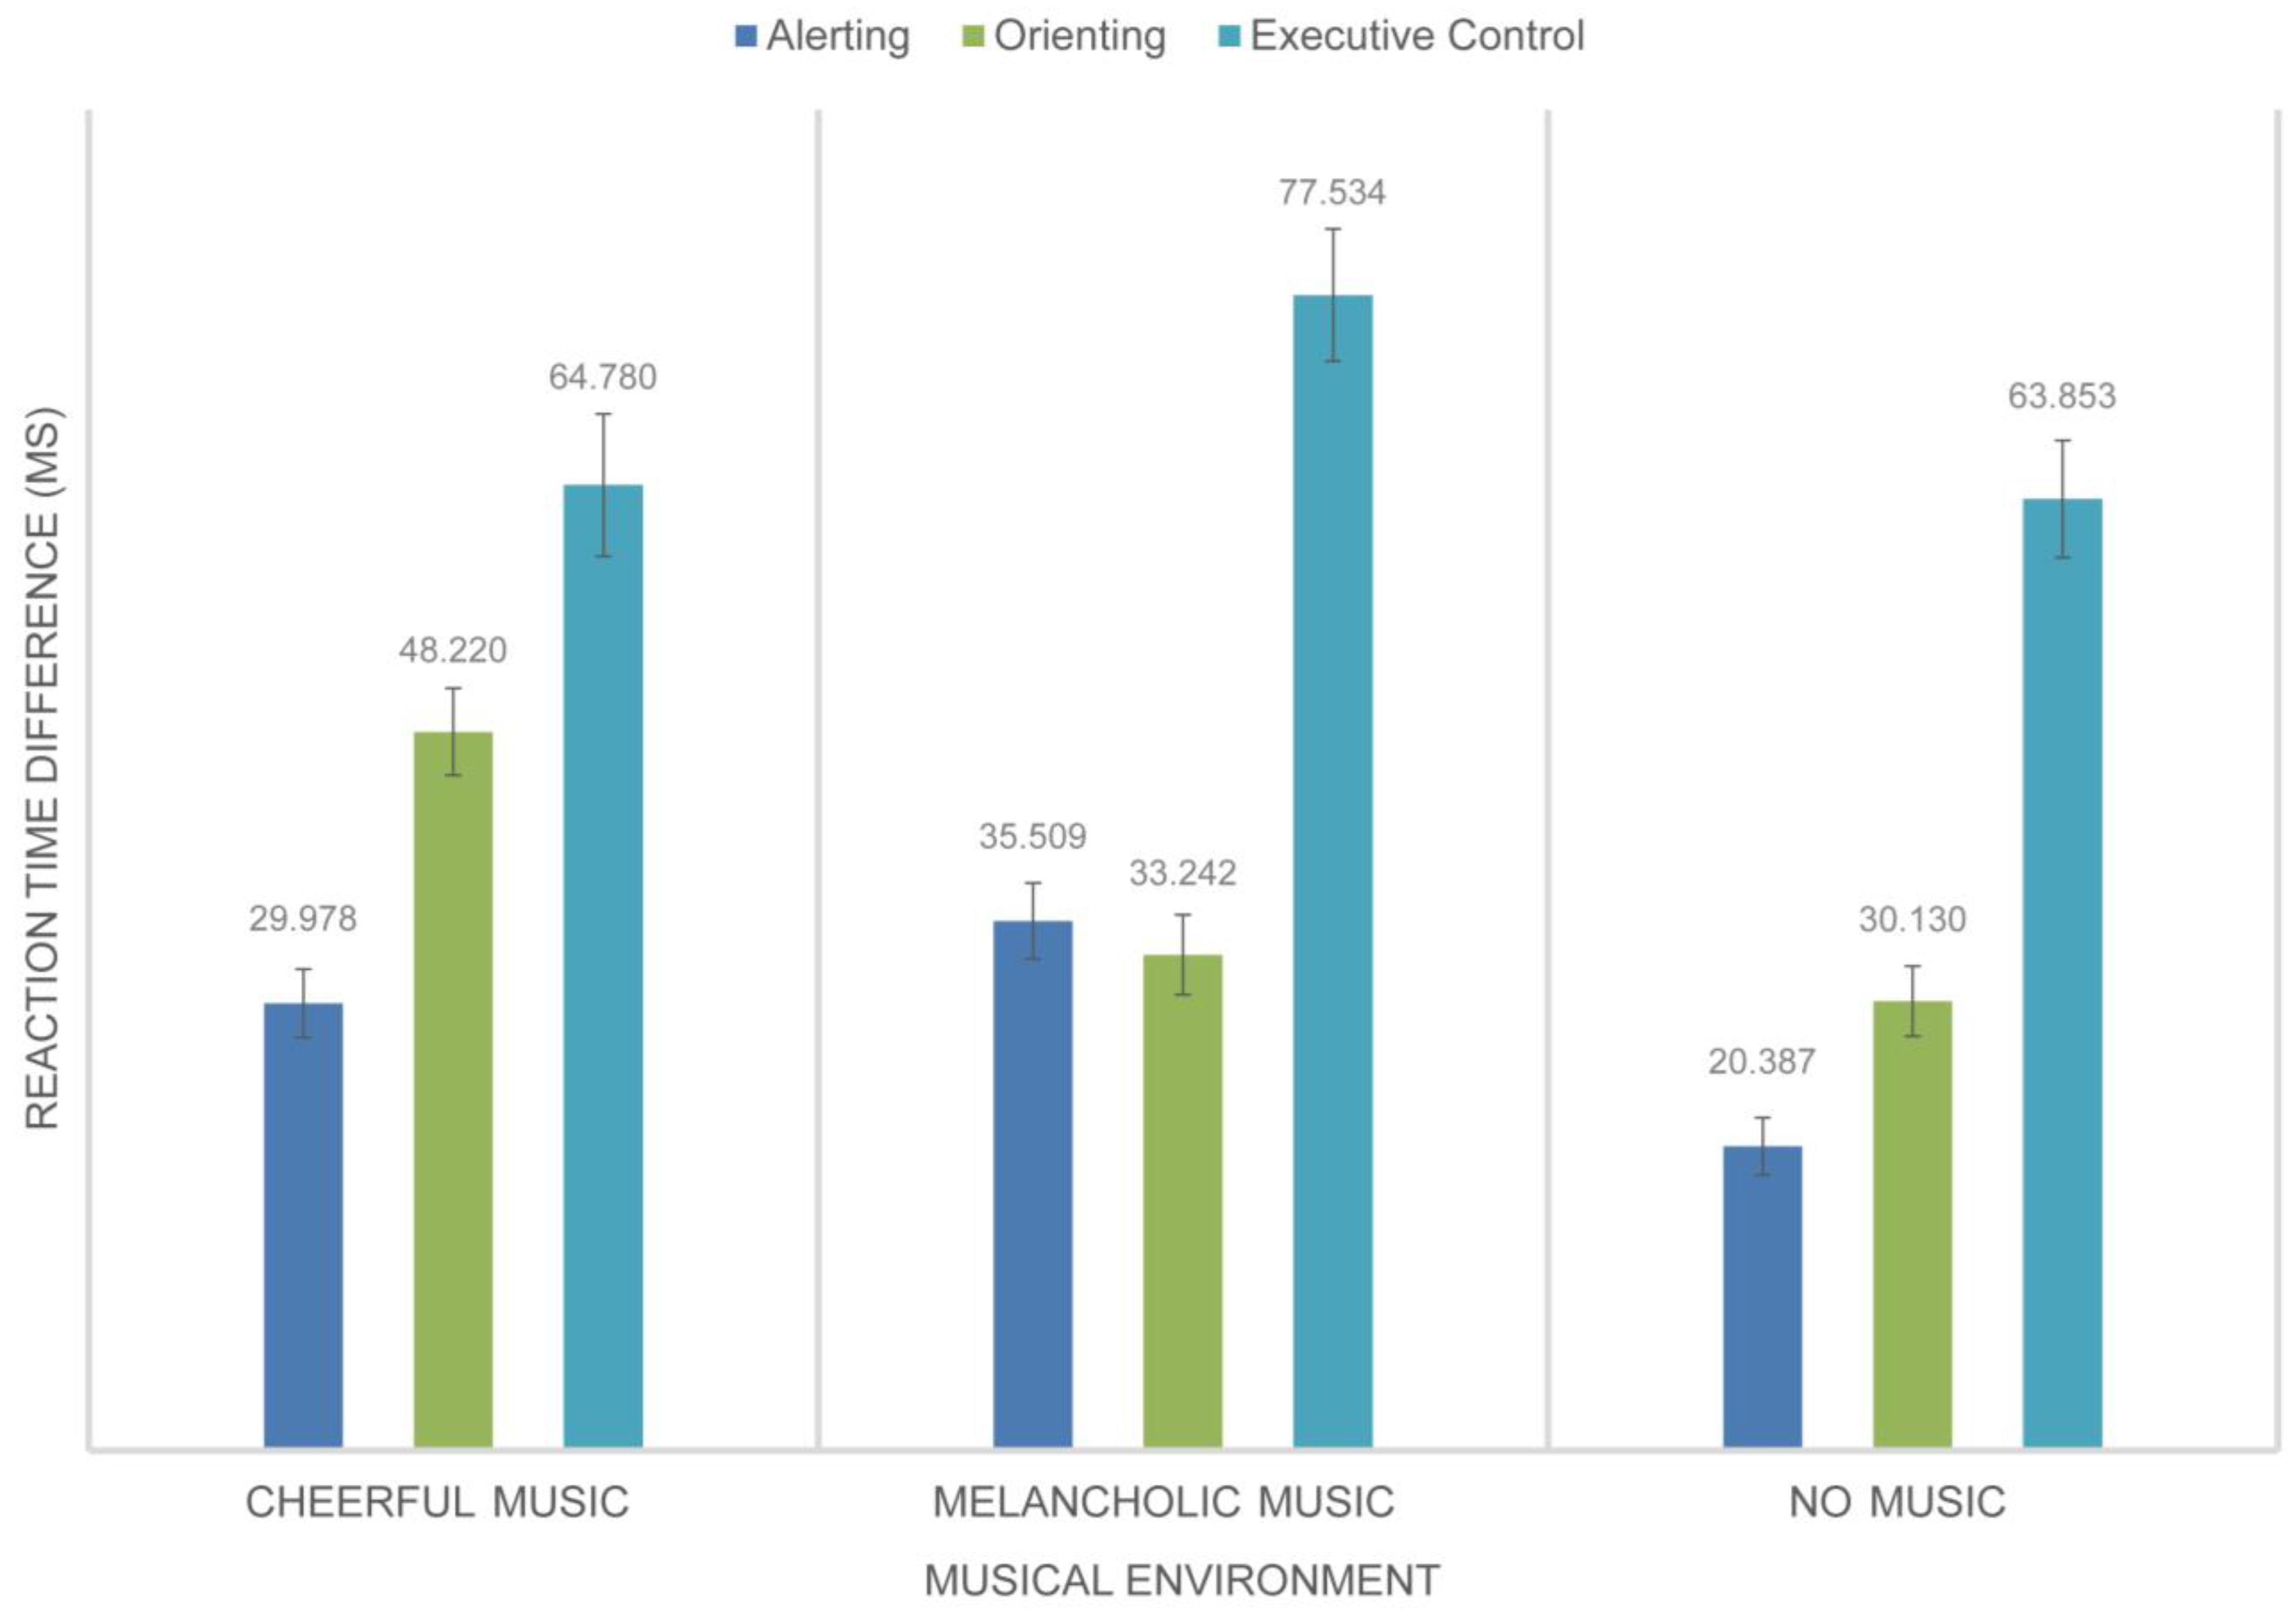
3.3. Changes in Attention in Different Musical Environments
4. Discussion
4.1. Creativity Levels
4.2. Comparison of Attention Networks in Two Groups
4.3. Analysis of Attention Network Subsystems within Design Specialty Groups
4.3.1. Alerting
4.3.2. Executive Control
4.3.3. Orienting
4.4. Shortcomings and Prospects
Author Contributions
Funding
Institutional Review Board Statement
Informed Consent Statement
Data Availability Statement
Acknowledgments
Conflicts of Interest
References
- Souza, A.S.; Oberauer, K. In search of the focus of attention in working memory: 13 years of the retro-cue effect. Atten. Percept. Psychophys. 2016, 78, 1839–1860. [Google Scholar] [CrossRef]
- Arnicane, A.; Souza, A.S. Tracking attentional states: Assessing the relationship between sustained and selective focused attention in visual working memory. Atten. Percept. Psychophys. 2022, 84, 715–738. [Google Scholar] [CrossRef]
- Hannula, D.E. Attention and long-term memory: Bidirectional interactions and their effects on behavior. In Psychology of Learning and Motivation; Federmeier, K.D., Ed.; Elsevier Academic Press Inc.: San Diego, CA, USA, 2018; Volume 69, pp. 285–323. [Google Scholar]
- DeBettencourt, M.T.; Williams, S.D.; Vogel, E.K.; Awh, E. Sustained Attention and Spatial Attention Distinctly Influence Long-term Memory Encoding. J. Cogn. Neurosci. 2021, 33, 2132–2148. [Google Scholar] [CrossRef]
- Bajaj, J.S.; Hafeezullah, M.; Franco, J.; Varma, R.R.; Hoffmann, R.G.; Knox, J.F.; Hischke, D.; Hammeke, T.A.; Pinkerton, S.D.; Saeian, K. Inhibitory control test for the diagnosis of minimal hepatic encephalopathy. Gastroenterology 2008, 135, 1591–1600.e1591. [Google Scholar] [CrossRef]
- Posner, M.I.; Petersen, S.E. The Attention System of the Human Brain. Annu. Rev. Neurosci. 1990, 13, 25–42. [Google Scholar] [CrossRef]
- Fan, J.; McCandliss, B.D.; Sommer, T.; Raz, A.; Posner, M.I. Testing the Efficiency and Independence of Attentional Networks. J. Cogn. Neurosci. 2002, 14, 340–347. [Google Scholar] [CrossRef]
- Coull, J.; Frith, C.; Frackowiak, R.S.J.; Grasby, P. A fronto-parietal network for rapid visual information processing: A PET study of sustained attention and working memory. Neuropsychologia 1996, 34, 1085–1095. [Google Scholar] [CrossRef]
- Corbetta, M.; Shulman, G.L. Control of goal-directed and stimulus-driven attention in the brain. Nat. Rev. Neurosci. 2002, 3, 201–215. [Google Scholar] [CrossRef]
- Bush, G.; Luu, P.; Posner, M.I. Cognitive and emotional influences in anterior cingulate cortex. Trends Cogn. Sci. 2000, 4, 215–222. [Google Scholar] [CrossRef]
- Callejas, A.; Lupiàñez, J.; Funes, M.J.; Tudela, P. Modulations among the alerting, orienting and executive control networks. Exp. Brain Res. 2005, 167, 27–37. [Google Scholar] [CrossRef]
- Fuentes, L.J.; Campoy, G. The time course of alerting effect over orienting in the attention network test. Exp. Brain Res. 2008, 185, 667–672. [Google Scholar] [CrossRef]
- Fan, J.; Gu, X.S.; Guise, K.G.; Liu, X.; Fossella, J.; Wang, H.B.; Posner, M.I. Testing the behavioral interaction and integration of attentional networks. Brain Cogn. 2009, 70, 209–220. [Google Scholar] [CrossRef]
- Baijal, S.; Jha, A.P.; Kiyonaga, A.; Singh, R.; Srinivasan, N. The influence of concentrative meditation training on the development of attention networks during early adolescence. Front. Psychol. 2011, 2, 153. [Google Scholar] [CrossRef]
- Dovorany, N.; Brannick, S.; Johnson, N.; Ratiu, I.; LaCroix, A.N. Happy and sad music acutely modulate different types of attention in older adults. Front. Psychol. 2023, 14, 15. [Google Scholar] [CrossRef]
- McConnell, M.M.; Shore, D.I. Mixing measures: Testing an assumption of the attention network test. Atten. Percept. Psychophys. 2011, 73, 1096–1107. [Google Scholar] [CrossRef]
- Lawson, B. How Designers Think: The Design Process Demystified, 3rd ed.; Architectural Press: New York, NY, USA, 1997. [Google Scholar]
- Meneely, J.; Portillo, M. The Adaptable Mind in Design: Relating Personality, Cognitive Style, and Creative Performance. Creat. Res. J. 2005, 17, 155–166. [Google Scholar] [CrossRef]
- Gao, W.; Jin, D.; Wang, Q.; Zhu, P.F. Integrating User-Centered Design and Biophilic Design to Improve Biophilia and Intelligentization in Office Environments. Buildings 2023, 13, 1687. [Google Scholar] [CrossRef]
- Beaty, R.E.; Benedek, M.; Silvia, P.J.; Schacter, D.L. Creative Cognition and Brain Network Dynamics. Trends Cogn. Sci. 2016, 20, 87–95. [Google Scholar] [CrossRef]
- Gough, H.G. A creative personality scale for the Adjective Check List. J. Personal. Soc. Psychol. 1979, 37, 1398. [Google Scholar] [CrossRef]
- Fürst, G.; Ghisletta, P.; Lubart, T. Toward an integrative model of creativity and personality: Theoretical suggestions and preliminary empirical testing. J. Creat. Behav. 2016, 50, 87–108. [Google Scholar] [CrossRef]
- Carson, S.H.; Peterson, J.B.; Higgins, D.M. Reliability, validity, and factor structure of the creative achievement questionnaire. Creat. Res. J. 2005, 17, 37–50. [Google Scholar] [CrossRef]
- Silvia, P.J.; Winterstein, B.P.; Willse, J.T.; Barona, C.M.; Cram, J.T.; Hess, K.I.; Martinez, J.L.; Richard, C.A. Assessing creativity with divergent thinking tasks: Exploring the reliability and validity of new subjective scoring methods. Psychol. Aesthet. Creat. Arts 2008, 2, 68. [Google Scholar] [CrossRef]
- Amabile, T.M. The social psychology of creativity: A componential conceptualization. J. Personal. Soc. Psychol. 1983, 45, 357. [Google Scholar] [CrossRef]
- Sternberg, R.J.; Davidson, J.E. The nature of insight. Acta Psychol. 1996, 94, 115–116. [Google Scholar]
- Fürst, G.; Grin, F. A comprehensive method for the measurement of everyday creativity. Think. Ski. Creat. 2018, 28, 84–97. [Google Scholar] [CrossRef]
- Zabelina, D.; O’Leary, D.; Pornpattananangkul, N.; Nusslock, R.; Beeman, M. Creativity and Sensory Gating Indexed by the P50: Selective versus Leaky Attention in Divergent Thinkers and Creative Achievers. Neuropsychologia 2015, 69, 77–84. [Google Scholar]
- Tidikis, V.; Ash, I.K.; Collier, A.F. The Interaction of Emotional Valence and Arousal on Attentional Breadth and Creative Task Performance. Creat. Res. J. 2017, 29, 313–330. [Google Scholar] [CrossRef]
- Carruthers, L.; MacLean, R.; Willis, A. The Relationship Between Creativity and Attention in Adults. Creat. Res. J. 2018, 30, 370–379. [Google Scholar]
- Liu, S.; Peng, M. Does Scope of Attention Affect Creativity? Testing the Attentional Priming Hypothesis. J. Creat. Behav. 2020, 54, 423–435. [Google Scholar] [CrossRef]
- Carson, S.H.; Peterson, J.B.; Higgins, D.M. Decreased latent inhibition is associated with increased creative achievement in high-functioning individuals. J. Personal. Soc. Psychol. 2003, 85, 499. [Google Scholar] [CrossRef]
- Zabelina, D.; Saporta, A.; Beeman, M. Flexible or leaky attention in creative people? Distinct patterns of attention for different types of creative thinking. Mem. Cogn. 2016, 44, 488–498. [Google Scholar] [CrossRef]
- Thompson, W.F.; Schellenberg, E.G.; Husain, G. Arousal, mood, and the Mozart effect. Psychol. Sci. 2001, 12, 248–251. [Google Scholar] [CrossRef]
- Gabrielsson, A.; Lindström, E. The role of structure in the musical expression of emotions. In Handbook of Music and Emotion: Theory, Research, Applications; Juslin, P.N., Ed.; Series in affective science; Oxford University Press: New York, NY, USA, 2010; pp. 367–400. [Google Scholar]
- Xing, Y.S.; Xia, Y.; Kendrick, K.; Liu, X.X.; Wang, M.S.; Wu, D.; Yang, H.; Jing, W.; Guo, D.Q.; Yao, D.Z. Mozart, Mozart Rhythm and Retrograde Mozart Effects: Evidences from Behaviours and Neurobiology Bases. Sci. Rep. 2016, 6, 11. [Google Scholar] [CrossRef]
- Carstens, C.B.; Huskins, E.; Hounshell, G.W. Listening to Mozart may not enhance performance on the revised Minnesota paper form board test. Psychol. Rep. 1995, 77, 111–114. [Google Scholar] [CrossRef]
- Newman, J.; Rosenbach, J.H.; Burns, K.L.; Latimer, B.C.; Matocha, H.R.; Vogt, E.R. An experimental test of “the Mozart effect”: Does listening to his music improve spatial ability? Percept. Mot. Ski. 1995, 81 (Suppl. S3), 1379–1387. [Google Scholar]
- Stough, C.; Kerkin, B.; Bates, T.; Mangan, G. Music and spatial IQ. Personal. Individ. Differ. 1994, 17, 695. [Google Scholar] [CrossRef]
- McKelvie, P.; Low, J. Listening to Mozart does not improve children’s spatial ability: Final curtains for the Mozart effect. Br. J. Dev. Psychol. 2002, 20, 241–258. [Google Scholar] [CrossRef]
- Aheadi, A.; Dixon, P.; Glover, S. A limiting feature of the Mozart effect: Listening enhances mental rotation abilities in non-musicians but not musicians. Psychol. Music 2010, 38, 107–117. [Google Scholar] [CrossRef]
- Grylls, E.; Kinsky, M.; Baggott, A.; Wabnitz, C.; McLellan, A. Study of the Mozart effect in children with epileptic electroencephalograms. Seizure 2018, 59, 77–81. [Google Scholar] [CrossRef]
- Silva, S.; Belim, F.; Castro, S. Corrigendum: The Mozart effect on the episodic memory of healthy adults is null, but low-functioning older adults may be an exception. Front. Psychol. 2023, 14, 1. [Google Scholar] [CrossRef]
- Husain, G.; Thompson, W.F.; Schellenberg, E.G. Effects of musical tempo and mode on arousal, mood, and spatial abilities. Music Percept. 2002, 20, 151–171. [Google Scholar] [CrossRef]
- He, W.J.; Wong, W.C.; Hui, A.N.N. Emotional Reactions Mediate the Effect of Music Listening on Creative Thinking: Perspective of the Arousal-and-Mood Hypothesis. Front. Psychol. 2017, 8, 12. [Google Scholar] [CrossRef]
- Sloboda, J.A.; Juslin, P.N. Psychological perspectives on music and emotion. In Music and Emotion: Theory and Research; Series in affective science; Oxford University Press: New York, NY, USA, 2001; pp. 71–104. [Google Scholar]
- Nantais, K.M.; Schellenberg, E.G. The Mozart effect: An artifact of preference. Psychol. Sci. 1999, 10, 370–373. [Google Scholar] [CrossRef]
- Xia, T.S.; Sun, Y.Q.; An, Y.; Li, L.L. The influence of music environment on conceptual design creativity. Front. Psychol. 2023, 14, 9. [Google Scholar] [CrossRef]
- Liu, M. The Effect of Negative Feedback on Individuals’ Creative Performance and Its Psychological Mechanism. Ph.D. Thesis, East China Normal University, Shanghai, China, 2022. (In Chinese) [Google Scholar] [CrossRef]
- Ishiguro, C.; Sato, Y.; Takahashi, A.; Abe, Y.; Kato, E.; Takagishi, H. Relationships among creativity indices: Creative potential, production, achievement, and beliefs about own creative personality. PLoS ONE 2022, 17, 21. [Google Scholar] [CrossRef]
- Cheung, C.K.; Rudowicz, E.; Yue, X.; Kwan, A.S. Creativity of university students: What is the impact of field and year of study? J. Creat. Behav. 2003, 37, 42–63. [Google Scholar] [CrossRef]
- Simonton, D.K. Formal education, eminence and dogmatism: The curvilinear relationship. J. Creat. Behav. 1983, 17, 149–162. [Google Scholar] [CrossRef]
- Dacey, J.S.; Lennon, K.H. Understanding Creativity: The Interplay of Biological, Psychological, and Social Factors; Jossey-Bass: Hoboken, NJ, USA, 1998. [Google Scholar]
- Deng, L.; Wang, L.; Zhao, Y. How creativity was affected by environmental factors and individual characteristics: A cross-cultural comparison perspective. Creat. Res. J. 2016, 28, 357–366. [Google Scholar] [CrossRef]
- Sarkar, P.; Chakrabarti, A. Ideas generated in conceptual design and their effects on creativity. Res. Eng. Des. 2014, 25, 185–201. [Google Scholar] [CrossRef]
- Garza, A.G.D.; Maher, M.L. Design by interactive exploration using memory-based techniques. Knowl.-Based Syst. 1996, 9, 151–161. [Google Scholar] [CrossRef]
- Lunke, K.; Meier, B. Disentangling the Impact of Artistic Creativity on Creative Thinking, Working Memory, Attention, and Intelligence: Evidence for Domain-Specific Relationships with a New Self-Report Questionnaire. Front. Psychol. 2016, 7, 11. [Google Scholar] [CrossRef]
- McConnell, M.M.; Shore, D.I. Upbeat and happy: Arousal as an important factor in studying attention: Corrigendum. Cogn. Emot. 2012, 26, 192. [Google Scholar] [CrossRef]
- Shih, Y.N.; Huang, R.H.; Chiang, H.S. Correlation between work concentration level and background music: A pilot study. Work-A J. Prev. Assess. Rehabil. 2009, 33, 329–333. [Google Scholar] [CrossRef]
- Kiss, L.; Linnell, K.J. The effect of preferred background music on task-focus in sustained attention. Psychol. Res.-Psychol. Forsch. 2021, 85, 2313–2325. [Google Scholar] [CrossRef]
- Brown, J.A.; Bidelman, G.M. Familiarity of Background Music Modulates the Cortical Tracking of Target Speech at the “Cocktail Party”. Brain Sci. 2022, 12, 1320. [Google Scholar] [CrossRef]
- Spagna, A.; Mackie, M.-A.; Fan, J. Supramodal executive control of attention. Front. Psychol. 2015, 6, 65. [Google Scholar] [CrossRef]
- Fan, J.; Fossella, J.; Sommer, T.; Wu, Y.H.; Posner, M.I. Mapping the genetic variation of executive attention onto brain activity. Proc. Natl. Acad. Sci. USA 2003, 100, 7406–7411. [Google Scholar] [CrossRef]
- Radel, R.; Davranche, K.; Fournier, M.; Dietrich, A. The role of (dis)inhibition in creativity: Decreased inhibition improves idea generation. Cognition 2015, 134, 110–120. [Google Scholar] [CrossRef]
- Raz, A.; Buhle, J. Typologies of attentional networks. Nat. Rev. Neurosci. 2006, 7, 367–379. [Google Scholar] [CrossRef]
- Carmel, D.; Bentin, S. Domain specificity versus expertise: Factors influencing distinct processing of faces. Cognition 2002, 83, 1–29. [Google Scholar] [CrossRef]
- Jiang, J.; Scolaro, A.J.; Bailey, K.; Chen, A. The effect of music-induced mood on attentional networks. Int. J. Psychol. 2011, 46, 214–222. [Google Scholar] [CrossRef]
- Liu, Y.; Liu, G.Y.; Wei, D.T.; Li, Q.; Yuan, G.J.; Wu, S.F.; Wang, G.Y.; Zhao, X.C. Effects of Musical Tempo on Musicians’ and Non-musicians’ Emotional Experience When Listening to Music. Front. Psychol. 2018, 9, 11. [Google Scholar] [CrossRef]
- Kiss, L.; Linnell, K.J. Making sense of background music listening habits: An arousal and task-complexity account. Psychol. Music 2023, 51, 89–106. [Google Scholar] [CrossRef]

| Group | Gender | Grade | Major | |||
|---|---|---|---|---|---|---|
| Professional Group | Male | 33 | Fourth-Year University Study | 8 | Applied design students | 40 |
| First-Year Graduate Study | 14 | |||||
| Female | 28 | Second-Year Graduate Study | 4 | Academic design students | 21 | |
| Third-Year Graduate Study | 4 | |||||
| Control Subjects | Male | 21 | Fourth-Year University Study | 9 | Applied engineering students | 33 |
| First-Year Graduate Study | 13 | |||||
| Female | 12 | Second-Year Graduate Study | 3 | |||
| Third-Year Graduate Study | 7 | |||||
| Type of Music | n | Ordinal Mean | Mann–Whitney U | p |
|---|---|---|---|---|
| Cheerful music | 32 | 33.59 | 445.000 | 0.394 |
| Melancholic music | 31 | 30.35 |
| Groups | Scale Score |
|---|---|
| Design Professional Group | 7.639 ± 6.213 |
| Control Group | 5.212 ± 4.442 |
| Attention Subnetwork | Groups | Cheerful Music | Melancholic Music | No Music |
|---|---|---|---|---|
| Alerting | Design Professional Group | 35.509 ± 17.881 | 29.978 ± 19.863 | 20.387 ± 15.007 |
| Control Subjects | 19.421 ± 23.625 | 30.062 ± 13.197 | 13.785 ± 12.209 | |
| Orienting | Design Professional Group | 33.242 ± 22.865 | 48.22 ± 21.073 | 30.13 ± 18.406 |
| Control Subjects | 29.546 ± 19.287 | 39.497 ± 21.988 | 38.074 ± 20.83 | |
| Executive control | Design Professional Group | 77.534 ± 37.311 | 64.78 ± 34.641 | 63.853 ± 30.734 |
| Control Subjects | 67.227 ± 35.026 | 63.388 ± 29.63 | 57.194 ± 26.02 |
| Prerequisite | N | F | p | η2 |
|---|---|---|---|---|
| Alerting | 61 | 3.812 | 0.028 | 0.116 |
| Orienting | 61 | 4.301 | 0.018 | 0.129 |
| Executive control | 61 | 1.021 | 0.367 | 0.034 |
Disclaimer/Publisher’s Note: The statements, opinions and data contained in all publications are solely those of the individual author(s) and contributor(s) and not of MDPI and/or the editor(s). MDPI and/or the editor(s) disclaim responsibility for any injury to people or property resulting from any ideas, methods, instructions or products referred to in the content. |
© 2024 by the authors. Licensee MDPI, Basel, Switzerland. This article is an open access article distributed under the terms and conditions of the Creative Commons Attribution (CC BY) license (https://creativecommons.org/licenses/by/4.0/).
Share and Cite
Yu, S.; Chen, X. The Effect of Musical Environments on Designers’ Attention: Persistent Music Listening Interferes with Attention. Behav. Sci. 2024, 14, 216. https://doi.org/10.3390/bs14030216
Yu S, Chen X. The Effect of Musical Environments on Designers’ Attention: Persistent Music Listening Interferes with Attention. Behavioral Sciences. 2024; 14(3):216. https://doi.org/10.3390/bs14030216
Chicago/Turabian StyleYu, Shulan, and Xinran Chen. 2024. "The Effect of Musical Environments on Designers’ Attention: Persistent Music Listening Interferes with Attention" Behavioral Sciences 14, no. 3: 216. https://doi.org/10.3390/bs14030216
APA StyleYu, S., & Chen, X. (2024). The Effect of Musical Environments on Designers’ Attention: Persistent Music Listening Interferes with Attention. Behavioral Sciences, 14(3), 216. https://doi.org/10.3390/bs14030216