Article

Factors Affecting the Repurchase Intention of Organic Tea among Millennial Consumers: An Empirical Study

by
Huawei Tian
1,*,
Abu Bakkar Siddik
2,* and
Mohammad Masukujjaman
3
1
College of Economics and Management, Zhoukou Normal University, Zhoukou 466000, China
2
School of Economics and Management, Shaanxi University of Science and Technology (SUST), Weiyang District, Xi’an 710021, China
3
Department of Business Administration, Northern University Bangladesh, Dhaka 1213, Bangladesh
*
Authors to whom correspondence should be addressed.
Behav. Sci. 2022, 12(2), 50; https://doi.org/10.3390/bs12020050
Submission received: 17 January 2022 / Revised: 3 February 2022 / Accepted: 14 February 2022 / Published: 16 February 2022

Abstract

:
The study aims to identify the factors affecting consumers’ intention to repurchase organic tea in an emerging country such as Bangladesh. The study adopted the Stimulus-Organism-Response (SOR) theory, which uses seven constructs as the predictor of repurchase intention. This is a quantitative and empirical study that adopted cross-sectional survey methods. The convenience sampling method was used to collect data from 340 young respondents who visited supermarkets in Dhaka between October and November 2021. In order to analyze the obtained primary data, the structural equation modeling (SEM) approach was used. The findings revealed that product satisfaction, perceived values and brand trust are the predictors of repurchase intention. Surprisingly, we did not find that promotional efforts effected repurchase intention. The study also identified food quality and information quality as the antecedents of perceived value and product satisfaction, while the antecedents of brand trust were product satisfaction, food quality, brand image, information quality and promotional effort. The study suggested numerous theoretical and policy implications to improve repurchase intention of organic tea in the context of emerging economies such as Bangladesh.

1. Introduction

Fresh food is a daily necessity, as it provides balanced nutrition for human health. However, the consumption of healthy fresh food is threatened by physical, chemical and biological pollution, resulting in the circulation of pesticide residue-containing and pathogen-harboring fresh produce [1]. As a result, food safety has been a major concern among consumers, food producers and policymakers globally [2]. Food safety has become a critical consumer standard [3] and begins with the elimination of pollutants during the food manufacturing process [4]. Consequently, manufacturers commonly face criticism when the issue of food safety risks is advanced by consumers [5]. In recent years, organic items, particularly organic food, have gained popularity among customers due to their health benefits [6]. Organic foods are safe, since they are grown without herbicides, chemical pesticides, ionizing radiation, bioengineering, sewage sludge, or synthetic fertilizers. Although organic foods are healthier than conventional foods [7], they are inherently more expensive; this constitutes a major deterrent towards their consumption [8,9]. The quality of information labeled on the product has been identified as an important factor in repeat buying, as indicated by studies on mobile banking [10], health infomediaries [11], virtual travel community [12], and food apps sensitization [13]. However, this has not been examined in the context of organic food repurchase intention. Moreover, it is unknown how a customer’s perception of food quality affects product satisfaction, trust and perceived value towards organic food repurchase. As such, there is a need to address this critical knowledge gap by analyzing the antecedent role of product satisfaction, brand trust and perceived value on a customer’s repurchase intentions.
Repurchase is a result of consumers’ desire to repeat-buy a certain commodity (e.g., organic food) to derive further benefits. However, this is determined by accessibility, household spending capacity and marketing strategies [14]. While existing research has uncovered important indicators of a customer’s behavioral intentions toward organic foods [15,16,17,18], relatively few researchers have examined the determinants of organic food repurchase intentions [19,20,21,22]. Hence, there is undoubtedly a need for an academic analysis of food-related elements that contribute to a customer’s repurchase intentions of organic food products from both theoretical and managerial standpoints. Additionally, understanding the predictive factors that influence a consumer’s repurchase intentions may assist investors and marketers in developing effective strategies in the highly competitive food industry. Studies have shown that repurchase intention differs between generations, especially Gen Y and Gen X [23,24]. Understanding millennials’ green customer behavior is crucial in developing green marketing strategies that target this generation [25,26]. This will also contribute to the comprehensive understanding of millennials’ consumption behavior and the linked issue of sustainable consumption. In Bangladesh, a study has been undertaken on millennial customers’ loyalty in banking [27] and their intention to make green purchasing decisions [28]. Recently, Zheng et al. [29] conducted a study on millennials’ intentions to purchase organic products. However, to the researcher’s knowledge, there is no comprehensive study on millennials’ repurchase intention of organic food in the Bangladeshi context.
Many studies have examined the S-O-R model in various contexts, such as the effect of price on organic food preference [30], the role of a retail environment on impulse buying [31], online consumer behavior in tourism and hospitality contexts [32,33], consumer behavior in a smartphone context [34], and more recently, organic food consumption intention in the context of Indonesia [35], Japan [36] and Australia [37]. So far, no studies have been conducted on repurchase intention of organic food using the model. Therefore, it is essential to know whether the model is also applicable to the repurchase phenomenon in developing countries such as Bangladesh. By addressing all the above gaps, the current paper seeks to discover the factors that influence the repurchase intention of organic tea products among Bangladeshi Millennials within the S-O-R framework, thereby making significant contributions in terms of novel context, unique outcome and model development.
As a guide, the following sections are organized in chronological order: There is a literature review and the formulation of hypotheses in the second half of the paper. Data collection, sample size, and the survey instrument are all covered in the Section 3. The Section 7 sums up the findings and summarizes the analysis. Ending comments and research suggestions are included in the article’s conclusion.

2. Literature Review and Hypothesis Development

2.1. The Millennial

Several names have been given to the young generation, namely millennial, Gen Y, Generation Me, or Echo Boomers [38,39]. The name “Baby boomer children” or “Echo Boomers” can be traced to the dramatic rise in birth rates that occurred between the early 1980s and the middle of the 1990s (ages now between 26–41 years). In today’s world, millennials are highly educated, digitally proficient and resistant to traditional marketing tactics. They are also more varied in terms of color and ethnic backgrounds, as well as media consumption, and tend to be more fragmented. Last but not least, these populations are less loyal to brands, as they can access the internet quickly and easily learn new habits, styles and communication methods [40]. A recent study shows that the majority of millennial buyers are excited about buying green items [41,42].

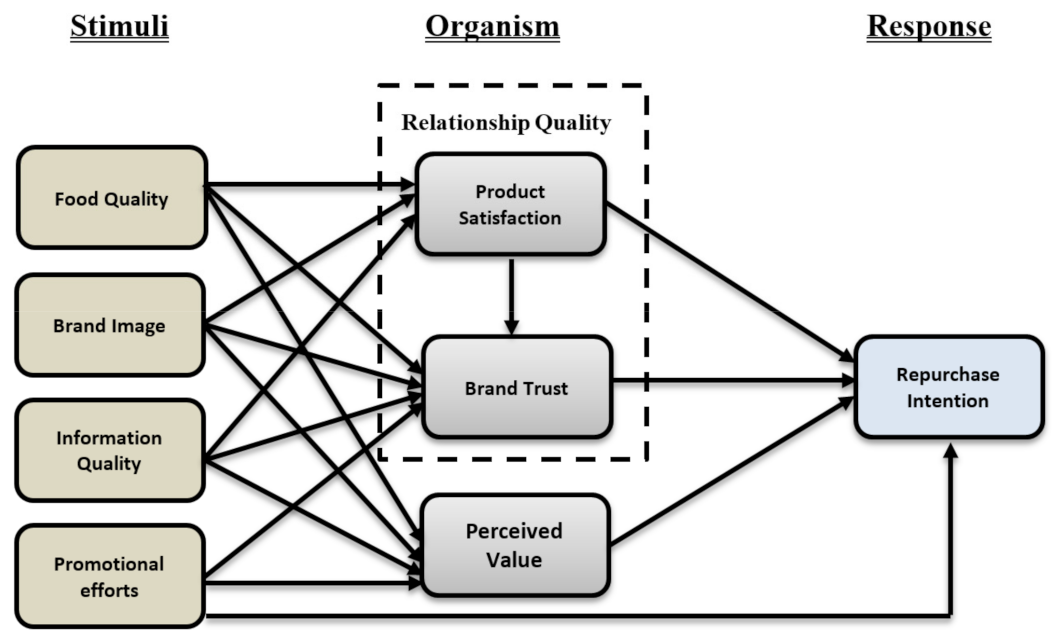
2.2. The Stimulus–Organism–Response (S–O–R) Framework

The S–O–R framework focuses on the interaction between the stimulus, the organism and the response. For example, it can explain certain behavioral patterns, such as why some people become nervous when asked to speak in front of a large crowd, while others are genuinely enthusiastic about the same. The theoretical underpinnings of this work are Mehrabian and Russell’s [43] application of the S–O–R paradigm. In fact, the concept originated in environmental psychology [44] and was derived from behaviorism’s Stimulus-Response (S–R) theory [45]. Animals’ simultaneous reactions to stimuli and responses were found to be the basis for the discovery of the original behaviorism model. If one examines reactions from an S–R perspective, this type of behavior might occur spontaneously as a result of being exposed to particular inputs, such as thinking and emotion [46]. In line with this theory, customers may behave differently depending on their primary emotional reaction to the cues presented to them. This model predicts how customers will react to marketing cues, according to Chen and Yao [47]. For this reason, researchers and marketing managers are collaborating to better understand customers’ reactions and preferences. When it comes to customer satisfaction or dissatisfaction, perceptions of quality (both product and service), perceived value and brand experience are important (as an organism). In either case, the contentment or discontent is what prompts the final reply. Customers’ favorable or negative responses to stimuli reveal their final reaction, i.e., whether they will choose or avoid the brand. Therefore, Figure 1 shows the conceptual framework of the study.

2.3. Hypothesis Development

2.3.1. Food Quality

Food presentation, taste, menu variety, healthiness and freshness are all components of food quality [48]. Food quality is a major marketing factor that determines customers’ satisfaction and retention, in addition to providing a positive shopping experience. Food quality can impact customer satisfaction and behavior [49]. Several studies have shown that food quality affects consumers’ happiness [50,51,52,53,54,55]. Additionally, earlier empirical research has suggested that perceived dietary healthiness is critical for customer satisfaction and perceived value [56]. Food safety and quality is also reported to increase brand trust [57] and perceived value [58]. De Toni et al. [22] also noted that perceived food quality influences perceived value of organic product. On this basis, we propose the following:
Hypotheses (H1)–(H3):
Food quality will positively influence customer satisfaction, brand trust and perceived value.

2.3.2. Brand Image

Brand image is the sum of personal associations, user experiences and brand beliefs [59]. Eventually, clients will trust a brand more if they have confidence in it. Previous research has shown a positive correlation between brand image and trust [60]. Similarly, brand image has shown to be a strong predictor of consumer satisfaction [61,62,63], whereas others [64,65] found no association. Many studies also showed that brand image affects perceived value [66,67,68]. According to Chen et al. [66], brand linkage increases perceived value, while Nguyen [63] found no relationship for the same. Lai et al. [69] also noted that brand image predicts perceived value and consumer satisfaction. Based on the above argument and empirical evidence, this study proposes the following:
Hypotheses (H4)–(H6):
Brand image will positively influence customer satisfaction, brand trust and perceived value.

2.3.3. Information Quality

Information quality measures the usefulness, accuracy and timeliness of information. Consumers may distrust suppliers’ ability and integrity if provided with irrelevant, erroneous, or outdated information. Additionally, they may believe that suppliers will deceive them and disregard their demands. According to Zhou [70], information quality affects users’ trust in mobile websites. Users’ trust in mobile banking, health infomediaries and virtual travel communities have all been found to be influenced by the quality of available information [12].
Customer satisfaction may also be impacted by the quality of information. Quality information saves consumers’ time, helps them compare costs and provides them with relevant sales information [71]. Customers demand reliable, relevant and fast information when purchasing their organic products. Previous research has demonstrated the effect of information quality on users’ satisfaction with mobile internet sites [72], mobile banking [10] and virtual communities [12]. Therefore, it is expected that information quality will also predict consumer satisfaction, brand trust and perceived value for organic products, as dictated in the following hypotheses:
Hypotheses (H7)–(H9):
Information quality will positively influence customer satisfaction, brand trust and perceived value.

2.3.4. Promotional Efforts

Promotion (PR) is a type of communication method used by businesses to raise awareness of their products to consumers and differentiate them from opponents [73,74]. A study [75] found a significant influence of promotion on repurchase intention. Promotion encourages non-frequent customers to return and purchase again. Similarly, marketing communication directly influences brand trust [76,77,78]. Since communication builds brand trust, brand communities and customer interactions on social media have been shown to influence brand trust [79]. Promotion enhances consumers’ ties with brand community aspects and boosts brand trust. Additionally, Lee and Ahn [80] discovered that promotions influence customer repurchase intent.
Promotions can serve as a source of information for the evaluation of products and stores ([81]. Unexpected promotions can be attributed to sheer chance and might help alleviate feelings of guilt linked with goods purchased. The researchers discovered that price promotions (e.g., discounts) have a beneficial effect on customers’ estimate of the fair price for the promoted product, their perceived value of the offer, contentment with the purchase and repurchasing intention [82,83].
Hypotheses (H10)–(H12):
Promotional effort will positively affect brand trust, perceived value and repurchasing intention.

2.3.5. Product Satisfaction

Satisfaction is a state of mind that develops over time as a result of prolonged positive association with a seller [84]. Customer satisfaction can be described as an overall evaluation of a product or service based on one’s purchase and consumption experience over time [85]. If consumers are dissatisfied with a vendor or its organic products, they may discontinue their patronage. Prior research indicated that contentment is a significant predictor of persistence behavior [72,86,87]. Hence, we anticipated a beneficial influence of satisfaction on consumers’ intent to repurchase organic products.
Numerous empirical studies have demonstrated a positive correlation between satisfaction and trust (e.g., [60,88]. According to these studies, customers’ perception of organic food may be influenced by prior experiences with these items. As a result, it is projected that the ability of organic food to match consumers’ expectation may influence their trust in the food product. In line with this logic, extremely satisfied consumers are more likely to trust organic food. Hence, the following hypothesis 13–14 is proposed:
Hypotheses (H13)–(H14):
Product satisfaction will positively affect brand trust and repurchase intention.

2.3.6. Brand Trust

Trust represents an acceptance of vulnerability in anticipation of favorable future behavior of another party. If the concept of customer experience is included, trust is perhaps more crucial for repurchase intention [89], as many experts believe that repurchase intention is dependent on customers’ experiences, which include both cognitive and emotional components, with a particular service provider in the future. According to scholars [90,91], brand trust is the most crucial antecedents of repurchase intention. Hung et al. [87] established a favorable correlation between trusts and repeat buying. Saleem et al. [92] also discovered a favorable association between trust and propensity to repurchase. Thus, we assume that trust will affect the intention to buy organic foods and proposed the following hypothesis:
Hypotheses (H15):
Trust will positively affect the repurchase intention.

2.3.7. Perceived Value

Perceived value refers to a detailed assessment of service by customers on the basis of their experience, Zeithaml [93]. Perceived value might influence a person’s desire to revisit a location or repurchase a product. Earlier research has established that perceived value has an effect on a customer’s buying intention [94,95,96] and that the pricing and service quality of air carriers have a substantial impact on a customer’s purchasing choice and perceived value [97,98]. Chen, Li, and Liu [66] discovered that passengers’ perceived value significantly influenced their repurchasing intention, as echoed by Yang et al. [99]. Since organic consumers expect higher product quality and spend more on organic products, their perceived value is expected to influence their repurchase intention, as highlighted in following hypothesis.
Hypotheses (16):
Perceived value significantly affects repurchase intention.

3. Materials and Methods

A cross-sectional survey method was used in this empirical study. In this regard, the data were gathered solely to ascertain the characteristics of the population at a particular point in time.

3.1. Population and Sampling Technique

The participants in the study were individual household members living in Dhaka, the capital city of Bangladesh, and had purchased and drank organic tea items up to the study period. The respondents were gathered from 20 shopping malls and mega shops in 10 locations of Dhaka city and questioned in Bengali, which was later translated into English. The survey was conducted during the period between October and November 2021. The sample size was calculated using G*power for priory sample size sufficiency [100] and to calculate the number of participants required for the study. Cohen [101] recommended a sample size of 153 for seven independent constructs or predictors (effect size f2 = 0.15, error type 1 = 0.05, and error type 2 ß = 0.20). Barclay et al. [98] proposed a tenfold sample rule in which they multiplied the maximum number of indicators used in the SEM method by 10. The survey requires 240 (10 × 24) respondents based on these criteria. To alleviate the possible issues associated with small sample sizes, 400 respondents were reached (refusal rate of around 40%) using a non-probability convenience selection strategy. However, 340 samples were selected, while obliterating 37 incomplete and 23 screened-out responses.
Convenience sampling was employed in selecting the respondents [102] for marketing customer data, and the mall-intercept technique was used [103,104] to collect individualized, accurate, and high-quality information [105]. The visitor to the showrooms or centers was requested to participate in the survey. The respondent’s refusal prompted a response from the next most likely candidate. Potential responders were given a questionnaire to fill out and were promised the confidentiality of the information they supplied. For a week in the afternoons, different centers were visited to collect data.

3.2. Research Instrument

The survey instrument was constructed using items from previously validated scales. In this regard, food quality was measured by a three-item scale adapted from Ezgi Erkmen, Murat Hancer, [106]; Sumi and Kabir [107]. Three items for behavioral intention were adapted from Ezgi Erkmen, Murat Hancer, [106]. Information quality was assessed with three items from Gao et al. [108] and Sumi and Kabir [107]. Promotional efforts and brand trust were assessed with three items adapted from Kwon et al. [109]. Product satisfaction comprises three items that were culled from Gao et al. [108], while perceived value and repurchase intention were adapted from Ali and Bhasin, [110]. The responses to the relevant constructs were rated on five-point Likert scales, with 1 indicating strong disagreement and 5 denoting strong agreement. A different set of twenty organic tea customers served as the pre-test sample. In response to the feedback from the pilot sample, minor wording changes were made to the questionnaire to ensure that the scale items were understandable. Table 2 illustrates the items, their convergent validity and their reliability values.

3.3. Statistical Analysis

The conceptual model was examined by means of SPSS and AMOS version 21. According to Anderson and Gerbing [111], a two-stage SEM approach was used to analyze the data at hand. The Confirmatory Factor Analysis (CFA) was used in the first stage to evaluate the reliability and validity of the measurement model. The second stage comprised the development of the measurement model. The standardized regression coefficients (β) and p-values were calculated for the entire structural model in the second stage in order to examine the overall model fit, in addition to the supposed relationships.

4. Results and Discussion

4.1. Respondents Profile

According to the survey’s socio-demographic profile, 55% of the 340 respondents were female, 59% were married and 52% were university graduates. Regarding age, all respondents were between 18 and 45 years, indicating that they were millennial customers. As a result, Table 1 displays the socio-demographic data of the respondents.

4.2. Reliability Analysis

The consistency and reliability of the study variables were examined using Cronbach’s Alpha (CA) coefficients and Composite Reliability (CR), as indicated in Table 2. Cronbach’s alpha is a measure that identifies how closely connected a group of items are to one another on a statistical basis. Likewise, composite reliability measures the degree to which the group of constructs contained in the model is related to a specific latent variable. The empirical results revealed that the CA values for all variables vary from 0.769 to 0.903, which exceeds the minimum standard value of 0.7 [112]. Furthermore, the CR of the study variables ranges from 0.760 to 0.850, which is higher than the acceptable limit of 0.7 [112]. Hence, it can be argued that the internal consistency and reliability of the study variables are adequate and satisfactory [113].

4.3. Convergent Validity

The degree of confidence we have that a trait is well assessed by its indicators is referred to as convergent validity [114]. A high factor loading of measured items indicates that the construct is convergent on a common point, and the values should be greater than 0.7 to be considered acceptable [112]. Consequently, the outputs showed that all factor loadings of measurement items ranged from 0.699 to 0.840 (see Table 1), exceeding the minimum acceptable threshold value of 0.5 [112]. Additionally, the Average Variance Extracted (AVE) and CR can be used to determine the measurement model’s convergent validity, according to Fornell–Larcker [113]. The average variance extracted (AVE) is a measure of the amount of variance that is captured by a construct in relation to the amount of variance due to measurement error. Accordingly, the AVE values range from 0.514 to 0.660, and the CR values from 0.760 to 0.850, both of which are greater than the standard values of 0.5 and 0.7 (Hair et al., 2010; Fornell–Larcker, 1981). Therefore, the scale demonstrated convergent validity.

4.4. Discriminant Validity

The Fornell–Larcker criterion and the Heterotrait–Monotrait ratio (HTMT) method were used to evaluate the discriminant validity. The square root of each construct’s AVE score was required to be higher than its highest correlation with other constructs in the model [112] to determine the discriminant validity of the Fornell–Larcker technique [113]. The value of the AVE’s square root in the diagonal surpassed the value of other variables off-diagonal (see Table 2), indicating the existence of discriminant validity [113]. In addition, for robustness, this study examined the HTMT value due to its advantages over Fornell–Larcker in a variety of conditions [115]. The HTMT values were found to be less than 0.90 (see Table 3), confirming that there was no discriminant validity concern [115]. Overall, the results imply that the discriminant validity is adequate and satisfactory.

4.5. Testing Normality, Multicollinearity and Coefficient of Determination

Table 4 illustrates the multicollinearity results as well as the study variables’ coefficients of determination. The empirical outputs showed that the skewness and kurtosis values were less than ±3 and ±10, respectively, as shown in Table 3. The results can be considered satisfactory in terms of normality, since the variance derived from the normality testing exhibited no issues [116]. In addition, the VIF approach was used in this study to identify the existence of multicollinearity among the independent variables, as proposed by Kleinbaum et al. [117]. Consequently, the VIF values ranged from 1.794 to 3.230, which fall below the minimum acceptable limit of 10. Therefore, multicollinearity is not a problem in this study. Furthermore, the R–square assesses the model’s explanatory power by finding endogenous factors that are emphasized as determining coefficients. The R2 value of the endogenous latent variable is considered significant when it exceeds 0.26, moderate when it is 0.13 and weak when it is less than 0.13, as indicated by Cohen [118]. According to the empirical data, the value of R2 of the endogenous latent construct satisfies under the conditions stipulated by Falk and Miller [119]. As a result, based on the outputs, it can be concluded that the suggested model has a high explanatory power range and is of acceptable quality.

4.6. Measurement Model and Common Method Bias

The Confirmatory Factor Analysis (CFA) results were used to verify the measurement model, as outlined by Anderson and Gerbing [111]. In this study, various model fit indicators were used to evaluate the measurement and structural model, as indicated in Table 4. As per the findings, the model fit indices such as χ2/df = 2.285, IFI = 0.938, NFI = 0.919, CFI = 0.943, GFI = 0.913, AGFI = 0.907, TLI = 0.922, SRMR = 0.024, and RMSEA = 0.066 are all within accepted limits [120]. Overall, the model fit is sufficient and acceptable. Furthermore, the single-factor analysis methodology was used to check for common method bias according to Harman’s [121] criteria. Based on the exploratory factor analysis outputs, the single factor explained 47.169% of the variance in the factors, which was less than the 50% threshold, indicating that the common method bias was not existent.

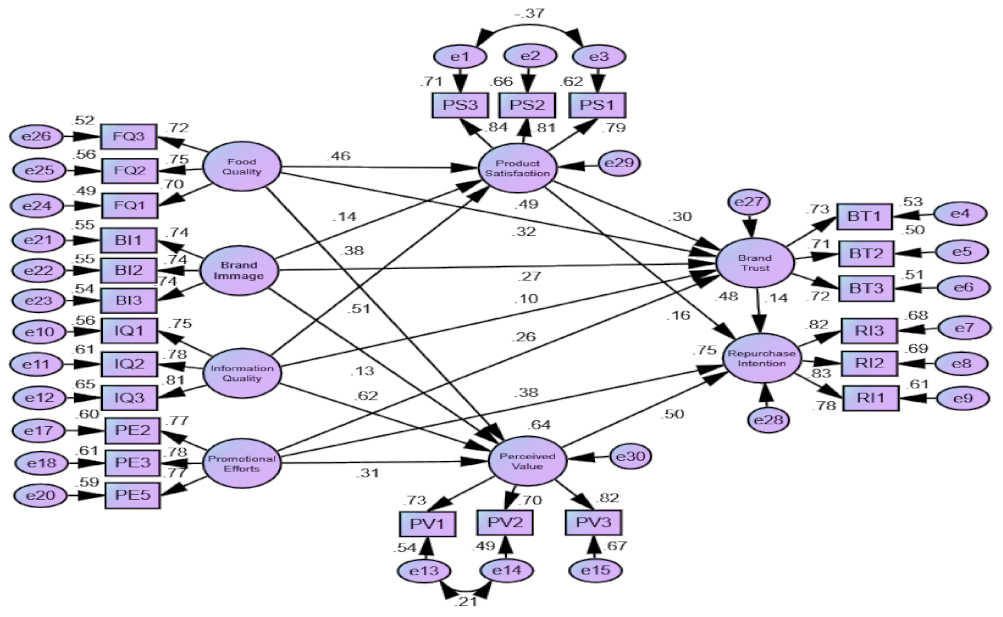
4.7. Structural Modeling and Outcomes of Research Hypotheses

Figure 2 shows the structural model of the study along with standardized estimates. The SEM approach was used to evaluate and confirm the proposed research hypotheses, utilizing multiple models fit indices as depicted in Table 5. As per the empirical outputs, the overall model fit indices were found to be within acceptable limits [120], indicating that the SEM model fit is excellent and satisfactory.
Furthermore, the findings of the SEM and research hypotheses are shown in Table 6. The findings revealed that food quality has a favorable impact on product satisfaction (β = 0.508, p = 0.000), brand trust (β = 0.463, p = 0.000), and perceived value (β = 0.140, p = 0.015), indicating that the H1, H2, and H3 are supported. According to the results, the brand image has a positive effect on product satisfaction (β = 0.619, p = 0.000), brand trust (β = 0.313, p = 0.000), and perceived value (β = 0.320, p = 0.000). As hypothesized, the result showed that the information quality significantly influences product satisfaction (β = 0.298, p = 0.003), brand trust (β = 0.382, p = 0.000), and perceived value (β = 0.273, p = 0.000), thus validating the H7, H8, and H9. Moreover, the promotional efforts exhibit a significant influence on the brand trust (β = 0.129, p = 0.023) and perceived value (β = 0.256, p = 0.000), suggesting that the H10 and H11 are supported. Surprisingly, the results showed that hypothesis 12 is not supported, indicating that perceived value has no impact on consumers’ intention to repurchase organic tea products. The results indicated that product satisfaction has a positive effect on brand trust (β = 0.164, p = 0.014), thus validating hypothesis 13. Moreover, the association between product satisfaction (β = 0.498, p = 0.000), brand trust (β = 0.376, p = 0.000), and perceived value (β = 0.136, p = 0.041), and a consumer’s repurchase intention towards organic tea has also been found to be statistically significant. As a result, the Hypotheses H14, H15 and H16 are validated.
Other than the statistical significance, economic significance based on the size of the beta (magnitude of the relationship) is also essential to determine the dominant or passive factors. Product satisfaction (β = 0.498) was the most influential factor influencing repurchase intention for organic tea, followed by brand trust (β = 0.376). The most passive factor was the promotional effort (β = 0.102) on the repurchase intention of organic tea. The highest relationship was found between brand image (β = 0.619) and product satisfaction, while the lowest was information quality (β = 0.298). The strongest predictor of perceived value was brand image (β = 0.320) and the weakest was food quality (β = 0.140). Likewise, food quality was the highest predictor (β = 0.463) of brand trust and promotional effort was the lowest (β = 0.129).

5. Discussions and Conclusions

Based on the SOR paradigm, the study successfully revealed the factors impacting the repurchase intention of organic tea products in the Bangladeshi context. The links between stimuli and organism were used to examine the effect of brand name on store image and the effect of promotion on perceived value. The study used the organism-response model to explain the relationship between perceived value, brand image, and behavioral intentions. According to the outcomes of the study, food quality has a favorable impact on product satisfaction, brand trust, and perceived value, indicating that the H1, H2, and H3 are supported. This result is in agreement with past studies [22,56] and implies that the higher the food quality perceived by the consumers, the higher their satisfaction, trust and perceived value for repurchasing organic tea. On the other hand, the findings of the study indicated that the brand image has a positive effect on product satisfaction, brand trust and perceived value. Hence, Hypotheses H4 to H6 are accepted, confirming the earlier studies [60,63] in a similar context. This suggests that brand image of organic tea promotes brand trust, satisfaction and perceived value, thereby resulting in repurchase intention of the consumers.
Based on the empirical results, the information quality significantly influences product satisfaction, brand trust, and perceived value, thus validating the H7, H8, and H9. These findings corroborate the outcomes of past studies [12,70,72] and suggest that the greater the quality of information presented on the organic tea label, the greater the chances of acquiring satisfaction, trust and value, which eventually promote the repurchase intention of organic tea. As expected, the promotional efforts exhibit a significant influence on the brand trust and perceived value, suggesting that the H10 and H11 are supported. As a result, this outcome further advocates the findings of Orzan et al. [76] and Lee and Ahn [80] from the perspective of e-commerce. A promotional campaign reminds customers about the product, which sparks positivity in terms of product satisfaction and trust and consequently leads to repurchase intent.
Surprisingly, the results showed that hypothesis 12 is not supported, indicating that perceived value has no impact on consumers’ intention to repurchase organic tea products. This is in contrast to the studies [66,127] and consistent to findings of the study by Correa [128], which observed a positive relationship between perceived value and repurchase intention. This outcome could be explained in two ways: promotions can be used to bring in new customers and entice them to make their first purchase, as well as to persuade existing customers to move to your brand from another [129]. While promotions encourage infrequent consumers to return and increase their likelihood of making another purchase, brand loyalty customers are more likely to make another buy, regardless of the promotion [130]. Secondly, there might have been a mediating role of brand trust in the relationship between promotional efforts and repurchase intention.
Confirming the past studies [60,88], the results indicated that product satisfaction has a positive effect on brand trust, thus validating hypothesis 13. This means that a high level of satisfaction raises customers’ levels of trust, thereby resulting in a better relationship of customers with the organic product vendors. Moreover, the association between product satisfaction, brand trust, and perceived value, and a consumer’s repurchase intention towards organic tea has also been found to be statistically significant. As a result, the Hypotheses H14, H15 and H16 are validated, which is in agreement with the past scholarly studies [66,86,92]. Therefore, it can be concluded that product satisfaction, perceived values and brand trust predict repurchase intention. Interestingly, we did not find promotional efforts to effect repurchase intention. The study also found that the antecedents of perceived value and product satisfaction are food quality and information quality, while the antecedents for the brand trust were product satisfaction, food quality, brand image, information quality and promotional effort.

6. Implications of the Study

6.1. Theoretical Implications

The study offers a number of theoretical contributions to the literature. First, the study complements the present theory with new results. Information quality is commonly used as a construct in various technology adoption studies and has been integrated with the repurchase intention model in this study. The result established that information quality is an important predictor of customer satisfaction, trust and perceived value in the organic tea product context. Second, the study also revealed that promotional efforts are not directly related to repurchase intention; rather, it is valuable in combination with brand trust, satisfaction and perceived values, thus challenging existing empirical thoughts. Hence, this study extends the body of knowledge in the organic tea repurchase intention by validating existing links and adding new outcomes. Third, the study provides a good fit model with greater explanatory power of about 75% for repurchase intention, which is almost similar to the contemporary studies [19,21,22] on organic tea repurchase. This will certainly update the present literature applying this model and scales. Fourth, according to the S-O-R theory, an external stimulus (food, information, or promotional efforts) affects an organism (product satisfaction, brand trust, or perceived value), which in turn determines reaction (repurchase intention). The S-O-R framework on organic food purchase and repurchase intention in the Bangladeshi perspective is absent. Therefore, our study adds to the body of knowledge on organic food consumption behavior by looking at how different hypotheses complement one another in explaining why customers return to buying organic food again and again. Fifth, the respondents in this study constitute primarily the younger generation. According to Owens and Nowell [131], young consumers demonstrate a preference for emotional appeal over rationality, highlighting the necessity for this age group to be examined independently in order to identify emotional appeals, particularly in relation to consumer behavior in Bangladesh. Ultimately, the study provides a clearer picture of the attitudes of today’s young consumers toward organic tea consumption in the future, and also adds to the growing body of knowledge about Generation Y as both consumers and citizens. Finally, based on the authors’ knowledge, this is the first study to examine repurchase intentions from an organic food context and the second in the domain of organic tea products following Sumi and Kabir’s [107] study.

6.2. Practical Implications

The results of this study have important managerial implications for companies to attract customers. First, this study guides managers and policymakers in the organization on the reasons for infrequent buying of organic tea products. For example, the study found that product quality is an important determinant of consumer satisfaction, trust, perceived value, and ultimately, repurchase intention. Quality assurance is a separate department in most organization and can play a pivotal role in ensuring product quality as specified. When there is a synergy between quality and price of a product, customers tend to purchase the product repeatedly. Thus, managers and policymakers must ensure proper quality of products to lower promotional expenditure and other efforts. Companies can also promote the quality of the product (organic tea) to customers by demonstrating the processes involved in making such products in the mall or in mass media.
Second, the study found that promotional efforts do not directly impact the repurchase of organic tea products, but do indirectly via trust, satisfaction and perceived value. This does not mean that companies should not advertise or promote their products. It only indicates that sales promotion or promotional campaign does not ensure repurchase. From the study’s findings, product satisfaction was found to have a greater effect on repurchasing compared to other predictors, thus accentuating the necessity of maintaining the highest quality and assurance of support. Moreover, managers must rethink the trustworthiness of promotional efforts, the product quality, and information quality to ensure better advertisement content. As information quality is found related to customer satisfaction, trust, and perceived value, managers and policymakers must be careful about the information attached to the label in terms of accuracy and adequacy. Policymakers in this sector should also control the unregulated use of organic labeling for promotion purposes only. Efforts from certified organizations could also restore trust of organic tea products.
Third, it is noteworthy that perceived value exhibits a positive influence on repurchase intention. Furthermore, perceived value is intricately linked to food quality, brand image, and promotional efforts, all of which may result in adverse influence on repurchase intention if ignored. Hence, it is vital for organizations to cut down the price of organic tea products, probably by scaling up their productions. The government should also provide financial and policy support towards organic food production to strengthen the industry and ensure public access to the product at a cheaper price.

7. Study Limitations and Future Research

The major limitation in this study is the use of self-report instruments, which could result in a common method bias in measuring the variables [132,133]. However, the probability of common biases was reduced in this study by separating the instruments and motivating the participants. Additionally, data were obtained in Bangladesh. To generalize the findings, research across countries and cultures is required. Finally, future studies may also consider integrating different factors (e.g., word of mouth, brand loyalty) into the model. The study did not integrate any mediating relationship, which could be tested in future research with constructs such as trust with behavioral intention, product satisfaction, food quality, information quality, and repurchase intention. The study only considered the buying intentions of young consumers, missing the outcomes of other generations such as X and Z. The study could be extended by conducting a separate study for those generations or could be on a comparative basis between generations. However, the same study can be replicated by incorporating the repurchase behavior of organic tea into the model. In particular, future research could incorporate the transition of repurchase intention into repurchase behavior with a longitudinal research design.

Author Contributions

Conceptualization, H.T. and M.M.; Data curation, H.T. and A.B.S.; Formal analysis, H.T. and A.B.S.; Funding acquisition, H.T. and A.B.S.; Investigation, M.M.; Methodology, H.T.; Project administration, M.M.; Resources, H.T., A.B.S. and M.M.; Software, H.T. and A.B.S.; Supervision, M.M.; Validation, H.T. and A.B.S.; Visualization, M.M.; Writing—original draft, H.T. and A.B.S.; Writing—review and editing, A.B.S. All authors have read and agreed to the published version of the manuscript.

Funding

This study was funded by the Henan Science and Technology Department Project: Research on the cloud financing mode of Small and Medium High-tech Enterprises in Henan Province (No. 212400410492), and Henan Provincial Education Department Project: Design and implementation of information service platform of University Science and Technology Park based on resource sharing (No. 19A630040).

Institutional Review Board Statement

Not applicable.

Informed Consent Statement

Oral consent was obtained from all individuals involved in this study.

Data Availability Statement

The data that support the findings of this study are available from the corresponding authors upon reasonable request.

Acknowledgments

The researchers would like to express their gratitude to the anonymous reviewers for their efforts to improve the quality of this paper.

Conflicts of Interest

The authors declare no conflict of interest.

References

  1. Wang, E.S.-T.; Tsai, M.-C. Effects of the perception of traceable fresh food safety and nutrition on perceived health benefits, affective commitment, and repurchase intention. Food Qual. Prefer. 2019, 78, 103723. [Google Scholar] [CrossRef]
  2. Nótári, M.; Ferencz, Á.; Czeglédi, M. Motivation of consumers and food safety in Hungary. Ann. Fac. Eng. Hunedoara 2012, 10, 35. [Google Scholar]
  3. Yeung, R.; Yee, W.M.S. Food safety concern: Incorporating marketing strategies into consumer risk coping framework. Br. Food J. 2012. [Google Scholar] [CrossRef]
  4. Sapp, S.G.; Bird, S.R. The effects of social trust on consumer perceptions of food safety. Soc. Behav. Pers. Int. J. 2003, 31, 413–421. [Google Scholar] [CrossRef]
  5. Olsson, A.; Skjöldebrand, C. Risk management and quality assurance through the food supply chain–case studies in the Swedish food industry. Open Food Sci. J. 2008, 2, 49–56. [Google Scholar] [CrossRef]
  6. Yazdanpanah, M.; Forouzani, M. Application of the Theory of Planned Behaviour to predict Iranian students’ intention to purchase organic food. J. Clean. Prod. 2015, 107, 342–352. [Google Scholar] [CrossRef]
  7. Bryła, P. Organic food consumption in Poland: Motives and barriers. Appetite 2016, 105, 737–746. [Google Scholar] [CrossRef] [PubMed]
  8. Marian, L.; Chrysochou, P.; Krystallis, A.; Thøgersen, J. The role of price as a product attribute in the organic food context: An exploration based on actual purchase data. Food Qual. Prefer. 2014, 37, 52–60. [Google Scholar] [CrossRef]
  9. Hughner, R.S.; McDonagh, P.; Prothero, A.; Shultz, C.J.; Stanton, J. Who are organic food consumers? A compilation and review of why people purchase organic food. J. Consum. Behav. Int. Res. Rev. 2007, 6, 94–110. [Google Scholar] [CrossRef]
  10. Lee, K.C.; Chung, N. Understanding factors affecting trust in and satisfaction with mobile banking in Korea: A modified DeLone and McLean’s model perspective. Interact. Comput. 2009, 21, 385–392. [Google Scholar] [CrossRef]
  11. Luo, X.; Li, H.; Zhang, J.; Shim, J.P. Examining multi-dimensional trust and multi-faceted risk in initial acceptance of emerging technologies: An empirical study of mobile banking services. Decis. Support Syst. 2010, 49, 222–234. [Google Scholar] [CrossRef]
  12. Elliot, S.; Li, G.; Choi, C. Understanding service quality in a virtual travel community environment. J. Bus. Res. 2013, 66, 1153–1160. [Google Scholar] [CrossRef]
  13. Yeo, S.F.; Tan, C.L.; Teo, S.L.; Tan, K.H. The role of food apps servitization on repurchase intention: A study of FoodPanda. Int. J. Prod. Econ. 2021, 234, 108063. [Google Scholar] [CrossRef]
  14. Anninou, I.; Foxall, G.R. Consumer decision-making for functional foods: Insights from a qualitative study. J. Consum. Mark. 2017, 34, 552–565. [Google Scholar] [CrossRef]
  15. Shin, J.; Mattila, A.S. When organic food choices shape subsequent food choices: The interplay of gender and health consciousness. Int. J. Hosp. Manag. 2019, 76, 94–101. [Google Scholar] [CrossRef]
  16. Jeong, E.; Jang, S.S. Price premiums for organic menus at restaurants: What is an acceptable level? Int. J. Hosp. Manag. 2019, 77, 117–127. [Google Scholar] [CrossRef]
  17. Shin, Y.H.; Im, J.; Jung, S.E.; Severt, K. The theory of planned behavior and the norm activation model approach to consumer behavior regarding organic menus. Int. J. Hosp. Manag. 2018, 69, 21–29. [Google Scholar] [CrossRef]
  18. Lu, L.; Chi, C.G. An examination of the perceived value of organic dining. Int. J. Contemp. Hosp. Manag. 2018, 30, 2826–2844. [Google Scholar] [CrossRef]
  19. Singh, S.; Alok, S. Drivers of Repurchase Intention of Organic Food in India: Role of Perceived Consumer Social Responsibility, Price, Value, and Quality. J. Int. Food Agribus. Mark. 2021, 1–23. [Google Scholar] [CrossRef]
  20. Konuk, F.A. The influence of perceived food quality, price fairness, perceived value and satisfaction on customers’ revisit and word-of-mouth intentions towards organic food restaurants. J. Retail. Consum. Serv. 2019, 50, 103–110. [Google Scholar] [CrossRef]
  21. De Farias, F.; Eberle, L.; Milan, G.S.; De Toni, D.; Eckert, A. Determinants of organic food repurchase intention from the perspective of Brazilian consumers. J. Food Prod. Mark. 2019, 25, 921–943. [Google Scholar] [CrossRef]
  22. De Toni, D.; Eberle, L.; Larentis, F.; Milan, G.S. Antecedents of perceived value and repurchase intention of organic food. J. Food Prod. Mark. 2018, 24, 456–475. [Google Scholar] [CrossRef]
  23. Trivedi, S.K.; Yadav, M. Repurchase intentions in Y generation: Mediation of trust and e-satisfaction. Mark. Intell. Plan. 2020, 38, 401–415. [Google Scholar] [CrossRef]
  24. Soares, R.R.; Zhang, T.T.C.; Proença, J.F.; Kandampully, J. Why are Generation Y consumers the most likely to complain and repurchase? J. Serv. Manag. 2017, 28, 520–540. [Google Scholar] [CrossRef]
  25. Taufique, K.M.R.; Vaithianathan, S. A fresh look at understanding Green consumer behavior among young urban Indian consumers through the lens of Theory of Planned Behavior. J. Clean. Prod. 2018, 183, 46–55. [Google Scholar] [CrossRef]
  26. Kanchanapibul, M.; Lacka, E.; Wang, X.; Chan, H.K. An empirical investigation of green purchase behaviour among the young generation. J. Clean. Prod. 2014, 66, 528–536. [Google Scholar] [CrossRef]
  27. Alam, M.M.D.; Noor, N.A.M. The relationship between service quality, corporate image, and customer loyalty of Generation Y: An application of SOR paradigm in the context of superstores in Bangladesh. SAGE Open 2020, 10, 2158244020924405. [Google Scholar] [CrossRef]
  28. Nekmahmud, M.; Fekete-Farkas, M. Why Not Green Marketing? Determinates of Consumers’ Intention to Green Purchase Decision in a New Developing Nation. Sustainability 2020, 12, 7880. [Google Scholar] [CrossRef]
  29. Zheng, G.-W.; Akter, N.; Siddik, A.B.; Masukujjaman, M. Organic Foods Purchase Behavior among Generation Y of Bangladesh: The Moderation Effect of Trust and Price Consciousness. Foods 2021, 10, 2278. [Google Scholar] [CrossRef]
  30. Hempel, C.; Hamm, U. Local and/or organic: A study on consumer preferences for organic food and food from different origins. Int. J. Consum. Stud. 2016, 40, 732–741. [Google Scholar] [CrossRef]
  31. Chang, H.-J.; Eckman, M.; Yan, R.-N. Application of the Stimulus-Organism-Response model to the retail environment: The role of hedonic motivation in impulse buying behavior. Int. Rev. Retail. Distrib. Consum. Res. 2011, 21, 233–249. [Google Scholar] [CrossRef]
  32. Kim, M.J.; Lee, C.-K.; Jung, T. Exploring consumer behavior in virtual reality tourism using an extended stimulus-organism-response model. J. Travel Res. 2020, 59, 69–89. [Google Scholar] [CrossRef] [Green Version]
  33. DiPietro, R.B.; Campbell, J. The influence of servicescape and local food attributes on pleasure and revisit intention in an upscale-casual dining restaurant. Hosp. Rev. 2014, 31, 1. [Google Scholar]
  34. Tan, C.C. Intercepting Stimulus-Organism-Response Model, Theory of Planned Behavior and Theory of Expectancy Confirmation in the Study of Smartphone Consumer Behavior: A Thai University Student Perspective. Asia Pac. J. Relig. Cult. 2019, 3, 27–48. [Google Scholar]
  35. Suparno, C. Online purchase intention of halal cosmetics: SOR framework application. J. Islam. Mark. 2020, 12, 1665–1681. [Google Scholar] [CrossRef]
  36. Talwar, S.; Jabeen, F.; Tandon, A.; Sakashita, M.; Dhir, A. What drives willingness to purchase and stated buying behavior toward organic food? A Stimulus–Organism–Behavior–Consequence (SOBC) perspective. J. Clean. Prod. 2021, 293, 125882. [Google Scholar] [CrossRef]
  37. Sultan, P.; Wong, H.Y.; Azam, M.S. How perceived communication source and food value stimulate purchase intention of organic food: An examination of the stimulus-organism-response (SOR) model. J. Clean. Prod. 2021, 312, 127807. [Google Scholar] [CrossRef]
  38. Twenge, J.M. Generation Me: Why Today’s Young Americans Are More Confident, Assertive, Entitled-And More Miserable Than Ever Before; Simon and Schuster: New York, NY, USA, 2006; ISBN 0743276981. [Google Scholar]
  39. Armour, S. Generation Y: They’ve arrived at work with a new attitude. USA Today 2005, 6, 2005. [Google Scholar]
  40. Social Marketing Organization Generations X, Y, Z and the Others. Available online: http://socialmarketing.org/archives/generations-xy-z-and-the-others/ (accessed on 15 December 2021).
  41. Deloitte, L.P. Big Demands and High Expectations: What Generation Y Wants from Business, Government, and the Future Workplace; Deloitte UK: London, UK, 2014. [Google Scholar]
  42. Prakash, G.; Pathak, P. Determinants of counterfeit purchase: A study on young consumers of India. J. Sci. Ind. Res. 2017, 76, 208–211. [Google Scholar]
  43. Mehrabian, A.; Russell, J.A. An Approach to Environmental Psychology; MIT Press: Cambridge, MA, USA, 1974. [Google Scholar]
  44. Manthiou, A.; Ayadi, K.; Lee, S.; Chiang, L.; Tang, L. Exploring the roles of self-concept and future memory at consumer events: The application of an extended Mehrabian–Russell model. J. Travel Tour. Mark. 2017, 34, 531–543. [Google Scholar] [CrossRef]
  45. Moore, J.F. The Death of Competition: Leadership and Strategy in the Age of Business Ecosystems; Harper Business: New York, NY, USA, 1996. [Google Scholar]
  46. Schreuder, E.; van Erp, J.; Toet, A.; Kallen, V.L. Emotional responses to multisensory environmental stimuli: A conceptual framework and literature review. Sage Open 2016, 6, 2158244016630591. [Google Scholar] [CrossRef] [Green Version]
  47. Chen, C.-C.; Yao, J.-Y. What drives impulse buying behaviors in a mobile auction? The perspective of the Stimulus-Organism-Response model. Telemat. Inform. 2018, 35, 1249–1262. [Google Scholar] [CrossRef]
  48. Hanaysha, J. Testing the effects of food quality, price fairness, and physical environment on customer satisfaction in fast food restaurant industry. J. Asian Bus. Strat. 2016, 6, 31–40. [Google Scholar] [CrossRef] [Green Version]
  49. Gagić, S.; Tešanović, D.; Jovičić, A. The vital components of restaurant quality that affect guest satisfaction. Turizam 2013, 17, 166–176. [Google Scholar] [CrossRef] [Green Version]
  50. Abdullah, D.; Hamir, N.; Nor, N.M.; Krishnaswamy, J.; Rostum, A.M.M. Food quality, service quality, price fairness and restaurant re-patronage intention: The mediating role of customer satisfaction. Int. J. Acad. Res. Bus. Soc. Sci. 2018, 8, 211–226. [Google Scholar]
  51. Altamore, L.; Ingrassia, M.; Chironi, S.; Columba, P.; Sortino, G.; Vukadin, A.; Bacarella, S. Pasta experience: Eating with the five senses-A pilot study. AIMS Agric. Food 2018, 3, 493–520. [Google Scholar]
  52. Ramanathan, R.; Di, Y.; Ramanathan, U. Moderating roles of customer characteristics on the link between service factors and satisfaction in a buffet restaurant. Benchmark. Int. J. 2016, 23, 469–486. [Google Scholar] [CrossRef]
  53. Han, H.; Hyun, S.S. Impact of hotel-restaurant image and quality of physical-environment, service, and food on satisfaction and intention. Int. J. Hosp. Manag. 2017, 63, 82–92. [Google Scholar] [CrossRef]
  54. Namin, A. Revisiting customers’ perception of service quality in fast food restaurants. J. Retail. Consum. Serv. 2017, 34, 70–81. [Google Scholar] [CrossRef]
  55. Line, N.D.; Hanks, L.; Kim, W.G. Hedonic adaptation and satiation: Understanding switching behavior in the restaurant industry. Int. J. Hosp. Manag. 2016, 52, 143–153. [Google Scholar] [CrossRef]
  56. Kim, H.J.; Park, J.; Kim, M.-J.; Ryu, K. Does perceived restaurant food healthiness matter? Its influence on value, satisfaction and revisit intentions in restaurant operations in South Korea. Int. J. Hosp. Manag. 2013, 33, 397–405. [Google Scholar] [CrossRef]
  57. Bredahl, L. Determinants of consumer attitudes and purchase intentions with regard to genetically modified food–results of a cross-national survey. J. Consum. Policy 2001, 24, 23–61. [Google Scholar] [CrossRef]
  58. Ryu, K.; Lee, H.; Kim, W.G. The influence of the quality of the physical environment, food, and service on restaurant image, customer perceived value, customer satisfaction, and behavioral intentions. Int. J. Contemp. Hosp. Manag. 2012, 24, 200–223. [Google Scholar] [CrossRef]
  59. Veloutsou, C. Brand evaluation, satisfaction and trust as predictors of brand loyalty: The mediator-moderator effect of brand relationships. J. Consum. Mark. 2015, 32, 405–421. [Google Scholar] [CrossRef] [Green Version]
  60. Lien, C.-H.; Wen, M.-J.; Huang, L.-C.; Wu, K.-L. Online hotel booking: The effects of brand image, price, trust and value on purchase intentions. Asia Pac. Manag. Rev. 2015, 20, 210–218. [Google Scholar] [CrossRef]
  61. Jin, N.; Lee, S.; Huffman, L. Impact of restaurant experience on brand image and customer loyalty: Moderating role of dining motivation. J. Travel Tour. Mark. 2012, 29, 532–551. [Google Scholar] [CrossRef]
  62. Han, H.; Kim, W.; Hyun, S.S. Switching intention model development: Role of service performances, customer satisfaction, and switching barriers in the hotel industry. Int. J. Hosp. Manag. 2011, 30, 619–629. [Google Scholar] [CrossRef]
  63. Nguyen, H.T.; Nguyen, H.; Nguyen, N.D.; Phan, A.C. Determinants of customer satisfaction and loyalty in Vietnamese life-insurance setting. Sustainability 2018, 10, 1151. [Google Scholar] [CrossRef] [Green Version]
  64. Bloemer, J.; de Ruyter, K.; Peeters, P. Investigating drivers of bank loyalty: The complex relationship between image, service quality and satisfaction. Int. J. Bank Mark. 1998, 16, 276–286. [Google Scholar] [CrossRef] [Green Version]
  65. Clemes, M.D.; Gan, C.E.C.; Kao, T.-H. University student satisfaction: An empirical analysis. J. Mark. High. Educ. 2008, 17, 292–325. [Google Scholar] [CrossRef] [Green Version]
  66. Chen, L.; Li, Y.-Q.; Liu, C.-H. How airline service quality determines the quantity of repurchase intention-Mediate and moderate effects of brand quality and perceived value. J. Air Transp. Manag. 2019, 75, 185–197. [Google Scholar] [CrossRef]
  67. Pham, L.T.M.; Do, H.N.; Phung, T.M. The effect of brand equity and perceived value on customer revisit intention: A study in quick-service restaurants in Vietnam. Acta Oeconomica Pragensia 2016, 24, 14–30. [Google Scholar] [CrossRef] [Green Version]
  68. Wang, E.S.-T. Effect of food service-brand equity on consumer-perceived food value, physical risk, and brand preference. Br. Food J. 2015, 117, 553–564. [Google Scholar] [CrossRef]
  69. Lai, F.; Griffin, M.; Babin, B.J. How quality, value, image, and satisfaction create loyalty at a Chinese telecom. J. Bus. Res. 2009, 62, 980–986. [Google Scholar] [CrossRef]
  70. Zhou, T. Examining the critical success factors of mobile website adoption. Online Inf. Rev. 2011, 35, 636. [Google Scholar] [CrossRef]
  71. Mamonov, S.; Benbunan-Fich, R. An empirical investigation of privacy breach perceptions among smartphone application users. Comput. Hum. Behav. 2015, 49, 427–436. [Google Scholar] [CrossRef]
  72. Zhou, T. Understanding continuance usage intention of mobile internet sites. Univers. Access Inf. Soc. 2014, 13, 329–337. [Google Scholar] [CrossRef]
  73. Gillani, S.F.; Yousaf, S.; Khan, S. The effect of brand characteristics on brand loyalty a study of cosmetics products in Peshawar Pakistan. Int. Rev. Basic Appl. Sci. 2013, 1, 1–11. [Google Scholar]
  74. Alhedhaif, S.; Lele, U.; Kaifi, B.A. Brand loyalty and factors affecting cosmetics buying behavior of Saudi female consumers. J. Bus. Stud. Q. 2016, 7, 24. [Google Scholar]
  75. Huang, H.-C.; Chang, Y.-T.; Yeh, C.-Y.; Liao, C.-W. Promote the price promotion: The effects of price promotions on customer evaluations in coffee chain stores. Int. J. Contemp. Hosp. Manag. 2014. [Google Scholar] [CrossRef]
  76. Orzan, G.; Platon, O.-E.; Stefănescu, C.D.; Orzan, M. Conceptual model regarding the influence of social media marketing communication on brand trust, brand affect and brand loyalty. Econ. Comput. Econ. Cybern. Stud. Res. 2016, 50, 141–156. [Google Scholar]
  77. Laroche, M.; Habibi, M.R.; Richard, M.-O.; Sankaranarayanan, R. The effects of social media based brand communities on brand community markers, value creation practices, brand trust and brand loyalty. Comput. Hum. Behav. 2012, 28, 1755–1767. [Google Scholar] [CrossRef] [Green Version]
  78. Zehir, C.; Şahin, A.; Kitapçı, H.; Özşahin, M. The effects of brand communication and service quality in building brand loyalty through brand trust; the empirical research on global brands. Procedia-Soc. Behav. Sci. 2011, 24, 1218–1231. [Google Scholar] [CrossRef] [Green Version]
  79. Habibi, M.R.; Laroche, M.; Richard, M.-O. The roles of brand community and community engagement in building brand trust on social media. Comput. Hum. Behav. 2014, 37, 152–161. [Google Scholar] [CrossRef]
  80. Lee, M.S.W.; Ahn, C.S.Y. Anti-consumption, materialism, and consumer well-being. J. Consum. Aff. 2016, 50, 18–47. [Google Scholar] [CrossRef]
  81. Raghubir, P. Free gift with purchase: Promoting or discounting the brand? J. Consum. Psychol. 2004, 14, 181–186. [Google Scholar] [CrossRef]
  82. Darke, P.R.; Dahl, D.W. Fairness and discounts: The subjective value of a bargain. J. Consum. Psychol. 2003, 13, 328–338. [Google Scholar] [CrossRef]
  83. Oliver, R.L.; Shor, M. Digital redemption of coupons: Satisfying and dissatisfying effects of promotion codes. J. Prod. Brand Manag. 2003, 12, 121–134. [Google Scholar] [CrossRef] [Green Version]
  84. San-Martín, S.; Prodanova, J.; Jiménez, N. The impact of age in the generation of satisfaction and WOM in mobile shopping. J. Retail. Consum. Serv. 2015, 23, 1–8. [Google Scholar] [CrossRef]
  85. Khadka, K.; Maharjan, S. Customer Satisfaction and Customer Loyalty. Graduate Thesis, Centria University of Applied Sciences, Kokkola, Finland, 2017. [Google Scholar]
  86. Lee, D.; Moon, J.; Kim, Y.J.; Yi, M.Y. Antecedents and consequences of mobile phone usability: Linking simplicity and interactivity to satisfaction, trust, and brand loyalty. Inf. Manag. 2015, 52, 295–304. [Google Scholar] [CrossRef]
  87. Hung, M.-C.; Yang, S.-T.; Hsieh, T.-C. An examination of the determinants of mobile shopping continuance. Int. J. Electron. Bus. Manag. 2012, 10, 29. [Google Scholar]
  88. Coelho, P.S.; Rita, P.; Santos, Z.R. On the relationship between consumer-brand identification, brand community, and brand loyalty. J. Retail. Consum. Serv. 2018, 43, 101–110. [Google Scholar] [CrossRef]
  89. Verhoef, P.C.; Lemon, K.N.; Parasuraman, A.; Roggeveen, A.; Tsiros, M.; Schlesinger, L.A. Customer experience creation: Determinants, dynamics and management strategies. J. Retail. 2009, 85, 31–41. [Google Scholar] [CrossRef] [Green Version]
  90. Gibreel, O.; AlOtaibi, D.A.; Altmann, J. Social commerce development in emerging markets. Electron. Commer. Res. Appl. 2018, 27, 152–162. [Google Scholar] [CrossRef]
  91. Papista, E.; Chrysochou, P.; Krystallis, A.; Dimitriadis, S. Types of value and cost in consumer–green brands relationship and loyalty behaviour. J. Consum. Behav. 2018, 17, e101–e113. [Google Scholar] [CrossRef]
  92. Saleem, M.A.; Zahra, S.; Yaseen, A. Impact of service quality and trust on repurchase intentions–the case of Pakistan airline industry. Asia Pacific J. Mark. Logist. 2017. [Google Scholar] [CrossRef]
  93. Zeithaml, V.A. Consumer perceptions of price, quality, and value: A means-end model and synthesis of evidence. J. Mark. 1988, 52, 2–22. [Google Scholar] [CrossRef]
  94. Fu, Y.; Liu, X.; Wang, Y.; Chao, R.-F. How experiential consumption moderates the effects of souvenir authenticity on behavioral intention through perceived value. Tour. Manag. 2018, 69, 356–367. [Google Scholar] [CrossRef]
  95. Ponte, E.B.; Carvajal-Trujillo, E.; Escobar-Rodríguez, T. Influence of trust and perceived value on the intention to purchase travel online: Integrating the effects of assurance on trust antecedents. Tour. Manag. 2015, 47, 286–302. [Google Scholar] [CrossRef]
  96. Kim, Y. Assessing the effects of perceived value (utilitarian and hedonic) in LCCs and FSCs: Evidence from South Korea. J. Air Transp. Manag. 2015, 49, 17–22. [Google Scholar] [CrossRef]
  97. Rajaguru, R. Role of value for money and service quality on behavioural intention: A study of full service and low cost airlines. J. Air Transp. Manag. 2016, 53, 114–122. [Google Scholar] [CrossRef]
  98. Pan, J.Y.; Truong, D. Passengers’ intentions to use low-cost carriers: An extended theory of planned behavior model. J. Air Transp. Manag. 2018, 69, 38–48. [Google Scholar] [CrossRef]
  99. Yang, K.-C.; Hsieh, T.-C.; Li, H.; Yang, C. Assessing how service quality, airline image and customer value affect the intentions of passengers regarding low cost carriers. J. Air Transp. Manag. 2012, 20, 52–53. [Google Scholar] [CrossRef]
  100. Faul, F.; Erdfelder, E.; Buchner, A.; Lang, A.-G. Statistical power analyses using G* Power 3.1: Tests for correlation and regression analyses. Behav. Res. Methods 2009, 41, 1149–1160. [Google Scholar] [CrossRef] [PubMed] [Green Version]
  101. Vidaver-Cohen, D. Moral climate in business firms: A conceptual framework for analysis and change. J. Bus. Ethics 1998, 17, 1211–1226. [Google Scholar] [CrossRef]
  102. Saunders, M.; Lewis, P.; Thornhill, A. Research Methods for Business Students; Pearson Education: London, UK, 2009; ISBN 0273716867. [Google Scholar]
  103. Bush, A.J.; Hair, J.F., Jr. An assessment of the mall intercept as a data collection method. J. Mark. Res. 1985, 22, 158–167. [Google Scholar] [CrossRef]
  104. Bruwer, J.; Haydam, N.E.; Lin, B. Reducing bias in shopping mall-intercept surveys: The time-based systematic sampling method. South African J. Bus. Manag. 1996, 27, 9–16. [Google Scholar] [CrossRef]
  105. Fam, K.-S.; Brito, P.Q.; Gadekar, M.; Richard, J.E.; Jargal, U.; Liu, W. Consumer attitude towards sales promotion techniques: A multi-country study. Asia Pacific J. Mark. Logist. 2019, 31, 437–463. [Google Scholar] [CrossRef]
  106. Erkmen, E.; Hancer, M. Building brand relationship for restaurants: An examination of other customers, brand image, trust, and restaurant attributes. Int. J. Contemp. Hosp. Manag. 2019. [Google Scholar] [CrossRef]
  107. Sumi, R.S.; Kabir, G. Factors affecting the buying intention of organic tea consumers of Bangladesh. J. Open Innov. Technol. Mark. Complex. 2018, 4, 24. [Google Scholar] [CrossRef] [Green Version]
  108. Gao, L.; Waechter, K.A.; Bai, X. Understanding consumers’ continuance intention towards mobile purchase: A theoretical framework and empirical study–A case of China. Comput. Hum. Behav. 2015, 53, 249–262. [Google Scholar] [CrossRef]
  109. Kwon, J.-H.; Jung, S.-H.; Choi, H.-J.; Kim, J. Antecedent factors that affect restaurant brand trust and brand loyalty: Focusing on US and Korean consumers. J. Prod. Brand Manag. 2020, 30, 990–1015. [Google Scholar] [CrossRef]
  110. Ali, A.; Bhasin, J. Understanding customer repurchase intention in e-commerce: Role of perceived price, delivery quality, and perceived value. Jindal J. Bus. Res. 2019, 8, 142–157. [Google Scholar] [CrossRef]
  111. Anderson, J.C.; Gerbing, D.W. Structural equation modeling in practice: A review and recommended two-step approach. Psychol. Bull. 1988, 103, 411. [Google Scholar] [CrossRef]
  112. Hair, J.F.; Black, W.C.; Babin, B.J.; Anderson, R.E. Multivariate Data Analysis, 4th ed.; Prentice Hall: Hoboken, NJ, USA, 2010. [Google Scholar]
  113. Fornell, C.; Larcker, D.F. Evaluating structural equation models with unobservable variables and measurement error. J. Mark. Res. 1981, 18, 39–50. [Google Scholar] [CrossRef]
  114. Campbell, D.; Fiske, D. Convergent and discriminant validation by the multitrait-multimethod matrix. Psychol. Bull. 1959, 56, 81–105. [Google Scholar] [CrossRef] [Green Version]
  115. Henseler, J.; Ringle, C.M.; Sarstedt, M. A new criterion for assessing discriminant validity in variance-based structural equation modeling. J. Acad. Mark. Sci. 2015, 43, 115–135. [Google Scholar] [CrossRef] [Green Version]
  116. Kline, R.B. Principles and Practice of Structural Equation Modeling; Guilford publications: New York, NY, USA, 2015; ISBN 1462523358. [Google Scholar]
  117. Kleinbaum, D.G.; Kupper, L.L.; Muller, K.E. Applied regression analysys and other nultivariable methods. In Applied Regression Analysys and Other Nultivariable Methods; Cengage Learning: Boston, MA, USA, 1988; p. 718. [Google Scholar]
  118. Cohen, J. Statistical Power Analysis for the Behavioral Sciences; Lawrence Erlbaum Associates: Hillsdale, NJ, USA, 1988; pp. 20–26. [Google Scholar]
  119. Falk, R.F.; Miller, N.B. A Primer for Soft Modeling; University of Akron Press: Akron, OH, USA, 1992; ISBN 0962262846. [Google Scholar]
  120. Bentler, P.M.; Bonett, D.G. Significance tests and goodness of fit in the analysis of covariance structures. Psychol. Bull. 1980, 88, 588–606. [Google Scholar] [CrossRef]
  121. Harman, H.H. Modern Factor Analysis; University of Chicago Press: Chicago, IL, USA, 1976; ISBN 0226316521. [Google Scholar]
  122. Holbert, R.L.; Stephenson, M.T. Structural Equation Modeling in the Communication Sciences, 1995–2000. Hum. Commun. Res. 2002, 28, 1995–2000. [Google Scholar] [CrossRef]
  123. Jöreskog, K.G.; Sörbom, D. LISREL 8: Structural Equation Modeling with the SIMPLIS Command Language; Scientific Software International: Skokie, IL, USA, 1993. [Google Scholar]
  124. Fornell, C.; Larcker, D.F. Structural Equation Models with Unobservable Variables and Measurement Error: Algebra and Statistics. J. Mark. Res. 1981. [Google Scholar] [CrossRef]
  125. McDonald, R.P.; Ho, M.-H.R. Principles and practice in reporting structural equation analyses. Psychol. Methods 2002, 7, 64. [Google Scholar] [CrossRef] [PubMed]
  126. Bagozzi, R.P.; Yi, Y. On the evaluation of structural equation models. J. Acad. Mark. Sci. 1988, 16, 74–94. [Google Scholar] [CrossRef]
  127. Pham, Q.T.; Tran, X.P.; Misra, S.; Maskeliūnas, R.; Damaševičius, R. Relationship between convenience, perceived value, and repurchase intention in online shopping in Vietnam. Sustainability 2018, 10, 156. [Google Scholar] [CrossRef] [Green Version]
  128. Correa, C.; Alarcón, D.; Cepeda, I. “I am Delighted!”: The Effect of Perceived Customer Value on Repurchase and Advocacy Intention in B2B Express Delivery Services. Sustainability 2021, 13, 6013. [Google Scholar] [CrossRef]
  129. Sun, B.; Neslin, S.A.; Srinivasan, K. Measuring the impact of promotions on brand switching when consumers are forward looking. J. Mark. Res. 2003, 40, 389–405. [Google Scholar] [CrossRef]
  130. Huang, R.; Hsiao, C.; Tang, T.; Lien, T. Exploring the Moderating Role of Perceived Flexibility Advantages in Mobile Learning Continuance Intention ( MLCI ). Int. Rev. Res. Open Distrib. Learn. 2014, 15, 140–157. [Google Scholar] [CrossRef]
  131. Owens, W.T.; Nowell, L.S. More than just pictures: Using picture story books to broaden young learners’ social consciousness. Soc. Stud. 2001, 92, 33–40. [Google Scholar] [CrossRef]
  132. Fuller, C.M.; Simmering, M.J.; Atinc, G.; Atinc, Y.; Babin, B.J. Common methods variance detection in business research. J. Bus. Res. 2016, 69, 3192–3198. [Google Scholar] [CrossRef]
  133. Jordan, P.J.; Troth, A.C. Common method bias in applied settings: The dilemma of researching in organizations. Aust. J. Manag. 2020, 45, 3–14. [Google Scholar] [CrossRef]
Figure 1. Conceptual Framework.
Behavsci 12 00050 g001
Figure 2. Structural model.
Behavsci 12 00050 g002
Table 1. Respondents’ profile.
AspectsClassificationFrequencyPercentage (%)AspectsClassificationFrequencyPercentage (%)
GenderMale18755EducationNo formal education00
Female15345Higher Secondary or below6118
Age15–2051.5Graduate17752
20–256118Postgraduate and above10230
25–3513941Marital StatusMarried20159
35–409728.5Single13941
40–453811
Source: Authors’ calculation.
Table 2. Reliability and validity analysis.
ConstructsStandardized LoadingConbach’s AlphaCRAVE
Food Quality (FQ) [106,107] 0.7690.7660.522
FQ1: Organic tea products are tastier0.699
FQ2: Organic tea products have no hazardous (natural) materials0.746
FQ3: Organic tea products offer a variety of options for good flavors0.722
Brand Image (BI) [106] 0.7800.7840.548
BI1: The brand of organic tea products has better characteristics than that of the traditional tea products0.745
BI2: The brand of organic tea products has a reputation for quality0.738
BI3: The brand of organic tea products is familiar to me0.738
Information Quality [107,108] 0.8260.8220.607
IQ1: The product provides me with sufficient information about my needs.0.748
IQ2: I receive accurate information from the product lebel.0.782
IQ3: Labeling on organic tea is clearly understandable0.806
Promotional Efforts [109] 0.8190.8190.601
PE1: The marketing of the brand of organic tea that I choose leaves me with a positive impression0.774
PE2: Promoting my favorite organic tea brand makes me happy.0.782
PE3: Promoting my organic tea brand brings good memories.0.770
Product Satisfaction [108] 0.8620.8540.660
PS1: I feel satisfied with the product attributes0.787
PS2: I feel satisfied with the product information on the labels0.810
PS3: Compared to traditional tea products, I am satisfied buying organic tea.0.840
Perceived Value (PV) [110] 0.8650.7950.566
PV1: Organic products purchased are a good buy.0.732
PV2: Consuming organic food has a high overall value.0.699
PV3: High price of organic tea creates a great value to me0.820
Brand Trust [109] 0.8260.7600.514
BT1: I always trust my favorite brand of organic tea product0.725
BT2: My favorite brand of organic tea never disappoints me0.708
BT3: Certification of organic tea of my favorite brand is highly reliable0.717
Repurchase Intention [110] 0.9030.8540.660
RI1: I intend to recommend organic tea products to my neighbors0.783
RI2: I will keep buying the organic tea product in the future.0.832
RI3: I intend to purchase organic tea products in the future.0.822
Note: CR = Composite reliability, AVE = Average variance extracted, Source: Authors’ calculation.
Table 3. Correlation of latent variables and square roots of AVE.
VariablesFQBIIQPEPSPVBTRI
Food Quality (FQ)0.722
Brand Image (BI)0.595 **0.740
Information Quality0.486 **0.425 **0.779
Promotional Efforts0.485 **0.476 **0.388 **0.775
Product Satisfaction0.566 **0.471 **0.566 **0.563 **0.812
Perceived Value (PV)0.557 **0.504 **0.664 **0.568 **0.735 **0.752
Brand Trust0.576 **0.536 **0.472 **0.541 **0.620 **0.557 **0.717
Repurchase Intention0.646 **0.499 **0.492 **0.682 **0.711 **0.750 **0.628 **0.812
Mean3.1413.3913.6693.7503.3413.4523.2953.414
Standard Deviation0.7010.6470.6540.6470.8190.7830.6880.782
Skewness−0.288−0.519−0.267−0.406−0.207−0.3130.126−0.214
Kurtosis−0.2910.2360.1140.1580.175−0.343−0.131−0.153
Note: (In Table, bold elements, the square root of AVE). ** indicates that correlation is significant at the 0.01 level (2-tailed).
Table 4. Heterotrait–Monotrait Ratio (HTMT).
VariablesFQBIIQPEPSPVBTRIVIFR2
Food Quality (FQ) 2.189
Brand Image (BI)0.794 1.794
Information Quality (IQ)0.6030.530 1.916
Promotional Efforts (PE)0.6030.5950.473 2.008
Product Satisfaction (PE)0.6980.5730.6770.675 0.49
Perceived Value (PV)0.5140.6120.7840.6750.829 3.2300.64
Brand Trust (BT)0.7140.6660.5690.6580.7420.659 1.9960.48
Repurchase Intention (BI)0.7880.6080.5890.8190.8100.8020.750 3.0620.75
Table 5. Results of CFA and structural model with standards.
Fit IndicesValues for CFAValues for Structural ModelStandards with Sources
χ2/df2.2852.539<3[122]
IFI0.9380.923>0.900[120]
NFI0.9190.911>0.900[120]
CFI0.9430.923>0.900[123]
GFI0.9130.905>0.900[120]
AGFI0.9070.901>0.900[124]
TLI0.9220.906≥0.90[125]
SRMR0.0240.027<0.080[120]
RMSEA0.0660.073<0.080[125,126]
Source: Authors’ calculation.
Table 6. Structural model and hypothesis testing result.
HypothesesSTD BetaSTD Errort-Valuesp-ValuesSignificance (p < 0.05)
H1: FQ→PS0.5080.0757.921 ***0.000Significant
H2: FQ→BT0.4630.0796.893 ***0.000Significant
H3: FQ→PV0.1400.0762.433 **0.015Significant
H4: BI→PS0.6190.0689.487 ***0.000Significant
H5: BI→BT0.3130.0615.365 ***0.000Significant
H6: BI→PV0.3200.0813.738 ***0.000Significant
H7: IQ→PS0.2980.0803.022 ***0.003Significant
H8: IQ→BT0.3820.0656.149 ***0.000Significant
H9: IQ→PV0.2730.0743.995 ***0.000Significant
H10: PE→BT0.1290.0672.273 **0.023Significant
H11: PE→PV0.2560.0614.001 ***0.000Significant
H12: PE→RI0.1020.0771.2570.209Not Significant
H13: PS→BT0.1640.0592.458 **0.014Significant
H14: PS→RI0.4980.0707.019 ***0.000Significant
H15: BT→RI0.3760.0616.385 ***0.000Significant
H16: PV→RI0.1360.0722.048 **0.041Significant
** Significant at 5% level, *** Significant at 1% level.
Publisher’s Note: MDPI stays neutral with regard to jurisdictional claims in published maps and institutional affiliations.

