Mathematical Profile Test: A Preliminary Evaluation of an Online Assessment for Mathematics Skills of Children in Grades 1–6


Abstract
1. Introduction
1.1. The Theoretical Framework of the MathPro Test
1.2. Core Number Domain
1.3. Memory Domain
1.4. Visual-Spatial Domain
1.5. Reasoning Domain
1.6. Selection of the MathPro Test Tasks
1.7. The Aim of This Study
2. Materials and Methods
2.1. MathPro Subtests
2.2. MathPro Subtests
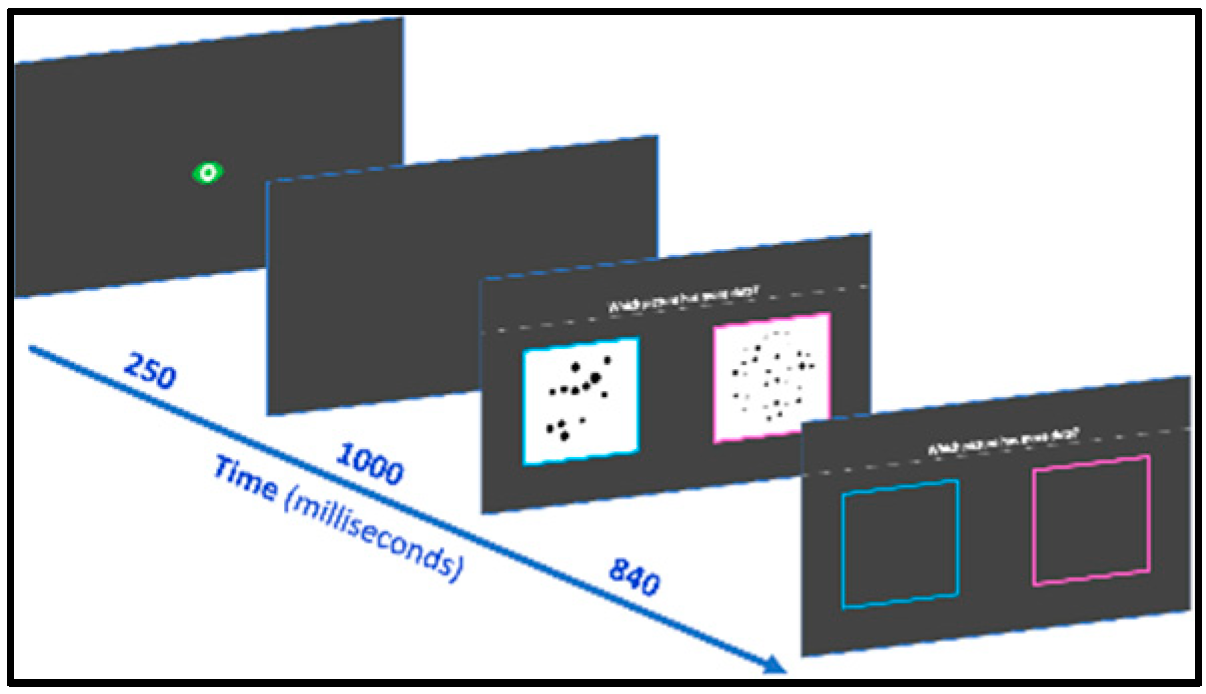
2.2.1. Dots Magnitude Comparison
2.2.2. Single and Multidigit Number Magnitude Comparison
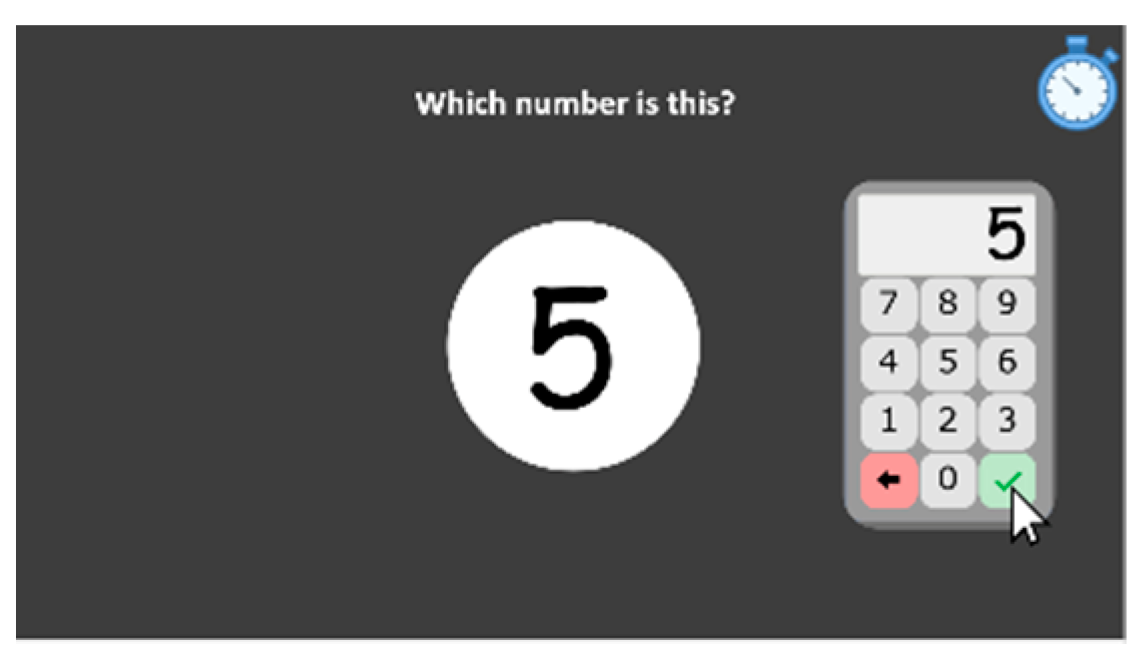
2.2.3. Screen Keyboard Use
2.2.4. Numbers Dictation
2.2.5. Next Number
2.2.6. Previous Number
2.2.7. Subitizing
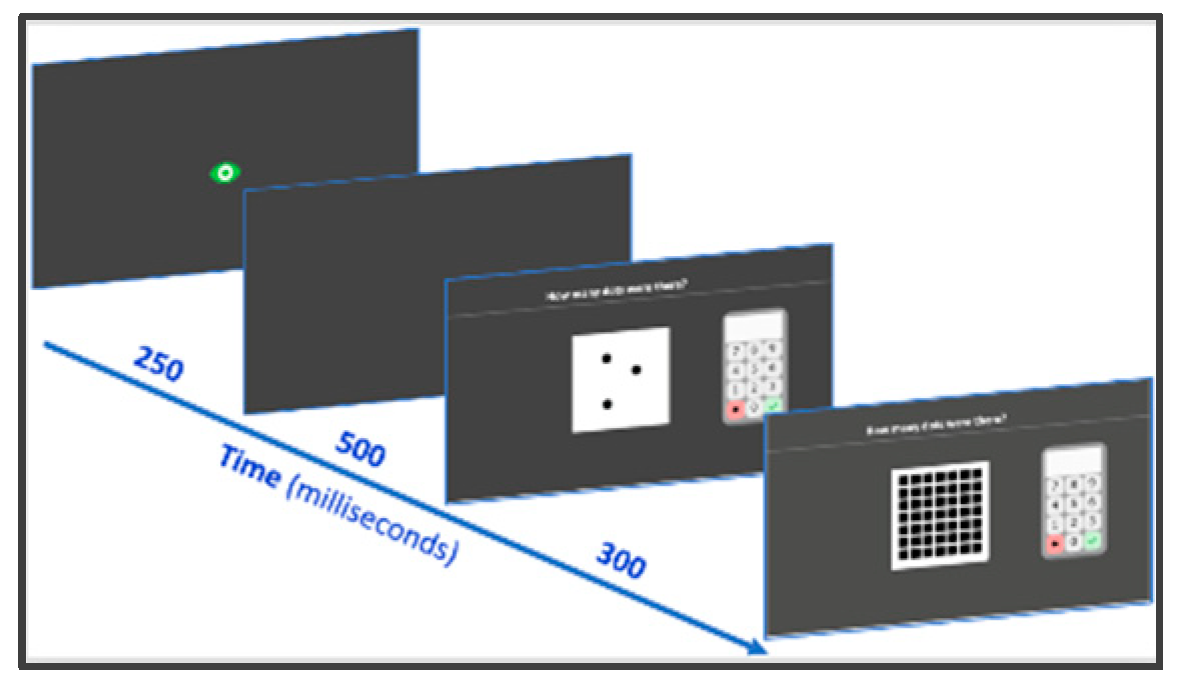
2.2.8. Enumeration
2.2.9. Addition Facts Retrieval
2.2.10. Multiplication Facts Retrieval
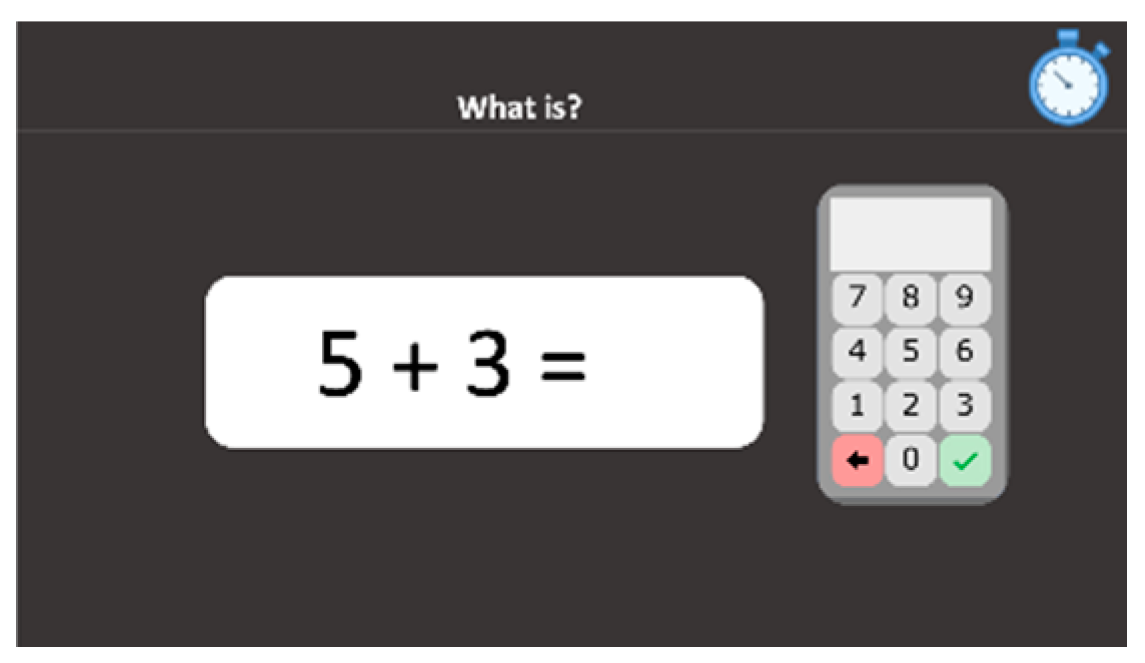
2.2.11. Mental Calculations
2.2.12. Number Lines 0–100
2.2.13. Number Lines 0–1000
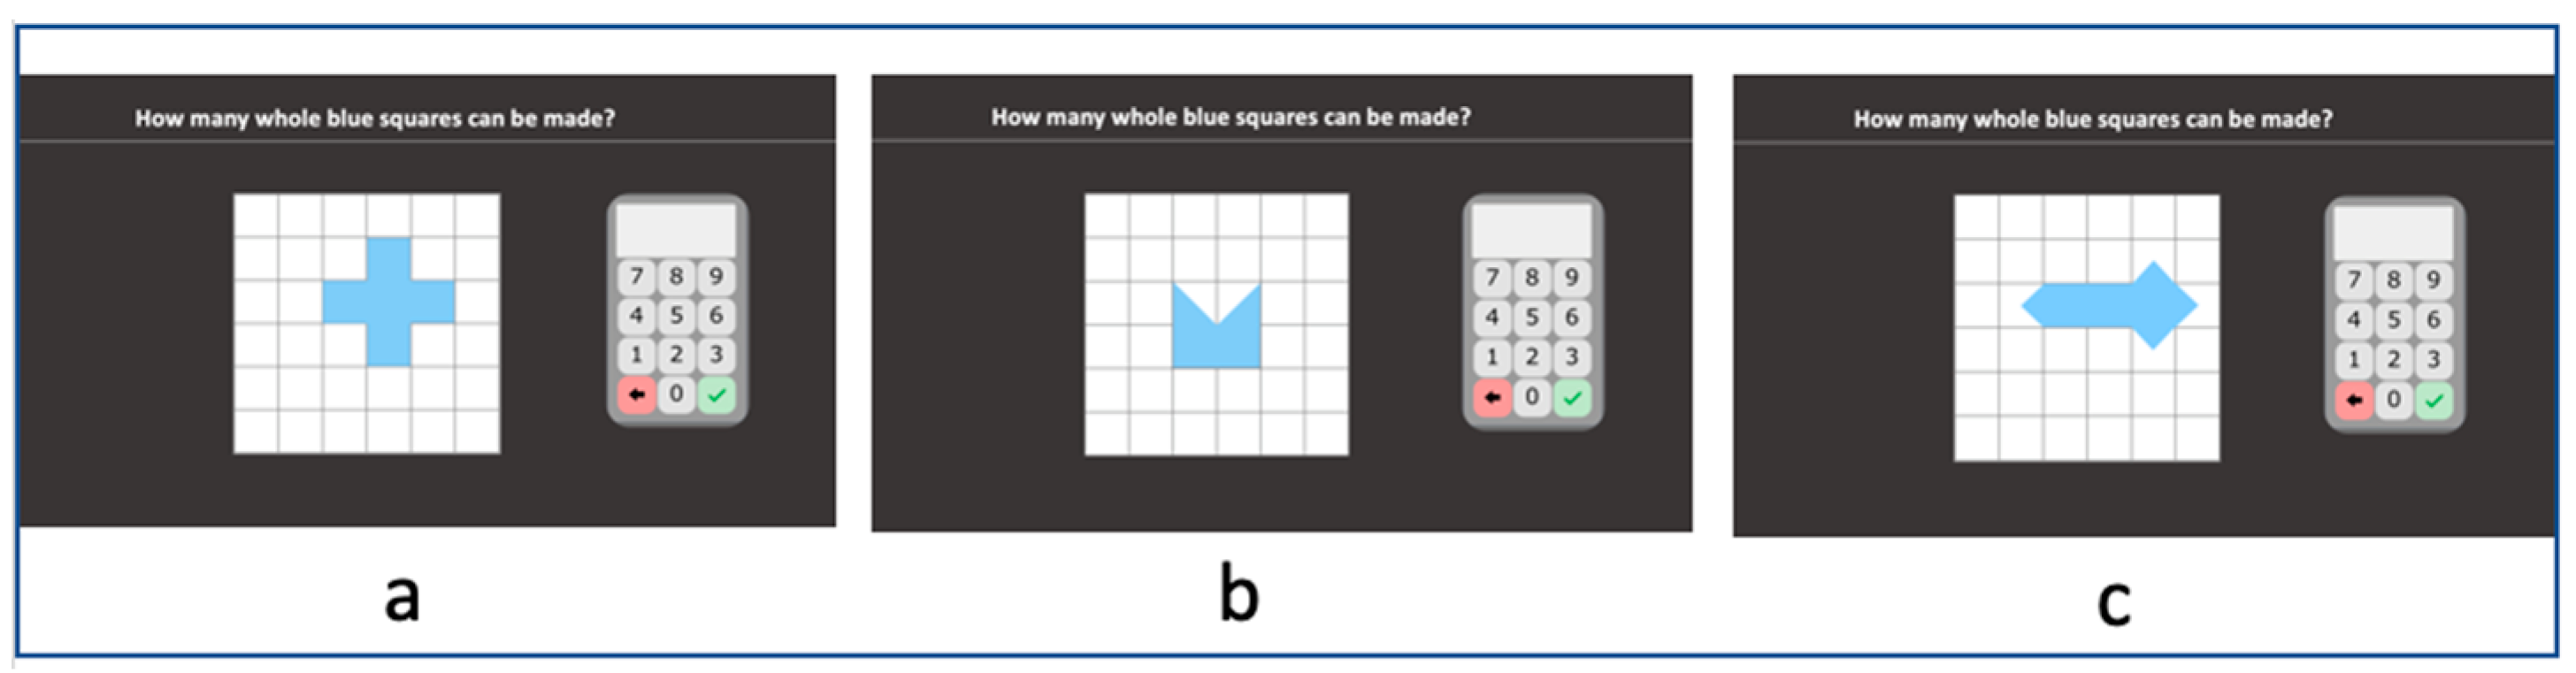
2.2.14. Squares
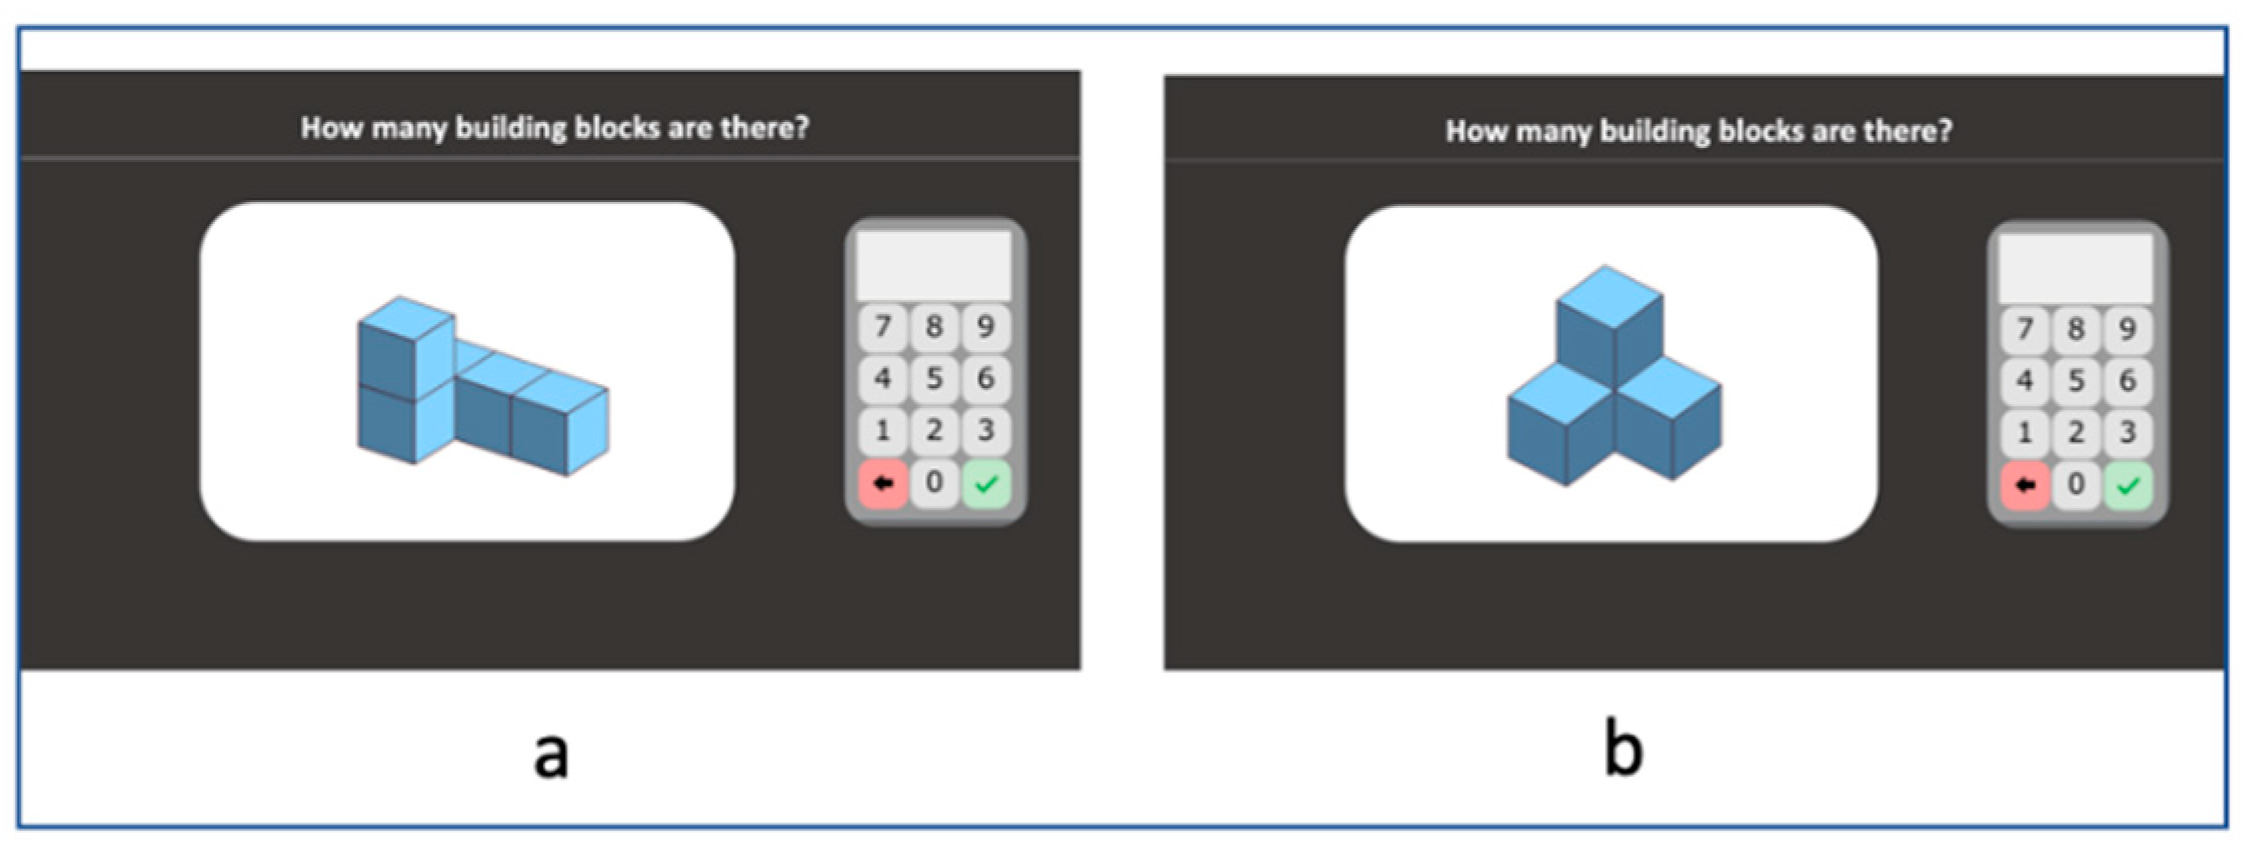
2.2.15. Building Blocks
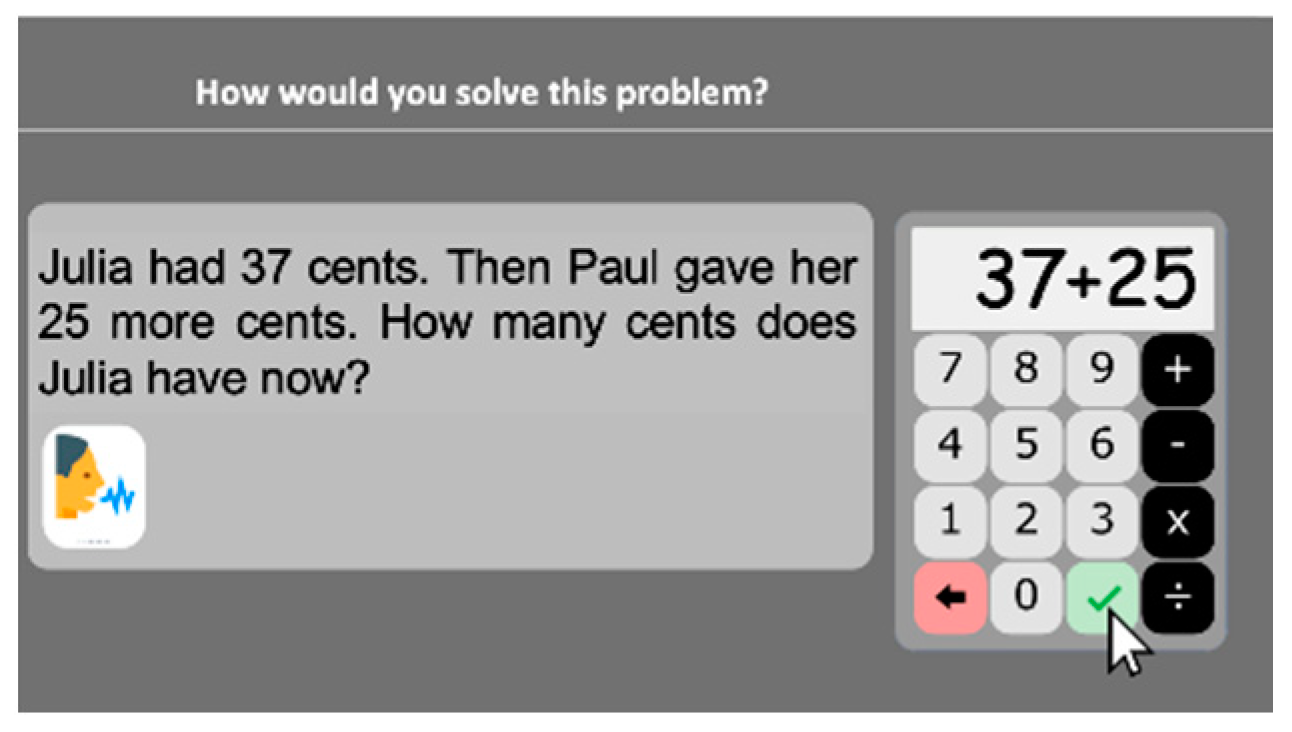
2.2.16. Word Problems
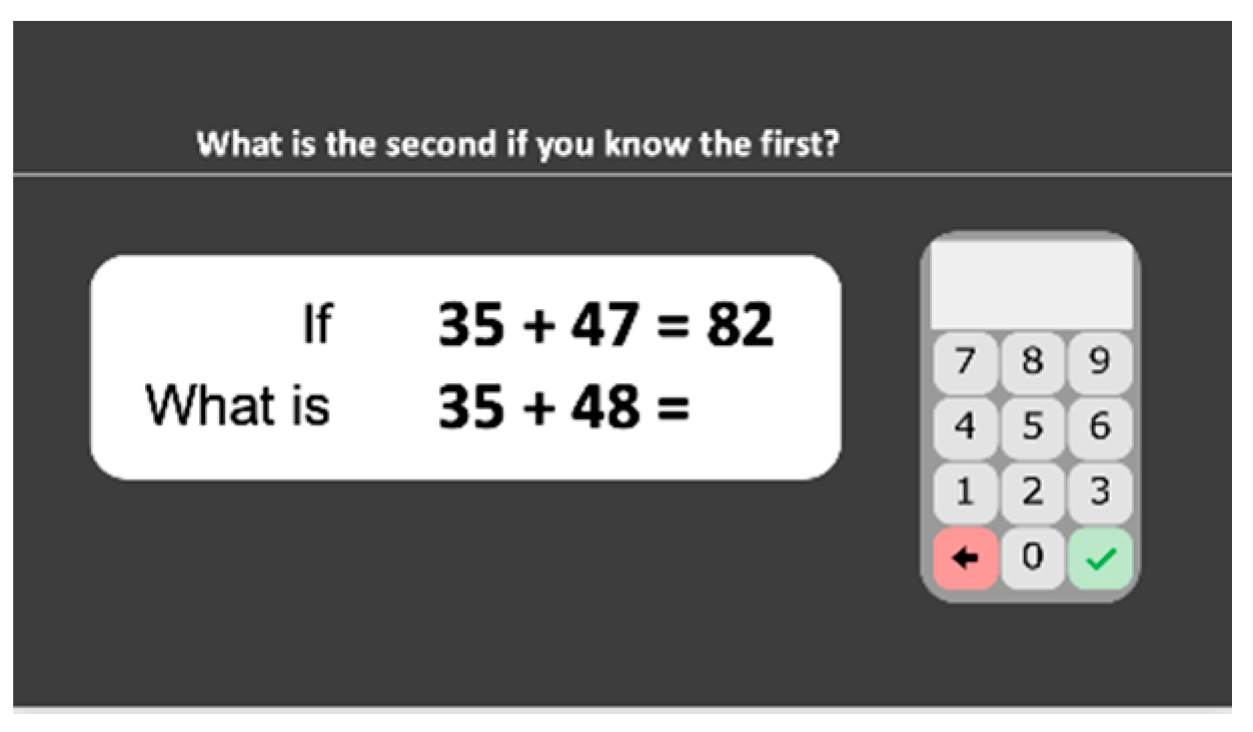
2.2.17. Calculation Principles
2.2.18. Numerical Patterns
2.3. MathPro Test Advantages
2.4. Standardized Test in Mathematics
2.5. Statistical Analysis
3. Results
3.1. Descriptive Analyses
3.2. Internal Consistency
3.3. Grade and Difficulty Effects
3.4. Correlations with the Standardized Math Test
3.5. Comparison of MD Versus Typically Achieving Students
4. Discussion
4.1. The Core Number Domain Measures
4.2. The Memory Domain Measures
4.3. The Reasoning Domain Measures
4.4. The Visual-Spatial Domain Measures
4.5. The Difficulties in Children with MD
4.6. Limitations and Future Perspectives
5. Conclusions
Author Contributions
Funding
Acknowledgments
Conflicts of Interest
Appendix A
Appendix A.1. Difficulty Effects for Grades 1, 2, 3
Appendix A.1.1. Multidigit Numbers Comparison
Appendix A.1.2. Numbers Dictation
Appendix A.1.3. Next Numbers
Appendix A.1.4. Previous Numbers
Appendix A.1.5. Enumeration
Appendix A.1.6. Addition Facts Retrieval
Appendix A.1.7. Mental Calculations
References
- Ancker, J.S.; Kaufman, D. Rethinking health numeracy: A multidisciplinary literature review. J. Am. Med. Inf. Assoc. 2007, 14, 713–721. [Google Scholar] [CrossRef] [PubMed]
- Rivera-Batiz, F.L. Quantitative literacy and the likelihood of employment among young adults in the United States. J. Hum. Resour. 1992, 27, 313–328. [Google Scholar] [CrossRef]
- Parsons, S.; Bynner, J. Does Numeracy Matter More? National Research and Development Centre for Adult Literacy and Numeracy: London, UK, 2005; p. 44. [Google Scholar]
- Szücs, D. Subtypes and co-morbidity in mathematical learning disabilities: Multi-dimensional study of verbal and visual memory processes is key to understanding. Prog. Brain Res. 2016, 227, 277–304. [Google Scholar]
- Geary, D.C. Role of Cognitive Theory in the Study of Learning Disability in Mathematics. J. Learn. Disabil. 2005, 38, 305–307. [Google Scholar] [CrossRef] [PubMed]
- Geary, D.C. Mathematics and learning disabilities. J. Learn. Disabil. 2004, 37, 4–15. [Google Scholar] [CrossRef]
- Gersten, R.; Clarke, B.; Jordan, N.C.; Newman-Gonchar, R.; Haymond, K.; Wilkins, C. Universal Screening in Mathematics for the Primary Grades: Beginnings of a Research Base. Except. Child. 2012, 78, 423–445. [Google Scholar] [CrossRef]
- Lewis, K.E.; Fisher, M.B. Taking stock of 40 years of research on mathematical learning disability: Methodological issues and future directions. J. Res. Math. Educ. 2016, 47, 338–371. [Google Scholar] [CrossRef]
- Murphy, M.M.; Mazzocco, M.M.M.; Hanich, L.B.; Early, M.C. Cognitive characteristics of children with mathematics learning disability (MD) vary as a function of the cutoff criterion used to define MD. J. Learn. Disabil. 2007, 40, 458–478. [Google Scholar] [CrossRef]
- Bartelet, D.; Ansari, D.; Vaessen, A.; Blomert, L. Cognitive subtypes of mathematics learning difficulties in primary education. Dev. Disabil. Res. Rev. 2014, 35, 657–670. [Google Scholar] [CrossRef]
- Ashkenazi, S.; Black, J.M.; Abrams, D.A.; Hoeft, F.; Menon, V. Neurobiological underpinnings of math and reading learning disabilities. J. Learn. Disabil. 2013, 46, 549–569. [Google Scholar] [CrossRef]
- Fias, W.; Menon, V.; Szucs, D. Multiple components of developmental dyscalculia. Trends Neurosci. Educ. 2013, 2, 43–47. [Google Scholar] [CrossRef]
- Skagerlund, K.; Träff, U. Number Processing and Heterogeneity of Developmental Dyscalculia: Subtypes with Different Cognitive Profiles and Deficits. J. Learn. Disabil. 2016, 49, 36–50. [Google Scholar] [CrossRef] [PubMed]
- Karagiannakis, G.; Baccaglini-Frank, A.; Papadatos, Y. Mathematical learning difficulties subtypes classification. Front. Hum. Neurochir. 2014, 8, 57. [Google Scholar] [CrossRef] [PubMed]
- Schneider, M.; Beeres, K.; Coban, L.; Merz, S.; Schmidt, S.S.; Stricker, J.; De Smedt, B. Associations of non-symbolic and symbolic numerical magnitude processing with mathematical competence: A meta-analysis. Dev. Sci. 2017, 20, e12372. [Google Scholar] [CrossRef]
- Schwenk, C.; Sasanguie, D.; Jörg-Tobias, K.; Kempe, S.; Doebler, P.; Holling, H. (Non-) symbolic magnitude processing in children with mathematical difficulties: A meta-analysis. Res. Dev. Disabil. 2017, 64, 152–167. [Google Scholar] [CrossRef]
- Moeller, K.; Neuburger, S.; Kaufmann, L.; Landerl, K.; Nuerk, H.-C. Basic number processing deficits in developmental dyscalculia: Evidence from eye-tracking. Cogn. Dev. 2009, 24, 371–386. [Google Scholar] [CrossRef]
- Schleifer, P.; Landerl, K. Subitizing and counting in typical and atypical development. Dev. Sci. 2011, 14, 280–291. [Google Scholar] [CrossRef]
- Ashkenazi, S.; Mark-Zigdon, N.; Henik, A. Do subitizing deficits in developmental dyscalculia involve pattern recognition weakness? Dev. Sci. 2013, 16, 35–46. [Google Scholar] [CrossRef]
- Landerl, K.; Bevan, A.; Butterworth, B. Developmental dyscalculia and basic numerical capacities: A study of 8–9-year-old students. Cognition 2004, 93, 99–125. [Google Scholar] [CrossRef]
- Lyons, I.M.; Beilock, S.L. Numerical ordering ability mediates the relation between number-sense and arithmetic competence. Cognition 2011, 121, 256–261. [Google Scholar] [CrossRef]
- Garnett, K.; Fleischner, J.E. Automatization and basic fact performance of normal and learning disabled children. Learn. Disabil. Q. 1983, 6, 223–230. [Google Scholar] [CrossRef]
- Geary, D.C.; Hoard, M.K.; Hamson, C.O. Numerical and arithmetical cognition: Patterns of functions and deficits in children at risk for a mathematical disability. J. Exp. Child Psychol. 1999, 74, 213–239. [Google Scholar] [CrossRef] [PubMed]
- Mussolin, C.; Noël, M.-P. Specific retrieval deficit from long-term memory in children with poor arithmetic facts abilities. Open Psychol. J. 2008, 1, 26–34. [Google Scholar] [CrossRef][Green Version]
- De Visscher, A.; Noël, M.-P. The detrimental effect of interference in multiplication facts storing: Typical development and individual differences. J. Exp. Psychol. Gen. 2014, 143, 2380–2400. [Google Scholar] [CrossRef] [PubMed]
- De Visscher, A.; Noël, M.P. Arithmetic facts storage deficit: The hypothesis of hypersensitivity-to-interference in memory. Dev. Sci. 2014, 17, 434–442. [Google Scholar] [CrossRef] [PubMed]
- Holmes, V.M.; McGregor, J. Rote memory and arithmetic fact processing. Mem. Cog. 2007, 35, 2041–2051. [Google Scholar] [CrossRef][Green Version]
- Friso-van den Bos, I.; van der Ven, S.H.G.; Kroesbergen, E.H.; van Luit, J.E.H. Working memory and mathematics in primary school children: A meta-analysis. Educ. Res. Rev. 2013, 10, 29–44. [Google Scholar] [CrossRef]
- Peng, P.; Namkung, J.; Barnes, M.; Sun, C. A meta-analysis of mathematics and working memory: Moderating effects of working memory domain, type of mathematics skill, and sample characteristics. J. Educ. Psychol. 2016, 108, 455–473. [Google Scholar] [CrossRef]
- Swanson, H.L.; Jerman, O. Math Disabilities: A Selective Meta-Analysis of the Literature. Rev. Educ. Res. 2006, 76, 249–274. [Google Scholar] [CrossRef]
- Van Garderen, D. Spatial visualization, visual imagery, and mathematical problem solving of students with varying abilities. J. Learn. Disabil. 2006, 39, 496–506. [Google Scholar] [CrossRef]
- Osmon, D.C.; Smerz, J.M.; Braun, M.M.; Plambeck, E. Processing abilities associated with math skills in adult learning disability. J. Clin. Exp. Neuropsyc. 2006, 28, 84–95. [Google Scholar] [CrossRef] [PubMed]
- Crollen, V.; Noël, M.-P. How does space interact with numbers? In Visual-Spatial Ability in STEM Education. Transforming Research into Practice; Khine, M.S., Ed.; Springer International Publishing: Cham, Switzerland, 2017; pp. 241–263. [Google Scholar]
- Rourke, B.P. Arithmetic disabilities, specific and otherwise: A neuropsychological perspective. J. Learn. Disabil. 1993, 26, 214–226. [Google Scholar] [CrossRef] [PubMed]
- Rourke, B.P.; Conway, J.A. Disabilities of arithmetic and mathematical reasoning: Perspectives from neurology and neuropsychology. J. Learn. Disabil. 1997, 30, 34–46. [Google Scholar] [CrossRef] [PubMed]
- Rourke, B.P.; Finlayson, M.A.J. Neuropsychological significance of variations in patterns of academic performance: Verbal and visual-spatial abilities. J. Abnorm. Child Psychol. 1978, 6, 121–133. [Google Scholar] [CrossRef] [PubMed]
- Mammarella, I.C.; Giofrè, D.; Ferrara, R.; Cornoldi, C. Intuitive geometry and visuospatial working memory in children showing symptoms of nonverbal learning disabilities. Child Neuropsychol. 2013, 19, 235–249. [Google Scholar] [CrossRef]
- Mammarella, I.C.; Lucangeli, D.; Cornoldi, C. Spatial working memory and arithmetic deficits in children with nonverbal learning difficulties (NLD). J. Learn. Disabil. 2010, 43, 455–468. [Google Scholar] [CrossRef]
- Crollen, V.; Vanderclausen, V.; Allaire, F.; Pollaris, A.; Noël, M.-P. Spatial and numerical processing in children with non-verbal learning disabilities. Dev. Disabil. Res. Rev. 2015, 47, 61–72. [Google Scholar] [CrossRef]
- Hubbard, E.M.; Piazza, M.; Pinel, P.; Dehaene, S. Interactions between number and space in parietal cortex. Nat. Rev. Neurosci. 2005, 6, 435–448. [Google Scholar] [CrossRef]
- Szucs, D.; Devine, A.; Soltesz, F.; Nobes, A.; Gabriel, F. Developmental dyscalculia is related to visuo-spatial memory and inhibition impairment. Cortex 2013, 49, 2674–2688. [Google Scholar] [CrossRef]
- Schneider, M.; Merz, S.; Stricker, J.; De Smedt, B.; Torbeyns, J.; Verschaffel, L.; Luwel, K. Associations of Number Line Estimation with Mathematical Competence: A Meta-analysis. Child Dev. 2018, 89, 1467–1484. [Google Scholar] [CrossRef]
- Fuchs, L.S.; Compton, D.L.; Fuchs, D.; Paulsen, K.; Bryant, J.D.; Hamlett, C.L. The Prevention, Identification, and Cognitive Determinants of Math Difficulty. J. Educ. Psychol. 2005, 97, 493–513. [Google Scholar] [CrossRef]
- Nunes, T.; Bryant, P.; Evans, D.; Bell, D.; Gardner, S.; Gardner, J.; Carraher, J. The contribution of logical reasoning to the learning of mathematics in primary school. Br. J. Dev. Psychol. 2007, 25, 147–166. [Google Scholar] [CrossRef]
- Fuchs, L.S.; Fuchs, D.; Compton, D.L.; Powell, S.R.; Seethaler, P.M.; Capizzi, A.M.; Schatschneider, C.; Fletcher, J.M. The cognitive correlates of third-grade skill in arithmetic, algorithmic computation, and arithmetic word problems. J. Educ. Psychol. 2006, 98, 29–43. [Google Scholar] [CrossRef]
- Green, C.T.; Bunge, S.A.; Chiongbian, V.B.; Barrow, M.; Ferrer, E. Fluid reasoning predicts future mathematical performance among children and adolescents. J. Exp. Child Psychol. 2017, 157, 125–143. [Google Scholar] [CrossRef]
- Deary, I.; Strand, S.; Smith, P.; Fernandes, C. Intelligence and Educational Achievement. Intelligence 2007, 35, 13–21. [Google Scholar] [CrossRef]
- Morsanyi, K.; Devine, A.; Nobes, A.; Szucs, D. The link between logic, mathematics and imagination: Evidence from children with developmental dyscalculia and mathematically gifted children. Dev. Sci. 2013, 16, 542–553. [Google Scholar] [CrossRef]
- Karagiannakis, G.; Baccaglini-Frank, A.; Roussos, P. Detecting strengths and weaknesses in learning mathematics through a model classifying mathematical skills, Aust. J. Learn. Disabil. 2017, 21, 115–141. [Google Scholar]
- Gunderson, E.A.; Ramirez, G.; Beilock, S.L.; Levine, S.C. The relation between spatial skill and early number knowledge: The role of the linear number line. Dev. Psychol. 2012, 48, 1229–1241. [Google Scholar] [CrossRef]
- Simms, V.; Clayton, S.; Cragg, L.; Gilmore, C.; Johnson, S. Explaining the relationship between number line estimation and mathematical achievement: The role of visuomotor integration and visuospatial skills. J. Exp. Child Psychol. 2016, 145, 22–33. [Google Scholar] [CrossRef]
- Schneider, M.; Grabner, R.H.; Paetsch, J. Mental number line, number line estimation, and mathematical achievement: Their interrelations in grades 5 and 6. J. Educ. Psychol. 2009, 101, 359–372. [Google Scholar] [CrossRef]
- Reigosa-Crespo, V.; Valdés-Sosa, M.; Butterworth, B.; Estévez, N.; Rodríguez, M.; Santos, E.; Torres, P.; Suárez, R.; Lage, A. Basic numerical capacities and prevalence of developmental dyscalculia: The Havana Survey. Dev. Psychol. 2012, 48, 123–135. [Google Scholar] [CrossRef] [PubMed]
- World Health Organization. World Medical Association Declaration of Helsinki. Ethical principles for medical research involving human subjects. Bull. World Health Org. 2001, 79, 373–374. [Google Scholar]
- Gebuis, T.; Reynvoet, B. Generating nonsymbolic number stimuli. Behav. Res. Methods 2011, 43, 981–986. [Google Scholar] [CrossRef] [PubMed]
- Desmet, L.; Grégoire, L.; Mussolin, C. Developmental changes in the comparison of decimal fractions. Learn. Instr. 2010, 20, 521–523. [Google Scholar] [CrossRef]
- Noël, M.-P.; Turconi, E. Assessing number transcoding in children. Eur. J. Psychol. Appl. 1999, 49, 295–302. [Google Scholar]
- Siegler, R.S.; Opfer, J.E. The Development of Numerical Estimation: Evidence for Multiple Representations of Numerical Quantity. Psychol. Sci. 2003, 14, 237–243. [Google Scholar] [CrossRef]
- Siegler, R.S.; Booth, J.L. Development of numerical estimation in young children. Child Dev. 2004, 75, 428–444. [Google Scholar] [CrossRef]
- Opfer, J.E.; Siegler, R.S. Representational change and children’s numerical estimation. Cogn. Psychol. 2007, 55, 169–195. [Google Scholar] [CrossRef]
- Carpenter, T.P.; Moser, J.M. The development of addition and subtraction problem—solving skills. In Addition and Subtraction: A Cognitive Perspective; Carpenter, T.P., Moser, J.M., Romberg, T.P., Eds.; Lawrence Erlbaum Associates: Hillsdale, NJ, USA, 1982; pp. 9–25. [Google Scholar]
- Vergnaud, G. Multiplicative structures. In Acquisition of Mathematical Concepts and Processes; Lesh, R., Landau, M., Eds.; Academic Press: New York, NY, USA, 1983; pp. 127–174. [Google Scholar]
- Dudal, P. Leerlingvolgsysteem: Wiskunde-Toetsen 1-6 [Student Monitoring System: Mathematics-Tests 1–6]; Garant: Leuven, Belgium, 2000. [Google Scholar]
- IBM Corp. IBM SPSS Statistics for Macintosh, Version 25.0; IBM Corp.: Armonk, NY, USA, 2017. [Google Scholar]
- Streiner, D.L. Starting at the beginning: An introduction to coefficient alpha and internal consistency. J. Pers. Assess. 2003, 80, 99–103. [Google Scholar] [CrossRef]
- Brankaer, C.; Ghesquière, P.; De Smedt, B. Symbolic magnitude processing in elementary school children: A group administered paper-and-pencil measure (SYMP Test). Behav. Res. Methods 2016, 49, 1361–1373. [Google Scholar] [CrossRef] [PubMed]
- Nosworthy, N.; Bugden, S.; Archibald, L.E.; Ansari, D. A Two-Minute Paper-and-Pencil Test of Symbolic and Nonsymbolic Numerical Magnitude Processing Explains Variability in Primary School Children’s Arithmetic Competence. PLoS ONE 2013, 8, e67918. [Google Scholar] [CrossRef]
- Halberda, J.; Mazzocco, M.M.M.; Feigenson, L. Individual differences in non-verbal number acuity correlate with maths achievement. Nature 2008, 455, 665–668. [Google Scholar] [CrossRef]
- Butterworth, B. Dyscalculia Screener; InferNelson: London, UK, 2003. [Google Scholar]
- Gebuis, T.; Kadosh, R.C.; Gevers, W. Sensory-intergration system rather than approximate number system underlies numerosity processing: Acritical review. Acta Psychol. 2016, 171, 17–35. [Google Scholar] [CrossRef]
- De Smedt, B.; Noël, M.-P.; Gilmore, C.; Ansari, D. How do symbolic and non-symbolic numerical magnitude processing relate to individual differences in children’s mathematical skills? A review of evidence from brain and behavior. Trends Neurosci. Educ. 2013, 2, 48–55. [Google Scholar] [CrossRef]
- Russell, R.L.; Ginsburg, H.P. Cognitive analysis of children’s mathematical difficulties. Cogn. Instr. 1984, 1, 217–244. [Google Scholar] [CrossRef]
- Jiménez, J.E.; Garcia, A.I. Is IQ-achievement discrepancy relevant in the definition of arithmetic learning disabilities? Learn. Disabil. Q. 1999, 22, 291–301. [Google Scholar]
- Jordan, N.C.; Oettinger, T. Cognitive arithmetic and problem solving: A comparison of children with specific and general mathematics difficulties. J. Learn. Disabil. 1997, 30, 624–634. [Google Scholar] [CrossRef]
- Fuchs, L.S.; Fuchs, D. Mathematical problem-solving profiles of students with mathematics disabilities with and without comorbid reading disabilities. J. Learn. Disabil. 2002, 35, 564–574. [Google Scholar] [CrossRef]
- Geary, D.C.; Hoard, M.K.; Bailey, D.H. Fact Retrieval Deficits in Low Achieving Children and Children with Mathematical Learning Disability. J. Learn. Disabil. 2012, 45, 291–307. [Google Scholar] [CrossRef]
- Noël, M.P.; Rousselle, L. Developmental Changes in the Profiles of Dyscalculia: An Explanation Based on a Double Exact-and-Approximate Number Representation Model. Front. Hum. Neurosci. 2011, 5, 165. [Google Scholar] [CrossRef]
- Geary, D.; Hoard, M.K.; Nugent, L.; Byrd-Craven, J. Development of Number Line Representations in Children with Mathematical Learning Disability. Dev. Neuropsychol. 2008, 33, 277–299. [Google Scholar] [CrossRef]
- Temple, C.M. Digit dyslexia: A category-specific disorder in developmental dyscalculia. Cogn. Neuropsychol. 1989, 6, 93–116. [Google Scholar] [CrossRef]
- Sullivan, K.S.; Macaruso, P.; Sokol, S.M. Remediation of Arabic numeral processing in a case of developmental dyscalculia. Neuropsychol. Rehabil. 1996, 6, 27–53. [Google Scholar] [CrossRef]


| Grade | Sex | Sum | |
|---|---|---|---|
| Boys | Girls | ||
| 1 | 50 | 56 | 106 |
| 2 | 55 | 43 | 98 |
| 3 | 52 | 50 | 102 |
| 4 | 55 | 56 | 111 |
| 5 | 52 | 40 | 92 |
| 6 | 56 | 57 | 113 |
| Sum | 320 | 302 | 622 |
| Domain | |||
|---|---|---|---|
| Core Number | Memory | Reasoning | Visual-Spatial |
| 1. Dots comparison 2. Single-digit numbers comparison 8. Subitizing | 5. Numbers dictation 6. Νext number 7. Previous number 9. Enumeration 10. Addition facts retrieval 11. Multiplication facts retrieval | 3. Multidigit numbers comparison 12. Mental calculations 17. Word problems 18. Calculation principles 19. Numerical patterns | 13. Number lines 0–100 14. Number lines 0–1000 15. Squares 16. Building blocks |
| Subtests | Grade 1 | Grade 2 | Grade 3 | Grades 4–6 |
|---|---|---|---|---|
| 1. Dots comparison | 30 | 30 | 30 | 30 |
| 2. Single-digit numbers comparison | 24 | 24 | 24 | 24 |
| 3. Multidigit numbers comparison | 0 | 6 | 9 | 12 |
| 4. Screen keyboard use | 10 | 10 | 10 | 10 |
| 5. Numbers dictation * | 30 | 30 | 30 | 30 |
| 6. Next number * | 12 | 18 | 18 | 18 |
| 7. Previous number * | 12 | 18 | 18 | 18 |
| 8. Subitizing | 20 | 20 | 20 | 20 |
| 9. Enumeration | 14 | 14 | 14 | 14 |
| 10. Addition facts retrieval | 12 | 12 | 12 | 12 |
| 11. Multiplication facts retrieval | 0 | 0 | 14 | 14 |
| 12. Mental calculations | 0 | 12 | 24 | 24 |
| 13. Number lines 0–100 | 22 | 22 | 22 | 22 |
| 14. Number lines 0–1000 | 0 | 0 | 22 | 22 |
| 15. Squares | 0 | 0 | 10 | 10 |
| 16. Building blocks | 8 | 8 | 8 | 8 |
| 17. Word problems * | 0 | 10 | 18 | 18 |
| 18. Calculation principles * | 0 | 0 | 15 | 15 |
| 19. Numerical patterns * | 18 | 18 | 18 | 18 |
| Individual Measures | Grade 1 | Grade 2 | Grade 3 | Grade 4 | Grade 5 | Grade 6 | ||||||
|---|---|---|---|---|---|---|---|---|---|---|---|---|
| M | SD | M | SD | M | SD | M | SD | M | SD | M | SD | |
| Dots comparison (AC) | 0.55 | 0.13 | 0.60 | 0.10 | 0.62 | 0.10 | 0.63 | 0.09 | 0.69 | 0.08 | 0.67 | 0.09 |
| Single-digit numbers comparison (AC) | 0.95 | 0.06 | 0.97 | 0.39 | 0.98 | 0.05 | 0.99 | 0.03 | 0.98 | 0.05 | 0.98 | 0.04 |
| Single-digit numbers comparison (RT) | 3113 | 437 | 2799 | 385 | 2515 | 354 | 2337 | 205 | 2211 | 314 | 2153 | 187 |
| Multidigit numbers comparison (AC) | - | - | 0.85 | 0.18 | 0.88 | 0.14 | 0.80 | 0.13 | 0.87 | 0.12 | 0.90 | 0.12 |
| Multidigit numbers comparison (RT) | - | - | 4027 | 944 | 3512 | 503 | 3075 | 360 | 2903 | 444 | 2749 | 285 |
| Screen keyboard use (AC) | 0.96 | 0.01 | 0.98 | 0.01 | 0.98 | 0.01 | 0.99 | 0.01 | 0.99 | 0.01 | 0.99 | 0.01 |
| Screen keyboard use (RT) | 4234 | 792 | 3621 | 523 | 3204 | 399 | 2850 | 275 | 2682 | 350 | 2484 | 259 |
| Numbers dictation (AC) | 0.36 | 0.14 | 0.63 | 0.20 | 0.79 | 0.17 | 0.90 | 0.16 | 0.93 | 0.12 | 0.95 | 0.12 |
| Numbers dictation (RT) | 3670 | 1339 | 3890 | 862 | 2487 | 491 | 2679 | 600 | 2539 | 438 | 2243 | 404 |
| Next number (AC) | 0.50 | 0.35 | 0.64 | 0.28 | 0.83 | 0.25 | 0.91 | 0.09 | 0.92 | 0.02 | 0.95 | 0.12 |
| Next number (RT) | 5682 | 1779 | 5513 | 1384 | 3605 | 889 | 3569 | 596 | 3169 | 519 | 2772 | 370 |
| Previous number (AC) | 0.53 | 0.37 | 0.73 | 0.24 | 0.87 | 0.21 | 0.94 | 0.12 | 0.95 | 0.14 | 0.97 | 0.07 |
| Previous number (RT) | 5942 | 2079 | 5189 | 1115 | 3259 | 610 | 3244 | 510 | 2957 | 439 | 2618 | 347 |
| Subitizing (AC) | 0.64 | 0.20 | 0.74 | 0.16 | 0.79 | 0.14 | 0.85 | 0.11 | 0.87 | 0.11 | 0.87 | 0.12 |
| Enumeration (AC) | 0.71 | 0.29 | 0.81 | 0.23 | 0.85 | 0.18 | 0.92 | 0.13 | 0.92 | 0.13 | 0.89 | 0.15 |
| Enumeration (RT) | 11830 | 6553 | 8387 | 1850 | 7529 | 1550 | 6623 | 1263 | 6115 | 1250 | 5431 | 1024 |
| Addition facts retrieval (AC) | 0.82 | 0.25 | 0.91 | 0.19 | 0.94 | 0.14 | 0.98 | 0.04 | 0.98 | 0.04 | 0.96 | 0.13 |
| Addition facts retrieval (RT) | 8178 | 4130 | 5402 | 1847 | 4343 | 2617 | 3343 | 778 | 3030 | 606 | 2568 | 428 |
| Multiplication facts retrieval (AC) | - | - | - | - | 0.80 | 0.24 | 0.92 | 0.14 | 0.95 | 0.058 | 0.92 | 0.16 |
| Multiplication facts retrieval (RT) | - | - | - | - | 8550 | 3598 | 6186 | 2214 | 4992 | 1539 | 4333 | 2190 |
| Mental calculations (AC) | - | - | 0.53 | 0.27 | 0.63 | 0.23 | 0.80 | 0.19 | 0.85 | 0.14 | 0.84 | 0.15 |
| Number lines 0–100 (PAE) | 17.24 | 8.12 | 8.42 | 4.29 | 6.48 | 2.81 | 5.14 | 1.62 | 4.73 | 1.49 | 4.59 | 1.68 |
| Number lines 0–1000 (PAE) | - | - | - | - | 11.02 | 6.49 | 7.75 | 4.42 | 5.97 | 3.08 | 5.37 | 2.99 |
| Squares (AC) | - | - | - | - | 0.59 | 0.23 | 0.68 | 0.17 | 0.73 | 0.16 | 0.77 | 0.16 |
| Building blocks (AC) | 0.58 | 0.27 | 0.78 | 0.26 | 0.81 | 0.23 | 0.86 | 0.19 | 0.91 | 0.14 | 0.93 | 0.12 |
| Word problems (AC) | - | - | 0.44 | 0.30 | 0.36 | 0.24 | 0.54 | 0.29 | 0.68 | 0.31 | 0.81 | 0.18 |
| Calculation principles (AC) | - | - | - | - | 0.22 | 0.22 | 0.33 | 0.23 | 0.36 | 0.18 | 0.51 | 0.28 |
| Numerical patterns (AC) | 0.21 | 0.16 | 0.38 | 0.18 | 0.45 | 0.17 | 0.52 | 0.20 | 0.58 | 0.21 | 0.60 | 0.20 |
| Measure | Cronbach’s α | Internal Consistency Level |
|---|---|---|
| Numbers dictation (AC) | 0.95 | Good or excellent |
| Screen keyboard use (RT) | 0.94 | |
| Calculation principles (AC) | 0.92 | |
| Number lines 0–100 (PAE) | 0.92 | |
| Next number (AC) | 0.87–0.93 | |
| Word problems (AC) | 0.86–0.93 | |
| Previous number (AC) | 0.84–0.93 | |
| Single-digit numbers comparison (RT) | 0.82–0.93 | |
| Multidigit numbers comparison (RT) | 0.81–0.90 | |
| Numerical patterns (AC) | 0.89 | |
| Numbers dictation (RT) | 0.56–0.89 | |
| Enumeration (RT) | 0.88 | |
| Addition facts retrieval (AC) | 0.88 | |
| Number lines 0–1000 (PAE) | 0.88 | |
| Multiplication facts retrieval (AC) | 0.86 | |
| Mental calculations (AC) | 0.85–0.87 | |
| Multiplication facts retrieval (RT) | 0.85 | |
| Enumeration (AC) | 0.85 | |
| Addition facts retrieval (RT) | 0.84 | |
| Building blocks (AC) | 0.79 | Acceptable |
| Subitizing (AC) | 0.78 | |
| Next number (RT) | 0.66–0.78 | |
| Previous number (RT) | 0.57–0.74 | |
| Squares (AC) | 0.66 | Poor |
| Screen calculator use (AC) | 0.62 | |
| Single-digit numbers comparison (AC) | 0.57 | |
| Multidigit numbers comparison (AC) | 0.44–0.55 | |
| Dots comparison (AC) | 0.42 | Unacceptable |
| Grade | η2 | Difficulty | η2 | Grade × Difficulty | η2 | |
|---|---|---|---|---|---|---|
| Dots comparison (AC) | F5,541 = 15.93 *** | 0.13 | 1 F3.678,1989 = 102.10 *** | 0.09 | p = 0.062 | |
| Single-digit numbers comparison (AC) | F5,615 = 10.72 *** | 0.08 | F1,615 = 67.37 *** | 0.18 | p = 0.298 | |
| Single-digit numbers comparison (RT) | F5,615 = 136.60 *** | 0.53 | F1,615 = 252.30 *** | 0.29 | F5,615 = 7.11 *** | 0.06 |
| Multidigit numbers comparison 4 (AC) | F2,312 = 17.30 *** | 0.10 | 2 F31.664,519 = 206.34 *** | 0.40 | 2 F3.328,519 = 23.45 *** | 0.13 |
| Multidigit numbers comparison 4 (RT) | F2,311 = 21.72 *** | 0.12 | 1 F1.775,552 = 63.06 *** | 0.17 | p = 0.407 | |
| Numbers dictation (AC) | F5,614 = 242.84 *** | 0.66 | 1 F3.234,1986 = 654.23 *** | 0.52 | 1 F16.17,1986 = 107.85 *** | 0.47 |
| Numbers dictation 4 (RT) | F2,300 = 27.54 *** | 0.16 | 1 F2.652,796 = 4.74 ** | 0.02 | 1 F5.304,796 = 6.03 *** | 0.04 |
| Next number 3 (AC) | F3,413 = 8.72 *** | 0.06 | 1 F1.781,734 = 37.84 ** | 0.08 | 1 F5.343,734 = 5.08 ** | 0.04 |
| Next number 4 (RT) | F2,304 = 20.01 *** | 0.17 | p = 0.972 | F2,304 = 5.49 ** | 0.04 | |
| Previous number 3 (AC) | F3,413 = 9.72 *** | 0.07 | 1 F1.700,702 = 34.55 ** | 0.08 | 1 F5.101,702 = 7.06 * | 0.05 |
| Previous number 4 (RT) | F2,306 = 18.64 *** | 0.11 | p = 0.516 | F2,306 = 9.93 ** | 0.06 | |
| Subitizing (AC) | F5,614 = 41.622 *** | 0.25 | 2 F2.802,1721 = 458.88 *** | 0.43 | 2 F14.012,1721 = 4.984 *** | 0.04 |
| Enumeration (AC) | F5,616 = 17.67 *** | 0.13 | F1,616 = 74.64 *** | 0.11 | F5,616 = 2.60 * | 0.02 |
| Enumeration 5 (RT) | F4,500 = 8.74 *** | 0.07 | p = 0.216 | p = 0.584 | ||
| Addition facts retrieval (AC) | F5,615 = 15.36 *** | 0.11 | p = 0.219 | p = 0.099 | ||
| Addition facts retrieval 5 (RT) | F4,510 = 5.32 *** | 0.04 | p = 0.991 | p = 0.773 | ||
| Multiplication facts retrieval 3 (AC) | F3,412 = 15.95 *** | 0.10 | F1,412 = 13.02 *** | 0.03 | p = 0.783 | |
| Multiplication facts retrieval 4 (RT) | F2,412 = 19.49 *** | 0.13 | p = 0.799 | p = 0.087 | ||
| Mental calculations (AC) | F3,413 = 31.64 *** | 0.19 | 1 F1.745,721 = 219.09 *** | 0.35 | 1 F5.236,721 = 8.34 *** | 0.06 |
| Number line tasks 6 (PAE) | F5,611 = 147.55 *** | 0.55 | ||||
| Squares (AC) | F3,413 = 33.04 *** | 0.20 | ||||
| Building blocks (AC) | F3,412 = 21.75 *** | 0.14 | F1,412 = 1216.52 *** | 0.75 | F3,412 = 9.84 *** | 0.07 |
| Word problems 3 (AC) | F5,610 = 37.71 *** | 0.24 | F1,610 = 230.76 *** | 0.27 | F5,610 = 6.86 *** | 0.05 |
| Calculation principles (AC) | F3,403 = 61.69 *** | 0.32 | F2,806 = 335.39 *** | 0.45 | F6,806 = 9.07 *** | 0.06 |
| Numerical patterns (AC) | F3,403 = 25.23 *** | 0.16 | 1 F1.791,722 = 511.78 *** | 0.60 | 1 F5.374,722 = 15.36 *** | 0.10 |
| Grade | 1 | 2 | 3 | 4 | 5 | 6 |
|---|---|---|---|---|---|---|
| Dots comparison (AC) | 0.124 | 0.278 ** | 0.299 ** | 0.201 * | 0.009 | 0.052 |
| Single-digit numbers comparison (AC) | 0.087 | 0.097 | 0.100 | 0.010 | 0.107 | 0.187 |
| Single-digit numbers comparison (RT) | 0.257 ** | 0.022 | 0.020 | 0.051 | 0.009 | 0.093 |
| Multidigit numbers comparison (AC) | - | 0.385 ** | 0.368 ** | 0.538 ** | 0.289 ** | 0.192 * |
| Multidigit numbers comparison (RT) | - | 0.181 | 0.252 * | 0.158 | 0.166 | 0.075 |
| Numbers dictation (AC) | 0.283 ** | 0.439 ** | 0.403 ** | 0.206* | 0.307 ** | 0.148 |
| Numbers dictation (RT) | - | - | 0.035 | 0.169 | 0.023 | 0.036 |
| Next number (AC) | 0.256 ** | 0.305 ** | 0.094 | 0.106 | 0.187 | 0.042 |
| Next number (RT) | - | - | 0.057 | 0.137 | 0.182 | 0.024 |
| Previous number (AC) | 0.303 ** | 0.478 ** | 0.109 | 0.167 | 0.141 | 0.086 |
| Previous number (RT) | 0.100 | 0.028 | 0.072 | 0.042 | ||
| Subitizing (AC) | 0.288 ** | 0.263 ** | 0.152 | 0.013 | 0.184 | 0.095 |
| Enumeration (AC) | 0.382 ** | 0.249 * | 0.014 | 0.152 | 0.126 | 0.154 |
| Enumeration (RT) | - | - | 0.235 * | 0.017 | 0.179 | 0.184 |
| Addition facts retrieval (AC) | 0.434 ** | 0.260 ** | 0.162 | 0.313 ** | 0.006 | 0.034 |
| Addition facts retrieval (RT) | - | 0.315 ** | 0.180 | 0.287 ** | 0.373 ** | 0.288 ** |
| Multiplication facts retrieval (AC) | - | - | 0.278 ** | 0.336 ** | 0.008 | 0.062 |
| Multiplication facts retrieval (RT) | - | - | - | 0.161 | 0.433 ** | 0.192 * |
| Mental calculations (AC) | 0.573 ** | 0.439 ** | 0.495 ** | 0.460 ** | 0.325 ** | |
| Number lines 0–100 (PAE) | 0.374 ** | 0.476 ** | 0.430 ** | 0.292 ** | 0.434 ** | 0.274 ** |
| Number lines 0–1000 (PAE) | - | - | 0.569 ** | 0.488 ** | 0.414 ** | 0.394 ** |
| Squares (AC) | - | - | 0.365 ** | 0.433 ** | 0.277 ** | 0.319 ** |
| Building blocks (AC) | 0.446 ** | 0.185 | 0.219* | 0.327 ** | 0.004 | 0.196 ** |
| Word problems (AC) | - | 0.518 ** | 0.391 ** | 0.613 ** | 0.335 ** | 0.495 ** |
| Calculation principles (AC) | - | - | 0.364 ** | 0.425 ** | 0.411 ** | 0.189 |
| Numerical patterns (AC) | 0.521 ** | 0.477 ** | 0.298 ** | 0.509 ** | 0.462 ** | 0.475 ** |
| MathPro index score | 0.595 ** | 0.604 ** | 0.568 ** | 0.627 ** | 0.637 ** | 0.472 ** |
| Individual Measures | Grade 1 | Grade 2 | Grade 3 | |||||||||
|---|---|---|---|---|---|---|---|---|---|---|---|---|
| TA | MD | F1,103 | Sig | TA | MD | F1,91 | Sig | TA | MD | F1,93 | Sig | |
| n = 20 | n = 83 | n = 75 | n = 16 | n = 73 | n = 20 | |||||||
| M (SD) | M (SD) | M (SD) | M (SD) | M (SD) | M (SD) | |||||||
| Dots comparison (AC) | 0.55 (0.13) | 0.54 (0.11) | 0.047 | 0.829 | 0.60 (0.01) | 0.57 (0.01) | 1.30 | 0.256 | 0.63 (0.01) | 0.60 (0.01) | 1.152 | 0.286 |
| Single-digit numbers comparison (AC) | 0.95 (0.07) | 0.94 (0.05) | 0.077 | 0.782 | 0.98 (0.03) | 0.95 (0.06) | 9.19 | 0.003 | 0.98 (0.04) | 0.98 (0.03) | 0.305 | 0.582 |
| Single-digit numbers comparison (RT) | 3324 (390) | 3050 (421) | 7.286 | 0.008 | 2788 (493) | 2807 (376) | 0.385 | 0.537 | 2490 (367) | 2583 (380) | 0.132 | 0.717 |
| Multidigit numbers comparison (AC) | - | - | - | - | 0.88 (0.17) | 0.71 (0.21) | 11.43 | 0.001 | 0.92 (0.12) | 0.78 (0.15) | 17.318 | <0.001 |
| Multidigit numbers comparison (RT) | - | - | - | - | 4229 (1052) | 3991 (920) | 1.044 | 0.310 | 3421 (464) | 3832 (596) | 10.036 | 0.002 |
| Numbers dictation (AC) | 0.38 (0.13) | 0.31 (0.15) | 4.34 | 0.040 | 0.66 (0.21) | 0.53 (0.18) | 5.47 | 0.022 | 0.83 (0.14) | 0.69 (0.19) | 12.198 | 0.001 |
| Numbers dictation (RT) | - | - | - | - | - | - | - | - | 3242 (610) | 3407 (746) | 0.175 | 0.676 |
| Next number (AC) | 0.53 (0.34) | 0.39 (0.34) | 2.76 | 0.100 | 0.65 (0.29) | 0.63 (0.22) | 0.058 | 0.810 | 0.83 (0.03) | 0.82 (0.03) | 0.029 | 0.866 |
| Next number (RT) | - | - | - | - | - | - | - | - | 3572 (800) | 3838 (1268) | 0.526 | 0.470 |
| Previous number (AC) | 0.56 (0.35) | 0.44 (0.40) | 1.84 | 0.179 | 0.76 (0.23) | 0.60 (0.27) | 6.13 | 0.015 | 0.87 (0.20) | 0.82 (0.28) | 0.775 | 0.381 |
| Previous number (RT) | - | - | - | - | - | - | - | - | 3239 (644) | 3361 (581) | 0.143 | 0.706 |
| Subitizing | 0.66 (0.20) | 0.54 (0.18) | 6.32 | 0.014 | 0.75 (0.13) | 0.66 (0.24) | 5.02 | 0.028 | 0.79 (0.12) | 0.78 (0.12) | 0.236 | 0.628 |
| Enumeration (AC) | 0.76 (0.24) | 0.52 (0.32) | 14.34 | <0.001 | 0.82 (0.22) | 0.75 (0.29) | 1.11 | 0.295 | 0.84 (0.18) | 0.85 (0.21) | 0.016 | 0.901 |
| Enumeration (RT) | - | - | - | - | - | - | - | - | 7431 (1547) | 7874 (1847) | 0.607 | 0.438 |
| Addition facts retrieval (AC) | 0.88 (0.18) | 0.66 (0.34) | 15.31 | <0.001 | 0.92 (0.19) | 0.85 (0.25) | 1.55 | 0.216 | 0.94 (0.13) | 0.95 (0.08) | 0.075 | 0.784 |
| Addition facts retrieval (RT) | - | - | - | - | 5177 (1667) | 6816 (2390) | 12.113 | 0.001 | 4096 (1428) | 5444 (5187) | 3.347 | 0.071 |
| Multiplication facts retrieval (AC) | - | - | - | - | - | - | - | - | 0.82 (0.22) | 0.75 (0.25) | 1.320 | 0.254 |
| Mental calculations (AC) | - | - | - | - | 0.59 (0.25) | 0.30 (0.25) | 17.52 | <0.001 | 0.66 (0.23) | 0.52 (0.18) | 5.408 | 0.022 |
| Number lines 0–100 (PAE) | 15.67 (7.46) | 23.21 (8.37) | 15.51 | <0.001 | 7.7 (3.88) | 11.24 (4.65) | 10.85 | 0.002 | 5.77 (1.79) | 8.92 (4.40) | 22.374 | <0.001 |
| Number lines 0–1000 (PAE) | - | - | - | - | - | - | - | - | 8.82 (4.81) | 16.13 (6.69) | 27.984 | <0.001 |
| Squares (AC) | - | - | - | - | - | - | - | - | 0.62 (0.21) | 0.45 (0.23) | 9.514 | 0.003 |
| Building blocks (AC) | 0.63 (0.25) | 0.46 (0.29) | 7.39 | 0.008 | 0.79 (0.27) | 0.72 (0.26) | 0.82 | 0.368 | 0.83 (0.23) | 0.77 (0.18) | 1.029 | 0.313 |
| Word problems (AC) | - | - | - | - | 0.49 (0.30) | 0.23 (0.26) | 10.85 | 0.001 | 0.40 (0.25) | 0.28 (0.16) | 3.743 | 0.041 |
| Calculation principles (AC) | - | - | - | - | - | - | - | - | 0.26 (0.24) | 0.09 (0.09) | 7.801 | 0.006 |
| Numerical patterns (AC) | 0.25 (0.15) | 0.08 (0.09) | 21.95 | <0.001 | 0.42 (0.18) | 0.28 (0.16) | 6.78 | 0.011 | 0.46 (0.17) | 0.41 (0.15) | 1.240 | 0.268 |
| Individual Measures | TA | MD | F1,278 | Sig |
|---|---|---|---|---|
| n = 212 | n = 76 | |||
| M (SD) | M (SD) | |||
| Dots comparison (AC) | 0.67 (0.09) | 0.64 (0.09) | 5.287 | 0.022 |
| Single-digit numbers comparison (AC) | 0.99 (0.04) | 0.99 (0.03) | 0.103 | 0.749 |
| Single-digit numbers comparison (RT) | 2239 (244) | 2226 (290) | 3.466 | 0.064 |
| Multidigit numbers comparison (AC) | 0.88 (0.11) | 0.79 (0.14) | 28.790 | <0.001 |
| Multidigit numbers comparison (RT) | 2885 (352) | 3009 (478) | 4.31 | 0.039 |
| Numbers dictation (AC) | 0.94 (0.12) | 0.87 (0.17) | 14.752 | <0.001 |
| Numbers dictation (RT) | 4079 (593) | 4211 (811) | 0.694 | 0.405 |
| Next number (AC) | 0.93 (0.11) | 0.91 (0.17) | 2.395 | 0.123 |
| Next number (RT) | 3125 (543) | 3310 (724) | 3.653 | 0.057 |
| Previous number (AC) | 0.96 (0.11) | 0.95 (0.07) | 0.591 | 0.443 |
| Previous number (RT) | 2936 (488) | 2961 (578) | 0.333 | 0.564 |
| Subitizing (AC) | 0.87 (0.11) | 0.85 (0.12) | 3.725 | 0.055 |
| Enumeration (AC) | 0.92 (0.11) | 0.90 (0.16) | 1.949 | 0.164 |
| Enumeration (RT) | 5935 (1209) | 6392 (1480) | 5.238 | 0.023 |
| Addition facts retrieval (AC) | 0.98 (0.05) | 0.96 (0.06) | 1.073 | 0.301 |
| Addition facts retrieval (RT) | 2878 (598) | 3237 (902) | 14.173 | <0.001 |
| Multiplication facts retrieval (AC) | 0.96 (0.08) | 0.90 (0.17) | 7.244 | 0.008 |
| Multiplication facts retrieval (RT) | 4990 (2215) | 5827 (2165) | 6.403 | 0.012 |
| Mental calculations (AC) | 0.87 (0.12) | 0.72 (0.21) | 54.627 | <0.001 |
| Number lines 0–100 (PAE) | 4.50 (1.33) | 5.68 (2.06) | 30.571 | <0.001 |
| Number lines 0–1000 (PAE) | 5.42 (2.93) | 9.43 (4.58) | 70.988 | <0.001 |
| Squares (AC) | 0.77 (0.16) | 0.66 (0.18) | 24.387 | <0.001 |
| Building blocks (AC) | 0.92 (0.14) | 0.86 (0.19) | 8.479 | 0.004 |
| Word problems (AC) | 0.75 (0.24) | 0.48 (0.28) | 60.986 | <0.001 |
| Calculation principles (AC) | 0.44 (0.24) | 0.31 (0.24) | 13.964 | <0.001 |
| Numerical patterns (AC) | 0.62 (0.20) | 0.47 (0.16) | 30.403 | <0.001 |
| Domain | Subtests | Criterion | Grade 1 | Grade 2 | Grade 3 | Grade 4 | Grade 5 | Grade 6 |
|---|---|---|---|---|---|---|---|---|
| Core | Dots comparison (AC) α | STMC | ✓ | ✓ | ✓ | |||
| MD-TA | ✓ | ✓ | ✓ | |||||
| Single-digit numbers comparison (AC) α | STMC | |||||||
| MDC | ✓ | |||||||
| Single-digit numbers comparison (RT) | STMC | ✓ | ||||||
| MD-TA | ✓ | |||||||
| Subitizing | STMC | ✓ | ✓ | |||||
| MD-TA | ✓ | ✓ | ||||||
| Memory | Numbers dictation (AC) | STMC | ✓ | ✓ | ✓ | ✓ | ✓ | |
| MD-TA | ✓ | ✓ | ✓ | ✓ | ✓ | ✓ | ||
| Numbers dictation (RT) α | STMC | |||||||
| MD-TA | ||||||||
| Next number (AC) | STMC | ✓ | ✓ | |||||
| MD-TA | ||||||||
| Next number (RT) α | STMC | |||||||
| MD-TA | ||||||||
| Previous number (AC) | STMC | ✓ | ✓ | |||||
| MD-TA | ||||||||
| Previous number (RT) α | STMC | |||||||
| MD-TA | ||||||||
| Enumeration (AC) | STMC | ✓ | ✓ | |||||
| MD-TA | ✓ | |||||||
| Enumeration (RT) | STMC | ✓ | ||||||
| MD-TA | ✓ | ✓ | ✓ | |||||
| Addition facts retrieval (AC) | STMC | ✓ | ✓ | ✓ | ||||
| MD-TA | ✓ | |||||||
| Addition facts retrieval (RT) | STMC | ✓ | ✓ | ✓ | ✓ | |||
| MD-TA | ✓ | ✓ | ✓ | ✓ | ||||
| Multiplication facts retrieval (AC) | STMC | ✓ | ✓ | |||||
| MD-TA | ✓ | ✓ | ✓ | |||||
| Multiplication facts retrieval (RT) | STMC | ✓ | ✓ | |||||
| MD-TA | ✓ | ✓ | ✓ | |||||
| Reasoning | Multidigit numbers comparison (AC) α | STMC | ✓ | ✓ | ✓ | ✓ | ✓ | |
| MD-TA | ✓ | ✓ | ✓ | ✓ | ✓ | |||
| Multidigit numbers comparison (RT) | STMC | ✓ | ||||||
| MD-TA | ✓ | ✓ | ✓ | ✓ | ||||
| Mental calculations | STMC | ✓ | ✓ | ✓ | ✓ | ✓ | ||
| MD-TA | ✓ | ✓ | ✓ | ✓ | ✓ | |||
| Word problems | STMC | ✓ | ✓ | ✓ | ✓ | ✓ | ||
| MD-TA | ✓ | ✓ | ✓ | ✓ | ✓ | |||
| Calculation principles | STMC | ✓ | ✓ | ✓ | ||||
| MD-TA | ✓ | ✓ | ✓ | ✓ | ||||
| Numerical patterns | STMC | ✓ | ✓ | ✓ | ✓ | ✓ | ✓ | |
| MD-TA | ✓ | ✓ | ✓ | ✓ | ✓ | |||
| Visual-spatial | Number lines 0–100 | STMC | ✓ | ✓ | ✓ | ✓ | ✓ | ✓ |
| MD-TA | ✓ | ✓ | ✓ | ✓ | ✓ | ✓ | ||
| Number lines 0–1000 | STMC | ✓ | ✓ | ✓ | ✓ | |||
| MD-TA | ✓ | ✓ | ✓ | ✓ | ||||
| Squares α | STMC | ✓ | ✓ | ✓ | ✓ | |||
| MD-TA | ✓ | ✓ | ✓ | ✓ | ||||
| Building blocks | STMC | ✓ | ✓ | ✓ | ✓ | |||
| MD-TA | ✓ | ✓ | ✓ | ✓ |
© 2020 by the authors. Licensee MDPI, Basel, Switzerland. This article is an open access article distributed under the terms and conditions of the Creative Commons Attribution (CC BY) license (http://creativecommons.org/licenses/by/4.0/).
Share and Cite
Karagiannakis, G.; Noël, M.-P. Mathematical Profile Test: A Preliminary Evaluation of an Online Assessment for Mathematics Skills of Children in Grades 1–6. Behav. Sci. 2020, 10, 126. https://doi.org/10.3390/bs10080126
Karagiannakis G, Noël M-P. Mathematical Profile Test: A Preliminary Evaluation of an Online Assessment for Mathematics Skills of Children in Grades 1–6. Behavioral Sciences. 2020; 10(8):126. https://doi.org/10.3390/bs10080126
Chicago/Turabian StyleKaragiannakis, Giannis, and Marie-Pascale Noël. 2020. "Mathematical Profile Test: A Preliminary Evaluation of an Online Assessment for Mathematics Skills of Children in Grades 1–6" Behavioral Sciences 10, no. 8: 126. https://doi.org/10.3390/bs10080126
APA StyleKaragiannakis, G., & Noël, M.-P. (2020). Mathematical Profile Test: A Preliminary Evaluation of an Online Assessment for Mathematics Skills of Children in Grades 1–6. Behavioral Sciences, 10(8), 126. https://doi.org/10.3390/bs10080126