


Abstract
Introduction: Sleep disturbances are common as we age and have been linked to poor cognition and increased cognitive decline. Objective: We aimed to examine cross-sectional and longitudinal associations between objective sleep measures and cognition in middle-aged and older adults, including cognitively healthy (CH) individuals and those with mild cognitive impairment (MCI). Methods: Participants from the Aiginition Longitudinal Biomarker Investigation Of Neurodegeneration (ALBION) study (age > 40) underwent 7-day wrist actigraphy (Actiwatch 2). Sleep exposures included sleep duration, sleep efficiency, sleep variability, sleep onset latency, wake after sleep onset (WASO), and number of awakenings. A neuropsychological battery was administered examining memory, executive function, visuospatial ability, language, attention speed, and a global composite score. Cross-sectional associations were tested using generalized linear models (adjusted for age, sex, education). Longitudinal associations with cognitive trajectories were examined with linear mixed-effect models. Results: In total (N = 184; 65% women; mean age 65 years), average sleep duration was 7.2 h and mean sleep efficiency was at 80%. Cross-sectionally, more nightly awakenings were associated with poor memory and attention speed. In a 1.5-year follow-up, (n = 93), higher baseline sleep efficiency was associated with better memory and language performance, while longer WASO, more awakenings, and longer sleep onset latency showed nominal associations with less favorable cognitive trajectories, although these associations did not remain statistically significant after FDR correction. Time-varying analyses indicated that sleep variability showed robust non-linear associations with poorer memory trajectories over follow-up and remained significant after FDR adjustment; significant mean change in awakenings and variability appeared to intensify in later follow-up phases. The association between sleep characteristics and cognitive decline varied across follow-up time, with stronger adverse changes observed during later follow-up phases. Discussion: Objective indicators of sleep continuity, especially sleep variability, were most consistently related to domain-specific cognitive outcomes, with strongest evidence for memory over time. Sleep fragmentation and irregular sleep patterns may represent potentially modifiable targets for future strategies aimed at preserving cognitive health during aging.
1. Introduction
Sleep is increasingly recognized as an important correlate of cognitive aging [1,2,3,4,5,6]. A growing body of evidence shows that specific sleep parameters, such as sleep duration, sleep efficiency, and sleep-disordered breathing, are cross-sectionally associated with poor cognitive outcomes in aging populations [7,8,9,10]. However, many previous studies were cross-sectional, relied on brief global screening instruments, or examined single sleep parameters in isolation. As a result, less is known about how multiple objectively measured sleep characteristics relate to domain-specific cognitive performance and longitudinal cognitive change across midlife and older age. Longitudinal studies examining whether sleep predicts cognitive changes over time in cognitively healthy older adults or in those with Mild Cognitive Impairment (MCI) are fewer but nevertheless informative. These studies collectively suggest that sleep is not only associated with cognition, cross-sectionally, but may also play a predictive role in the trajectory of cognitive aging. For instance, poorer sleep quality, reduced sleep efficiency, increased sleep fragmentation, and the presence of sleep-disordered breathing have all been linked to accelerated decline in cognitive domains such as memory, executive functioning, and processing speed [11,12,13]. Furthermore, individuals with persistent sleep disturbances appear more likely to convert from normal cognition to MCI, or from MCI to dementia, compared with those who maintain more stable sleep patterns [14,15,16]. Despite growing interest in sleep and cognitive aging, important gaps remain in the literature. Many studies have relied on cross-sectional designs, limiting inference about cognitive change over time, while others have used subjective sleep measures that are vulnerable to recall bias and measurement error. In addition, cognition has often been assessed using brief global screening instruments such as the Mini-Mental State Examination (MMSE) rather than comprehensive neuropsychological batteries capable of detecting domain-specific patterns [17,18]. Several studies using actigraphy in older adults without dementia have reported associations between lower sleep efficiency, greater sleep fragmentation, irregular sleep patterns, and poorer cognitive performance [19,20]. However, findings have been inconsistent, and relatively few studies have examined whether objectively measured sleep is associated with longitudinal change across specific cognitive domains. Beyond average sleep duration and sleep efficiency, increasing attention has focused on sleep regularity and night-to-night variability as potentially important determinants of cognitive aging. Greater sleep variability may reflect circadian dysregulation and instability in sleep–wake timing, which have been linked to impaired glymphatic clearance, neuroinflammatory processes, metabolic dysregulation, and hippocampal vulnerability [21,22,23]. These mechanisms may be particularly relevant for memory processes, given the central role of sleep continuity and circadian stability in supporting memory function [24]. Although emerging evidence suggests that sleep irregularity may contribute to adverse cognitive outcomes, relatively few studies have examined whether objectively measured sleep variability and other actigraphy-derived sleep characteristics are associated with longitudinal changes across specific cognitive domains [21]. Less is also known about these associations in samples spanning midlife through older age. Therefore, the present study aimed to examine cross-sectional and longitudinal associations between multiple actigraphy-derived sleep measures and domain-specific cognition in middle-aged and older adults.
2. Methods
2.1. Participants
Participants were drawn from the Aiginition Longitudinal Biomarker Investigation Of Neurodegeneration (ALBION) cohort. The ALBION cohort includes individuals aged over 40 who report memory concerns and are either cognitively healthy (CH) or have MCI [25,26]. ALBION is an ongoing longitudinal study addressing multiple research questions related to preclinical Alzheimer’s disease (AD) [25,26], aiming to identify potential markers for early diagnosis, prediction, and prevention [25,26]. The study collects comprehensive data, including demographic, social and medical information; detailed neuropsychological assessments; and both objective and subjective sleep measures. Participants are assessed annually [26]. Written informed consent was obtained from all participants. The study was approved by the Institutional Review Board of Aiginition hospital (#255/10 May 2021).
Cognitive status was determined by an experienced neurologist (NS) specializing in cognitive disorders, based on clinical information, reliable collateral history, and performance on a comprehensive neuropsychological battery. Dementia diagnoses were established according to DSM-IV-TR criteria [27], and probable or possible Alzheimer’s disease was diagnosed using NINCDS/ADRDA criteria [28]. MCI and MCI subtypes (memory, executive speed, visuospatial, language, and combinations) were assigned when participants reported subjective cognitive complaints and demonstrated objective impairment in at least one cognitive domain, while maintaining preserved activities of daily living. Additional details regarding the cohort design and diagnostic procedures have been previously published [25,26].
2.2. Study Sample
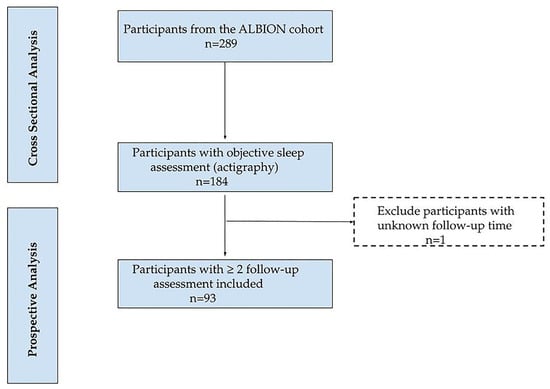
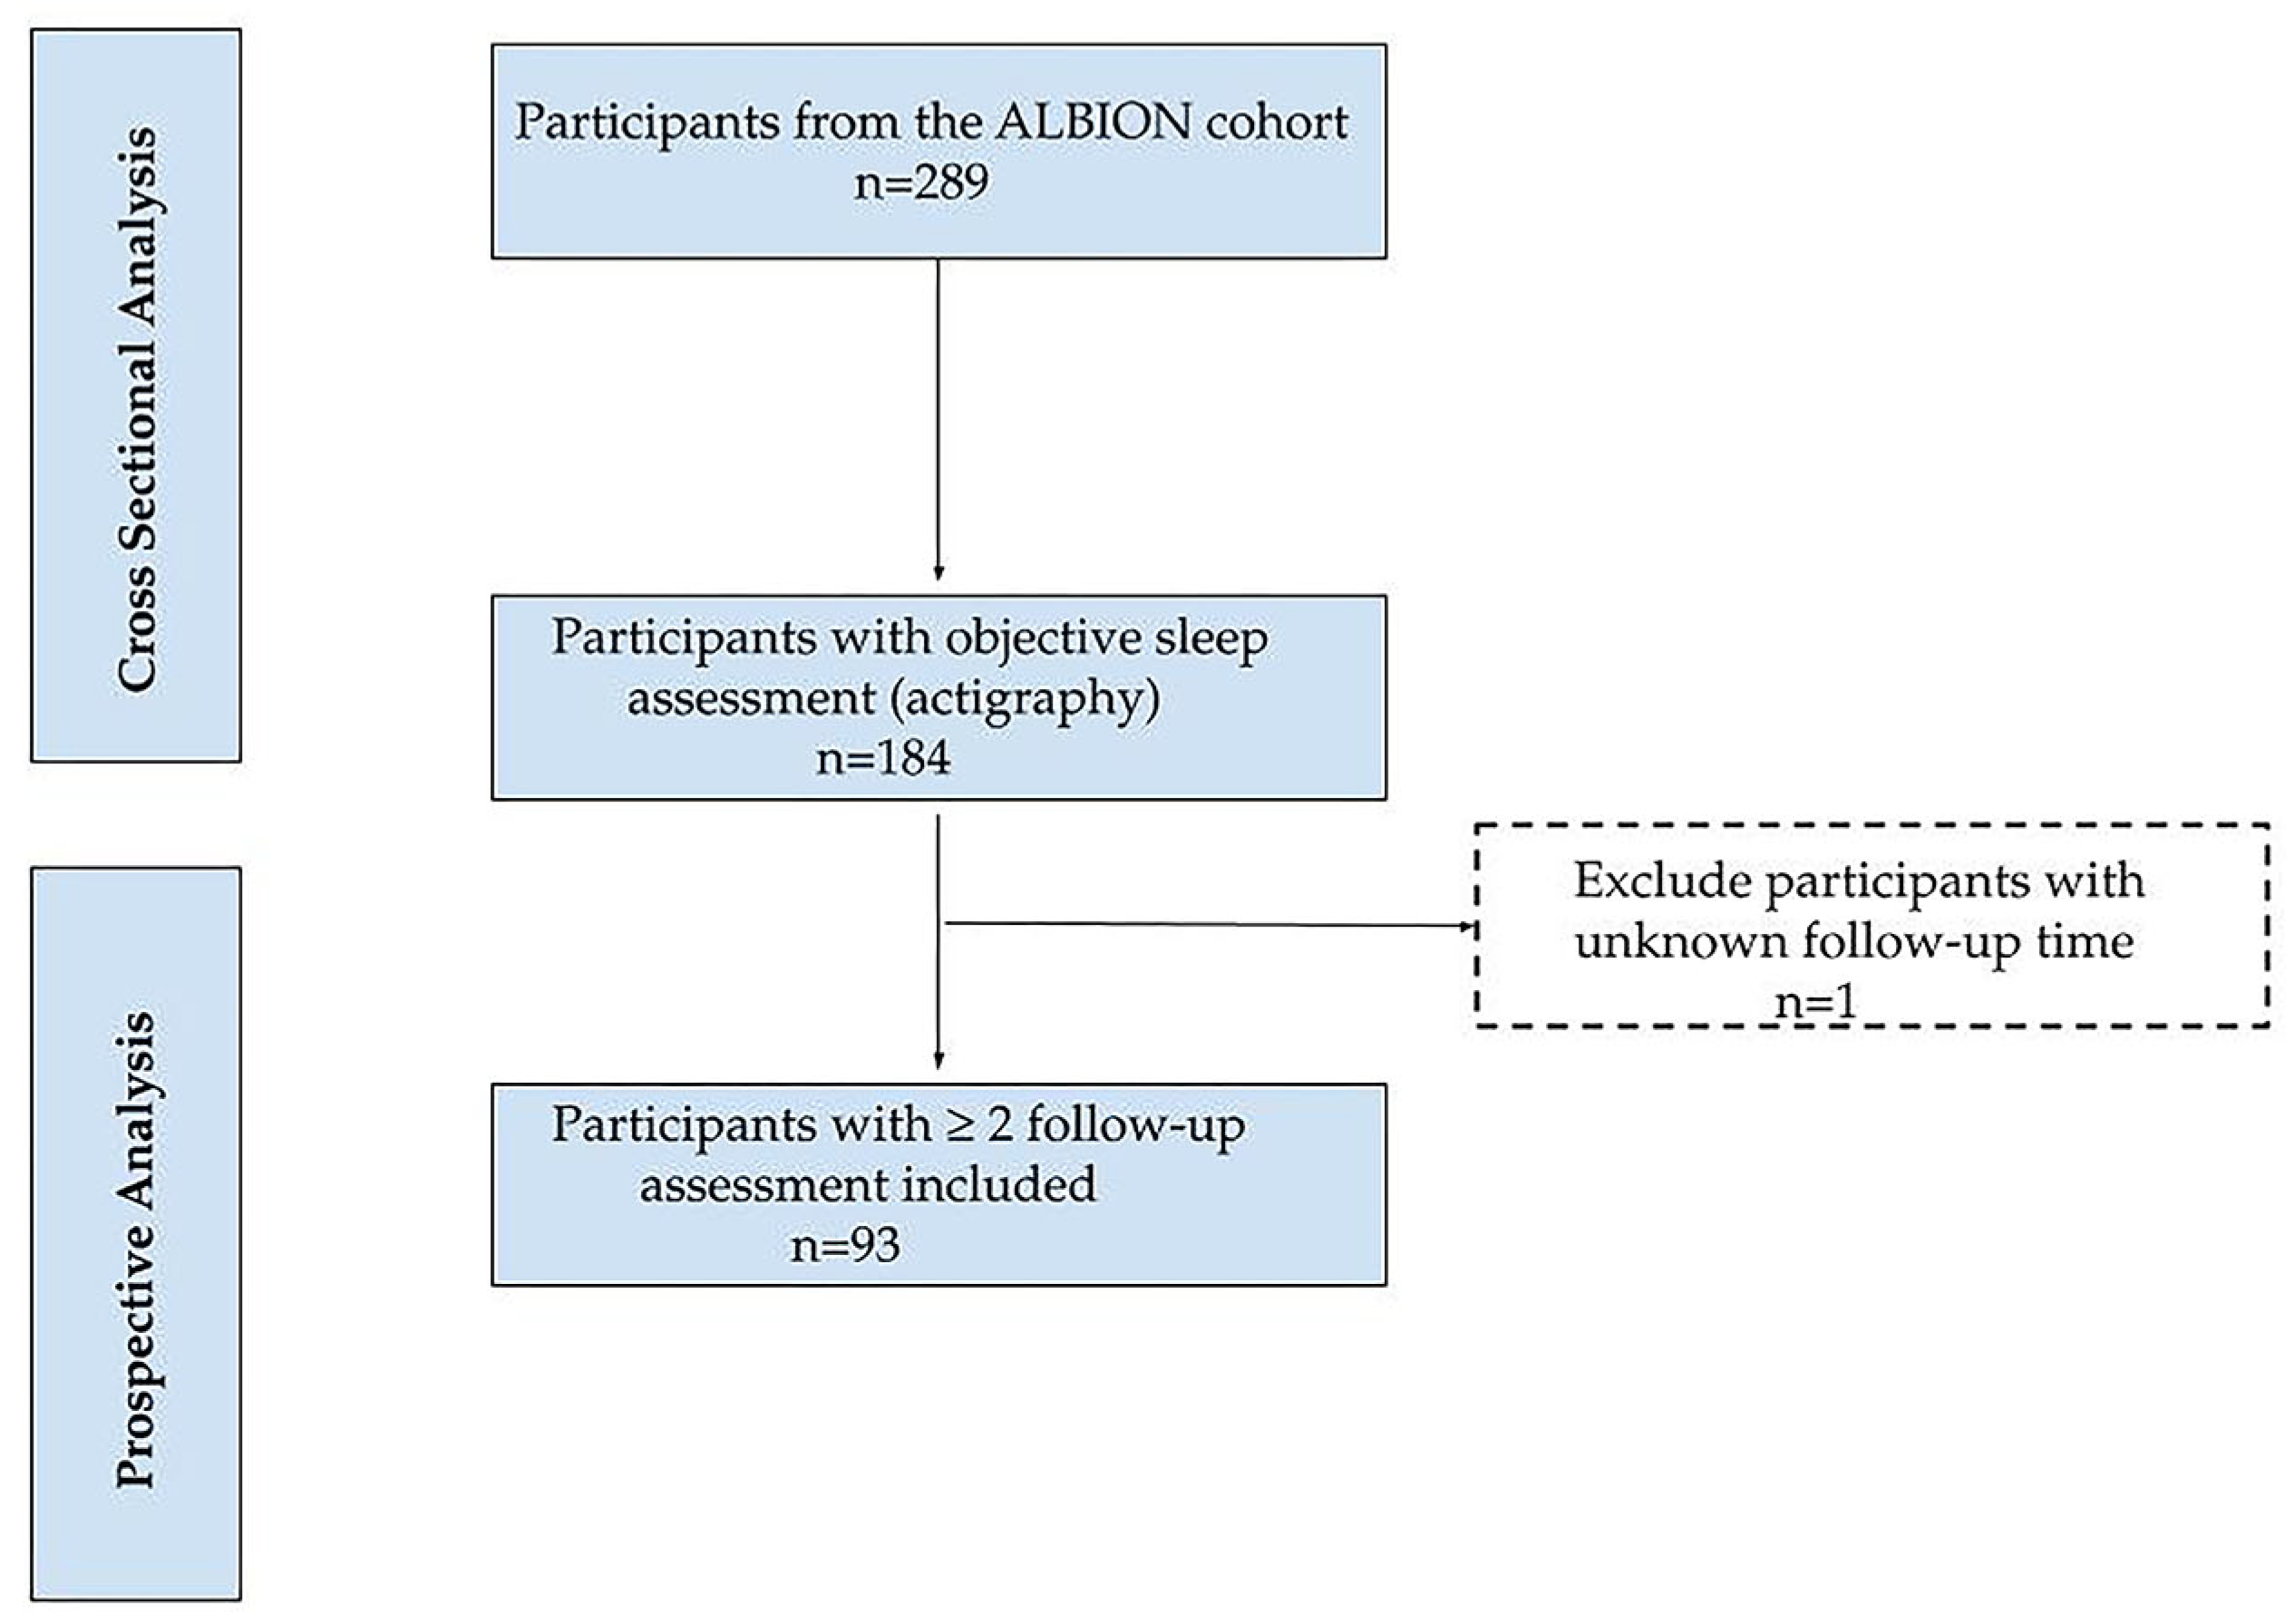
A total of 289 participants from the ALBION cohort were initially considered for inclusion. Of these, 184 participants had valid 7-day wrist actigraphy recordings and were included in the cross-sectional analyses. For prospective analyses, participants were required to have at least two cognitive follow-up assessments. After excluding one participant with unknown follow-up time, 93 participants met these criteria and were included in the longitudinal analyses. A flowchart summarizing participant inclusion and exclusion across analytical stages is presented in Figure 1.
Figure 1.
Flow chart of participants included in cross-sectional and prospective.
To assess the possibility of selection bias, we compared baseline characteristics across three contrasts: (i) participants with MCI versus cognitively healthy individuals, (ii) participants with and without valid actigraphy data, and (iii) participants included versus not included in the longitudinal analyses. These comparisons examined sociodemographic factors (age, sex, years of education), MCI status, and baseline performance across cognitive domains.
2.3. Sleep Measures
Objective sleep–wake function was assessed using wrist-worn Actiwatch 2 devices (Philips Respironics, Murrysville, PA, USA) over a 7-day recording period. Actigraphy is a movement-based method that enables continuous monitoring of sleep–wake patterns in naturalistic settings [29]. Participants were instructed to wear the device continuously for seven consecutive days. For each sleep variable, mean values across recorded nights were calculated and used in the analyses.
The following actigraphy-derived sleep–wake parameters were examined: sleep duration (average hours slept per night), sleep variability (within-individual standard deviation of sleep duration across the recording period), sleep efficiency (total sleep time divided by time in bed × 100), sleep onset latency, WASO (defined as the total minutes scored as awake during sleep periods), and number of nightly awakenings (defined as the total number of wake bouts during sleep periods). These parameters reflect objective estimates of sleep quantity, continuity, and regularity [30].
2.4. Statistical Analysis
Baseline characteristics of participants were described as means and standard deviations (SD), or medians and interquartile ranges for quantitative variables, and percentages for categorical variables. These variables included demographic and sleep-related characteristics and cognitive scores.
Each of the above sleep measures was entered into the models separately as a main predictor. Where appropriate, variables were examined both as continuous and categorical measures. In particular, sleep efficiency was classified as suboptimal (<85%) or sufficient (≥85%), with sufficient (≥85%) set as the reference category [7]. Sleep duration was classified into three levels: short (<7 h), normal (7–9 h), or long (>9 h) [31,32]. To facilitate comparison with previous studies, we used normal (7–9 h) as the reference category. Participants were also categorized by median split for sleep duration variability [33], with low sleep variability (<1.24 h, corresponding to the median sleep variability in the sample) set as the reference category.
To account for potential confounding, covariate selection was informed by prior literature and a directed acyclic graph (DAG) framework developed using DAGitty v3.1 to identify factors potentially associated with both sleep characteristics and cognitive outcomes (Figure S1). Based on this framework, age (years), sex (men, women), and education (years) were included as covariates in all statistical models. Longitudinal analyses were additionally adjusted for diagnostic group (presence of MCI) (Supplementary Figure S1) [5,8,12,19]. This approach is consistent with previous research showing that these demographic factors are associated with both sleep parameters and cognitive performance in older adults [34].
The sample was determined by participant availability within the ALBION cohort and completeness of actigraphy and cognitive follow-up data. Model complexity was restricted by limiting covariate inclusion to variables identified a priori to reduce the risk of overfitting.
2.5. Missing Data
Prior to imputation, the extent of missingness was assessed, revealing a missingness rate of 1.09% for the variable of education. Aiming to maintain the largest possible sample size, we employed the random forest imputation method (“missForest” function from the “missForest” R package), a robust nonparametric approach that handles both numeric and categorical variables [35], for addressing missing variables despite the small proportion of missing data. All analyses were conducted using R (version 4.4.2; Team R 2025).
2.6. Cross-Sectional Analyses
Associations with cognitive outcomes were examined using Generalized Linear Models (GLMs) with appropriate distributions (Gaussian for z-scores, binomial for MCI status). Sleep duration, sleep variability, and sleep efficiency were analyzed both continuously and categorically. In addition, the remaining sleep predictors (sleep onset latency, wake after sleep onset, and number of awakenings) were separately introduced in the models as continuous variables. The association between sleep measures and cognitive function was estimated by beta coefficients and their 95% CIs obtained from generalized linear regression.
2.7. Prospective Analyses
Since participants contributed several cognitive assessments over the follow-up, the dataset had a longitudinal repeated-measures structure. Longitudinal models require at least two observations per participant. Individuals with only one study visit were excluded from the analysis. We also excluded participants who had missing cognitive score data or for whom the timing of follow-up assessments could not be determined.
For longitudinal analyses, linear mixed-effects models [12] were used to evaluate associations between baseline sleep metrics and cognitive trajectories during follow-up. These models incorporated all available cognitive assessments while accounting for within-person correlations over time and incomplete follow-up data. Participant identification numbers were used to define repeated observations within individuals, and both random intercepts and random slopes for time were included to account for interindividual baseline differences and variability in rates of cognitive change. Models included baseline sleep metrics, time (years since baseline), age, sex, education, and diagnostic group (presence of MCI). Sleep metrics were additionally modeled in interaction with time. Regression coefficients (β) represent expected changes in cognitive z-scores associated with one-unit differences in sleep parameters while accounting for longitudinal within-person change. Parameter estimates, 95% confidence intervals, and p-values were extracted from fitted models.
2.8. Exploratory Analyses of Non-Linear Sleep × Time Associations
To evaluate whether associations between sleep parameters and cognitive trajectories varied non-linearly over follow-up, exploratory linear mixed-effects models incorporating natural cubic splines (3 degrees of freedom) for time were fitted [12]. Models included interaction terms between each sleep exposure (treated as continuous) and spline-transformed time to assess potential non-linear sleep × time associations. Sleep exposures demonstrating evidence of non-linear interactions were further explored across empirically derived follow-up phases (early, middle, late) to facilitate interpretation of time-varying associations, and phase-specific estimates were derived to characterize how associations changed over follow-up.
To account for multiple testing in both cross-sectional and prospective analyses, p-values for the multivariable-adjusted associations were corrected using the Benjamini–Hochberg false discovery rate (FDR) procedure [36]. An FDR-adjusted p-value < 0.05 was considered statistically significant for the analyses of the six sleep metrics across the six cognitive domains [37], while a conventional p-value < 0.05 was used to define significance in all other analyses.
3. Results
3.1. Participants’ Characteristics
Among the 289 individuals initially assessed, 184 participants had valid wrist actigraphy data and were included in the present analyses (Table 1). Participants were predominantly women, with a mean age of 65.0 years. Mean educational attainment was 14.5 years (SD = 3.5), and the median follow-up duration was 1 year (IQR: 0–2). Overall, 47.8% of participants were classified as having MCI.
Table 1.
Characteristics of study participants in the total sample.
Data are presented as mean (SD) or as median (interquartile range) for continuous variables, and as n (%) for categorical variables. Data was missing and therefore sample and sizes were smaller for ZME (n = 181), ZEX (n = 178), ZVS (n = 181), ZLA (n = 180), ZAS (n = 180), ZCO (n = 181). Low * sleep variability indicates participants with variability less than 1.25 h, which corresponds to the median sleep variability in the sample. High * sleep variability indicates participants with variability greater than 1.25 h, which corresponds to the median sleep variability in the sample. Low ** sleep efficiency indicates participants with efficiency equal or less than 85%. High ** sleep efficiency indicates participants with efficiency more than 85%.
Average nightly sleep duration was 7.2 h (SD = 1.3), with 47.3% of participants sleeping 7–9 h, 44.0% sleeping less than 7 h, and 8.7% sleeping more than 9 h per night. Mean sleep variability was 1.47 h (SD = 0.86), with equal proportions classified as low and high variability. Mean sleep efficiency was 80.3% (SD = 9.2), with 69.6% of participants classified as having low sleep efficiency and 30.4% as having high sleep efficiency. Additional sleep parameters, including sleep onset latency, WASO, and number of nocturnal awakenings, are presented in Table 1.
Baseline characteristics stratified by cognitive status are presented in Table 2. Participants with MCI were older than cognitively healthy individuals (mean age 67.5 vs. 62.7 years, p < 0.001). Regarding sleep parameters, sleep efficiency was lower among participants with MCI compared to cognitively healthy individuals (p = 0.024). No statistically significant differences were observed for the remaining sleep parameters (all p > 0.05), nor for categorical sleep measures.
Table 2.
Baseline characteristics of participants stratified by cognitive status (Cognitively Healthy vs. Mild Cognitive Impairment.
Baseline differences between CH and MCI were evaluated using independent samples t-tests or Mann–Whitney tests for continuous variables, depending on normality assumptions, and χ2 or Fisher’s exact tests for categorical variables. Low * sleep variability indicates participants with variability less than 1.25 h, which corresponds to the median sleep variability in the sample. High * sleep variability indicates participants with variability greater than 1.25 h, which corresponds to the median sleep variability in the sample. Low ** sleep efficiency indicates participants with efficiency equal or less than 85%. High ** sleep efficiency indicates participants with efficiency more than 85%.
As expected, participants with MCI performed significantly worse across all cognitive domains, including memory, executive function, visuospatial ability, language, attention speed, and global cognition (all p < 0.001). As shown in Supplementary Table S1, participants with and without valid actigraphy data did not differ in age, sex, or MCI prevalence. However, participants with actigraphy data had higher years of education and differed in selected cognitive domains, including memory (ZME), language (ZLA), and global cognition (ZCO).
As shown in Supplementary Table S2, participants included in the longitudinal analyses had fewer years of education and were more likely to be women (p = 0.045) compared to those not included. They also had a lower prevalence of MCI (33.0% vs. 63.3%) and showed better performance in memory, while no statistically significant differences were observed for other cognitive domains.
3.2. Cross-Sectional Associations Between Baseline Sleep Measures and Cognitive Outcomes
Results from generalized linear models showed that specific sleep parameters were significantly associated with cognitive performance after multivariable adjustment (Table 3 and Table 4). In particular, a higher number of nocturnal awakenings was associated with poor performance in selected cognitive domains. Specifically, each additional awakening was associated with low performance in the memory domain (ZME; β = −0.009, 95% CI: −0.02 to −0.00, p = 0.032) and the attention speed domain (ZAS; β = −0.010, 95% CI: −0.02 to −0.00, p = 0.018) (Table 3).
Table 3.
Cross-sectional associations between continuous sleep measures and cognitive domain test z-scores in total sample.
Regression analysis was used with multivariable-adjusted β-coefficients (95% CI). The models adjusted for sex, age (years), and education (years). All models were estimated using generalized linear models (GLMs) with Gaussian (identity) distribution for all outcomes. FDR-controlled adjustments were conducted by applying the method of Benjamini and Hochberg. FDR represents false discovery rate. * A two-sided p-value < 0.05 was considered significant.
Table 4.
Cross-sectional associations between categorical sleep measures and cognitive domain test z-scores in total sample.
Regression analyses were performed using generalized linear models (GLMs) using multivariable-adjusted β-coefficients (95% CI). Model 1 adjusted for sex, age (years), and education (years). High * sleep variability indicates participants with variability more than 1.24 h, which corresponds to the median sleep variability in the sample. Low ** sleep efficiency indicates participants with efficiency equal or less than 85%. * A two-sided p-value < 0.05 was considered significant.
Higher sleep efficiency was associated with better language performance (ZLA) compared with low sleep efficiency. However, none of the cross-sectional associations remained statistically significant after correction for multiple testing.
3.3. Longitudinal Associations Between Sleep Measures and Cognitive Outcomes
Repeated cognitive assessments were available for 93 participants and were used to examine longitudinal changes in cognitive performance over time. During follow-up, several baseline sleep parameters were significantly associated with cognitive trajectories (Table 5 and Table 6). Specifically, higher baseline sleep efficiency was associated with better subsequent language performance over time and showed a nominal association with memory trajectories. In contrast, longer WASO and a greater number of nocturnal awakenings showed nominal associations with steeper decline in memory performance over follow-up; however, these associations did not remain statistically significant after FDR correction. Additionally, greater nocturnal awakenings and longer sleep onset latency showed nominal associations with less favorable language trajectories, while longer sleep onset latency also showed nominal associations with attention speed and global cognitive performance; these findings did not survive FDR correction.
Table 5.
Longitudinal associations of continuous sleep measures with cognitive domain z-scores.
Table 6.
Longitudinal associations of categorical sleep measures with cognitive domain z-scores.
Linear mixed-effects models with random intercepts and slopes for time were used to assess longitudinal associations between sleep parameters and cognitive domain z-scores. Time was modeled using natural cubic splines with three degrees of freedom to account for non-linear trajectories over follow-up. Only main effects of sleep variables are presented here. Models were adjusted for age, sex, education, and mild cognitive impairment (MCI) status. Reported are estimated regression coefficients (β) and 95% confidence intervals (CIs). False discovery rate (FDR) correction was applied using the Benjamini–Hochberg method. * A two-sided p-value < 0.05 was considered significant.
Additionally, participants with a higher number of nocturnal awakenings and longer sleep onset latency exhibited a faster decline in language function. Prolonged sleep onset latency was also significantly associated with poorer trajectories in attention speed and global cognitive performance.
3.4. Time-Varying Associations Between Sleep and Cognition
Several sleep characteristics showed time-dependent associations with cognitive outcomes. In spline-based longitudinal models, a higher number of nocturnal awakenings was associated with lower subsequent memory performance (ZME), with the first spline component showing a small but statistically significant negative association. Sleep duration was associated with longitudinal language trajectories (ZLA), with longer baseline sleep duration predicting poorer subsequent language performance over time, as captured by a statistically significant second spline component; however, these effects did not survive FDR correction (Table 7).
Table 7.
Sleep × time spline interaction p-values for longitudinal cognitive outcome.
We determined spline non-linear interaction effects between follow-up time and sleep exposures on cognitive outcomes. Estimates are adjusted for age, sex, education, and mild cognitive impairment (MCI) status. Reported are estimated regression coefficients (β) and 95% confidence intervals (CIs). False discovery rate (FDR) correction was applied using the Benjamini–Hochberg method. * A two-sided p-value < 0.05 was considered significant. Only exposures with significant non-linear interaction are shown.
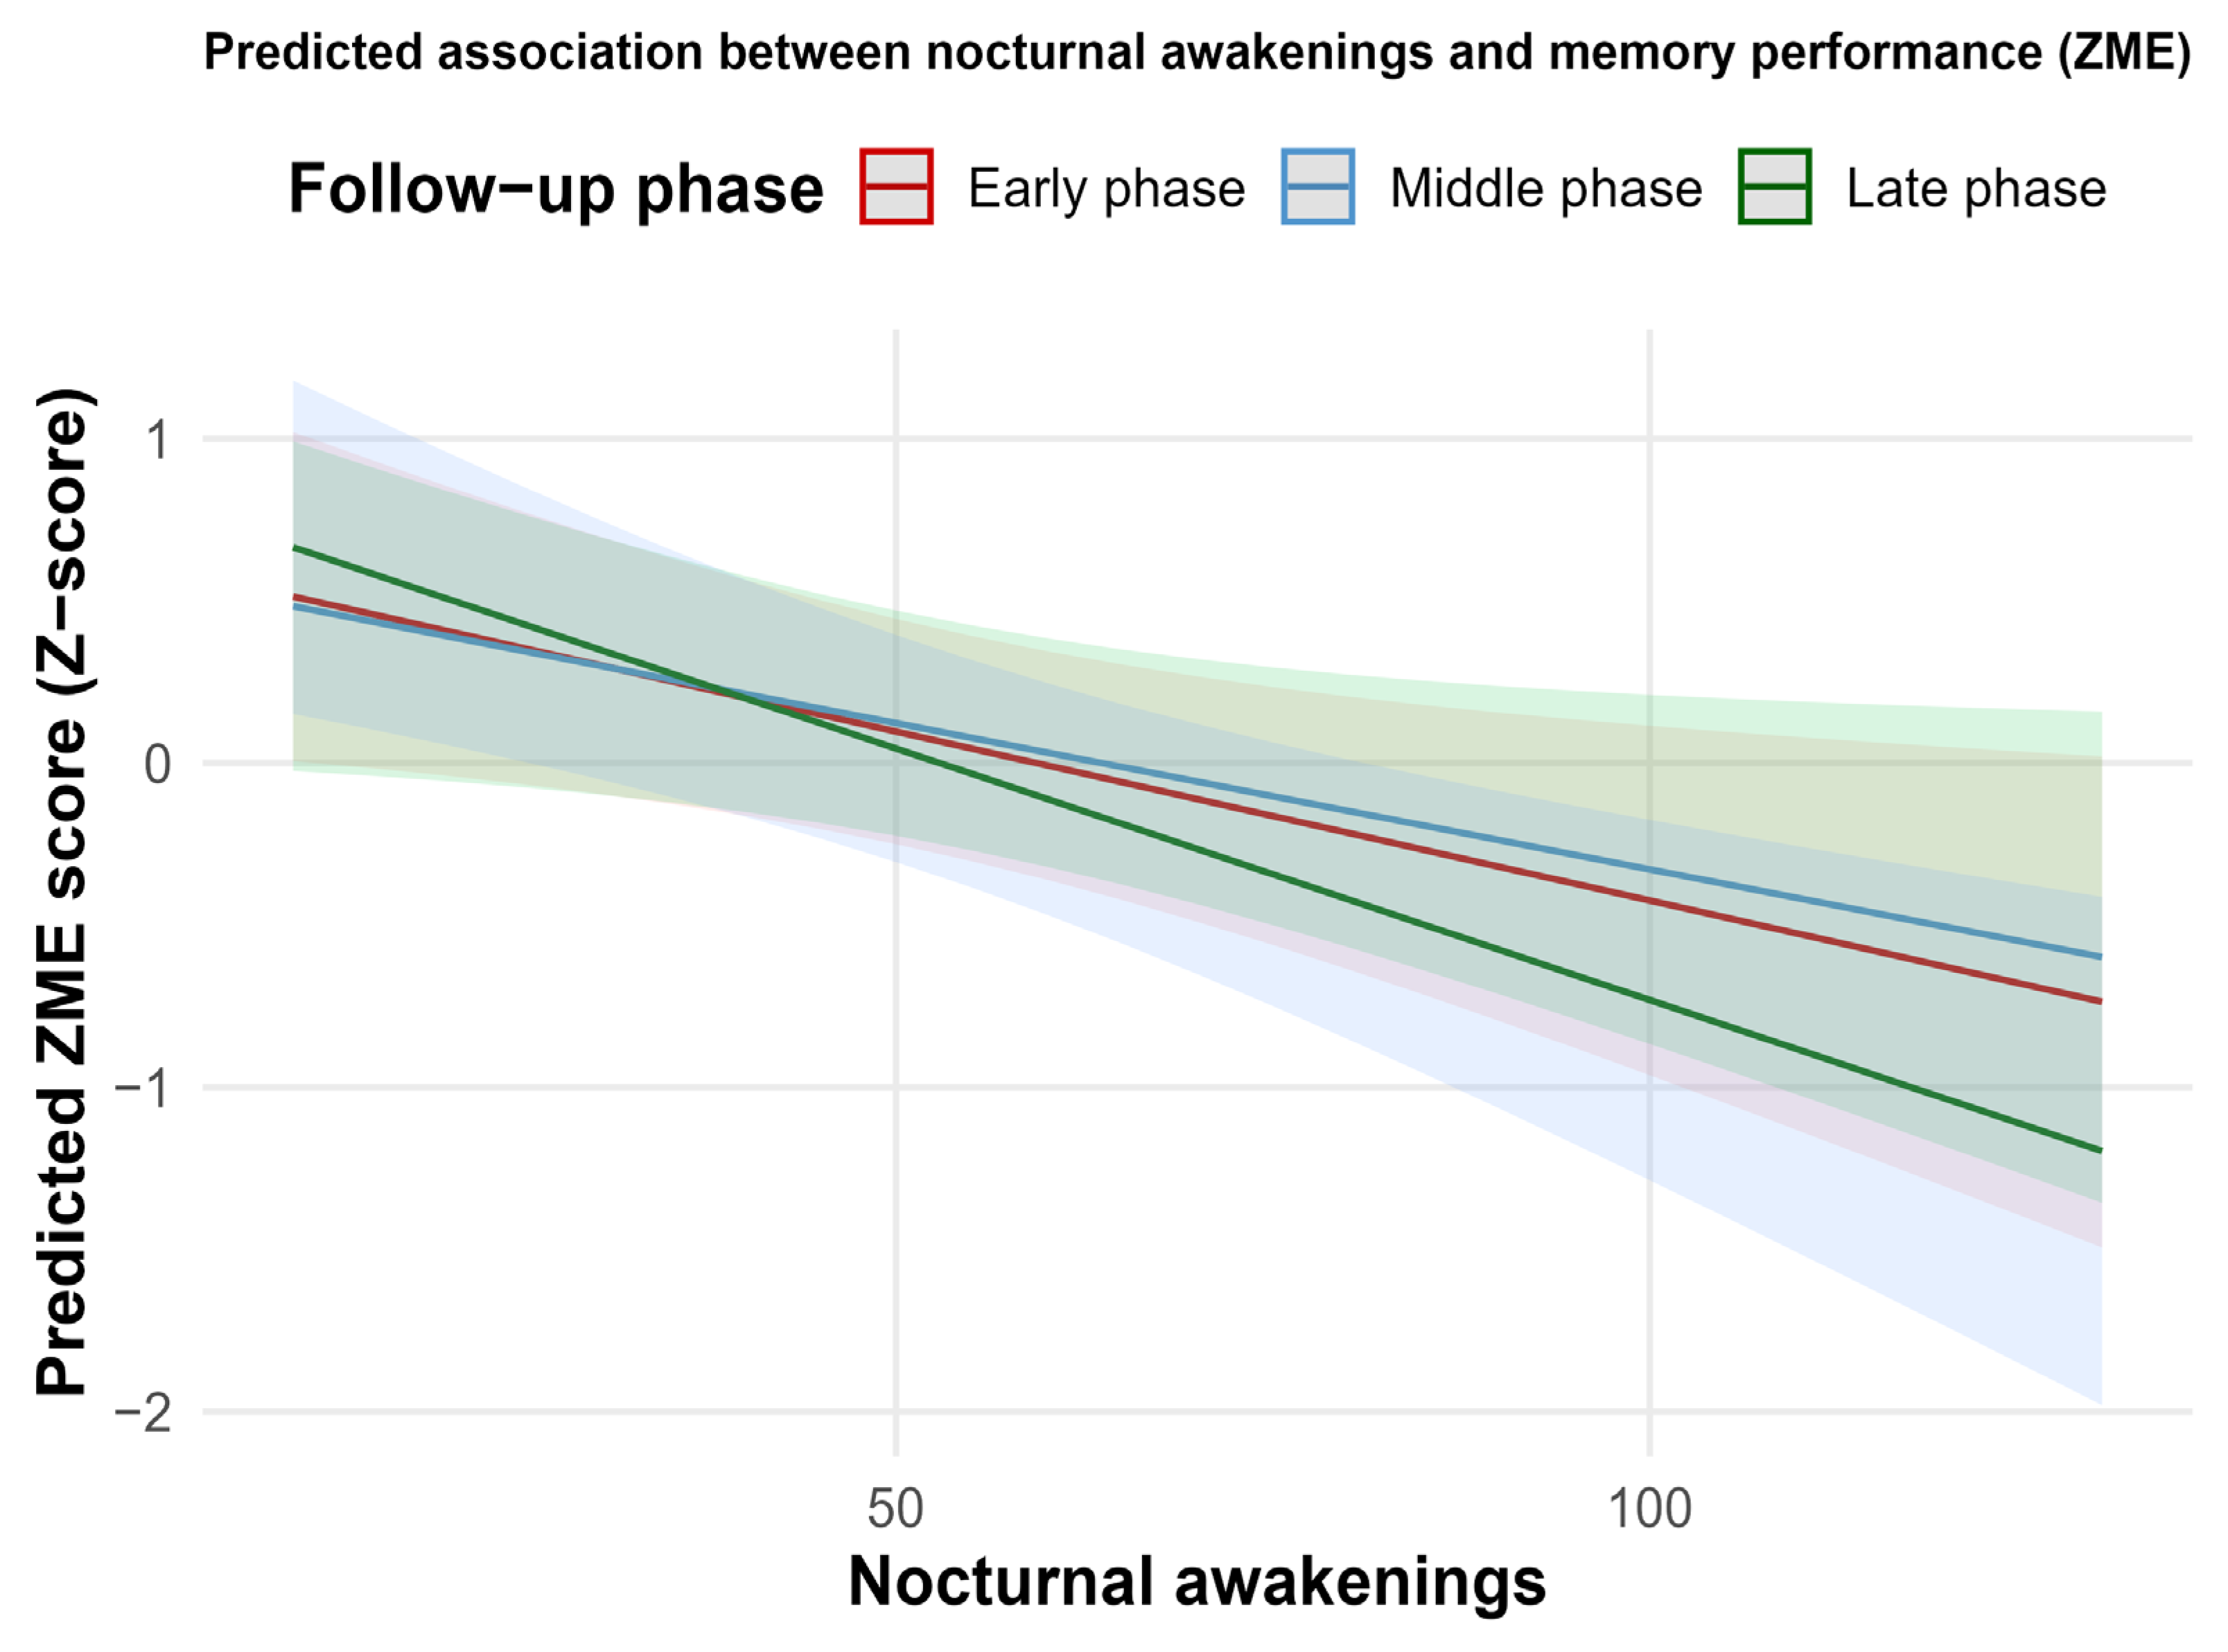
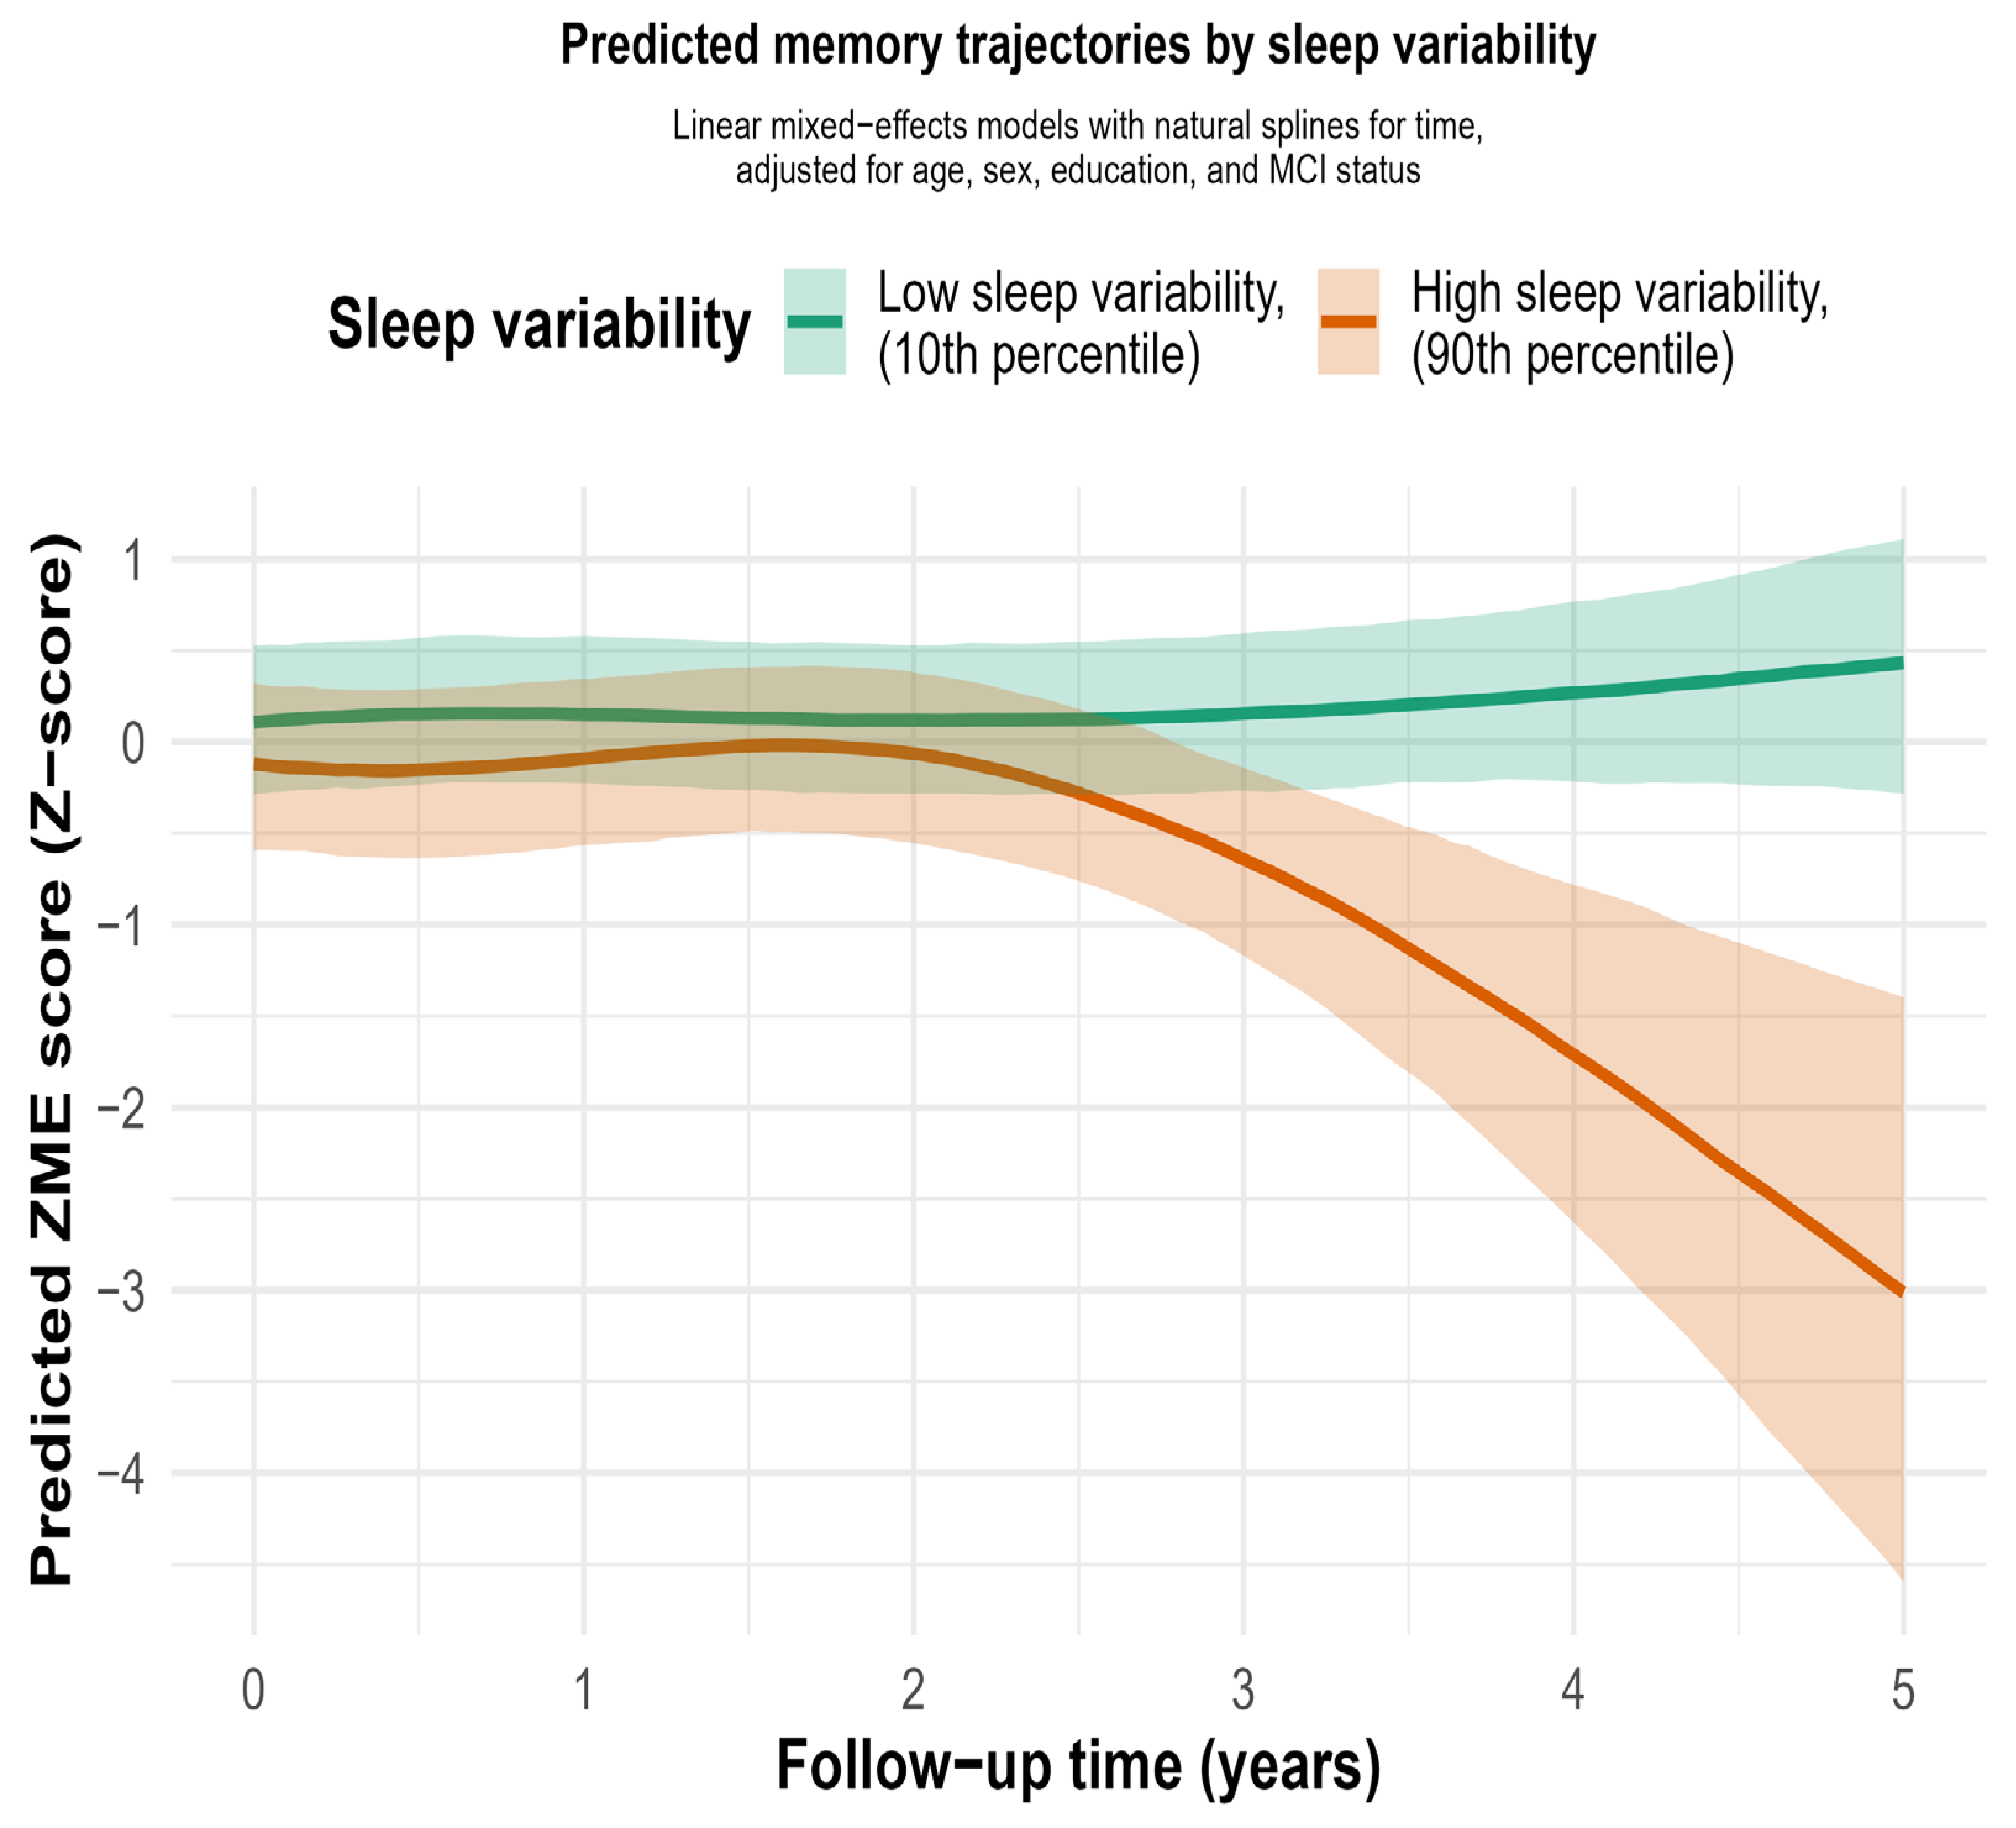
By contrast, sleep variability demonstrated consistent and robust associations with future memory performance. Both the second and third spline components were statistically significant (β = −0.813 and β = −1.379, respectively; both p < 0.001) and remained significant after FDR adjustment (Table 7). After categorizing follow-up time into tertiles, three approximately equal-sized time phases were defined: Early (n = 93), Middle (n = 92), and Late (n = 92). Phase-specific trend estimates (Table 8) indicated that a higher number of nocturnal awakenings was associated with poorer memory performance across all phases, with the strongest and statistically significant association observed in the late phase (trend = −0.015; 95% CI: −0.02 to −0.006). These trajectories are illustrated in Figure 2 and Figures S2–S5.
Table 8.
Phase-specific trends between sleep measures and cognitive outcomes derived from linear mixed-effects models.
Estimates are adjusted for age, sex, education, and mild cognitive impairment (MCI) status. Reported are estimated marginal trends derived from the fitted linear mixed-effects model using post-estimation procedures (emtrends), reflecting phase-specific sleep effects (β) and 95% confidence intervals (CIs). * A two-sided p-value < 0.05 was considered statistically significant. Only exposures with significant non-linear sleep × time interactions are presented. In Supplementary Tables S3–S8 we present all data including the non-significant associations.
Figure 2.
Predicted marginal effects from mixed-effects models showing the association between nocturnal awakenings and memory (ZME) across Early, Middle, and Late phases of follow-up. The association is consistently negative, with steeper declines observed in the late phase. Models were adjusted for age, sex, education, and MCI status. Shaded areas represent 95% confidence intervals.
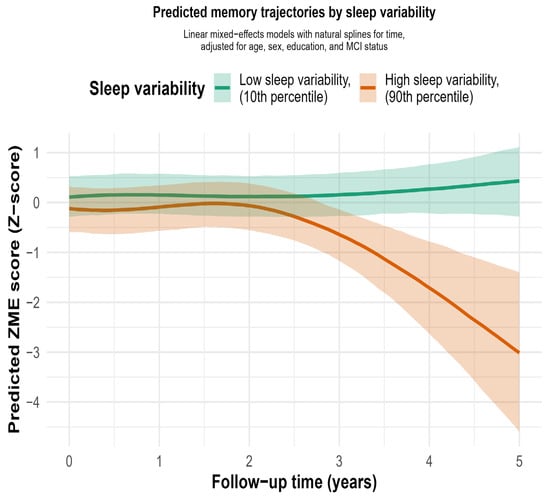
Similarly, higher sleep variability was progressively more strongly associated with poorer memory performance over follow-up. Associations were negative but non-significant in the early and middle phases, whereas in the late phase the association reached statistical significance (trend = −0.235; 95% CI: −0.45 to −0.02) (Table 8; Figure 3). No statistically significant phase-specific associations were observed between sleep duration and language performance.
Figure 3.
Predicted memory trajectories (ZME) over follow-up for participants with high (90th percentile) versus low (10th percentile) sleep variability, based on mixed-effects models adjusted for age, sex, education, and MCI status. Shaded areas represent 95% confidence intervals.
4. Discussion
In this study we leveraged objective, multi-night sleep assessment and a domain-specific neuropsychological battery to clarify how sleep relates to cognitive function in midlife and older age within the ALBION cohort. Cross-sectionally, most sleep metrics showed weak or null associations with cognitive performance after correction for multiple testing, consistent with the notion that single-time-point sleep assessments may be insufficient to capture the cumulative or dynamic influence of sleep on brain health. Nevertheless, markers of sleep fragmentation were associated with poor cognitive performance, with a higher number of nocturnal awakenings related to poor memory and attention speed. Importantly, these modest cross-sectional findings contrasted with clearer patterns observed in longitudinal analyses, underscoring the added value of repeated cognitive assessment for identifying sleep-related risk factors [38]. A key contribution of the present study lies in its longitudinal analyses, which provide insight beyond cross-sectional snapshots by capturing within-person cognitive change over time. These analyses included both cognitively healthy individuals and participants with mild cognitive impairment at baseline and were conducted in the combined sample, with baseline cognitive status included as a covariate. Within this framework, several baseline sleep characteristics, particularly those reflecting sleep continuity and regularity, were associated with subsequent cognitive trajectories, most consistently in the memory domain. Higher sleep efficiency was associated with more favorable language trajectories and showed nominal associations with memory performance. Similarly, longer wake after sleep onset, greater nocturnal awakenings, and longer sleep onset latency demonstrated nominal longitudinal associations with less favorable cognitive trajectories across memory, language, attention speed, and global cognition; however, these findings did not remain statistically significant after correction for multiple testing. Nevertheless, the consistent directionality of these associations across related sleep metrics, cognitive domains, and modeling approaches may suggest the presence of an underlying longitudinal signal rather than isolated chance findings [18,34].
Importantly, the strongest and most robust longitudinal finding concerned sleep variability. Greater night-to-night variability in sleep duration showed non-linear associations with worsening memory over follow-up and remained statistically significant after correction for multiple testing. Time-varying and phase-specific analyses further indicated that the adverse impact of sleep irregularity on memory became more apparent with longer follow-up. This pattern is consistent with a cumulative process, whereby sustained sleep irregularity gradually affects cognitive outcomes, rather than reflecting an acute or stage-specific effect. These findings extend prior work suggesting that irregular sleep patterns may influence cognitive aging through multiple interconnected biological pathways. Greater night-to-night sleep variability may reflect circadian rhythm instability, which has been associated with impaired synchronization of neural and metabolic processes supporting cognition [39]. Experimental and epidemiological evidence further suggest that fragmented or irregular sleep may contribute to impaired glymphatic clearance, increased neuroinflammatory signaling, and metabolic dysregulation, mechanisms increasingly implicated in hippocampal dysfunction and memory decline [23,24,25,26,27,28,29,30,31,32,35,36,37,38,40]. Given the role of stable sleep architecture in supporting memory processes, these pathways may help explain why sleep variability showed the strongest and most consistent association with memory trajectories in our study.
Overall, the present findings align with and extend previous longitudinal studies reporting associations between sleep fragmentation, poor sleep continuity, and accelerated cognitive decline, particularly in memory-related domains [40,41]. Prior studies using both subjective and objective sleep measures have similarly emphasized the importance of sleep regularity and continuity over average sleep duration and have suggested that fragmented or irregular sleep may precede and predict cognitive deterioration [42]. Notably, the inclusion of participants spanning midlife through older age allows the present study to capture sleep–cognition associations at earlier stages of cognitive aging, complementing prior work that has focused primarily on older populations [43]. Within this context, the current study adds novel evidence from objective, multi-night actigraphy and domain-specific cognitive trajectories in a well-characterized cohort.
Strengths of this study include objective sleep assessment over multiple nights, adjustment for relevant covariates, and the use of mixed-effects models that leveraged repeated cognitive assessments. In addition, correction for multiple testing was applied to reduce the likelihood of false-positive findings.
Several limitations should also be acknowledged. The longitudinal analytic sample was modest, which may have limited statistical power to detect smaller effects, particularly after correction for multiple testing, and constrained our ability to examine heterogeneity by cognitive status or other potential modifiers. The prospective analyses included a subset of participants with repeated cognitive assessments (n = 93), and participants retained longitudinally differed from those not included, including lower MCI prevalence and better baseline memory performance. This introduces the possibility of selection bias and may limit the generalizability of longitudinal findings. It is possible that participants retained over follow-up represent a healthier subgroup, potentially underestimating sleep–cognition associations observed in broader aging populations. Although actigraphy provides valid estimates of habitual sleep, it cannot fully characterize sleep architecture compared with polysomnography and may misclassify quiet wakefulness as sleep. Although models were adjusted for a range of relevant demographic and clinical covariates, residual confounding due to unmeasured or imperfectly measured factors cannot be fully excluded, as in all observational studies. Finally, follow-up duration was relatively short for some participants, which may have constrained the detection of longer-latency cognitive changes.
In summary, the present findings highlight sleep fragmentation and night-to-night irregularity as features that are consistently linked to memory-related cognitive aging. Across multiple longitudinal analyses, disrupted and irregular sleep showed consistent associations with memory trajectories, suggesting that these sleep characteristics may capture an underlying vulnerability relevant to cognitive decline. At the same time, the modest effect sizes and the attenuation of some associations after correction for multiple testing indicate that these results should be interpreted cautiously. Taken together, the findings should be viewed as hypothesis-generating and underscore the need for larger longitudinal studies with repeated sleep, cognitive, and biomarker assessments to clarify underlying mechanisms and to determine whether interventions aimed at improving sleep continuity and regularity may help preserve cognitive function with aging.
Supplementary Materials
The following supporting information can be downloaded at https://www.mdpi.com/article/10.3390/medsci14030340/s1. Figure S1. Directed acyclic graph illustrating the hypothesized rela-tionships between objective sleep characteristics, cognitive outcomes, and covariates considered for confounder adjustment; Figure S2. Predicted memory trajectories (ZME) over follow-up for participants with a high (90th percentile) versus low (10th percentile) number of nightly awakenings, based on mixed-effects models adjusted for age, sex, education, and MCI status; Figure S3. Predicted marginal effects from mixed-effects models illustrating phase-specific associations between sleep duration and language performance (ZLA) across Early, Middle, and Late follow-up phases; Figure S4. Predicted trajectories of language performance (ZLA) for participants with long sleep duration (90th percentile) versus short sleep duration (10th percentile), based on mixed-effects models adjusted for age, sex, education, and MCI status; Figure S5. Predicted marginal effects from mixed-effects models showing the association between sleep variability and memory (ZME) across Early, Middle, and Late follow-up phases; Table S1. Baseline characteristics of ALBION participants with valid actigraphy data vs participants without actigraphy data; Table S2. Baseline characteristics of participants with actigraphy data included and not included in longitudinal analyses; Table S3. Cross-sectional associations between continuous sleep measures and cognitive domain z-scores in the total sample; Table S4. Cross-sectional associations between categorical sleep measures and cognitive domain test z-scores in total sample; Table S5. Longitudinal associations of continuous sleep measures with cognitive domain z-scores; Table S6. Longitudinal associations of categorical sleep measures with cognitive domain z-scores; Τable S7. Sleep × time spline interaction p-values for longitudinal cognitive outcome; Τable S8. Phase-specific trends between sleep measures and cognitive outcomes derived from linear mixed-effects models.
Author Contributions
Conceptualization, A.T., C.P. and N.S.; methodology: A.T., A.M., E.P., E.N., E.M. (Eirini Mamalaki), E.M. (Elias Manolakos), M.Y. and C.P.; formal analysis: A.M.; writing—original draft: A.T., A.M., N.S. and C.P.; writing—review and editing: A.T., A.M. and C.P.; supervision: C.P. and N.S. All authors have read and agreed to the published version of the manuscript.
Funding
This project is carried out within the framework of the National Recovery and Resilience Plan Greece 2.0, funded by the European Union—NextGenerationEU (Implementation body: HFRI). (H.F.R.I. Project Number: 16472).
Institutional Review Board Statement
The study was conducted in accordance with the Declaration of Helsinki, and approved by the Institutional Review Board of Aiginition hospital (#255/10 May 2021).
Informed Consent Statement
Informed consent was obtained from all subjects involved in the study.
Data Availability Statement
The original contributions presented in this study are included in the article/Supplementary Material. Further inquiries can be directed to the corresponding author.
Conflicts of Interest
The authors declare no conflict of interest.
References
- Lo, J.C.; Groeger, J.A.; Cheng, G.H.; Dijk, D.J.; Chee, M.W.L. Self-reported sleep duration and cognitive performance in older adults: A systematic review and meta-analysis. Sleep Med. 2016, 17, 87–98. [Google Scholar] [CrossRef] [Scilit] [PubMed]
- Scullin, M.K.; Bliwise, D.L. Sleep, Cognition, and Normal Aging. Perspect. Psychol. Sci. 2015, 10, 97–137. [Google Scholar] [CrossRef] [Scilit] [PubMed]
- Tsapanou, A.; Gu, Y.; Manly, J.; Schupf, N.; Tang, M.X.; Zimmerman, M.; Scarmeas, N.; Stern, Y. Daytime Sleepiness and Sleep Inadequacy as Risk Factors for Dementia. Dement. Geriatr. Cogn. Disord. Extra 2015, 5, 286–295. [Google Scholar] [CrossRef] [Scilit]
- Tsapanou, A.; Scarmeas, N.; Stern, Y. Sleep and the aging brain. A multifaceted approach. Sleep Sci. 2020, 13, 152–156. [Google Scholar] [CrossRef] [Scilit] [PubMed]
- Dzierzewski, J.M.; Dautovich, N.; Ravyts, S. Sleep and Cognition in Older Adults. Sleep Med. Clin. 2018, 13, 93–106. [Google Scholar] [CrossRef] [Scilit] [PubMed]
- Tsapanou, A.; Vlachos, G.S.; Cosentino, S.; Gu, Y.; Manly, J.J.; Brickman, A.M.; Schupf, N.; Zimmerman, M.E.; Yannakoulia, M.; Kosmidis, M.H.; et al. Sleep and subjective cognitive decline in cognitively healthy elderly: Results from two cohorts. J. Sleep Res. 2018, 28, e12759. [Google Scholar] [CrossRef] [Scilit] [PubMed]
- Blackwell, T.; Yaffe, K.; Ancoli-Israel, S.; Redline, S.; Ensrud, K.E.; Stefanick, M.L.; Laffan, A.; Stone, K.L. Association of Sleep Characteristics and Cognition in Older Community-Dwelling Men: The MrOS Sleep Study. Sleep 2011, 34, 1347–1356. [Google Scholar] [CrossRef] [Scilit] [PubMed]
- Miyata, S.; Noda, A.; Iwamoto, K.; Kawano, N.; Okuda, M.; Ozaki, N. Poor sleep quality impairs cognitive performance in older adults. J. Sleep Res. 2013, 22, 535–541. [Google Scholar] [CrossRef] [Scilit] [PubMed]
- Muhammad, T.; Anil, S.; Sekher, T.V. Gender-specific associations between sleep quality, sleep duration and cognitive functioning among older Indians: Findings from WHO-SAGE study. Sleep Sci. Pract. 2024, 8, 6. [Google Scholar] [CrossRef] [Scilit]
- Yaffe, K.; Stone, K.L. Sleep-disordered breathing, hypoxia, and risk of mild cognitive impairment and dementia in older women. JAMA 2011, 306, 613–619. [Google Scholar] [CrossRef] [Scilit] [PubMed]
- Calfee, K.R.; Lee, S.; Andel, R. Multidimensional sleep health and cognitive function across adulthood. Sleep Health 2025, 11, 206–213. [Google Scholar] [CrossRef] [Scilit] [PubMed]
- Ma, Y.; Liang, L.; Zheng, F.; Shi, L.; Zhong, B.; Xie, W. Association Between Sleep Duration and Cognitive Decline. JAMA Netw. Open 2020, 3, e2013573. [Google Scholar] [CrossRef] [Scilit] [PubMed]
- Sen, A.; Tai, X.Y. Sleep Duration and Executive Function in Adults. Curr. Neurol. Neurosci. Rep. 2023, 23, 801–813. [Google Scholar] [CrossRef] [Scilit] [PubMed]
- Pase, M.P.; Himali, J.J.; Grima, N.A.; Beiser, A.S.; Satizabal, C.L.; Aparicio, H.J.; Thomas, R.J.; Gottlieb, D.J.; Auerbach, S.H.; Seshadri, S. Sleep architecture and the risk of incident dementia in the community. Neurology 2017, 89, 1244–1250. [Google Scholar] [CrossRef] [Scilit] [PubMed]
- Potvin, O.; Lorrain, D.; Forget, H.; Dubé, M.; Grenier, S.; Préville, M.; Hudon, C. Sleep Quality and 1-Year Incident Cognitive Impairment in Community-Dwelling Older Adults. Sleep 2012, 35, 491–499. [Google Scholar] [CrossRef] [Scilit] [PubMed]
- Zhang, J.; Ou, J.; Lu, X.; Wang, T.; Dang, W.; Ding, L.; Liu, Y.; Xu, J.; Yan, B.; Yu, H. Sleep Disorders and the Risk of Cognitive Decline or Dementia: An Updated Systematic Review and Meta-Analysis of Longitudinal Studies. J. Neurol. 2025, 272, 689. [Google Scholar] [CrossRef] [Scilit] [PubMed]
- Landry, G.J.; Best, J.R.; Liu-Ambrose, T. Measuring sleep quality in older adults: A comparison using subjective and objective methods. Front. Aging Neurosci. 2015, 7, 166. [Google Scholar] [CrossRef] [Scilit] [PubMed]
- Lim, A.S.P.; Kowgier, M.; Yu, L.; Buchman, A.S.; Bennett, D.A. Sleep Fragmentation and the Risk of Incident Alzheimer’s Disease and Cognitive Decline in Older Persons. Sleep 2013, 36, 1027–1032. [Google Scholar] [CrossRef] [Scilit] [PubMed]
- Sakal, C.; Li, T.; Li, J.; Yang, C.; Li, X. Association Between Sleep Efficiency Variability and Cognition Among Older Adults: Cross-Sectional Accelerometer Study. JMIR Aging 2024, 7, e54353. [Google Scholar] [CrossRef] [Scilit] [PubMed]
- Wallace, M.L.; Lee, S.; Stone, K.L.; Hall, M.H.; Smagula, S.F.; Redline, S.; Ensrud, K.E.; Ancoli-Israel, S.; Buysse, D.J. Actigraphy-derived sleep health profiles and mortality in older men and women. Sleep 2022, 45, zsac015. [Google Scholar] [CrossRef] [Scilit] [PubMed]
- Barlattani, T.; Dalila De, L.; Giambartolomei, S.; Bologna, A.; Innocenzi, A.; Bruno, F.; Socci, V.; Malavolta, M.; Rossi, A.; de Berardis, D.; et al. Glymphatic system dysfunction in young adults hospitalized for an acute psychotic episode: A preliminary report from a pilot study. Front. Psychiatry 2025, 16, 1653144. [Google Scholar] [CrossRef] [Scilit] [PubMed]
- Hyndych, A.; El-Abassi, R.; Mader, E.C. The Role of Sleep and the Effects of Sleep Loss on Cognitive, Affective, and Behavioral Processes. Cureus 2025, 17, e84232. [Google Scholar] [CrossRef] [Scilit] [PubMed]
- Potter, G.D.M.; Skene, D.J.; Arendt, J.; Cade, J.E.; Grant, P.J.; Hardie, L.J. Circadian Rhythm and Sleep Disruption: Causes, Metabolic Consequences, and Countermeasures. Endocr. Rev. 2016, 37, 584–608. [Google Scholar] [CrossRef] [Scilit] [PubMed]
- Negelspach, D.; Kennedy, K.E.R.; Huskey, A.; Cha, J.; Alkozei, A.; Killgore, W.D.S. Mapping the Neural Basis of Wake Onset Regularity and Its Effects on Sleep Quality and Positive Affect. Clocks Sleep 2025, 7, 15. [Google Scholar] [CrossRef] [Scilit] [PubMed]
- Kalligerou, F.; Ntanasi, E.; Voskou, P.; Velonakis, G.; Karavasilis, E.; Mamalaki, A.; Kyrozis, E.; Sigala, E.; Economou, N.T.; Patas, K.; et al. Aiginition Longitudinal Biomarker Investigation Of Neurodegeneration (ALBION): Study design, cohort description, and preliminary data. Postgrad. Med. 2019, 131, 501–508. [Google Scholar] [CrossRef] [Scilit] [PubMed]
- Scarmeas, N.; Dalaskalaki, A.; Kalligerou, F.; Ntanasi, E.; Mamalaki, E.; Gargalionis, A.N.; Patas, K.; Chatzipanagiotou, S.; Yannakoulia, M.; Constantinides, V.C. Initial Data and a Clinical Diagnosis Transition for the Aiginition Longitudinal Biomarker Investigation of Neurodegeneration (ALBION) Study. Medicina 2022, 58, 1179. [Google Scholar] [CrossRef] [Scilit] [PubMed]
- American Psychiatric Association. Diagnostic and Statistical Manual of Mental Disorders: DSM-IV-TR, 4th ed.; Text Revision; American Psychiatric Association: Washington, DC, USA, 2000. [Google Scholar]
- McKhann, G.; Drachman, D.; Folstein, M.; Katzman, R.; Price, D.; Stadlan, E.M. Clinical Diagnosis of Alzheimer’s Disease: Report of the NINCDS-ADRDA Work Group* under the Auspices of Department of Health and Human Services Task Force on Alzheimer’s Disease. Neurology 1984, 34, 939. [Google Scholar] [CrossRef] [Scilit] [PubMed]
- Ancoli-Israel, S.; Cole, R.; Alessi, C.; Chambers, M.; Moorcroft, W.; Pollak, C.P. The Role of Actigraphy in the Study of Sleep and Circadian Rhythms. Sleep 2003, 26, 342–392. [Google Scholar] [CrossRef] [Scilit] [PubMed]
- Fekedulegn, D.; Andrew, M.E.; Shi, M.; Violanti, J.M.; Knox, S.; Innes, K.E. Actigraphy-Based Assessment of Sleep Parameters. Ann. Work Expo. Health 2020, 64, 350–367. [Google Scholar] [CrossRef] [Scilit] [PubMed]
- Watson, N.F.; Badr, M.S. Recommended amount of sleep for a healthy adult: A joint consensus statement of the american academy of sleep medicine and sleep research society. Sleep 2015, 38, 843–844. [Google Scholar] [CrossRef] [Scilit] [PubMed]
- Teräs, T.; Myllyntausta, S.; Salminen, M.; Viikari, L.; Pahkala, K.; Muranen, O.; Hutri-Kähönen, N.; Raitakari, O.; Rovio, S.; Stenholm, S. The association of previous night’s sleep duration with cognitive function among older adults: A pooled analysis of three Finnish cohorts. Eur. J. Ageing 2023, 20, 32. [Google Scholar] [CrossRef] [Scilit] [PubMed]
- Hoopes, E.K.; Berube, F.R.; D’Agata, M.N.; Patterson, F.; Farquhar, W.B.; Edwards, D.G.; Witman, M.A.H. Sleep duration regularity, but not sleep duration, is associated with microvascular function in college students. Sleep 2020, 44, zsaa175. [Google Scholar] [CrossRef] [Scilit]
- Qin, S.; Leong, R.L.F.; Ong, J.L.; Chee, M.W.L. Associations between objectively measured sleep parameters and cognition in healthy older adults: A meta-analysis. Sleep Med. Rev. 2023, 67, 101734. [Google Scholar] [CrossRef] [Scilit] [PubMed]
- Stekhoven, D.J.; Buhlmann, P. MissForest--Non-Parametric Missing Value Imputation for Mixed-Type Data. Bioinformatics 2011, 28, 112–118. [Google Scholar] [CrossRef] [Scilit] [PubMed]
- Benjamini, Y.; Hochberg, Y. Controlling the false discovery rate: A practical and powerful approach to multiple testing. J. R. Stat. Soc. Ser. B (Methodol.) 1995, 57, 289–300. [Google Scholar] [CrossRef] [Scilit]
- Ferrie, J.E.; Shipley, M.J.; Akbaraly, T.N.; Marmot, M.G.; Kivimäki, M.; Singh-Manoux, A. Change in sleep duration and cognitive function: Findings from the Whitehall II Study. Sleep 2011, 34, 565–573. [Google Scholar] [CrossRef] [Scilit] [PubMed]
- Li, X.; Cui, L.; Wang, F.; Schulz, P.E.; Zhang, G.Q. Identifying Sleep-Related Factors Associated with Cognitive Function in a Hispanics/Latinos Cohort: A Dual Random Forest Approach. AMIA Annu. Symp. Proc. 2022, 2021, 744–753. [Google Scholar]
- Meyer, N.; Harvey, A.G.; Lockley, S.W.; Dijk, D.J. Circadian rhythms and disorders of the timing of sleep. Lancet 2022, 400, 1061–1078. [Google Scholar] [CrossRef] [Scilit] [PubMed]
- Feng, F.; Cai, Z.; Chen, J.; Yang, D.; Huang, N.; Luo, Y.; Cai, Z.; Chen, J. U shaped association between sleep duration and long term cognitive decline trajectories in a national cohort. Sci. Rep. 2025, 15, 39767. [Google Scholar] [CrossRef] [Scilit] [PubMed]
- Jon Arild, A.; Aakre, J.A.; Schulz, J.; Ballard, C.; Corbett, A.; Bjorvatn, B.; Aarsland, D.; Creese, B.; Hampshire, A.; Brooker, H.; et al. Self-reported sleep fragmentation and sleep duration and their association with cognitive function in PROTECT, a large digital community-based cohort of people over 50. Int. J. Geriatr. Psychiatry 2023, 38, e6022. [Google Scholar] [CrossRef] [Scilit]
- André, C.; Tomadesso, C.; de Flores, R.; Branger, P.; Rehel, S.; Mézenge, F.; Landeau, B.; de la Sayette, V.; Eustache, F.; Chételat, G.; et al. Brain and cognitive correlates of sleep fragmentation in elderly subjects with and without cognitive deficits. Alzheimer’s Dement. Diagn. Assess. Dis. Monit. 2019, 11, 142–150. [Google Scholar] [CrossRef] [Scilit]
- Ni, Y.; Yu, M.; Liu, C. Sleep disturbance and cognition in the elderly: A narrative review. Anesthesiol. Perioper. Sci. 2024, 2, 26. [Google Scholar] [CrossRef] [Scilit]

Disclaimer/Publisher’s Note: The statements, opinions and data contained in all publications are solely those of the individual author(s) and contributor(s) and not of MDPI and/or the editor(s). MDPI and/or the editor(s) disclaim responsibility for any injury to people or property resulting from any ideas, methods, instructions or products referred to in the content. |
© 2026 by the authors. Licensee MDPI, Basel, Switzerland. This article is an open access article distributed under the terms and conditions of the Creative Commons Attribution (CC BY) license.