Rock Glacier Kinematics in the Kaunertal, Ötztal Alps, Austria


Department of Geography, University of Bonn, 53115 Bonn, Germany
*
Author to whom correspondence should be addressed.
Geosciences 2019, 9(9), 373; https://doi.org/10.3390/geosciences9090373
Submission received: 29 June 2019
/
Revised: 15 August 2019
/
Accepted: 23 August 2019
/
Published: 28 August 2019
(This article belongs to the Special Issue Capture the Process! Dynamic Approaches in Geomorphology, Hydrology and Soil Physics)
Abstract
:The quantification of rock glacier kinematics on a regional basis has gained increasing importance in recent years. Here, we applied an image tracking approach on high-resolution aerial imagery to infer surface kinematics of 129 mapped rock glaciers in the Kaunertal, Austrian Alps. We find significant surface movement for 30 features with mean velocities falling between 0.11 and 0.29 m yr−1 and a maximum of 1.7 m yr−1. Local analysis and comparison to earlier studies reveals significant increases in rock glacier velocities in the study area. From the rock glacier inventory and high-resolution digital topography, we computed a series of morphometric parameters to analyze potential controls on rock glacier creep and to predict rock glacier activity using random forests and logistic regression models. The results point towards a stronger dependence of velocities on parameters describing general inclination, potentially acting as proxies for internal rock glacier properties, while activity states seem to be regulated mainly by rock glacier dimensions and topoclimate. Using a parameter subset, we successfully separated active from inactive rock glaciers with accuracies of up to 77.5%, indicating a promising approach to predict rock glacier activity solely relying on parameters that can be derived from regionally available data sets.
1. Introduction
Rock glaciers are globally prevalent features of creeping permafrost in the periglacial zones of high-latitude and high-altitude environments. Commonly, rock glaciers are described as lobate or tongue-shaped landforms containing composites of ice-rich sediments that move downslope in a creeping behavior under the effects of gravitational deformation [1]. As rock glaciers have been described both from a perspective of periglacial origin [2,3] and glacial origin [4], discussion on this issue has brought forth a range of genetic and morphological rock glacier definitions over the past few decades. Following an elaborate reflection on contrasting positions, Berthling (2011) [5] offers a universally applicable definition integrating both the influence of periglacial conditions on rock glacier creep behavior and the acknowledgement of different modes of origin. Berthling (2011) [5] defines active rock glaciers concisely as the “visible expression of cumulative deformation by long-term creep of ice-debris mixtures under permafrost conditions” [5]. In spite of the difficulties presented in finding a consistent definition of rock glaciers, their occurrence has been observed and documented globally in various high-latitude and high-altitude locations [2,3,6,7,8].
The basic principle behind the deformation inherent to permafrost bodies within rock glaciers is gravity-driven creep of the supersaturated debris-ice mixture. The majority of studies investigating rock glacier kinematics have, therefore, described their long-term steady-state creep by a viscous deformation law [2,3,9], following the observations by Glen (1955) [10] on the behavior of polycrystalline ice. These model assumptions were supported by several lab tests on the behavior of ice and debris-ice mixtures under varying stress and thermal conditions [11,12], and a handful of borehole deformation experiments on rock glaciers [13]. This rather simple model explains deformation rates mainly as a function of surface slope, thickness of the permafrost body, material density, and ice temperatures within the rock glacier. Further investigations, however, suspected much more complicated rheological modes, e.g., for warm permafrost temperatures [12,14], and potentially non-linear slope-dependencies in steep terrain with an increased likelihood of gelifluction and sliding processes [15]. Additionally, the effects of liquid water in shear horizons and at the permafrost base have been emphasized in multiple studies [16,17,18].
Commonly, a distinction is made between actively moving, inactive and relict (fossil) rock glaciers [19]. As intact rock glaciers, inactive features still contain interstitial (and excess) ice but show no signs of movement [20], which is limited either climatically or topographically [21]. The term intact comprises both active and inactive states. In relict rock glaciers, the ice is assumed to have melted out entirely, leaving behind a collapsed debris landform subject to erosional processes and vegetation succession [19]. Actively moving rock glaciers are a clear indication for permafrost conditions in high-altitude environments. Inactive rock glaciers might already have moved outside of permafrost conditions, bringing their movement to a halt.
The discrimination between different states of activity is complicated by continuous transitions during the landform evolution [22]. Therefore, solely relying on visual interpretations of surface morphology jeopardises classification accuracy and multi-temporal investigations of rock glacier evolution are necessary to draw decisive conclusions. This is why, in recent decades, the study of rock glacier kinematics has increasingly gained interest in high-alpine research [23,24,25,26,27,28]. Methodological approaches to assess rock glacier kinematics span a range of terrestrial methods (e.g., GPS surveys, geodetic analyses or terrestrial laser scanning approaches [26,27,28,29]) and remote sensing methods (e.g., photogrammetry or InSAR [30,31,32,33,34]). Most studies deploy a multi-methodological approach, combining a number of terrestrial and remote sensing systems [35,36].
Close monitoring of rock glacier kinematics is key to a comprehensive assessment of the landform’s intrinsic processes and temporal evolution [37]. The rationale behind the investigations of rock glaciers is manifold: First, rock glaciers have been primarily studied as sensitive indicators for changes in ground temperatures due to the presence of permafrost. As rock glaciers are a common local proxy for lower limits of the distribution of discontinuous permafrost [38], information on their activity and kinematics can aid in understanding past, present, and future climate changes. Second, various studies published during the last decades attribute significant hydrological importance to their groundwater stores [39]. The insulating and damping properties of their debris cover make rock glaciers more resilient to changes in atmospheric conditions than their bare counterparts and potentially maintain these stores for a long time [39,40]. Furthermore, rock glaciers act as efficient sediment sinks and debris transport systems in high mountain sediment cascades [41,42,43] and provide direct evidence on permafrost degradation and related instabilities in debris-covered mountain slopes [17].
Therefore, the state of mountain permafrost has gained increasing attention in the debate focusing on climate change impacts in high-mountain regions. In this respect, rock glaciers have taken center stage, with many studies revolving around the quantification of rock glacier kinematics and their state of activity in high spatio-temporal resolution. What might control rock glacier activity and determine surface movement on a regional scale, however, has so far escaped scientific inquiry.
In this study, we investigate 129 rock glaciers in the Kaunertal in the Ötztal Alps of Western Austria. We aim to capture their surface kinematics and determine their state of activity using a motion-tracking approach on freely available aerial imagery. Using this data, we seek to identify potential controls on rock glacier activity and velocity from a series of geometric, topoclimatic and terrain parameters that were derived from digital topography. Using qualitative observations and data collected at one field site, we further shed light on permafrost degradation in the study area.
2. Study Area
Our regional survey is set in the Kaunertal, Austria; a central Alpine valley, characterized by a high density of intact rock glaciers (Figure 1) [20]. Forming part of the Ötztal Alps, the valley is drained by the river Fagge and covers a total surface area of 227.8 km2, of which 9.1% (20.7 km2) are glaciated [44]. According to model calculations by Boeckli et al. (2012) [45], between ~33.9 and ~95.1 km2 of the catchment area are underlain by permafrost in nearly all conditions and only in very favorable conditions, respectively. The study area is characterized by a typical dry high-alpine climate. At Weißsee meteorological station (2470 m a.s.l.), a mean annual air temperature (MAAT) of −0.17 °C and mean annual precipitation of 1000 mm to 1300 mm are recorded (2007–2018; data courtesy of Tiroler Wasserkraft AG (TIWAG)). Depending on elevation and aspect, winter snow cover can span a period from October to June. The catchment is located in the crystalline zone (‘Altkristallin’) of the Eastern European Alps, where the Austroalpine nappes are primarily made up of metamorphic rock. Paragneiss and orthogneiss are dominant, but amphibolite and mica-schist can be found sporadically [20,46]. The north-south oriented valley is characterized by a high topographic relief of more than 2500 m, covering an elevation range from 870 m a.s.l. at its outlet to 3535 m a.s.l. at the Hochvernagtspitze within a distance of around 30 km. More than 50% of the catchment is at elevations above the tree line (~2250 m a.s.l. [47]), where rugged bedrock topography and unconsolidated sediments in the form of talus slopes, moraines and rock glaciers dominate the landscape [48].
A recently updated inventory comprises 129 rock glaciers [49], covering a total surface area of 8.25 km2 equivalent to 3.6% of the total catchment size. The distribution of intact rock glaciers in the valley suggests permafrost occurrence reaches down to around 2270 m a.s.l. in favorable conditions on northern exposed slopes. The catchment features both ice-cemented rock glaciers [50] and rock glaciers with a core of massive ice of glacial origin [51]. Three of the valley’s rock glaciers, Innere Ölgrube, Kaiserberg, and Riffeltal, have been the subject of earlier studies [50,51,52,53].
3. Materials and Methods
3.1. Rock Glacier Inventory
The creation of a standardized rock glacier inventory of Austria is still in progress, but many regional inventories are available [20,38,54,55]. We utilize a subset from an inventory of rock glacier polygons in Tyrol, as updated and compiled by Wagner et al. (in press) [49] from the results of previous studies. For this inventory, rock glaciers were delineated by identification of creep-related morphological characteristics in shaded high-resolution digital elevation models (DEMs) and aerial images. The inventory for the Kaunertal contains 129 rock glaciers, of which 104 have been classified as intact (6.96 km2), while the remaining 25 can be considered as relict (1.29 km2) (Figure 1). We acknowledge that rock glaciers classified as relict based on morphology alone may still contain substantial amounts of ice remains, as found in previous studies [21], and in-situ investigations are often necessary to provide reliable assessments. We relied on the outlines of intact rock glaciers to identify the regions of interest for our kinematic analysis. Where necessary, we corrected rock glacier outlines for alignment inaccuracies with the aerial imagery used here and for inventory creation.
3.2. Determining Horizontal Surface Movement Using Least Squares Matching
Environmental Motion Tracking (EMT) is a feature tracking software developed by Schwalbe [56] that uses a least squares matching approach (LSM) to track image features over monoscopic image sequences. LSM matches the location of image patches, i.e., rectangular windows, by minimizing the sum of squares of grey-value differences between image pairs [57]. Image patches are shifted in an iterative process around initially identified object points in a pre-defined search window (for details, see [58]). Additional radiometric and geometric matching techniques allow reducing distortions, such as illumination changes and slope deformations [59]. Algorithms like LSM have received increased attention in the study of surface deformation and mass movements due to the low financial expenses required, and the ability to monitor poorly accessible terrain by using unmanned aerial vehicles (UAV) or satellite imagery [59].
Here, EMT was utilized to track horizontal surface displacements of rock glaciers in image sequences of 4 (resp. 5) orthophotos with 0.2 m ground resolution (Table 1), acquired between 2001 and 2015 and made available by the government of Tyrol (Land Tirol). This data set was augmented by an unmanned aerial vehicle (UAV) flight campaign in 2018 at one field location to extend the observation period. Object points for tracking were regularly spaced within the rock glacier boundaries based on a 5 m grid. Image patch size was set to 100 × 100 pixels (400 m2), search window sizes were adapted individually. For further improvement of positional accuracies between images, mainly influenced by the quality of available DEMs for orthorectification of individual images, EMT includes additional algorithms to track fix point locations, i.e., stable points outside the moving features, alongside with the object points. Affine image transformations are then computed from potential fix point mismatches and used to correct tracked object point trajectories, ideally resulting in sub-pixel accuracies between image pairs [58]. Here, we placed fix points manually in surrounding stationary areas, mainly on exposed bedrock surfaces, where significant surface motion is unlikely (Figure S2). The accuracy of the motion correction was assessed by tracking an independent set of point locations on stable ground, correcting for mismatches between subsequent orthophotos using affine image transformation and quantifying the remaining residuals. These then served as a level of detection (LoD) measure (Table S1).
To reduce potential errors from matching image patches using EMT, we applied several neighborhood filters on the resulting object point trajectories. A combination of displacement bearing and magnitude filters around object points provided satisfying tools for error removal while keeping a maximum amount of information per feature. Circular variance for a number of unit vectors with bearings , , … is given by:
where is the length of the resultant vector, calculated by:
Equations (2) and (3) were implemented using a 3 × 3 neighborhood filter with an arbitrary threshold set to 0.5. Additionally, deviations from the mean bearing exceeding 45° in a 5 × 5 neighborhood were discarded. Deviations were calculated by:
in which is the bearing at the focal point, and the mean bearing is given by:
Similarly, deviations from mean velocities in a 5 × 5 neighborhood were used to exclude erroneous trajectories. On average, around 75% of tracked object points on active rock glaciers provided consistent velocity estimates after filtering for errors.
From these, annual rates of displacements were calculated using the exact acquisition dates of aerial imagery for both, origin and endpoint of each trajectory, yielding time series of rock glacier velocities resolved at one- to five-year intervals. However, as acquisition dates of the aerial imagery show high inter-annual differences (Table 1), annual displacement rates were finally calculated over the entire observed period, i.e., from 2001 resp. 2003 to 2015. This allows for a more robust averaging of velocities and circumvents skewed estimates owed to large differences in epoch lengths.
3.3. Statistical Analysis of Kinematics-Morphometry Relations
We computed a series of candidate parameters to evaluate their potential relationships to rock glacier activity and surface kinematics. The selection of parameters was guided by an extensive review of previous studies on rock glacier kinematics that found potential influences and associations from field observations and/or lab experiments (Table 2, Figure 2). Calculation of candidate parameters is based on rock glacier polygons and a LiDAR DEM with 5 m ground resolution, acquired in 2010 and made available by the government of Tyrol (Land Tirol). From this DEM, we also extracted statistics for the rock glacier feeder basin and headwall area, which we define here as the contributing area delivering water, snow and debris to the rock glacier, and the subset of this (i.e., headwall) having inclinations exceeding 30°, respectively (Figure 2). For this calculation, all pixels above the 25th elevation percentile within each rock glacier polygon were used as pour points. Following Heim (1932) [60], we define the slope of the line between the highest point of this source rock wall to the distal margin of the rock glacier body as the geometric slope (ΦGSL).
Assessment of morphometric controls on horizontal surface velocities was carried out using iteratively reweighted least squares (IRLS) regressions with a bisquare weight function. IRLS is a robust regression technique, iteratively adjusting weights in heteroscedastic data to reduce the influence of outliers [61]. Herein, we investigated linkages to various velocity ranges per rock glacier using percentiles of the measured values (25th, 50th, 75th, and 95th percentiles as well as absolute maximum velocities).

Table 2.
Potential geometric, morphometric and topoclimatic parameters controlling rock glacier activity and surface velocities. All parameters are derived from a 5 m digital elevation model (DEM) and the polygon-based rock glacier inventory (RGI).
Table 2.
Potential geometric, morphometric and topoclimatic parameters controlling rock glacier activity and surface velocities. All parameters are derived from a 5 m digital elevation model (DEM) and the polygon-based rock glacier inventory (RGI).
| Group | Parameter | Abbreviation | Unit | Source | Association | References |
|---|---|---|---|---|---|---|
| Geometry | Length 1 * † | LRG | m | RGI | Age | [62] |
| Width 1 * † | WRG | m | RGI | Thickening/thinning | [63] | |
| Surface Area 2 * | ARG | km2 | DEM RGI | Yield stresses | ||
| Height * † | HRG | m | DEM | |||
| Riser height 1 * † | HF | m | DEM | Thickness | [64,65] | |
| Morphology | Surface slope * † | ΦRG | ° | DEM | Shear stress PISR Snow distribution | [64] |
| Profile curvature * † Plan curvature * † | − | Compression/extension Subsidence Runoff characteristics | [3,22,66] | |||
| Surface roughness 3 | − | Grain size distribution | [65,67] | |||
| Terrain | Max. elevation Min. elevation * † | Emin Emax | m a.s.l. | DEM | MAAT Permafrost distribution Potential energy | [68,69,70] |
| N-exposedness 4 E-exposedness 4 * | − | Radiation Age Snow distribution | [71,72] | |||
| Mean PISR * † | kWh m−2 yr-1 | MAGST | [69,70,73] | |||
| Feeder basin | Height * | HFB | m | DEM 5 | Liquid water supply Snow & avalanche input | [62] |
| Area 2 * | AFB | km2 | ||||
| Slope * | ΦFB | ° | Runoff characteristics Liquid water supply | |||
| Geometric slope * | ΦGSL | ° | DEM | |||
| Headwall | Height | HHW | m | DEM 5 | Debris supply | [62,74,75,76,77] |
| Area 2 | AHW | km2 | ||||
| Slope * † | ΦHW | ° |
1 Parameters manually delineated (planimetric length and width, riser height as maximum elevation difference between top and foot of riser). 2 Slope-corrected surface area after Jenness (2004) [78]. 3 Surface roughness calculated as the difference between the minimum and maximum elevation in a 3 × 3 neighborhood around the focal point [79]. 4 North-exposedness as the cosine of slope aspect, east-exposedness as the sine of slope aspect. 5 DEM-filling algorithm by Wang and Liu (2006) [80]. * Parameters used in the logistic regression and random forest classification models. † Parameter subset after stepwise backwards variable selection using AIC.
3.4. Modeling Rock Glacier Activity
Rock glacier activity can be modeled as a binary categorical variable differentiating the actively moving state from the stagnant or inactive state. The individual LoDs determined for each specimen were used as thresholds to separate active rock glaciers, (surface displacement exceeding LoD) from inactive forms (surface displacement falling below LoD). We acknowledge here that rock glaciers with surface displacement below the LoD of our analysis might still experience movement resolvable at higher precision. Multiple statistical approaches deal with the prediction of binary outcome variables based on a set of continuous and/or categorical predictors. We apply logistic regression and random forest classification to compare the effects of linear relations and threshold conditions. Both approaches have been used in a variety of geomorphological studies and proved especially promising for the modeling of rock glacier distribution [81] and rock glacier activity [82].
Logistic regression is a parametric technique like linear regression, that estimates the probability of the class membership (active/inactive) as a logistic function of explanatory variables of the form
in which is the probability to be estimated and , …, are independent variables. The coefficients , …, are fit using a maximum likelihood approach, the resulting expression to the left is called the ‘log-odds’ of [83]. The probability cut-off for predicting either one of the class memberships of an observation is typically held at . The performance of the logistic models and of univariate discriminatory power of each parameter were compared by means of Akaike’s Information Criterion (AIC) [84]. Using this performance measure, we built a parameter subset utilising a stepwise backwards variable selection procedure. To achieve this, reduced models were iteratively compared until the model with the lowest AIC score was found.
Random forest classification is a machine learning approach developed by Breiman (2001) [85] that is based on the idea of decision trees. In random forests, multiple trees are grown simultaneously, while the variable selection at each node is based on a random subset of predictors. Averaging the predictions of multiple trees generally leads to a more robust model. Variable importance within random forests was assessed by comparing the mean decrease in Gini index , defined as
where is the proportion of observations in class at a node to the total number of observations in this class. If approaches 1, becomes indefinitely small and reaches zero for = 1 (a pure node). The quality of splits performed by each parameter can thus be quantified by the total decrease in Gini over all splits and trees.
We start out by applying a univariate logistic regression analysis to identify those parameters with significant discriminatory power. We then proceed to use both a complete dataset and the subset from stepwise backwards variable selection to predict the probability of significant surface movement with both logistic regression and random forest classification. As the initial number of observations is low (n = 104), splitting the dataset multiple times into a reasonable ratio of training to testing data before training the model on each subset and finally averaging the predictions, can lead to a more robust model. Here, both models were trained 100 times, each time splitting the dataset into 80% for training and 20% for testing. The resulting predictions were then averaged. Comparison of the predictive models was done with the classifier performance statistic AUC (Area Under the receiver operating characteristic (ROC) Curve), which falls between 0 and 1 [86]. Models with AUCs above 0.7 usually present ‘acceptable’ discrimination, AUCs above 0.8 show ‘excellent’ discriminatory power [83].
Logistic regression models are expectedly more responsive to linear relationships between activity states and predictors, while the decision trees in random forest classification respond better to non-linearities and clear separations of active and inactive observations within these predictors and are unable to map such linear responses.
4. Results
4.1. Horizontal Surface Velocities and Spatial Variability
Using EMT, we photogrammetrically derived horizontal surface displacements of 104 intact rock glaciers in the Kaunertal for three epochs between 2001 resp. 2003 and 2015. Our results reveal significant surface movement (i.e., above LoD) for 30 of these rock glaciers throughout the observation period that were thus classified as active (Figure 3 and Figure S1). For the remaining intact rock glaciers, displacements remained below LoD, leaving 74 landforms as inactive. On average, the motion tracking approach showed LoDs of 1.17 px between image pairs, with extremes ranging between 0.27 and 5.54 px (Table S1), leaving smaller changes undetectable. In addition to errors associated with orthoimage referencing, dense snow blankets and cloud coverage during image acquisition limited the tracking capabilities in a few cases.
Average horizontal velocities of active rock glaciers in the Kaunertal fall between 0.11–0.29 m yr−1 (IQR; 2001/2003 to 2015). Maximum velocities are in the range of 0.31–0.81 m yr−1 (IQR), with peaks reaching up to 1.77 m yr−1 at Innere Ölgrube and 1.52 m yr−1 at the Kaiserberg rock glacier, averaged over the entire observation period (Figure 3). Even the slowest rock glaciers still showed velocities exceeding 0.10 m yr−1. Our data show that flow directions between due West and North-East predominate, with only a few exceptions flowing southwardly.
Creep rates show marginally lower values during the earlier interval of the observed period, i.e. between 2001/2003 and 2009 when compared to the latest measurements between 2010 and 2015. Both lower and upper quartiles show a velocity increase of roughly half a centimetre per year, from 0.040 to 0.044 m yr−1 and 0.168 to 0.176 m yr−1 respectively. However, we must refrain from reasoning a significant trend from the limited time series.
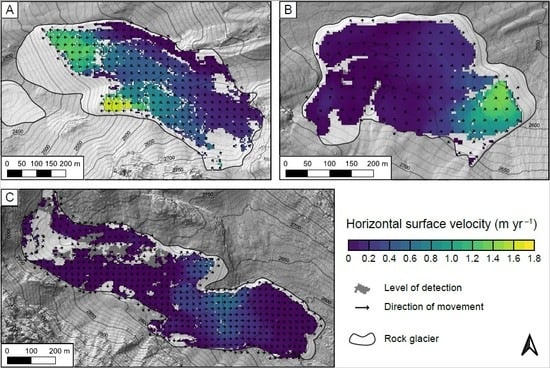
Most of the features show heterogeneous velocity fields, reflecting the compound structure of rock glaciers composed from overriding and adjoining lobes. In this case, a percentile-based analysis of velocities is preferred over relying on simple arithmetic means. Generally, the highest creep rates are predominantly observed in central parts of rock glaciers, located either towards the front or on secondary lobes or tongues further upslope in the case of complex features (Figure 4). In these areas, velocities are around four times higher compared to the remaining part. Deformation rates decrease significantly towards the rock glacier fringe and root zone.
In the absence of extensive ground-truthing observations, we relied on published measurements from preceding Differential GPS (DGPS) surveys on the Innere Ölgrube and Kaiserberg rock glaciers (2000/2002 to 2005; [50]) as well as the Riffeltal rock glacier(s) (2006 to 2012; [53]) to qualitatively compare our results against. Together with direct ground truthing using repeated DGPS surveys on the Kaiserberg rock glacier, though covering a different time interval (2018 to 2019), we could confirm both magnitudes and patterns of the displacements determined by the feature-tracking approach (Figure S2).
4.2. Rock Glacier Characteristics and Distributional Patterns
The Kaunertal rock glaciers cover planimetric areas between 0.02 km2 and 0.08 km2 (IQR), ranging from 0.003 km2 to 0.4 km2, while east- and west-exposed features show the largest dimensions. The distribution of rock glaciers and their thermal states in the superordinate mountain range are believed to be a function of geological, lithological and climatic parameters [20]. We find that the Kaunertal rock glaciers show clear patterns regarding elevation and aspect (Figure 5). With elevation, they follow a bell-shaped distribution, peaking between 2500–2600 m a.s.l. and decreasing towards the upper and lower elevation limits of 3130 and 2095 m a.s.l., respectively, covering a total vertical elevation range of ~1000 m. Rock glacier size decreases significantly with altitude, as revealed by quantile regression of the 50th and 75th percentile of the distribution. The occurrence of relict rock glaciers reaches its upper boundary at 2776 m a.s.l., while intact features are not found below 2269 m a.s.l.. Discrimination between relict and intact rock glaciers, therefore, suggests a simple altitudinal gradient. Active rock glaciers (i.e., with displacements above LoD) are situated at elevations between 2343 and 2821 m a.s.l. and peak in numbers between 2500 and 2600 m a.s.l. The differentiation from inactive features is not as distinct.
Regarding aspect, east-exposed rock glaciers predominate in numbers (n = 39) and surface area share (>30%), which is probably owed to the larger size of western tributaries over their eastern counterparts (Figure 1 and Figure 5). Active rock glaciers prevail in eastern and western aspects and are nearly absent on south exposed slopes where solar insulation is at its highest.
4.3. Statistical Analysis of Potential Controls on Rock Glacier Kinematics
4.3.1. Controls on Surface Velocities
Assessment of linear relationships between creep velocities and non-transformed terrain parameters was done using IRLS regression (Table 3). Creep velocities for each feature were broken down as percentiles and analyzed separately for the 25th, 50th, 75th, and 95th percentile and the absolute maximum values.
Overall, the statistical relationship between rock glacier surface velocities and the investigated parameters (Table 2) is weak to moderate: ten out of the 21 analyzed parameters yield significant relationships to selected velocity percentiles, yet we stress here that collinearities exist between analyzed parameters and they can only be used interchangeably. Most parameters show positive relations to rock glacier movement, while only the topoclimatic parameter east-exposedness yields a significant negative fit for the 25th and 50th percentile of velocity data (Table 3). The analysis of catchment parameters against surface velocities yields most of the detected significant fits. In turn, elevation-based parameters and geometric descriptors of the rock glacier body hardly show significant relationships, with the exception of the rock glacier height and rock glacier riser height that show significant positive trends for the 25th percentile and 75th and 95th percentiles and the maximum, respectively. Four parameters exhibit significant positive trends for all velocity percentiles, further two parameters are significant for three out of five velocity percentiles (Table 3, Figure 6), though R2-values generally remain below 0.5. Feeder basin slope and geometric slope both are significant for all velocity ranges and have R2-values of 0.14 to 0.28 and 0.27 to 0.35, respectively. The median surface slope of the rock glacier, also significant for all velocity ranges, shows the strongest correlation of rock glacier derived parameters with coefficients between 0.16 and 0.43.
4.3.2. Controls on Rock Glacier Activity
Candidate parameters were used as input variables for univariate logistic regression models to assess their individual discriminatory power to separate active from inactive rock glaciers. The resulting models were then compared using Akaike’s Information Criterion (AIC). Three fits were evaluated: (1) linear fits, (2) logarithmic fits and (3) polynomial fits with two degrees of freedom. In general, geometric parameters which describe area or length specifications and cluster active rock glacier observations towards either end of the spectrum, respond best to log-transformations. Where active rock glaciers are found in narrow parameter space (e.g., elevation boundaries, potential incoming solar radiation (PISR) or surface slope) or clumped at both ends of the spectrum (e.g., east-exposedness), polynomial fits performed best. Nine out of 21 parameters show significant in-sample discriminatory power (Figure 7).
Model comparison of significant correlations (p < 0.05) shows that the best discrimination of active and inactive rock glaciers is achieved by parameters describing rock glacier geometry, showing the lowest AIC scores for rock glacier height (difference between maximum and minimum elevation), which yields a strong performance gap towards other parameters. Feature length, surface area and riser height are ranked comparably high and distinguish activity states similarly well. Topoclimatic parameters show average discriminatory power, of which mean PISR performs best. Lowest in-sample performances are associated with slope aspect (east-exposedness) and minimum rock glacier elevation, while parameters on feeder basin geometry perform slightly better, with basin height and surface area yielding statistically significant fits.
Out-of-sample performance, determined by repeatedly running univariate logistic regression (LR) models with random training and testing subsets (ratio of 80% to 20% respectively), shows that the classification accuracy of individual parameters is rather low. We achieve accuracies averaging 27.6% and find a variable ranking rather dissimilar from in-sample testing. Feeder basin height performs best with an average accuracy of 34.5%, while rock glacier height and length achieve the lowest accuracies (21.7% and 24.4% respectively). The low out-of-sample discriminatory power of univariate predictors suggests the value of using multiple independent variables in the prediction of rock glacier activity states.
4.4. Modeling Rock Glacier Activity
Using selected geometric, topographic, and climatic candidate parameters, we were able to predict rock glacier activity in the Kaunertal with an overall accuracy of up to 77.5% (AUC = 0.84), improving the highest baseline accuracy, i.e., always predicting the most frequently occurring class, by 6.3%. We prepended a collinearity analysis to remove strong pair-wise correlations between the predictors, reducing the number of parameters from 21 to 16 (Table 2). On the whole, logistic regression models (LR) outperformed random forest classification (RF) in discriminating active from inactive rock glaciers. In LR, the parameter subset increased the AUC to 0.84 compared to 0.75 for the full parameter set (Figure 8). The same subset also improved classification accuracies of the RF model, though only from an AUC of 0.80 to 0.83. We further tested RF and LR on principal components of the reduced parameter set. However, the preceding principal component analysis does not improve the performance of the RF and LR models, yielding AUCs of 0.71 and 0.75, respectively.
Determining an active rock glacier state generally seems more challenging throughout all investigated models, and their average classification errors are found substantially higher than those for inactive features (0.51 vs. 0.14). For active rock glaciers, LR shows better performance overall, with the reduced parameter set achieving accuracies of 60%, while the reduced RF model is accurate to only 55%. For inactive rock glaciers, however, RF shows better performance and scores average classification accuracies of 88% with the reduced parameter set. The general oddity of higher accuracies when predicting inactive features, regardless of LR or RF, can be explained by the class imbalance of the dataset (30 active vs. 74 inactive features). Baseline accuracies of each class amount to 29% and 71%, respectively.
Variable importance analysis of the RF models revealed similar parameter performance as univariate LR models (Figure 9). Again, rock glacier height leads the scoreboard with a notable gap to other parameters and other geometric descriptors of rock glacier dimensions stand out as top performers, including parameters on feeder basin and headwall geometry and morphology. Topoclimatic parameters show varying performance scores, with mean PISR in position as the second-best discriminator. Although decision trees would respond better to thresholds conditions, like elevation limits or surface slope, than to (quasi-)linear relations with e.g., geometric measures, we did not observe such qualities herein.
5. Discussions
5.1. Rock Glacier Activity, Velocity And Degradation
Applying a feature tracking algorithm to available high-resolution optical imagery, we were able to quantitatively separate 30 actively moving rock glaciers from their inactive counterparts. Alongside available studies that investigate rock glacier activity on a regional basis using differential InSAR [87,88], we build upon the few available studies that applied basin-scale quantifications of horizontal surface velocities using optical feature tracking [34,89]. Depending on, among others, ground resolution and capture interval of the available imagery, this technique has limitations resolving seasonal variability in surface movement. However, image pre-processing, computational requirements and a straightforward workflow [58] are distinct advantages over InSAR applications. Furthermore, the potential to use historic aerial imagery offers the possibility to extend the observation period to several decades.
The active rock glaciers in the Kaunertal catchment show decadal average surface velocities of several decimetres per year, which is in line with other findings from the European Alps [3,18,27]. Direct quantitative comparison to other studies proves difficult, as the applied methodologies to calculate average velocities are often elusive and the spatial and temporal resolution at which rock glaciers are monitored incorporate inter- and intra-annual velocity fluctuations. Nonetheless, previous reports on rock glacier kinematics in the Kaunertal revealed comparable displacements [50,53,90]. Furthermore, the marginal increase in surface velocities revealed by our data is also in agreement with earlier studies from the Alps (see e.g., [50,91,92] or [93]) that mostly attribute rock glacier acceleration to warming air temperatures and its effect on ice temperature, snow cover duration, and the availability of liquid water. At the Kaiserberg rock glacier, where we collected UAV-derived imagery in September 2018 to further extend the observation period, we observe a slight but significant increase in surface velocities of the southern lobe that coincides with increasing air temperatures over the past 15 years (Figure 10). Judging from a comparison with the earliest measurements on the Innere Ölgrube rock glacier that found maximum average velocities of 0.75 m yr-1 between 1938 and 1957, surface velocities more than doubled over the past 65 years [94] (Figure 3 and Figure 4).
Some rock glaciers in the catchment show a stagnant front and upslope sections with considerably higher velocities, resulting in compressional zones with pronounced ridge and furrow systems that develop in front of the faster moving ice-debris mixtures, and a relatively flat extension zone trailing behind (Figure 4). Destabilization phenomena such as scarps and cracks, as effects of sharp contrasts in surface deformations [16,95], were only identified in the steeper eastern lobe of the Kaiserberg rock glacier (RG12), where considerably higher surface velocities cause an extensive creep behavior and the formation of transversal depressions. Noticeable shear zones are formed where fields of high and low deformation rates are located directly adjacent to another (Figure 4).
No exceptionally high surface velocities of several metres per year, nor dramatic acceleration or collapse of rock glacier fronts that would point to advanced permafrost degradation [16,96] were observed in the Kaunertal. However, the development of a thermokarst lake on RG08 at around 2700 m a.s.l. indicated the occurrence of subsidence effects (Figure S3). To further shed light on permafrost degradation in the study area, we carried out a case study on the Kaiserberg rock glacier (RG12), where we acquired a high-resolution DEM (0.05 m ground resolution) in September 2018 by means of Structure-from-Motion (SfM) [97] using a UAV platform. In combination with LiDAR DEMs provided by the government of Tyrol for the years 2006 and 2010, we could evaluate and quantify changes in surface elevation over time (Figure 11). We detect an overall volume loss on the order of 2×10³ m³ yr−1 during both periods (LoDs amount to ±0.36 m and ±0.30 m respectively), with most of the subsidence observed between transverse ridges and on an extensive area in the upper part of the tread, where the transition between riser and root zone becomes increasingly concave over time (Figure 11). This points towards thaw settlement by melt out of excess ice and a limited debris supply from the talus above.
Destabilization phenomena due to highly heterogeneous velocity fields are not immediately evident on the rock glaciers in the catchment. Noticeable, however, are the rock glaciers Kaiserberg (RG12) and Innere Ölgrube (RG18), where horizontal velocities of adjacent lobes are highly variable, locally exceeding 1 m yr−1, resulting in the formation of longitudinal and transversal cracks on the rock glacier surface. Geophysical measurements suggest the presence of ice-rich permafrost of 20–30 m thickness with volumetric ice-contents between 40%–60% for both of these rock glaciers [90], potentially explaining elevated velocities. Nonetheless, the influence of local effects, such as preferential meltwater pathways and underlying topography might also come into play.
Rockfall activity at the margins was noticed for most of the rock glaciers with active frontal lobes, showing erosional patterns at the top of the riser and accumulation close to the foot (Figure 11). However, the runouts and associated risks are expectedly small due to the low slope inclination of the forefield. Where fronts are advancing relatively slowly (~0.05 m a−1), rockfall occurrence is much more limited and a pronounced vegetation cover can be observed on the face of the riser.
5.2. What Controls Rock Glacier Kinematics in the Kaunertal?
Our study seeks to identify a set of geometric, morphometric and topoclimatic parameters controlling rock glacier kinematics, enabling us to predict rock glacier activity in a regional context. Yet, these parameters are surrogates associated with material composition, internal structure, debris and snow supply, presence of liquid water and further local influences. We therefore acknowledge that the control of these non-morphometric properties on rock glacier activity and surface kinematics might exceed the predictive power of parameters analyzed here. However, in a regional context, local parameters are not available for the entire assemblage of rock glacier landforms. Thus, we rely on candidate predictors that encapsulate a number of local parameters and can be derived from freely available and regionally harmonized data sets.
5.2.1. Towards Morphometrically Explaining Rock Glacier Velocities
Linear analysis between rock glacier velocity percentiles and candidate predictors reveal significant correlations for five out of 14 parameters derived for the rock glacier outline and five out of six parameters calculated for the feeder basin, respectively (Table 2 and Table 3). Furthermore, the geometric slope, combining geometric information from feeder basin and rock glacier, yields the most robust correlation found with R2-values between 0.27 and 0.35 and p-values of < 0.01 for all percentiles (Figure 6). We take from these results that feeder basin properties, such as average slope, area and elevation range, constitute reliable parameters to explain surface velocity variations in our study area. Potentially influenced by the presence of liquid water, these rock glaciers may exhibit accelerated creep velocities due to thermal heat fluxes and reduced friction in the shear zone [13,17,73,75].
We further find significant relationships between surface slope and surface roughness with velocity percentiles; clearly, both parameters are highly collinear. Together with the rather weak R2 values of links between riser height and velocities (≤ 0.25, p < 0.05), this implies that stress control on the Kaunertal rock glaciers might not be as important as the forcing by other parameters, such as ice content and temperatures (see e.g., [70]). Overall, the explained variance in our data is only moderate, with values generally falling between 14% and 43%.
Parameters that serve as surrogates for air-, ground- and permafrost temperatures, such as slope aspect, elevation boundaries and PISR do not show a strong correlation with velocity percentiles, despite the fact that a positive relationship between deformation rates and ground temperatures has been shown in borehole measurements by Arenson et al. (2002) [13] and experiments on ice samples by Paterson (1994) [98] and Moore (2014) [12]. Surface velocities slightly decrease with PISR and increase with rock glacier elevation boundaries, though IRLS regression is non-significant for all percentiles. We find relatively high PISR in combination with small rock glacier dimensions and a strong south-exposedness, suggesting thin permafrost thicknesses and/or low ice contents, potentially explaining reduced velocities with higher incoming radiation. Effects of varying solar radiation on rock glacier velocities have been reported before [69,70] and are not only attributed to direct energy input, but also to snow distribution and meltwater availability during the summer months [71].
5.2.2. Predicting Rock Glacier Activity in the Kaunertal
Using a LR model on a subset of 16 parameters, we are able to predict rock glacier activity in the Kaunertal with an overall accuracy of 77.5% (AUC = 0.84). Compared to earlier studies that predict the location of intact rock glaciers based on morphometric parameters [81], our model performs equally well. Applying a RF model to the same subset of data achieves similar performance (AUC = 0.83), while both, LR and RF classification accuracies fall behind when using the full parameter set. Interestingly, parameters derived from rock glacier dimensions consistently yielded the best performance scores for activity discrimination in univariate LR and the multivariate RF model, while feeder-basin measures that are strong in explaining surface velocities, show less explanatory power in this regard. Especially rock glacier height performs well in the distinction and highlights an observable threshold at around 100 m (Figure 7 and Figure 9), below which topographic relief might be too small to overcome yield stress imposed upon the debris-ice mixture. However, mapping of the upper rock glacier boundaries is sensitive to operator bias. We therefore carefully checked rock glacier polygons and used a conservative delineation of upper boundaries.
PISR, as a proxy for energy balance at the rock glacier surface and energy fluxes into the ground [65], was observed as one of the best in-sample discriminators between activity states and scored second in RF variable importance (Figure 7 and Figure 9). The relationship seems to show a condition where inactive rock glaciers dominate above an arbitrary PISR threshold, although the separation between the classes is not very distinct (Figure 7). For slope aspect which also correlates with PISR, we find a significant connection to rock glacier activity, with most active rock glaciers exposed towards northeast and northwest. This is also reflected by the high performance of north- and east-exposedness in univariate LR and east-exposedness in RF variable importance. Furthermore, besides rock glacier length and surface area that prove to be good discriminators for activity states, riser height, as a rough proxy for the permafrost thickness shows a potentially strong influence of stress control on rock glacier activity, although the relationship between riser height and permafrost thickness strongly depends on the underlying topography [3]. Nonetheless, this notion is supported by statistically significant correlations between surface velocity percentiles and riser height.
Parameters derived for rock glacier feeder basins, namely height, slope, and size, as well as the slope of the rock glacier headwall are only of minor importance in discriminating between active and inactive rock glaciers in the study area. Notably, the geometric slope that showed the most robust correlation to surface velocities only contributes marginally to the classification of states of activity.
In more general terms, rock glacier activity displays an upper elevation threshold in the Kaunertal, where no active rock glaciers are found above 2900 m a.s.l. (Figure 7). We attribute this mainly to decreasing feature and feeder basin sizes with elevation, which approximate rock glacier volumes that determine the critical mass to surpass yield stresses and initiate movement.
5.3. A Tentative Assessment of the Hydrological Importance of Permafrost in an Alpine Catchment
The past decades have seen various studies that attribute paramount importance to the hydrology of rock glaciers in alpine catchments. Rock glaciers not only act as hydrological buffers that intercept melt- and rainwater and alter discharge patterns of the catchment [40,100], but growing evidence points to their role as significant alpine water stores [39,41,101]. In this regard, rock glaciers stand out as prominent indicators for all areas underlain by permafrost. A first-order quantification based on modeled permafrost distribution roughly estimates 25 km3 of subsurface ice for the Alps [102], which compares to 80−100 km3 of glacial ice [103,104]. Loss of glacial ice has recently been projected to amount to 63−94% by 2100 (reference year 2017), suggesting that the amount of subsurface ice will likely surpass glacial ice storage by that time [103,104]. In the Kaunertal, the rapidly decreasing Gepatschferner, still one of the largest glaciers of the eastern Alps, is a prime example for this development. Today, ~20.7 km2 of the catchment is covered by glacial ice [44], which compares to between ~33.9 km2 and ~95.1 km2 that are underlain by permafrost in nearly all and in very favorable conditions (Figure 1), respectively [45]. However, these estimates are associated with extremely large uncertainties, calling for a more thorough quantification of subsurface ice in both regional and local contexts. The quantitative distinction between active and inactive rock glaciers might help with improving future model results on the distribution and magnitude of these subsurface water stores in high-alpine regions.
6. Conclusions
We applied an image tracking approach to infer rock glacier surface velocities on a basin scale, aiming to isolate active rock glaciers and identify potential morphometric parameters that control their state of activity. In the Kaunertal catchment, a valley of the Ötztal Alps, we find significant surface movement over a 15-year period for 30 out of 129 rock glaciers and classify these as active. The approach taken to quantitatively discriminate active and inactive rock glaciers on a regional basis has clear advantages over relying solely on field observations, terrain analysis and visual aerial imagery inspection. The LoDs of our approach, averaging just 0.02 m yr−1 at an image resolution of 0.2 m, are auspicious, though we acknowledge that rock glaciers with surface displacement below LoD might still experience movement that is resolvable at higher precision, as, e.g., with differential InSAR approaches that require more extensive processing. In line with earlier studies from the European Alps that investigate rock glacier displacement of individual landforms, we detect mean surface velocities in the range of 0.11 to 0.29 m yr−1 and a significant increase over the observed period, coinciding with records of increasing air temperatures from local meteorological stations. Maximum velocities attain up to 1.7 m yr−1, falling behind numerous rock glaciers that reportedly underwent dramatic acceleration in recent years. The Kaunertal rock glaciers depict clear distributional patterns of relict and intact rock glaciers regarding elevation and aspect, both in size and numbers, pointing towards topographic controls as the main drivers of ground ice distribution.
The assessment of various morphometric candidate parameters and their potential links to rock glacier velocities revealed several statistically significant and causal relationships. In particular, the analysis of feeder basin characteristics revealed a potential influence of parameters related to the presence of liquid water and sediment supply on rock glacier rheology in the Kaunertal. In contrast, we infer that the explanatory potential of gravity-induced stress on surface velocities is rather weak. The control of non-morphometric rock glacier properties, such as internal structure, ice content and the presence of liquid water, on rock glacier surface kinematics, might, therefore, exceed the predictive power of parameters analyzed herein. However, we could highlight a few morphometric parameters, such as geometric slope and feeder basin slope, as valuable proxies for internal rock glacier properties and their influence on creep.
In contrast to velocities, we find rather dissimilar relationships to rock glacier activity states. Especially geometric parameters related to stress control demonstrate high discriminatory power and point towards potential threshold conditions for the onset of movement. Discriminating rock glacier activity states from a selected number of geometric, topographic and topoclimatic parameters achieves satisfying classification accuracies of up to 75.5% for both logistic regression and random forest classification. These models indicate promising approaches to distinguish active from inactive rock glaciers solely based on morphometric characteristics. The quantitative determination of activity states using independent methods, however, are at present still indispensable for taking these models to a robust and transferable state.
Supplementary Materials
The following are available online at https://www.mdpi.com/2076-3263/9/9/373/s1, Table S1: Level of detection and horizontal surface velocity for 30 rock glaciers classified as active based on feature-tracking analysis in aerial imagery, Figure S1: Distribution of active, inactive and relict rock glaciers in the Kaunertal valley, Figure S2: Average horizontal surface velocity of the Kaiserberg rock glacier (RG12), Figure S3: The development and advance of a thermokarst lake on RG08.
Author Contributions
J.B. and T.G. jointly conceptualized the study, conducted fieldwork, edited artwork and wrote the manuscript. T.G. performed data pre-processing, analysis and organisation.
Funding
This research was funded by a grant from the Hohmann-Förderung of the Gesellschaft für Erdkunde zu Köln e.V. issued to J.B.
Acknowledgments
This study was kindly supported by the federal state government of Tyrol by granting access to a series of colour orthophotos and elevation models. We further acknowledge the Tiroler Wasserkraft AG (TIWAG) and the Zentralanstalt für Meteorologie und Geodynamik (ZAMG) for providing meteorological data at no cost. Moreover, we express our gratitude to Thomas Wagner and the RGHeavyMetal project team for deliberately sharing the latest version of a polygon-based rock glacier inventory of the study area, to James Kirchner for sharing his R-code for IRLS regression and to Sabine Kraushaar, Veronika Kapustova, Christian Halla, Simon Terweh, Jonas Alsleben, Nicolas Griesang and Jakob Müller for their help during fieldwork. We gratefully acknowledge the valuable comments by three anonymous reviewers.
Conflicts of Interest
The authors declare no conflict of interest.
References
- Ballantyne, C.K. Periglacial Geomorphology; Wiley Blackwell: Hoboken, NJ, USA; Chichester, UK, 2018; ISBN 978-1-405-10006-9. [Google Scholar]
- Wahrhaftig, C.; Cox, A. Rock glaciers in the Alaska Range. Geol. Soc. Am. Bull. 1959, 70, 383–436. [Google Scholar] [CrossRef]
- Haeberli, W. Creep of mountain permafrost: internal structure and flow of alpine rock glaciers. Mitteilungen der Versuchsanstalt fur Wasserbau, Hydrologie und Glaziologie an der ETH Zurich 1985, 77, 5–142. [Google Scholar]
- Humlum, O. Origin of rock glaciers: Observations from Mellemfjord, Disko Island, Central West Greenland. Permafr. Periglac. Process. 1996, 7, 361–380. [Google Scholar] [CrossRef]
- Berthling, I. Beyond confusion: Rock glaciers as cryo-conditioned landforms. Geomorphology 2011, 131, 98–106. [Google Scholar] [CrossRef]
- Humlum, O. Active layer thermal regime at three rock glaciers in Greenland. Permafr. Periglac. Process. 1997, 8, 383–408. [Google Scholar] [CrossRef]
- Brenning, A. Climatic and geomorphological controls of rock glaciers in the Andes of Central Chile: Combining statistical modeling and field mapping. Ph.D. Thesis, Humboldt-Universität zu Berlin, Berlin, Germany, 2005. [Google Scholar]
- Matsuoka, N.; Ikeda, A.; Date, T. Morphometric analysis of solifluction lobes and rock glaciers in the Swiss Alps. Permafr. Periglac. Process. 2005, 16, 99–113. [Google Scholar] [CrossRef]
- Whalley, W.B.; Martin, H.E. Rock glaciers: II models and mechanisms. Prog. Phys. Geogr. 1992, 16, 127–186. [Google Scholar] [CrossRef]
- Glen, J.W. The creep of polycrystalline ice. Proceedings of the Royal Society of London. Series A. Mathematical and Physical Sciences 1955, 228, 519–538. [Google Scholar] [CrossRef]
- Davies, M.C.R.; Hamza, O.; Harris, C. The effect of rise in mean annual temperature on the stability of rock slopes containing ice-filled discontinuities. Permafr. Periglac. Process. 2001, 12, 137–144. [Google Scholar] [CrossRef]
- Moore, P.L. Deformation of debris-ice mixtures. Rev. Geophys. 2014, 52, 435–467. [Google Scholar] [CrossRef] [Green Version]
- Arenson, L.; Hoelzle, M.; Springman, S. Borehole deformation measurements and internal structure of some rock glaciers in Switzerland. Permafr. Periglac. Process. 2002, 13, 117–135. [Google Scholar] [CrossRef]
- Kääb, A.; Frauenfelder, R.; Roer, I. On the response of rockglacier creep to surface temperature increase. Global Planet. Change 2007, 56, 172–187. [Google Scholar] [CrossRef]
- Kääb, A. Remote Sensing of Mountain Glaciers and Permafrost Creep; Geographisches Institut der Universität Zürich: Zürich, Switzerland, 2005. [Google Scholar]
- Roer, I.; Haeberli, W.; Avian, M.; Kaufmann, V.; Delaloye, R.; Lambiel, C.; Kääb, A. Observations and considerations on destabilizing active rock glaciers in the European Alps. In Proceedings of the 9th International Conference on Permafrost, University of Alaska, Fairbanks, Alaska, June 29 - July 3, 2008, 2nd ed.; Kane, D.L., Hinkel, K.M., Eds.; Institute of Northern Engineering, University of Alaska, Fairbanks: Fairbanks, Alaska, 2008; pp. 1505–1510. ISBN 978-0980017922. [Google Scholar]
- Ikeda, A.; Matsuoka, N.; Kääb, A. Fast deformation of perennially frozen debris in a warm rock glacier in the Swiss Alps: An effect of liquid water. J. Geophys. Res. 2008, 113, 212. [Google Scholar] [CrossRef]
- Delaloye, R.; Strozzi, T.; Lambiel, C.; Perruchoud, E.; Raetzo, H. Landslide-like development of rockglaciers detected with ERS-1/2 SAR Interferometry. In Proceedings of the FRINGE 2007 Workshop, Frascati, Italy, 26–30 November 2007. [Google Scholar]
- Barsch, D. Rockglaciers. Indicators for the Present and Former Geoecology in High Mountain Environments; Springer: Berlin\Heidelberg, Germany, 1996. [Google Scholar]
- Krainer, K.; Ribis, M. A rock glacier inventory of the Tyrolean Alps. Austrian J. Earth Sci. 2012, 105, 32–47. [Google Scholar]
- Colucci, R.R.; Forte, E.; Žebre, M.; Maset, E.; Zanettini, C.; Guglielmin, M. Is that a relict rock glacier? Geomorphology 2019, 330, 177–189. [Google Scholar] [CrossRef] [Green Version]
- Kääb, A. Rock Glaciers and Protalus Forms. In Encyclopedia of Quarternary Sciences; Elias, S.A., Ed.; Elsevier: Amsterdam, The Netherlands, 2007; pp. 2236–2242. [Google Scholar]
- Roer, I. Rock glacier kinematics in the Turtmanntal, Valais, Switzerland – observational concept, first results and research perspectives. In Permafrost: Proceedings of the 8th International Conference on Permafrost, 21-25 July 2003, Zurich, Switzerland; Phillips, M., Springman, S.M., Arenson, L.U., Eds.; Balkema: Lisse, The Netherlands, 2003; pp. 971–975. ISBN 9058095827. [Google Scholar]
- Ikeda, A.; Matsuoka, N.; Kääb, A. A rapidly moving small rock glacier at the lower limit of the mountain permafrost belt in Swiss Alps. In Permafrost: Proceedings of the 8th International Conference on Permafrost, 21-25 July 2003, Zurich, Switzerland; Phillips, M., Springman, S.M., Arenson, L.U., Eds.; Balkema: Lisse, The Netherlands, 2003; pp. 455–460. ISBN 9058095827. [Google Scholar]
- Bodin, X.; Thibert, E.; Fabre, D.; Ribolini, A.; Schoeneich, P.; Francou, B.; Reynaud, L.; Fort, M. Two decades of responses (1986-2006) to climate by the Laurichard rock glacier, French Alps. Permafr. Periglac. Process. 2009, 20, 331–344. [Google Scholar] [CrossRef]
- Lambiel, C.; Delaloye, R. Contribution of real-time kinematic GPS in the study of creeping mountain permafrost: Examples from the Western Swiss Alps. Permafr. Periglac. Process. 2004, 15, 229–241. [Google Scholar] [CrossRef]
- Roer, I. Rockglacier kinematics in a high mountain geosystem; Asgard-Verlag: St. Augustin, Germany, 2007; ISBN 9783537876676. [Google Scholar]
- Scapozza, C.; Lambiel, C.; Bozzini, C.; Mari, S.; Conedera, M. Assessing the rock glacier kinematics on three different timescales: A case study from the southern Swiss Alps. Earth Surf. Processes Landforms 2014, 39, 2056–2069. [Google Scholar] [CrossRef]
- Bauer, A.; Paar, G.; Kaufmann, V. Terrestrial laser scanning for rock glacier monitoring. In Permafrost: Proceedings of the 8th International Conference on Permafrost, 21-25 July 2003, Zurich, Switzerland; Phillips, M., Springman, S.M., Arenson, L.U., Eds.; Balkema: Lisse, The Netherlands, 2003; pp. 55–60. ISBN 9058095827. [Google Scholar]
- Lambiel, C.; Delaloye, R.; Strozzi, T.; Lugon, R.; Raetzo, H. ERS InSAR for detecting the rock glacier activity. In Proceedings of the 9th International Conference on Permafrost, University of Alaska, Fairbanks, Alaska, June 29 - July 3, 2008, 2nd ed.; Kane, D.L., Hinkel, K.M., Eds.; Institute of Northern Engineering, University of Alaska, Fairbanks: Fairbanks, Alaska, 2008; pp. 1019–1024. ISBN 978-0980017922. [Google Scholar]
- Liu, L.; Millar, C.I.; Westfall, R.D.; Zebker, H.A. Surface motion of active rock glaciers in the Sierra Nevada, California, USA: Inventory and a case study using InSAR. Cryosphere 2013, 7, 1109–1119. [Google Scholar] [CrossRef]
- Kaufmann, V.; Ladstädter, R. Quantitative analysis of rock glacier creep by means of digital photogrammetry using multi-temporal aerial photographs: Two case studies in the Austrian Alps. In Permafrost: Proceedings of the 8th International Conference on Permafrost, 21-25 July 2003, Zurich, Switzerland; Phillips, M., Springman, S.M., Arenson, L.U., Eds.; Balkema: Lisse, The Netherlands, 2003; pp. 525–530. ISBN 9058095827. [Google Scholar]
- Vivero, S.; Lambiel, C. Monitoring the crisis of a rock glacier with repeated UAV surveys. Geographica Helvetica 2019, 74, 59–69. [Google Scholar] [CrossRef]
- Kaufmann, V.; Kellerer-Pirklbauer, A. Active Rock Glaciers in a Changing Environment. Geomorphometric Quantification and Cartographic Presentation of Rock Glacier Surface Change with Examples from the Hohe Tauern Range, Austria. In Mountain cartography: 16 years ICA Commission on Mountain Cartography (1999-2015); Kriz, K., Ed.; Institut für Geographie und Regionalforschung der Universität Wien, Kartographie und Geoinformation: Wien, Austria, 2015; pp. 179–190. ISBN 978-3-900830-86-1. [Google Scholar]
- Kenner, R.; Bühler, Y.; Delaloye, R.; Ginzler, C.; Phillips, M. Monitoring of high alpine mass movements combining laser scanning with digital airborne photogrammetry. Geomorphology 2014, 206, 492–504. [Google Scholar] [CrossRef]
- Kenner, R.; Phillips, M.; Beutel, J.; Limpach, P.; Papke, J.; Hasler, A.; Raetzo, H. Investigating the dynamics of a rock glacier using terrestrial laser scanning, time-lapse photography, in-situ GPS measurements and satellite SAR interferometry: Ritigraben rock glacier, Switzerland. In XI. International Conference On Permafrost: Exploring Permafrost in a Future Earth, Book of Abstracts, Potsdam, Germany, 20-24 June 2016; Günther, F., Morgenstern, A., Eds.; Bibliothek Wissenschaftpark Albert Einstein: Potsdam, Germany, 2016; pp. 896–897. [Google Scholar]
- Delaloye, R.; Lambiel, C.; Gärtner-Roer, I. Overview of rock glacier kinematics research in the Swiss Alps. Geogr. Helv. 2010, 65, 135–145. [Google Scholar] [CrossRef]
- Lieb, G.K. Permafrost und Blockgletscher in den östlichen österreichischen Alpen. Arbeiten aus dem Institut für Geographie der Karl-Franzens-Universität Graz 1996, 33, 9–125. [Google Scholar]
- Jones, D.B.; Harrison, S.; Anderson, K.; Betts, R.A. Mountain rock glaciers contain globally significant water stores. Sci. Rep. 2018, 8, 2834. [Google Scholar] [CrossRef] [PubMed]
- Krainer, K.; Mostler, W. Hydrology of Active Rock Glaciers: Examples from the Austrian Alps. Arctic, Antarctic, and Alpine Research 2002, 34, 142–149. [Google Scholar] [CrossRef]
- Azócar, G.F.; Brenning, A. Hydrological and geomorphological significance of rock glaciers in the dry Andes, Chile (27°-33°S). Permafr. Periglac. Process. 2010, 21, 42–53. [Google Scholar] [CrossRef]
- Humlum, O. The geomorphic significance of rock glaciers: Estimates of rock glacier debris volumes and headwall recession rates in West Greenland. Geomorphology 2000, 35, 41–67. [Google Scholar] [CrossRef]
- Barsch, D. Eine Abschätzung von Schuttproduktion und Schutttransport im Bereich aktiver Blockgletscher der Schweizer Alpen. Z. Geomorphol. 1977, 28, 148–160. [Google Scholar]
- Buckel, J.; Otto, J.-C. The Austrian Glacier Inventory GI 4 (2015) in ArcGis (shapefile) format; PANGAEA - Data Publisher for Earth & Environmental Science. 2018. Available online: https://doi.org/10.1594/PANGAEA.887415 (accessed on 28 June 2019).
- Boeckli, L.; Brenning, A.; Gruber, A.; Noetzli, J. Alpine permafrost index map. Supplement to: Boeckli, L.; Brenning, A; Gruber, A; Noetzli, J. (2012): Permafrost distribution in the European Alps: calculation and evaluation of an index map and summary statistics. The Cryosphere, 6, 807-820; PANGAEA - Data Publisher for Earth & Environmental Science: Bremen, Germany, 2012. [Google Scholar]
- Krainer, K.; Hauser, C.; Pavlik, W.; Pestal, G.; Nowotny, A.; Rockenschaub, M.; Ucik, F.H. Geologische Karte der Republik Österreich 1 : 50 000. Map sheet 144 Landeck; Geologische Bundesanstalt: Wien, Austria, 2004. [Google Scholar]
- Nicolussi, K.; Kaufmann, M.; Patzelt, G.; van der Plicht, J.; Thurner, A. Holocene tree-line variability in the Kauner Valley, Central Eastern Alps, indicated by dendrochronological analysis of living trees and subfossil logs. Veg. Hist. Archaeobot. 2005, 14, 221–234. [Google Scholar] [CrossRef] [Green Version]
- Baewert, H.; Morche, D. Coarse sediment dynamics in a proglacial fluvial system (Fagge River, Tyrol). Geomorphology 2014, 218, 88–97. [Google Scholar] [CrossRef]
- Wagner, T.; Pleschberger, R.; Kainz, S.; Ribis, M.; Kellerer-Pirklbauer, A.; Krainer, K.; Philippitsch, R.; Winkler, G. The first consistent inventory of rock glaciers and their hydrological catchments of the Austrian Alps. Austrian J. Earth Sci. in press.
- Krainer, K.; Mostler, W. Flow velocities of active rock glaciers in the austrian alps. Geografiska Annaler: Series A, Physical Geography 2006, 88, 267–280. [Google Scholar] [CrossRef]
- Berger, J.; Krainer, K.; Mostler, W. Dynamics of an active rock glacier (Ötztal Alps, Austria). Quat. res. 2004, 62, 233–242. [Google Scholar] [CrossRef]
- Berger, J. Aufbau und Dynamik aktiver Blockgletscher am Beispiel der Blockgletscher in der Inneren Ölgrube und dem Kaiserbergtal (Ötztaler Alpen/Tirol). Diploma Thesis, Ernst-Moritz-Arndt-Universität, Greifswald, Germany, 2002. [Google Scholar]
- Dusik, J.-M.; Leopold, M.; Heckmann, T.; Haas, F.; Hilger, L.; Morche, D.; Neugirg, F.; Becht, M. Influence of glacier advance on the development of the multipart Riffeltal rock glacier, Central Austrian Alps. Earth Surf. Processes Landforms 2015, 40, 965–980. [Google Scholar] [CrossRef]
- Kleinferchner, H. Blockgletscherinventar der östlichen österreichischen Alpen. Diploma Thesis, Karl-Franzens-Universität Graz, Graz, Austria, 2010. [Google Scholar]
- Kellerer-Pirklbauer, A.; Lieb, G.K.; Kleinferchner, H. A new rock glacier inventory of the Eastern European Alps. Austrian J. Earth Sci. 2012, 105, 78–93. [Google Scholar]
- Schwalbe, E. Entwicklung von Verfahren zur Bestimmung räumlich-zeitlich hochaufgelöster Bewegungsvektorfelder an Gletschern aus monoskopischen Bildsequenzen. Ph.D. Thesis, Technische Universität Dresden, Dresden, Germany, 2013. [Google Scholar]
- Gruen, A. Development and Status of Image Matching in Photogrammetry. Photogrammetric Record 2012, 27, 36–57. [Google Scholar] [CrossRef]
- Schwalbe, E.; Maas, H.-G. The determination of high-resolution spatio-temporal glacier motion fields from time-lapse sequences. Earth Surf. Dyn. 2017, 5, 861–879. [Google Scholar] [CrossRef] [Green Version]
- Debella-Gilo, M.; Kääb, A. Measurement of Surface Displacement and Deformation of Mass Movements Using Least Squares Matching of Repeat High Resolution Satellite and Aerial Images. Remote Sens. 2012, 4, 43–67. [Google Scholar] [CrossRef] [Green Version]
- Heim, A. Bergsturz und Menschenleben; Fretz und Wasmuth: Zürich, Switzerland, 1932. [Google Scholar]
- Helsel, D.R.; Hirsch, R.M. Statistical Methods in Water Recources; U.S. Geological Survey: Reston, VA, USA, 2002.
- Frauenfelder, R.; Haeberli, W.; Hoelzle, M. Rockglacier occurrence and related terrain parameters in a study area of the Eastern Swiss Alps. In Permafrost: Proceedings of the 8th International Conference on Permafrost, 21-25 July 2003, Zurich, Switzerland; Phillips, M., Springman, S.M., Arenson, L.U., Eds.; Balkema: Lisse, The Netherlands, 2003; pp. 253–258. ISBN 9058095827. [Google Scholar]
- Haeberli, W.; Vonder Mühll, D. On the characteristics and possible origins of ice in rock glacier permafrost. Zeitschrift für Geomorphologie, Supplementary Issues 1996, 104, 43–57. [Google Scholar]
- Whalley, W.B.; Azizi, F. Rheological models of active rock glaciers: Evaluation, critique and a possible test. Permafr. Periglac. Process. 1994, 5, 37–51. [Google Scholar] [CrossRef]
- Haeberli, W.; Hallet, B.; Arenson, L.; Elconin, R.; Humlum, O.; Kääb, A.; Kaufmann, V.; Ladanyi, B.; Matsuoka, N.; Springman, S.; et al. Permafrost creep and rock glacier dynamics. Permafr. Periglac. Process. 2006, 17, 189–214. [Google Scholar] [CrossRef]
- Janke, J.R. Using airborne LiDAR and USGS DEM data for assessing rock glaciers and glaciers. Geomorphology 2013, 195, 118–130. [Google Scholar] [CrossRef]
- Matsuoka, N.; Ikeda, A. Geological control on the distribution and characteristics of talus-derived rock glaciers. Annual Report of the Institute of Geoscience, the University of Tsukuba 2001, 27, 11–16. [Google Scholar]
- Hoelzle, M.; Mittaz, C.; Etzelmüller, B.; Haeberli, W. Surface energy fluxes and distribution models of permafrost in European mountain areas: an overview of current developments. Permafr. Periglac. Process. 2001, 12, 53–68. [Google Scholar] [CrossRef]
- Kellerer-Pirklbauer, A.; Kaufmann, V. About the relationship between rock glacier velocity and climate parameters in central Austria. Austrian J. Earth Sci. 2012, 105, 94–112. [Google Scholar]
- Buck, S.; Kaufmann, V. The Influence of Air Temperature on the Creep Behaviour of Three Rockglaciers in the Hohe Tauern. In Proceedings of the 10th International Symposium on High Mountain Remote Sensing Cartography, Patan, Nepal, 8–18 September 2008; Kaufmann, V., Sulzer, W., Eds.; Institute of Geography and Regional Science, University of Graz: Graz, Austria, 2010; pp. 159–170. [Google Scholar]
- Sloan, V.F.; Dyke, L.D. Decadal and millennial velocities of rock glaciers, Selwyn Mountains, canada. Geografiska Annaler: Series A, Physical Geography 1998, 80A, 237–249. [Google Scholar] [CrossRef]
- Kellerer-Pirklbauer, A. Lithology and the distribution of rock glaciers: Niedere Tauern Range, Styria, Austria. Zeitschrift für Geomorphologie, Supplementary Issues 2007, 51, 17–38. [Google Scholar] [CrossRef]
- Rist, A.; Phillips, M. First results of investigations on hydrothermal processes within the active layer above alpine permafrost in steep terrain. Norsk Geografisk Tidsskrift - Norwegian Journal of Geography 2005, 59, 177–183. [Google Scholar] [CrossRef]
- Etzelmüller, B.; Ødegård, R.S.; Berthling, I.; Sollid, J.L. Terrain parameters and remote sensing data in the analysis of permafrost distribution and periglacial processes: principles and examples from southern Norway. Permafr. Periglac. Process. 2001, 12, 79–92. [Google Scholar] [CrossRef]
- Wirz, V.; Gruber, S.; Purves, R.S.; Beutel, J.; Gärtner-Roer, I.; Gubler, S.; Vieli, A. Short-term velocity variations at three rock glaciers and their relationship with meteorological conditions. Earth Surf. Dyn. 2016, 4, 103–123. [Google Scholar] [CrossRef] [Green Version]
- Brenning, A.; Azócar, G.F. Statistical analysis of topographic and climatic controls and multispectral signatures of rock glaciers in the dry Andes, Chile (27°-33°S). Permafr. Periglac. Process. 2010, 21, 54–66. [Google Scholar] [CrossRef]
- Janke, J.; Frauenfelder, R. The relationship between rock glacier and contributing area parameters in the Front Range of Colorado. J. Quat. Sci. 2008, 23, 153–163. [Google Scholar] [CrossRef]
- Jenness, J.S. Calculating landscape surface area from digital elevation models. Wildl. Soc. Bull. 2004, 32, 829–839. [Google Scholar] [CrossRef]
- Wilson, M.F.J.; O’Connell, B.; Brown, C.; Guinan, J.C.; Grehan, A.J. Multiscale Terrain Analysis of Multibeam Bathymetry Data for Habitat Mapping on the Continental Slope. Mar. Geod. 2007, 30, 3–35. [Google Scholar] [CrossRef] [Green Version]
- Wang, L.; Liu, H. An efficient method for identifying and filling surface depressions in digital elevation models for hydrologic analysis and modelling. Int. J. Geogr. Inf. Sci. 2006, 20, 193–213. [Google Scholar] [CrossRef]
- Brenning, A.; Trombotto, D. Logistic regression modeling of rock glacier and glacier distribution: Topographic and climatic controls in the semi-arid Andes. Geomorphology 2006, 81, 141–154. [Google Scholar] [CrossRef]
- Kofler, C.; Steger, S.; Mair, V.; Comiti, F.; Zebisch, M.; Schneiderbauer, S. Statistically-based modelling of rock glacier activity. In Proceedings of the 5th European Conference on Permafrost (EUCOP 2018), Chamonix, France, 23 June–1 July 2018; Chamonix, France, 2018. [Google Scholar]
- Hosmer, D.W.; Lemeshow, S. Applied Logistic Regression; John Wiley & Sons, Inc.: Hoboken, NJ, USA, 2000; ISBN 9780471722144. [Google Scholar]
- Akaike, H. Information measures and model selection. International Statistical Institute 1983, 44, 277–291. [Google Scholar]
- Breiman, L. Random forests. Machine Learning 2001, 45, 5–32. [Google Scholar] [CrossRef]
- Fawcett, T. An introduction to ROC analysis. Pattern Recognit. Lett. 2006, 27, 861–874. [Google Scholar] [CrossRef]
- Villarroel, C.; Tamburini Beliveau, G.; Forte, A.; Monserrat, O.; Morvillo, M. DInSAR for a Regional Inventory of Active Rock Glaciers in the Dry Andes Mountains of Argentina and Chile with Sentinel-1 Data. Remote Sens. 2018, 10, 1588. [Google Scholar] [CrossRef]
- Wang, X.; Liu, L.; Zhao, L.; Wu, T.; Li, Z.; Liu, G. Mapping and inventorying active rock glaciers in the northern Tien Shan of China using satellite SAR interferometry. Cryosphere 2017, 11, 997–1014. [Google Scholar] [CrossRef] [Green Version]
- Kaufmann, V.; Kellerer-Pirklbauer, A. Regional quantification of rock glacier movement in Central Austria using authoritative data sources. In Geomorphometry for geosciences; Jasiewicz, J., Zwoliński, Z., Mitasova, H., Hengl, T., Eds.; Bogucki Wydawnictwo Naukowe: Poznań, Poland, 2015; pp. 165–168. ISBN 978-83-7986-059-3. [Google Scholar]
- Hausmann, H.; Krainer, K.; Brückl, E.; Ullrich, C. Internal structure, ice content and dynamics of Ölgrube and Kaiserberg rock glaciers (Ötztal Alps, Austria) determined from geophysical surveys. Austrian J. Earth Sci. 2012, 105, 12–31. [Google Scholar]
- Hartl, L.; Fischer, A.; Stocker-Waldhuber, M.; Abermann, J. Recent speed-up of an alpine rock glacier: An updated chronology of the kinematics of outer hochebenkar rock glacier based on geodetic measurements. Geografiska Annaler: Series A, Physical Geography 2016, 98, 129–141. [Google Scholar] [CrossRef]
- Delaloye, R.; Perruchoud, E.; Avian, M.; Kaufmann, V.; Bodin, X.; Hausmann, H.; Ikeda, A.; Kääb, A.; Kellerer-Pirklbauer, A.; Krainer, K.; et al. Recent interannual variations of rock glacier creep in the European Alps. In Proceedings of the 9th International Conference on Permafrost, University of Alaska, Fairbanks, Alaska, June 29 - July 3, 2008, 2nd ed.; Kane, D.L., Hinkel, K.M., Eds.; Institute of Northern Engineering, University of Alaska, Fairbanks: Fairbanks, Alaska, 2008; ISBN 978-0980017922. [Google Scholar]
- Roer, I.; Kääb, A.; Dikau, R. Rockglacier acceleration in the Turtmann valley (Swiss Alps): Probable controls. Norsk Geografisk Tidsskrift - Norwegian Journal of Geography 2007, 59, 157–163. [Google Scholar] [CrossRef]
- Pillewizer, W. Untersuchungen an Blockströmen der Ötztaler Alpen. Geomorphologische Abhandlungen des Geographischen Institutes der FU Berlin 1957, 5, 37–50. [Google Scholar]
- Marcer, M.; Serrano, C.; Brenning, A.; Bodin, X.; Goetz, J.; Schoeneich, P. Evaluating the destabilization susceptibility of active rock glaciers in the French Alps. Cryosphere 2019, 13, 141–155. [Google Scholar] [CrossRef] [Green Version]
- Bodin, X.; Krysiecki, J.-M.; Schoeneich, P.; Le Roux, O.; Lorier, L.; Echelard, T.; Peyron, M.; Walpersdorf, A. The 2006 Collapse of the Bérard Rock Glacier (Southern French Alps). Permafr. Periglac. Process. 2017, 28, 209–223. [Google Scholar] [CrossRef]
- Westoby, M.J.; Brasington, J.; Glasser, N.F.; Hambrey, M.J.; Reynolds, J.M. ‘Structure-from-Motion’ photogrammetry: A low-cost, effective tool for geoscience applications. Geomorphology 2012, 179, 300–314. [Google Scholar] [CrossRef]
- Paterson, W.S.B. The Physics of Glaciers, 3rd ed.; Pergamon: Amsterdam, The Netherlands, 1994. [Google Scholar]
- Obu, J.; Westermann, S.; Kääb, A.; Bartsch, A. Ground Temperature Map, 2000-2016, Northern Hemisphere Permafrost; Alfred Wegener Institute, Helmholtz Centre for Polar and Marine Research: Bremerhaven, Germany, 2018. [Google Scholar]
- Krainer, K.; Ribis, M. Blockgletscher und ihre hydrologische Bedeutung im Hochgebirge. Mitteilungsblatt des Hydrographischen Dienstes in Österreich 2009, 86, 65–78. [Google Scholar]
- Jones, D.B.; Harrison, S.; Anderson, K.; Whalley, W.B. Rock glaciers and mountain hydrology: A review. Earth Sci. Rev. 2019, 193, 66–90. [Google Scholar] [CrossRef]
- Boeckli, L.; Brenning, A.; Gruber, S.; Noetzli, J. Permafrost distribution in the European Alps: Calculation and evaluation of an index map and summary statistics. Cryosphere 2012, 6, 807–820. [Google Scholar] [CrossRef]
- Haeberli, W.; Schaub, Y.; Huggel, C. Increasing risks related to landslides from degrading permafrost into new lakes in de-glaciating mountain ranges. Geomorphology 2017, 293, 405–417. [Google Scholar] [CrossRef]
- Zekollari, H.; Huss, M.; Farinotti, D. Modelling the future evolution of glaciers in the European Alps under the EURO-CORDEX RCM ensemble. Cryosphere 2019, 13, 1125–1146. [Google Scholar] [CrossRef] [Green Version]
Figure 1.
Distribution of intact and relict rock glaciers in the Kaunertal valley [49]. Rock glaciers are shown as colour-coded dots scaled to the planimetric size of individual landforms. Numbers indicate specific rock glaciers referred to in text and figures. Light blue, blue and dark blue areas show the mapped distribution of glaciers [44] and modeled coverage of permafrost occurrence in very favorable conditions and nearly all conditions [45], respectively.
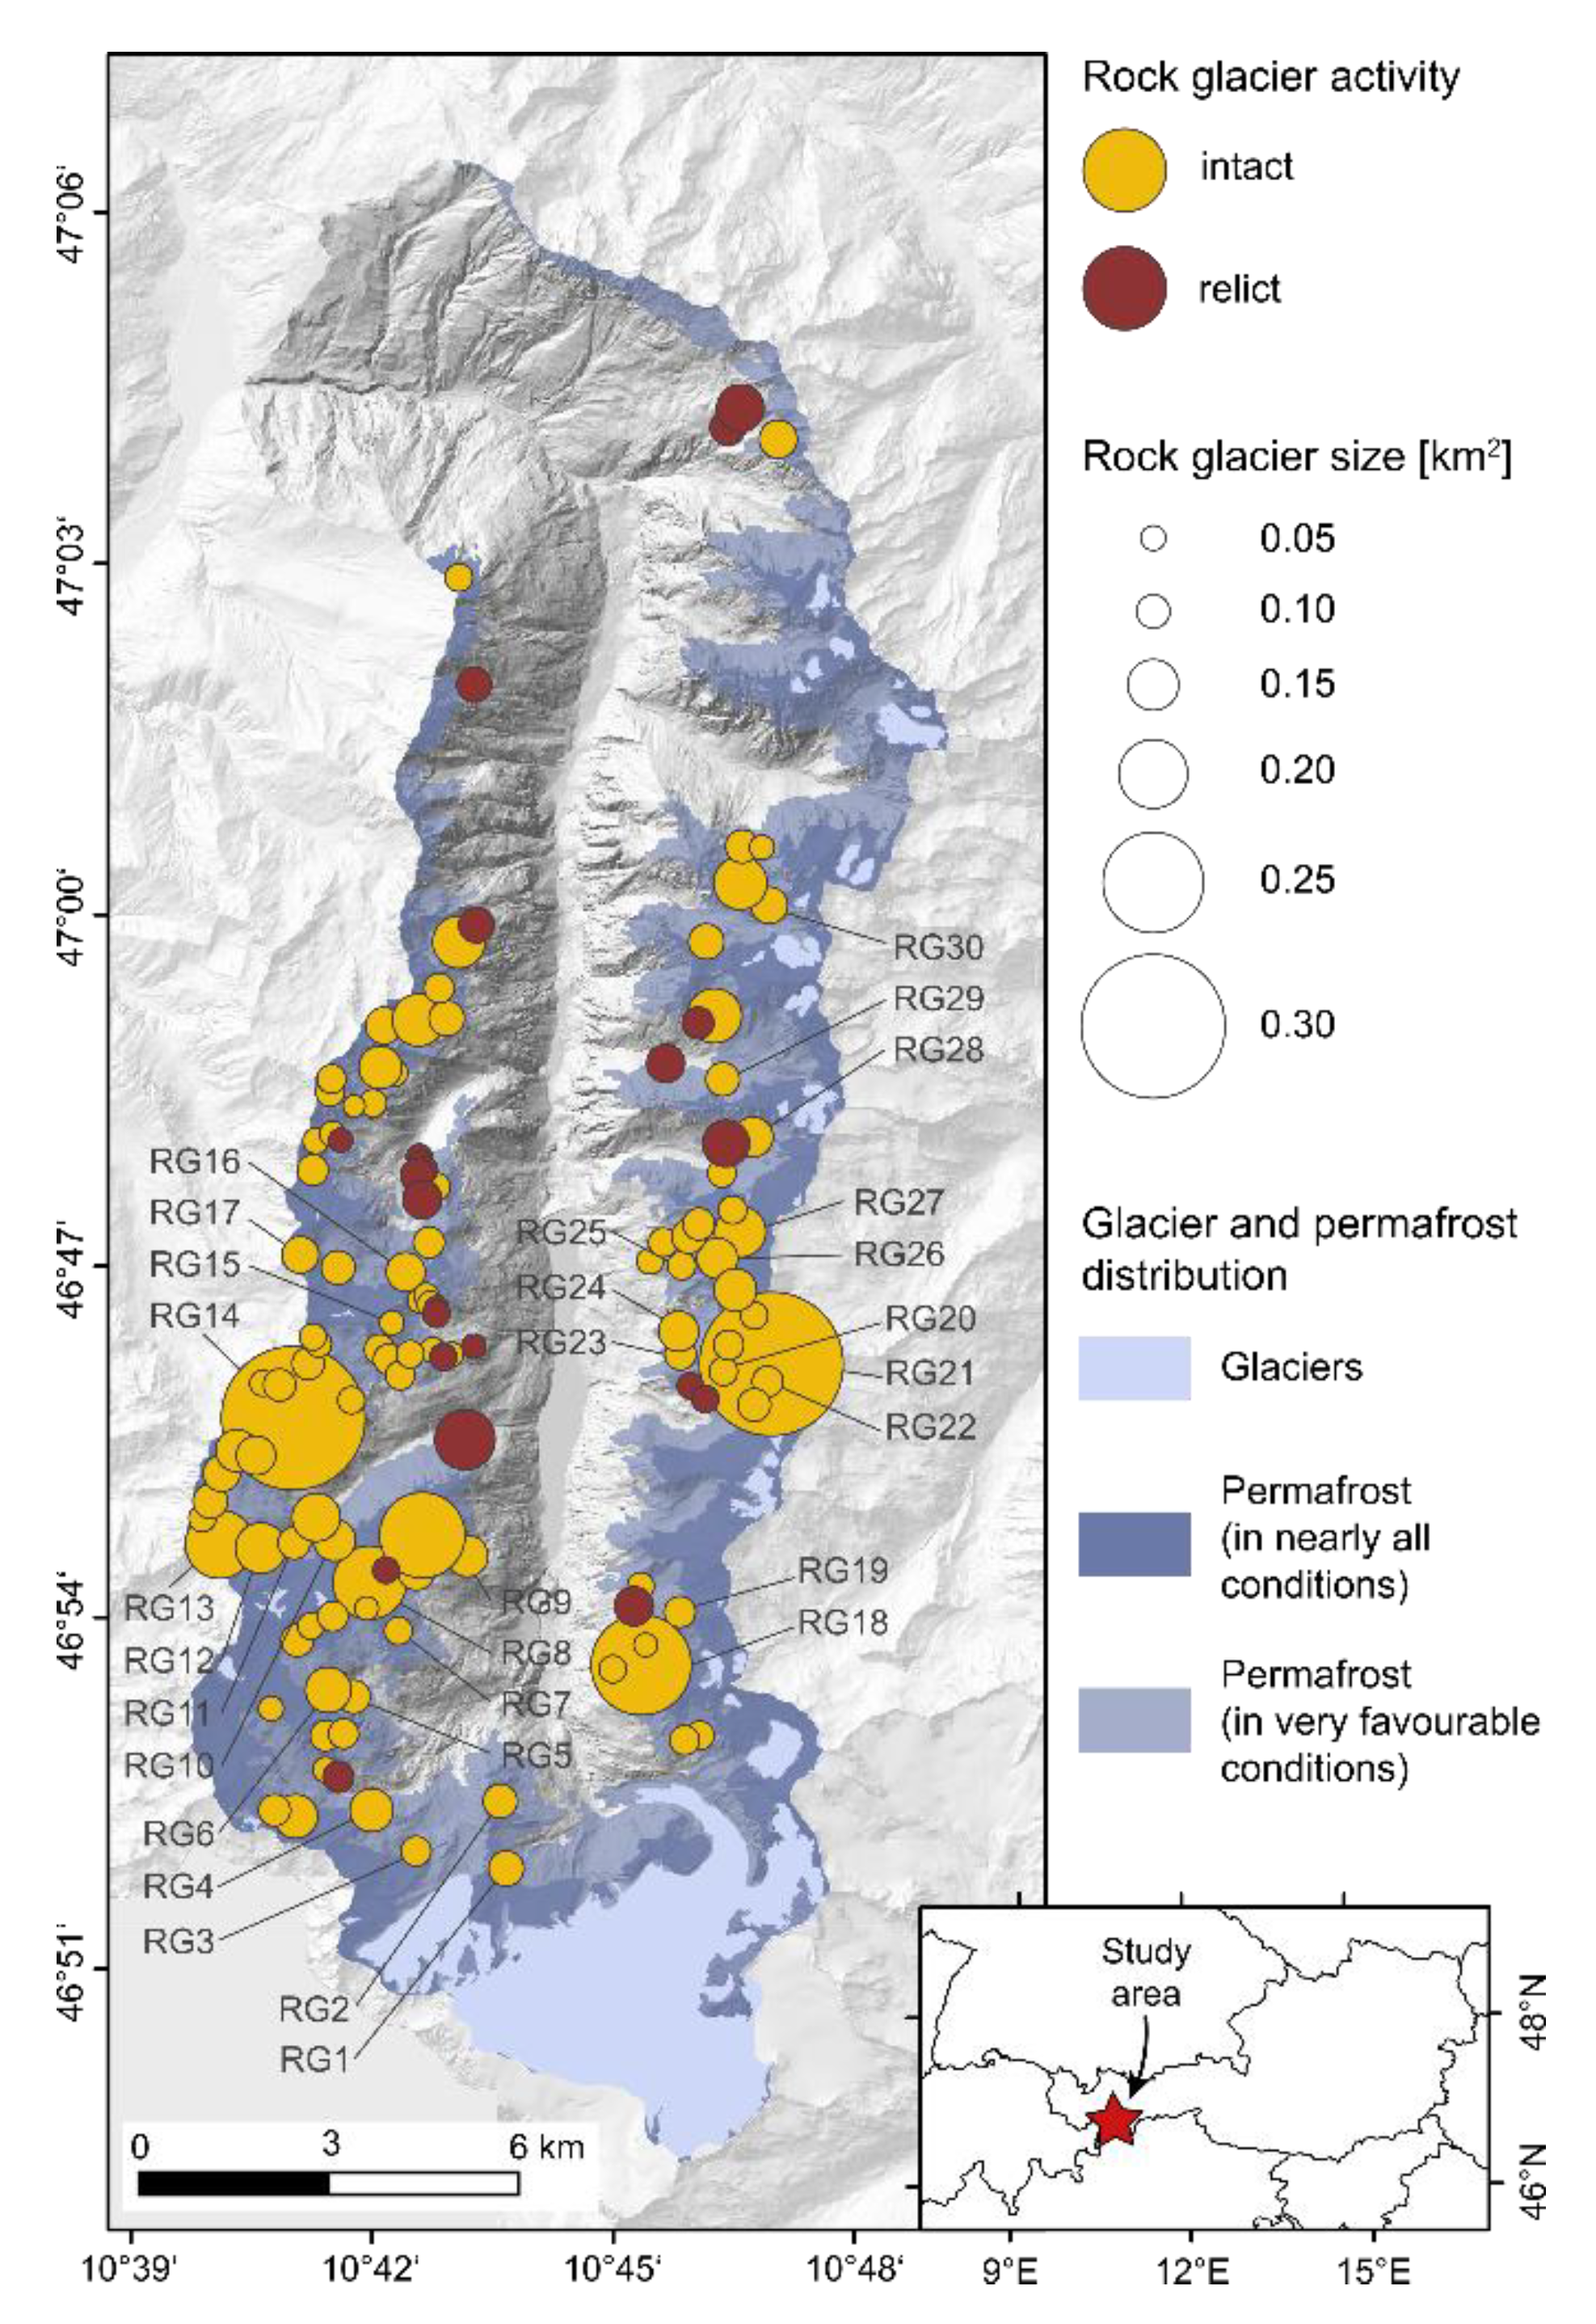
Figure 2.
Overview of geometric candidate parameters used for analysis. See Table 2 for abbreviations.
Figure 2.
Overview of geometric candidate parameters used for analysis. See Table 2 for abbreviations.
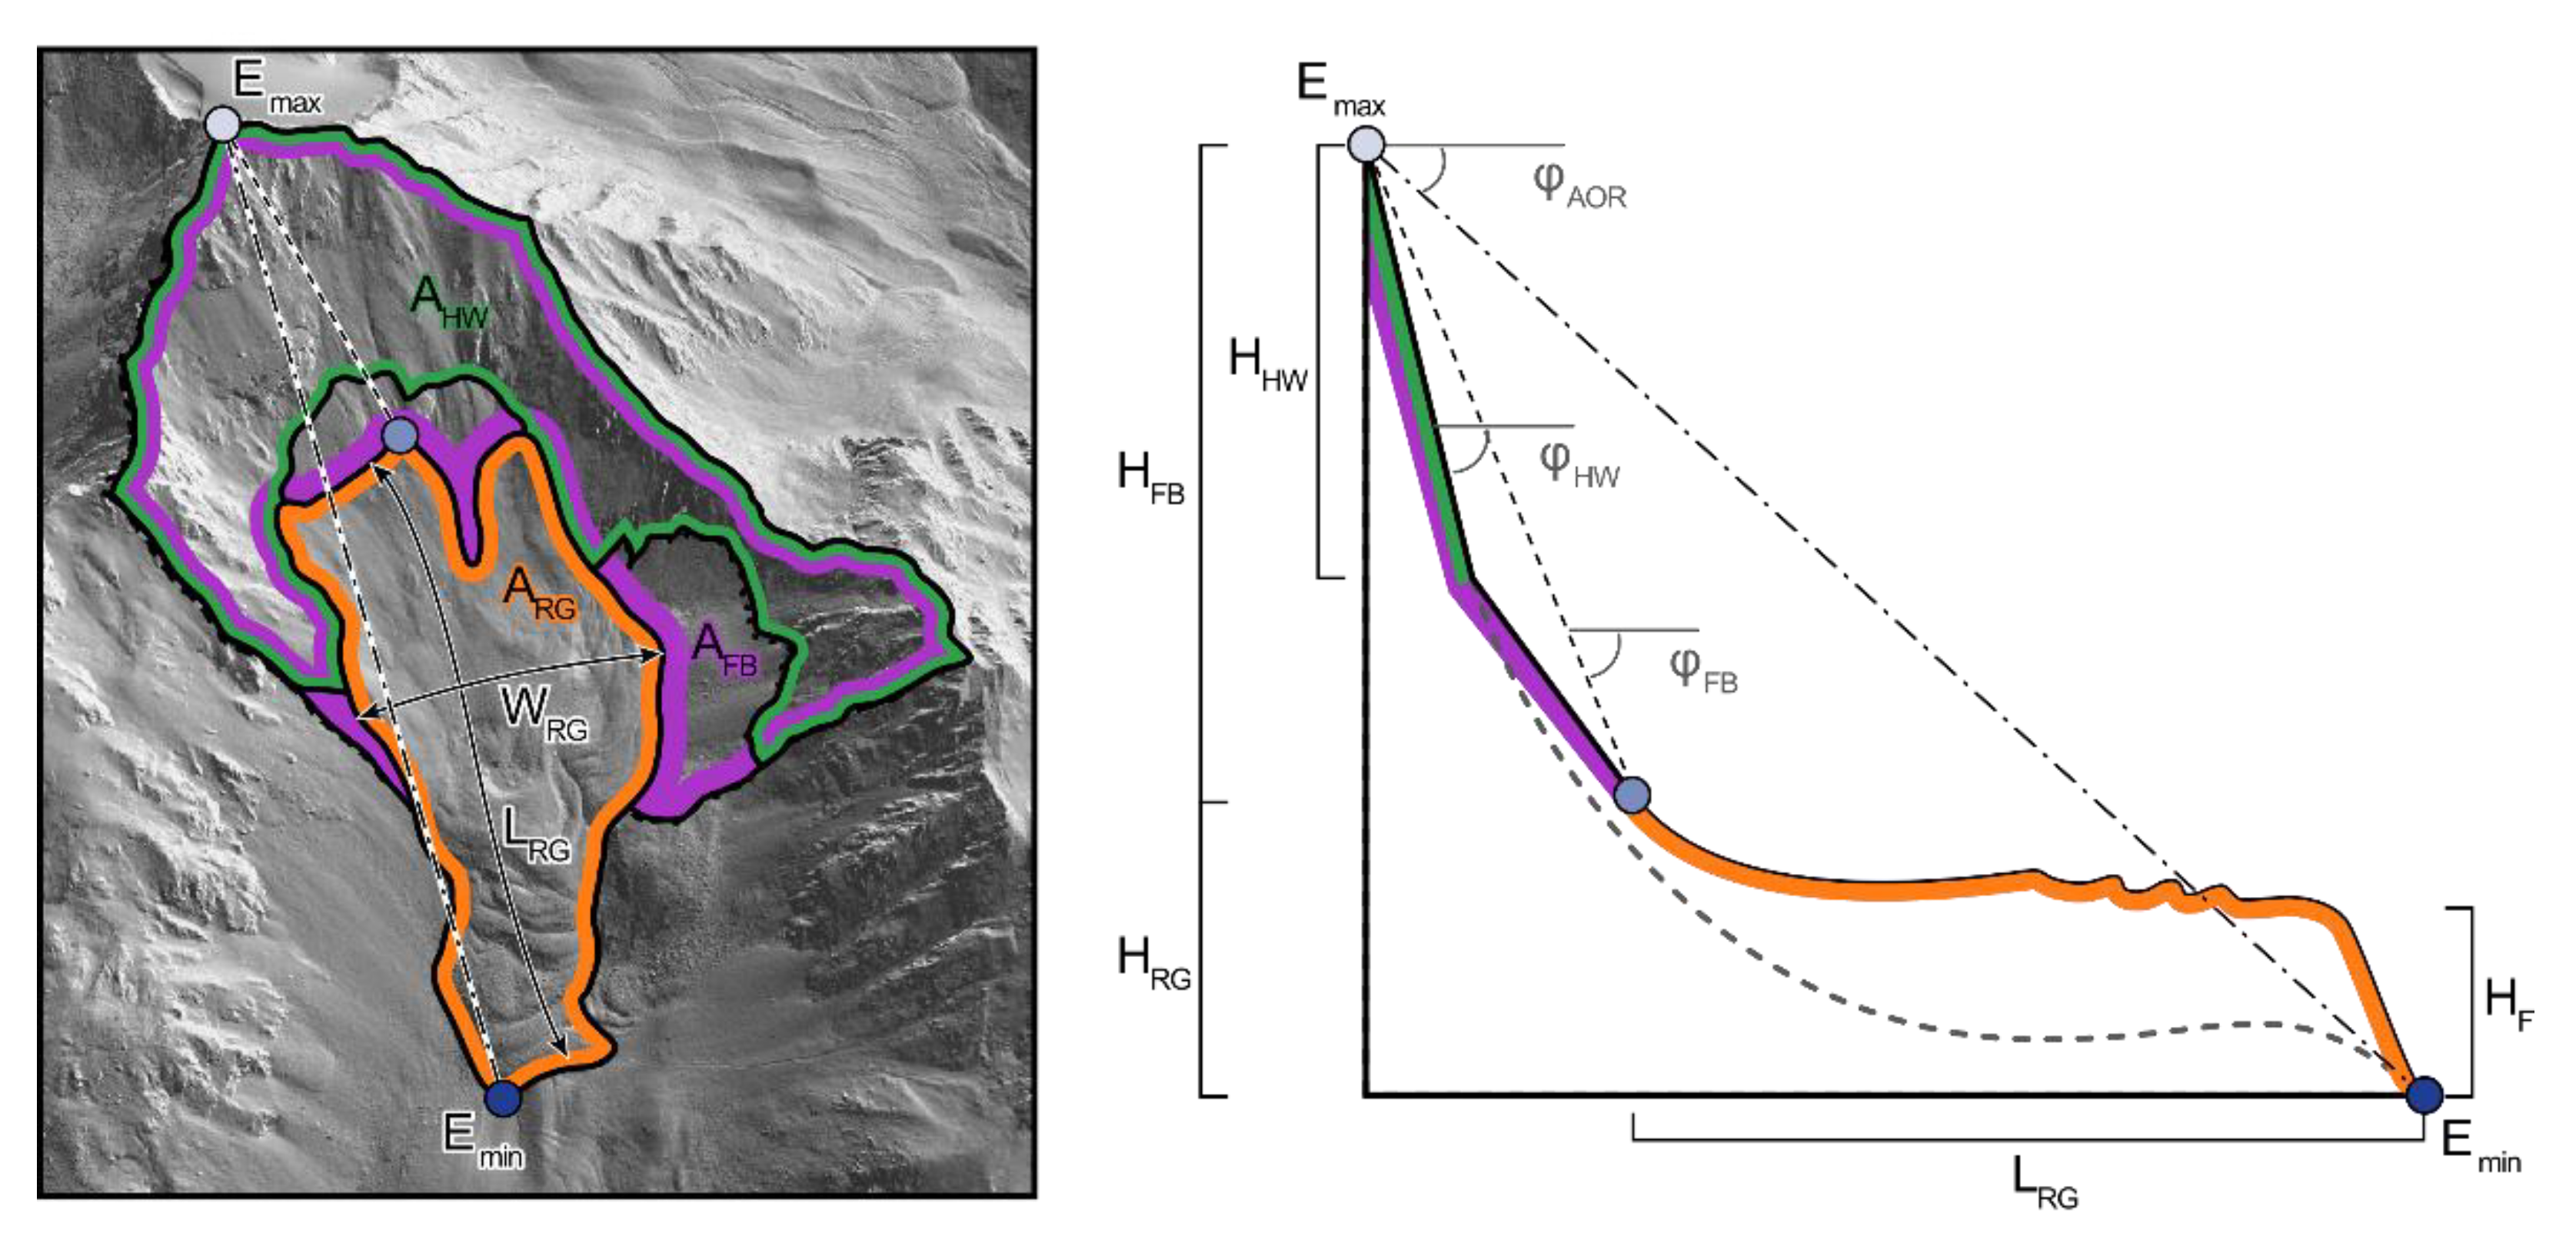
Figure 3.
Horizontal surface velocities of 30 active rock glaciers, averaged over the entire observation period (2001 resp. 2003 to 2015). Values are shown as percentiles to illustrate the heterogeneity of rock glacier velocity fields (see Figure 1 for the location of rock glaciers).
Figure 3.
Horizontal surface velocities of 30 active rock glaciers, averaged over the entire observation period (2001 resp. 2003 to 2015). Values are shown as percentiles to illustrate the heterogeneity of rock glacier velocity fields (see Figure 1 for the location of rock glaciers).
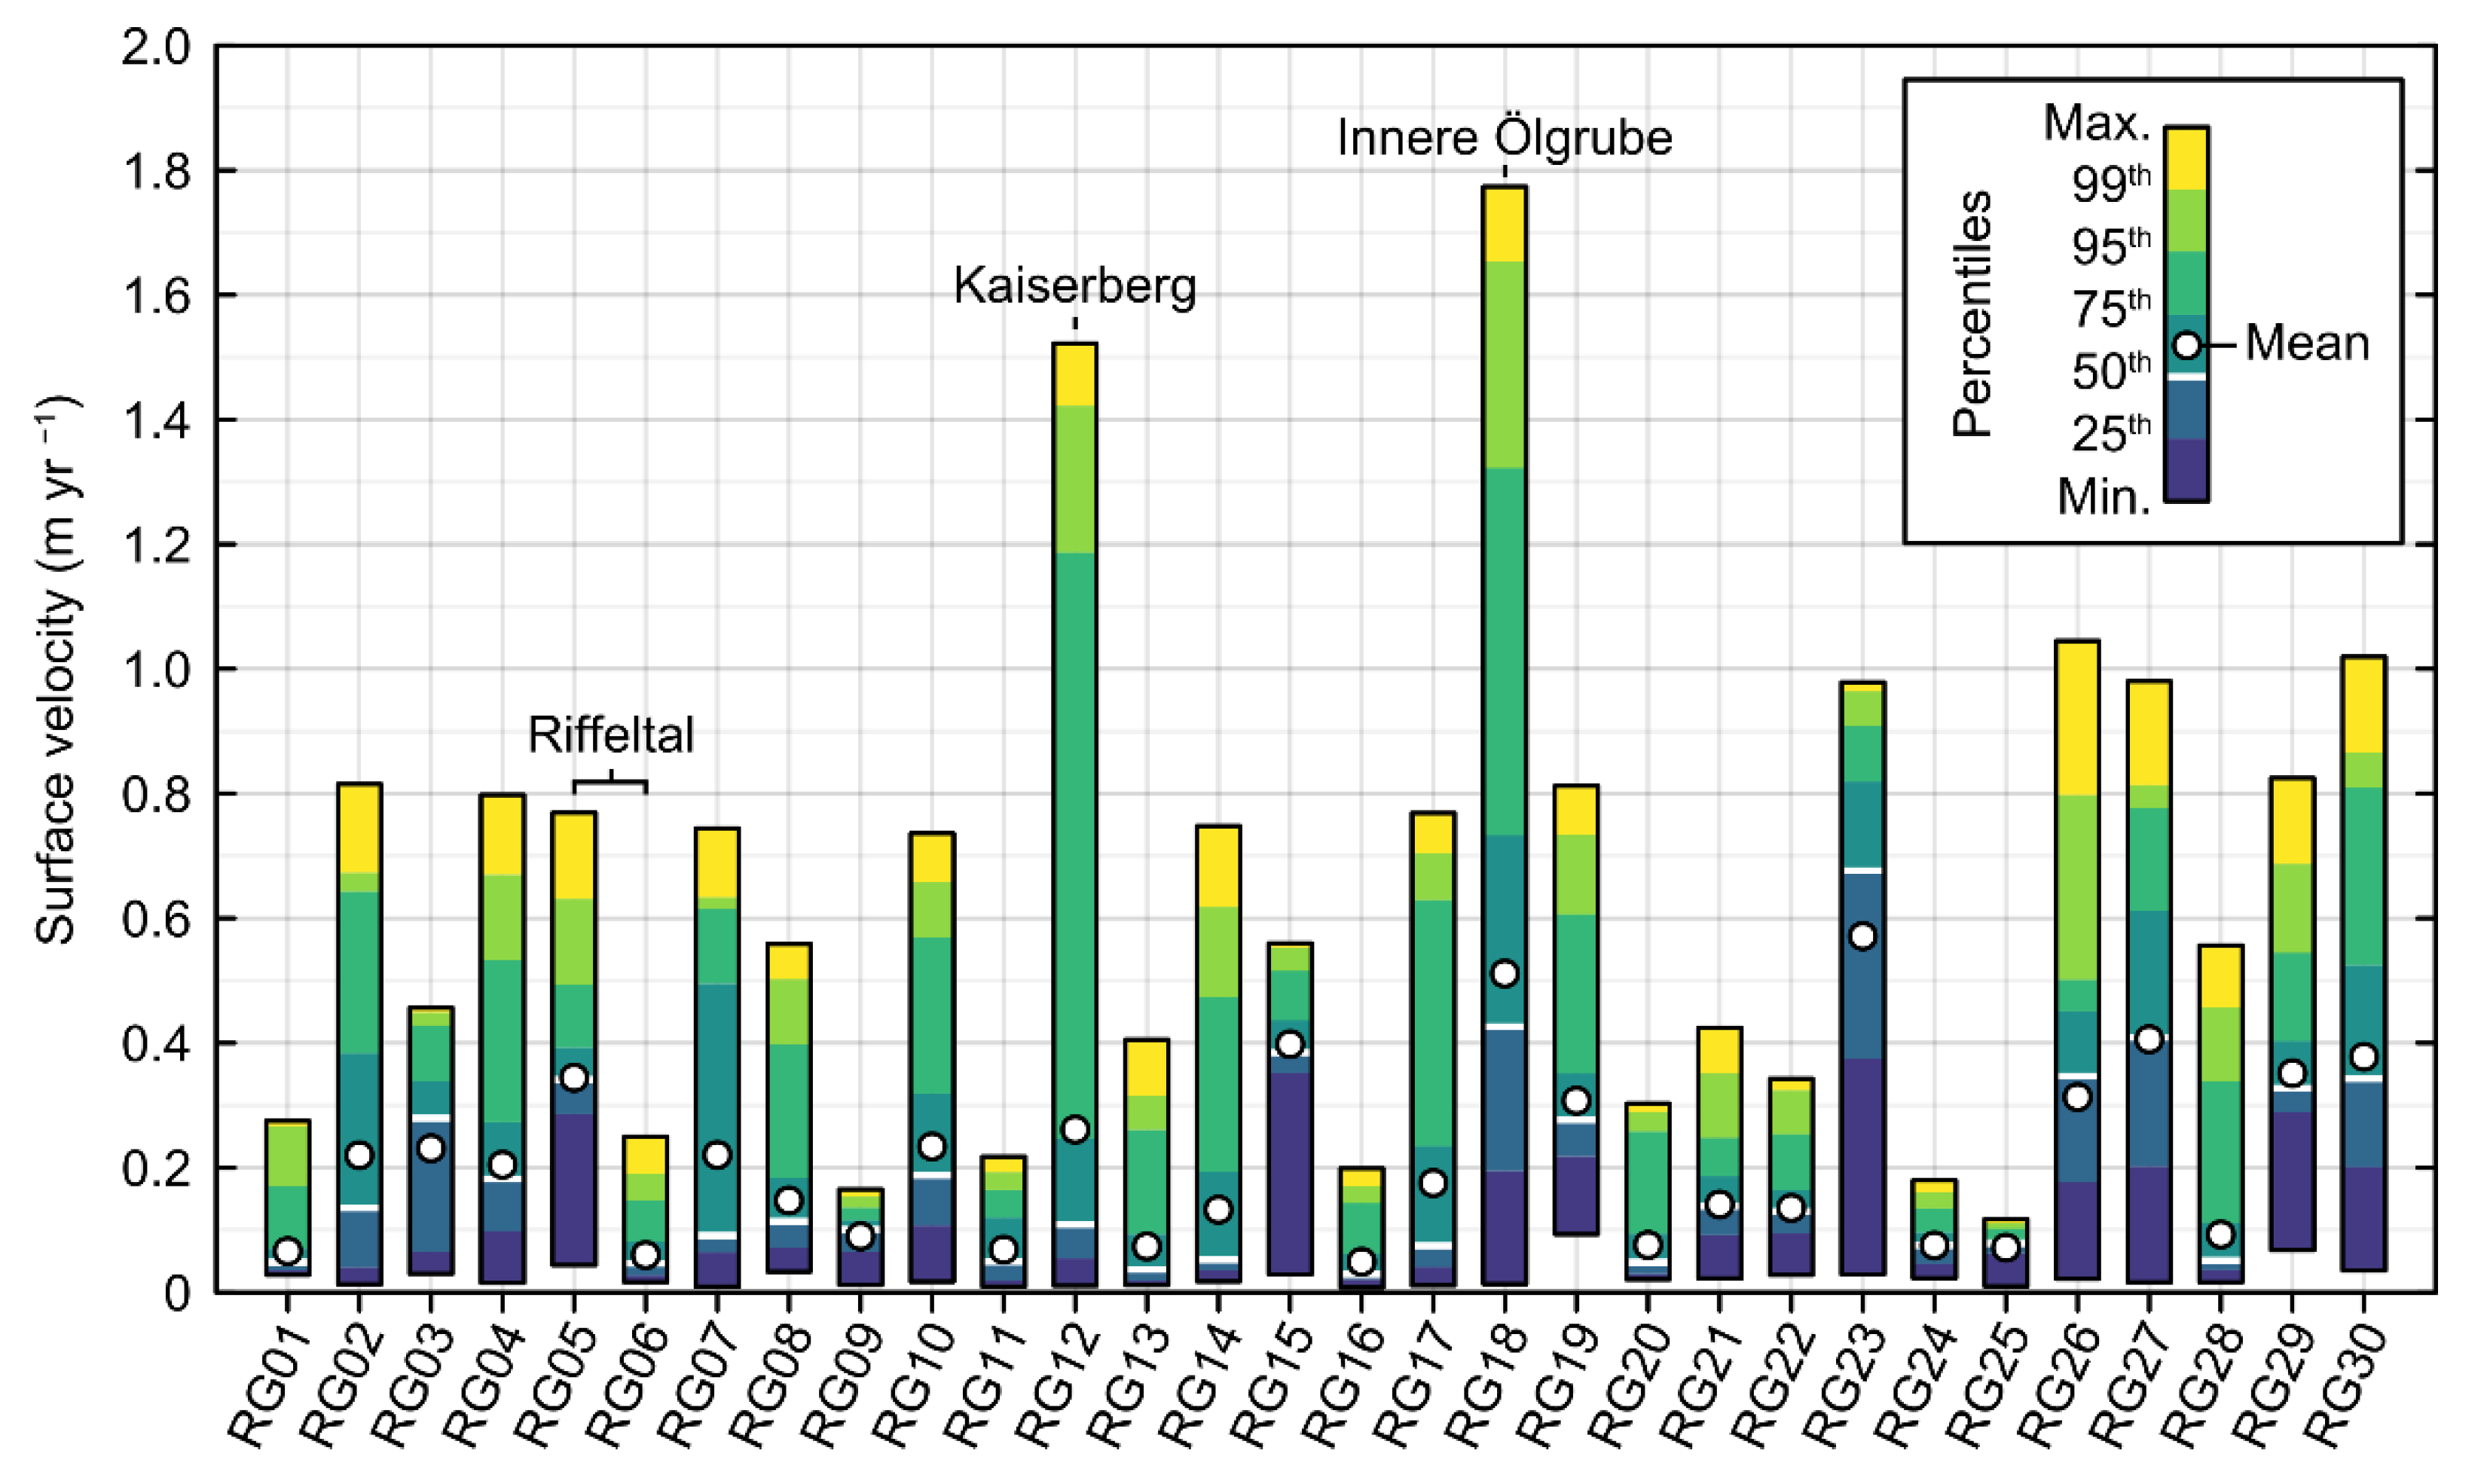
Figure 4.
Horizontal surface velocity fields of selected rock glaciers: (A) Innere Ölgrube rock glacier (RG18), (B) Kaiserberg rock glacier (RG12) and (C) unnamed rock glacier RG14.
Figure 4.
Horizontal surface velocity fields of selected rock glaciers: (A) Innere Ölgrube rock glacier (RG18), (B) Kaiserberg rock glacier (RG12) and (C) unnamed rock glacier RG14.
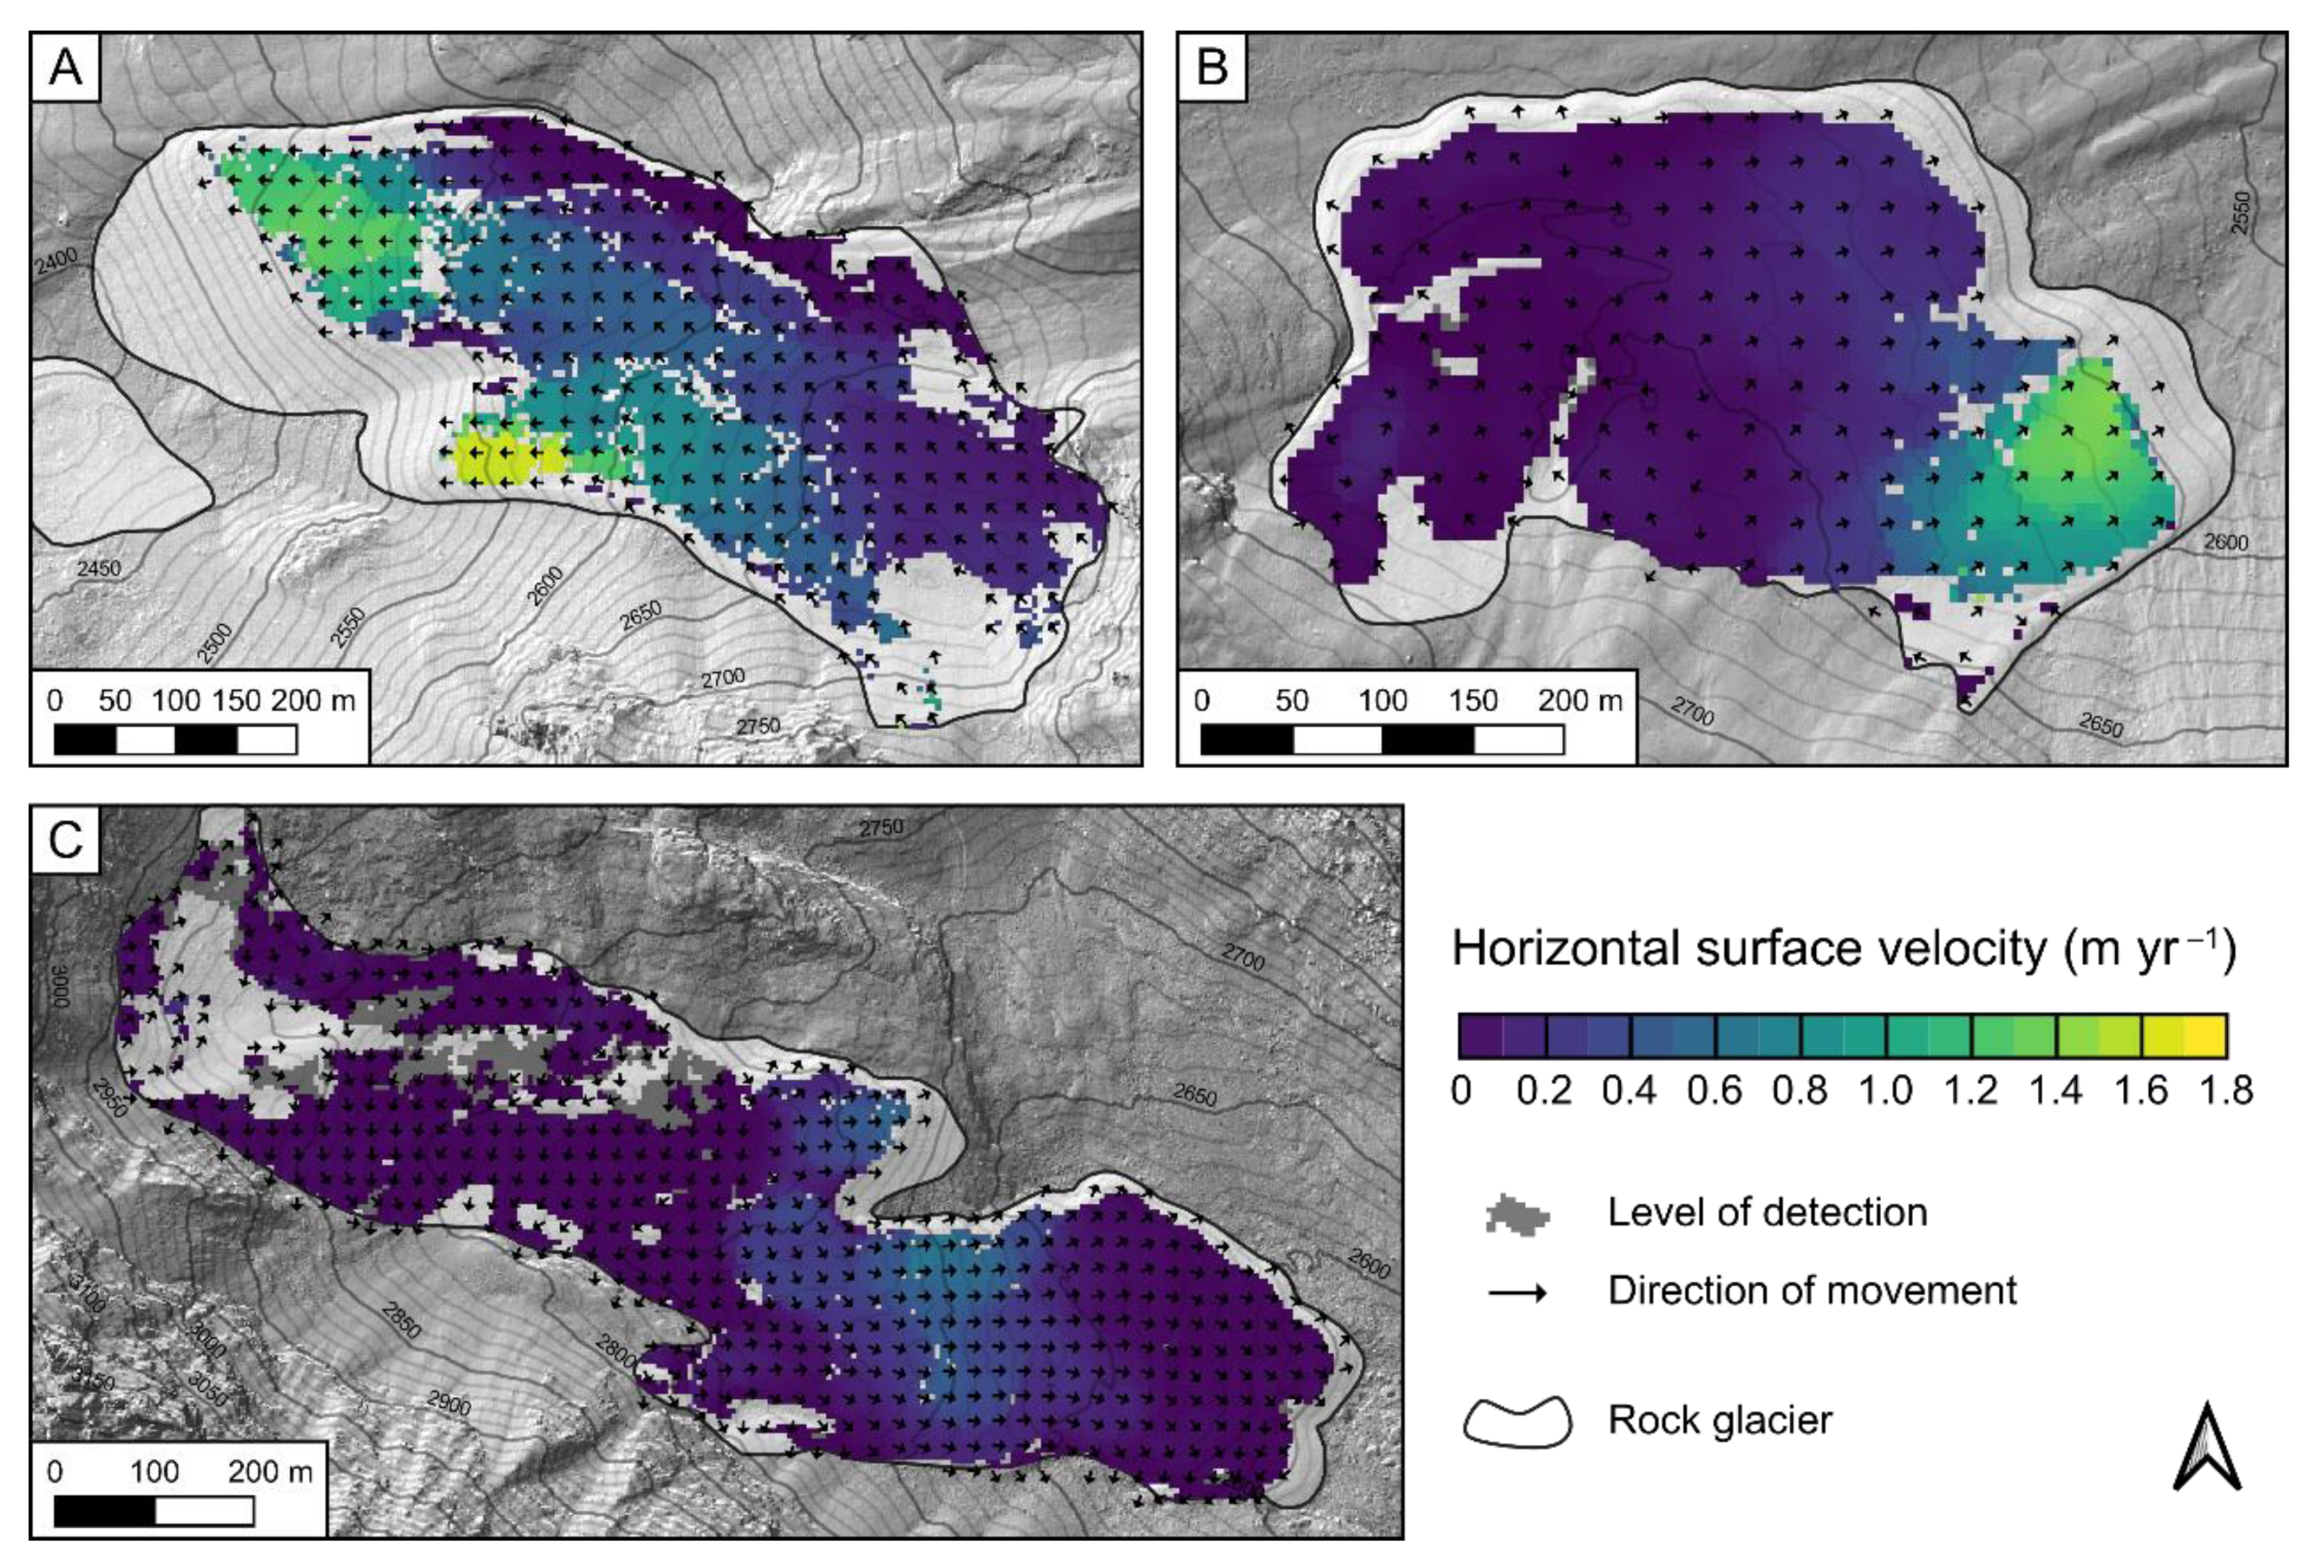
Figure 5.
Distribution of active, inactive and relict rock glaciers in the Kaunertal catchment, shown as (A) absolute numbers and (B) percentage share of the total surface area. Upper panel groups rock glaciers in four aspect classes (North, East, South, West), lower panel shows rock glaciers dissolved for elevation bins of 100 m.
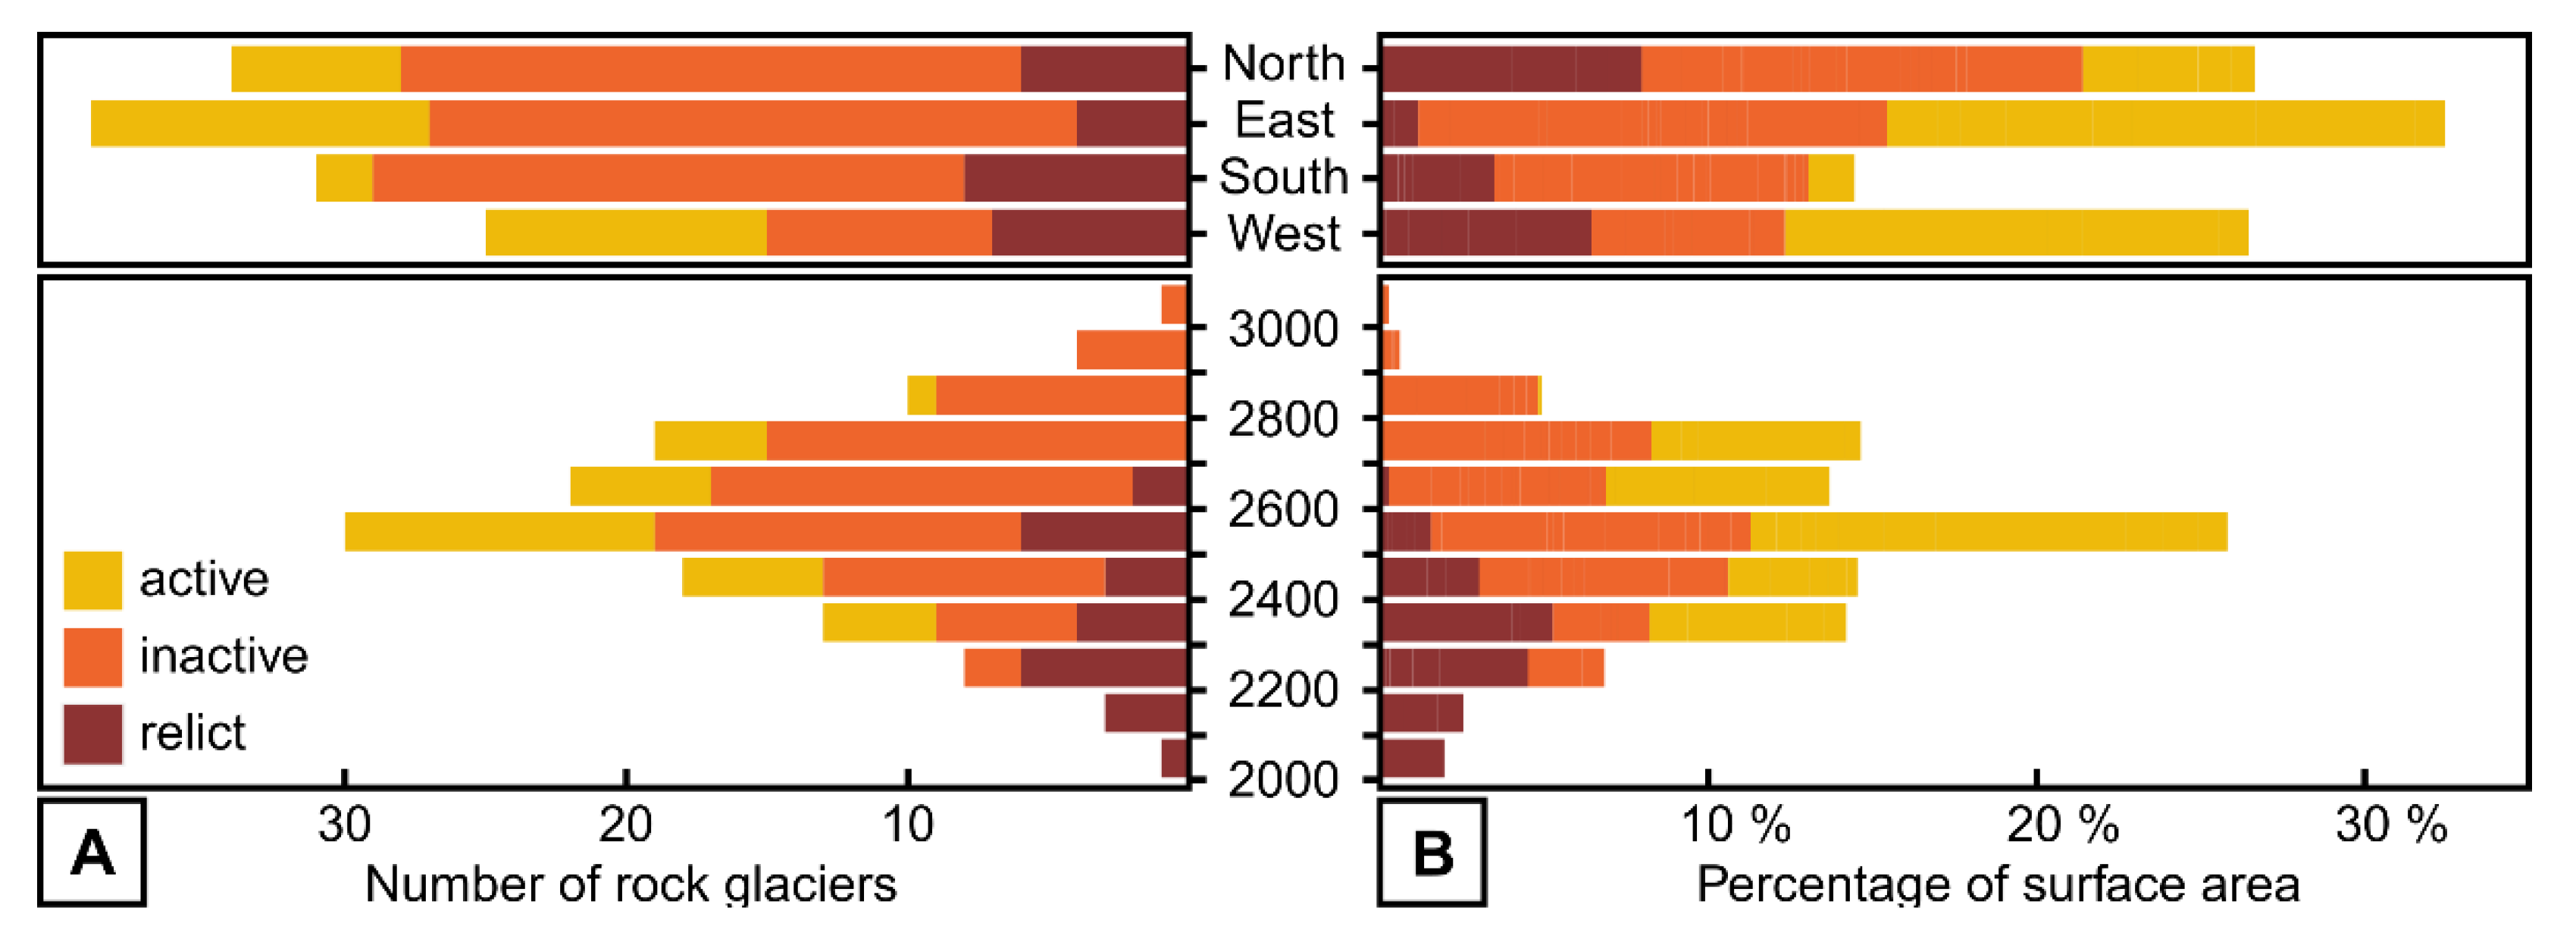
Figure 6.
Scatterplots of horizontal surface velocities versus selected candidate parameters derived for individual rock glaciers and their contributing areas. Colour coded points represent velocity percentiles for each individual active rock glacier (n = 30), solid lines show significant (p ≤ 0.05) iteratively reweighted least squares (IRLS) regression lines.
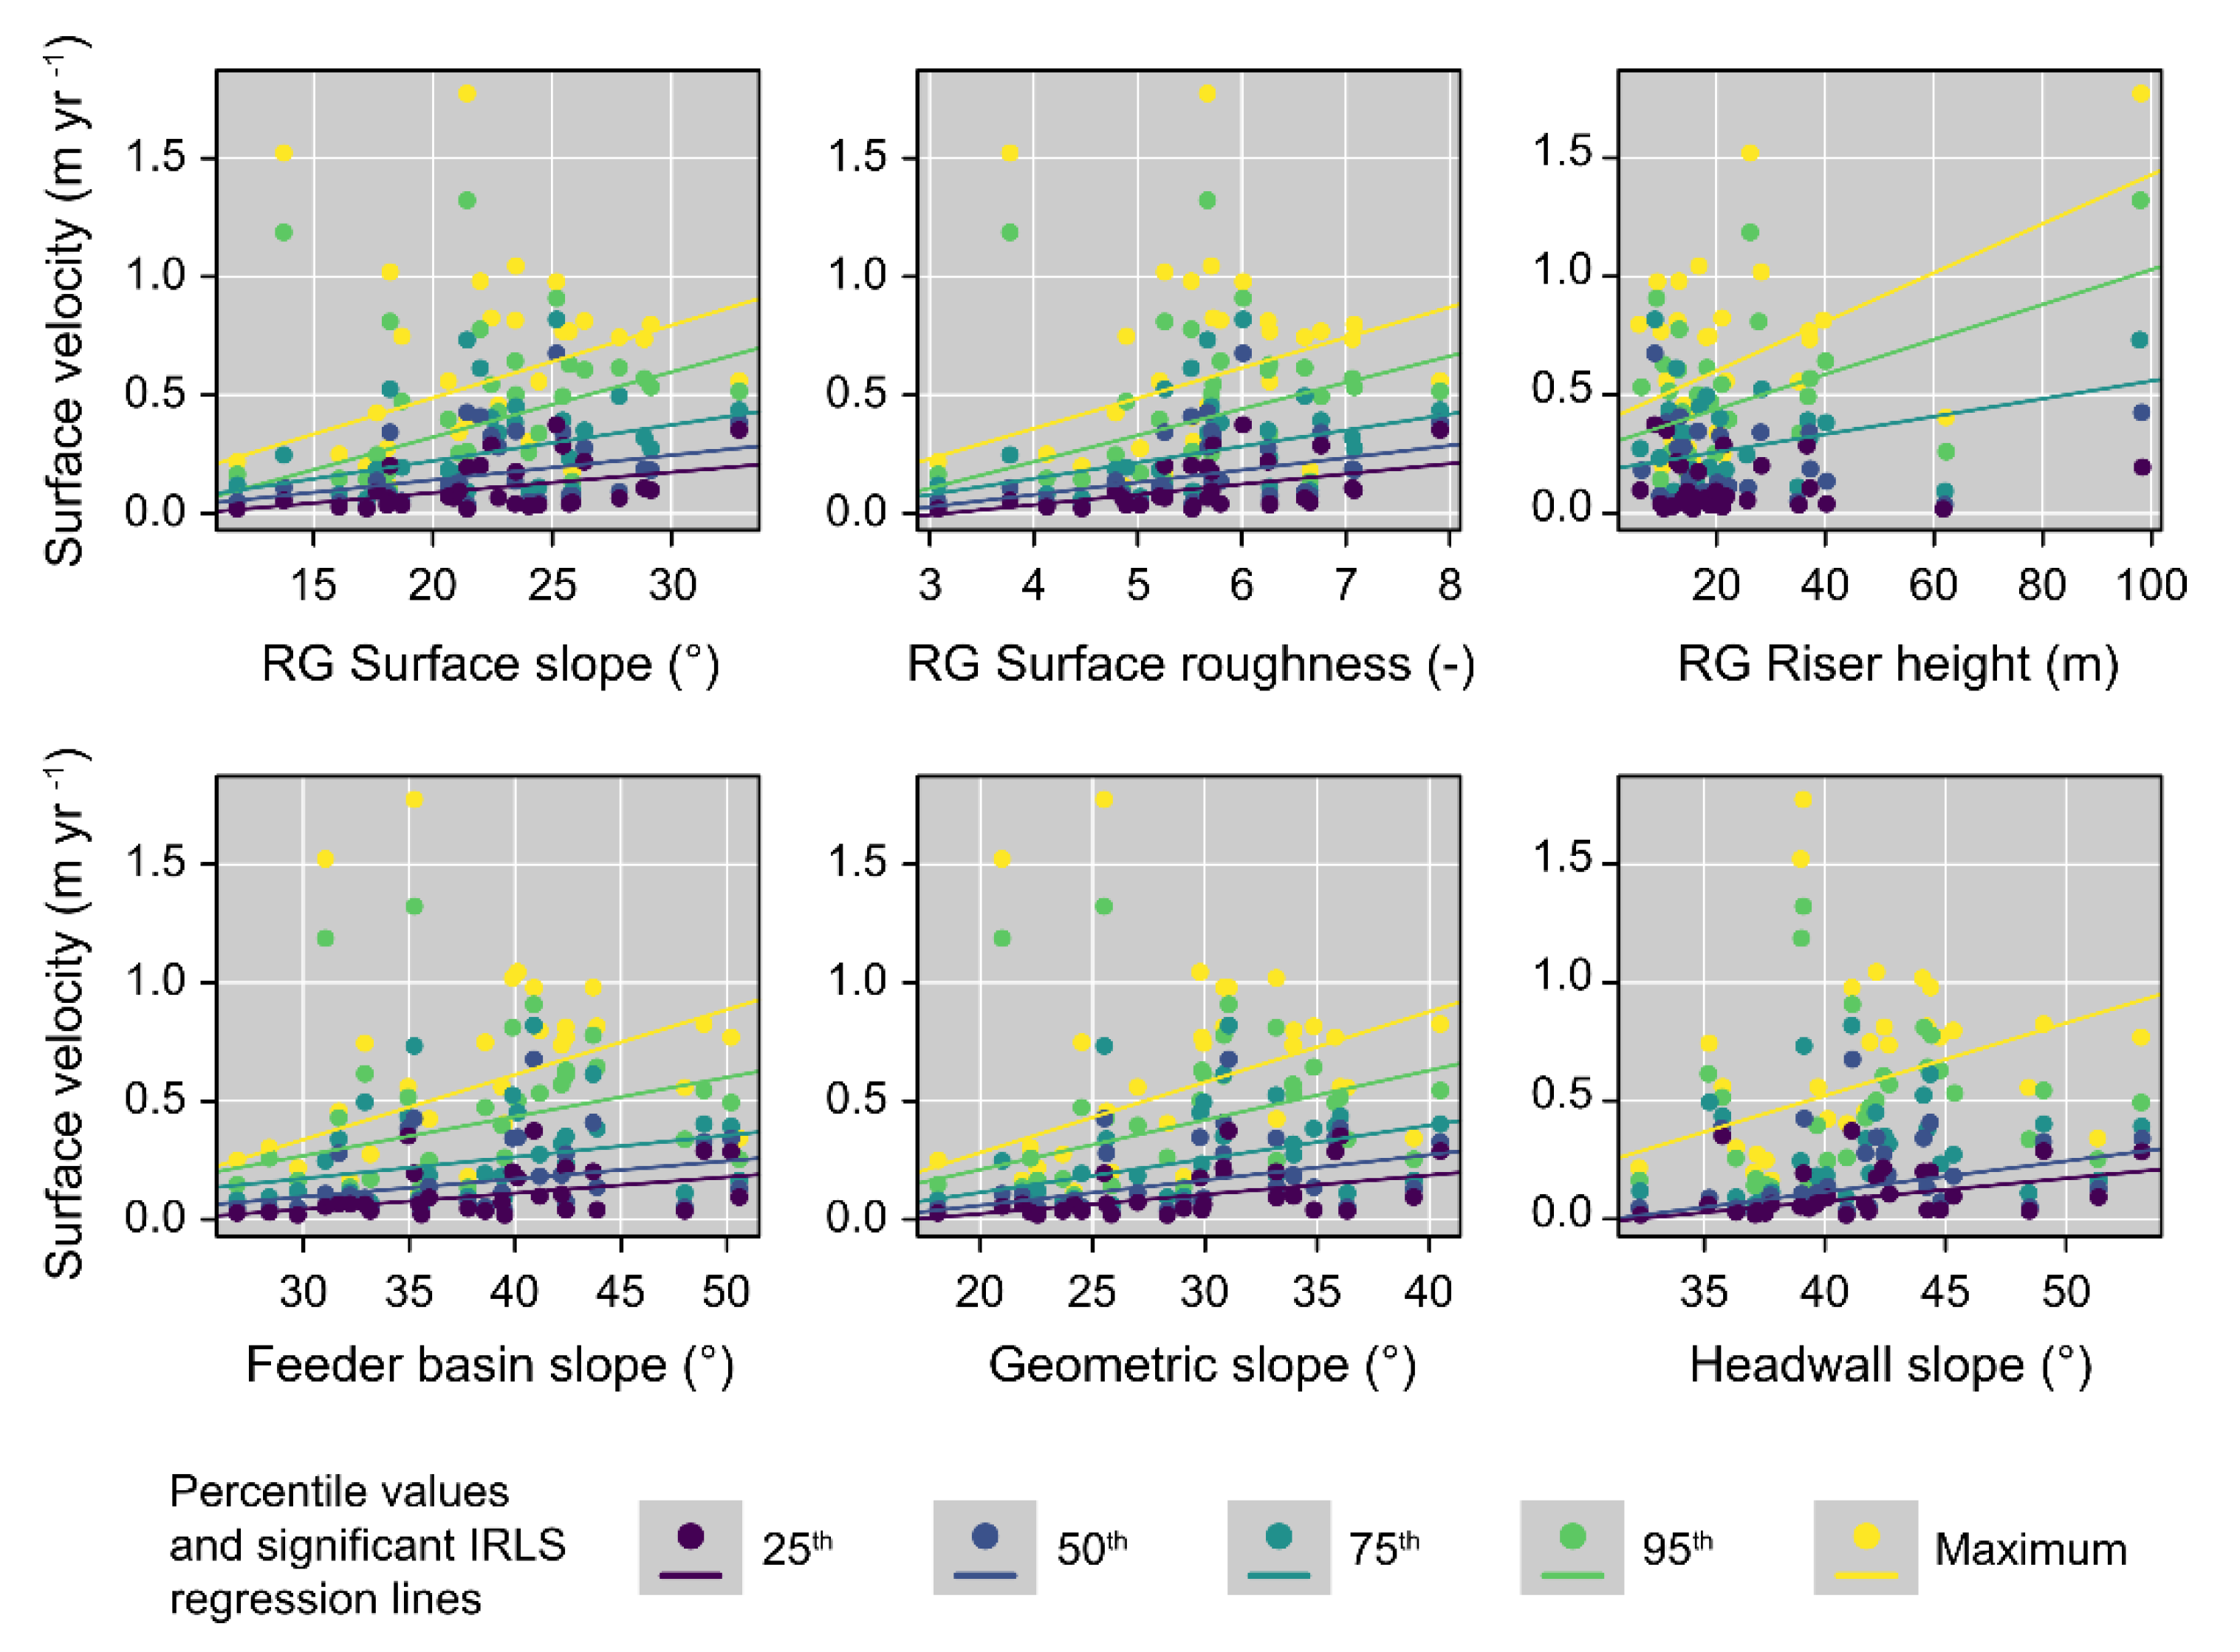
Figure 7.
Conditional density distributions of rock glacier activity in relation to selected terrain parameters. Yellow and red areas correspond to conditional densities of active and inactive features, respectively; black points represent observations. Black lines and shaded areas show probability predictions and 95% confidence intervals from binary logistic regressions with either (A) logarithmic transforms or (B) polynomial transforms (two degrees of freedom) of the predictor. Only significant links (p ≤ 0.05) are shown.

Figure 8.
Receiver operation characteristic (ROC) curves for random forest (RF) and logistic regression (LR) models on rock glacier activity, based on either a full parameter set or a parameter subset (noted in subscript, see Table 2). Model performance metrics are given as the area under the ROC curve (AUC). TPR = true positive rate; FPR = false positive rate.
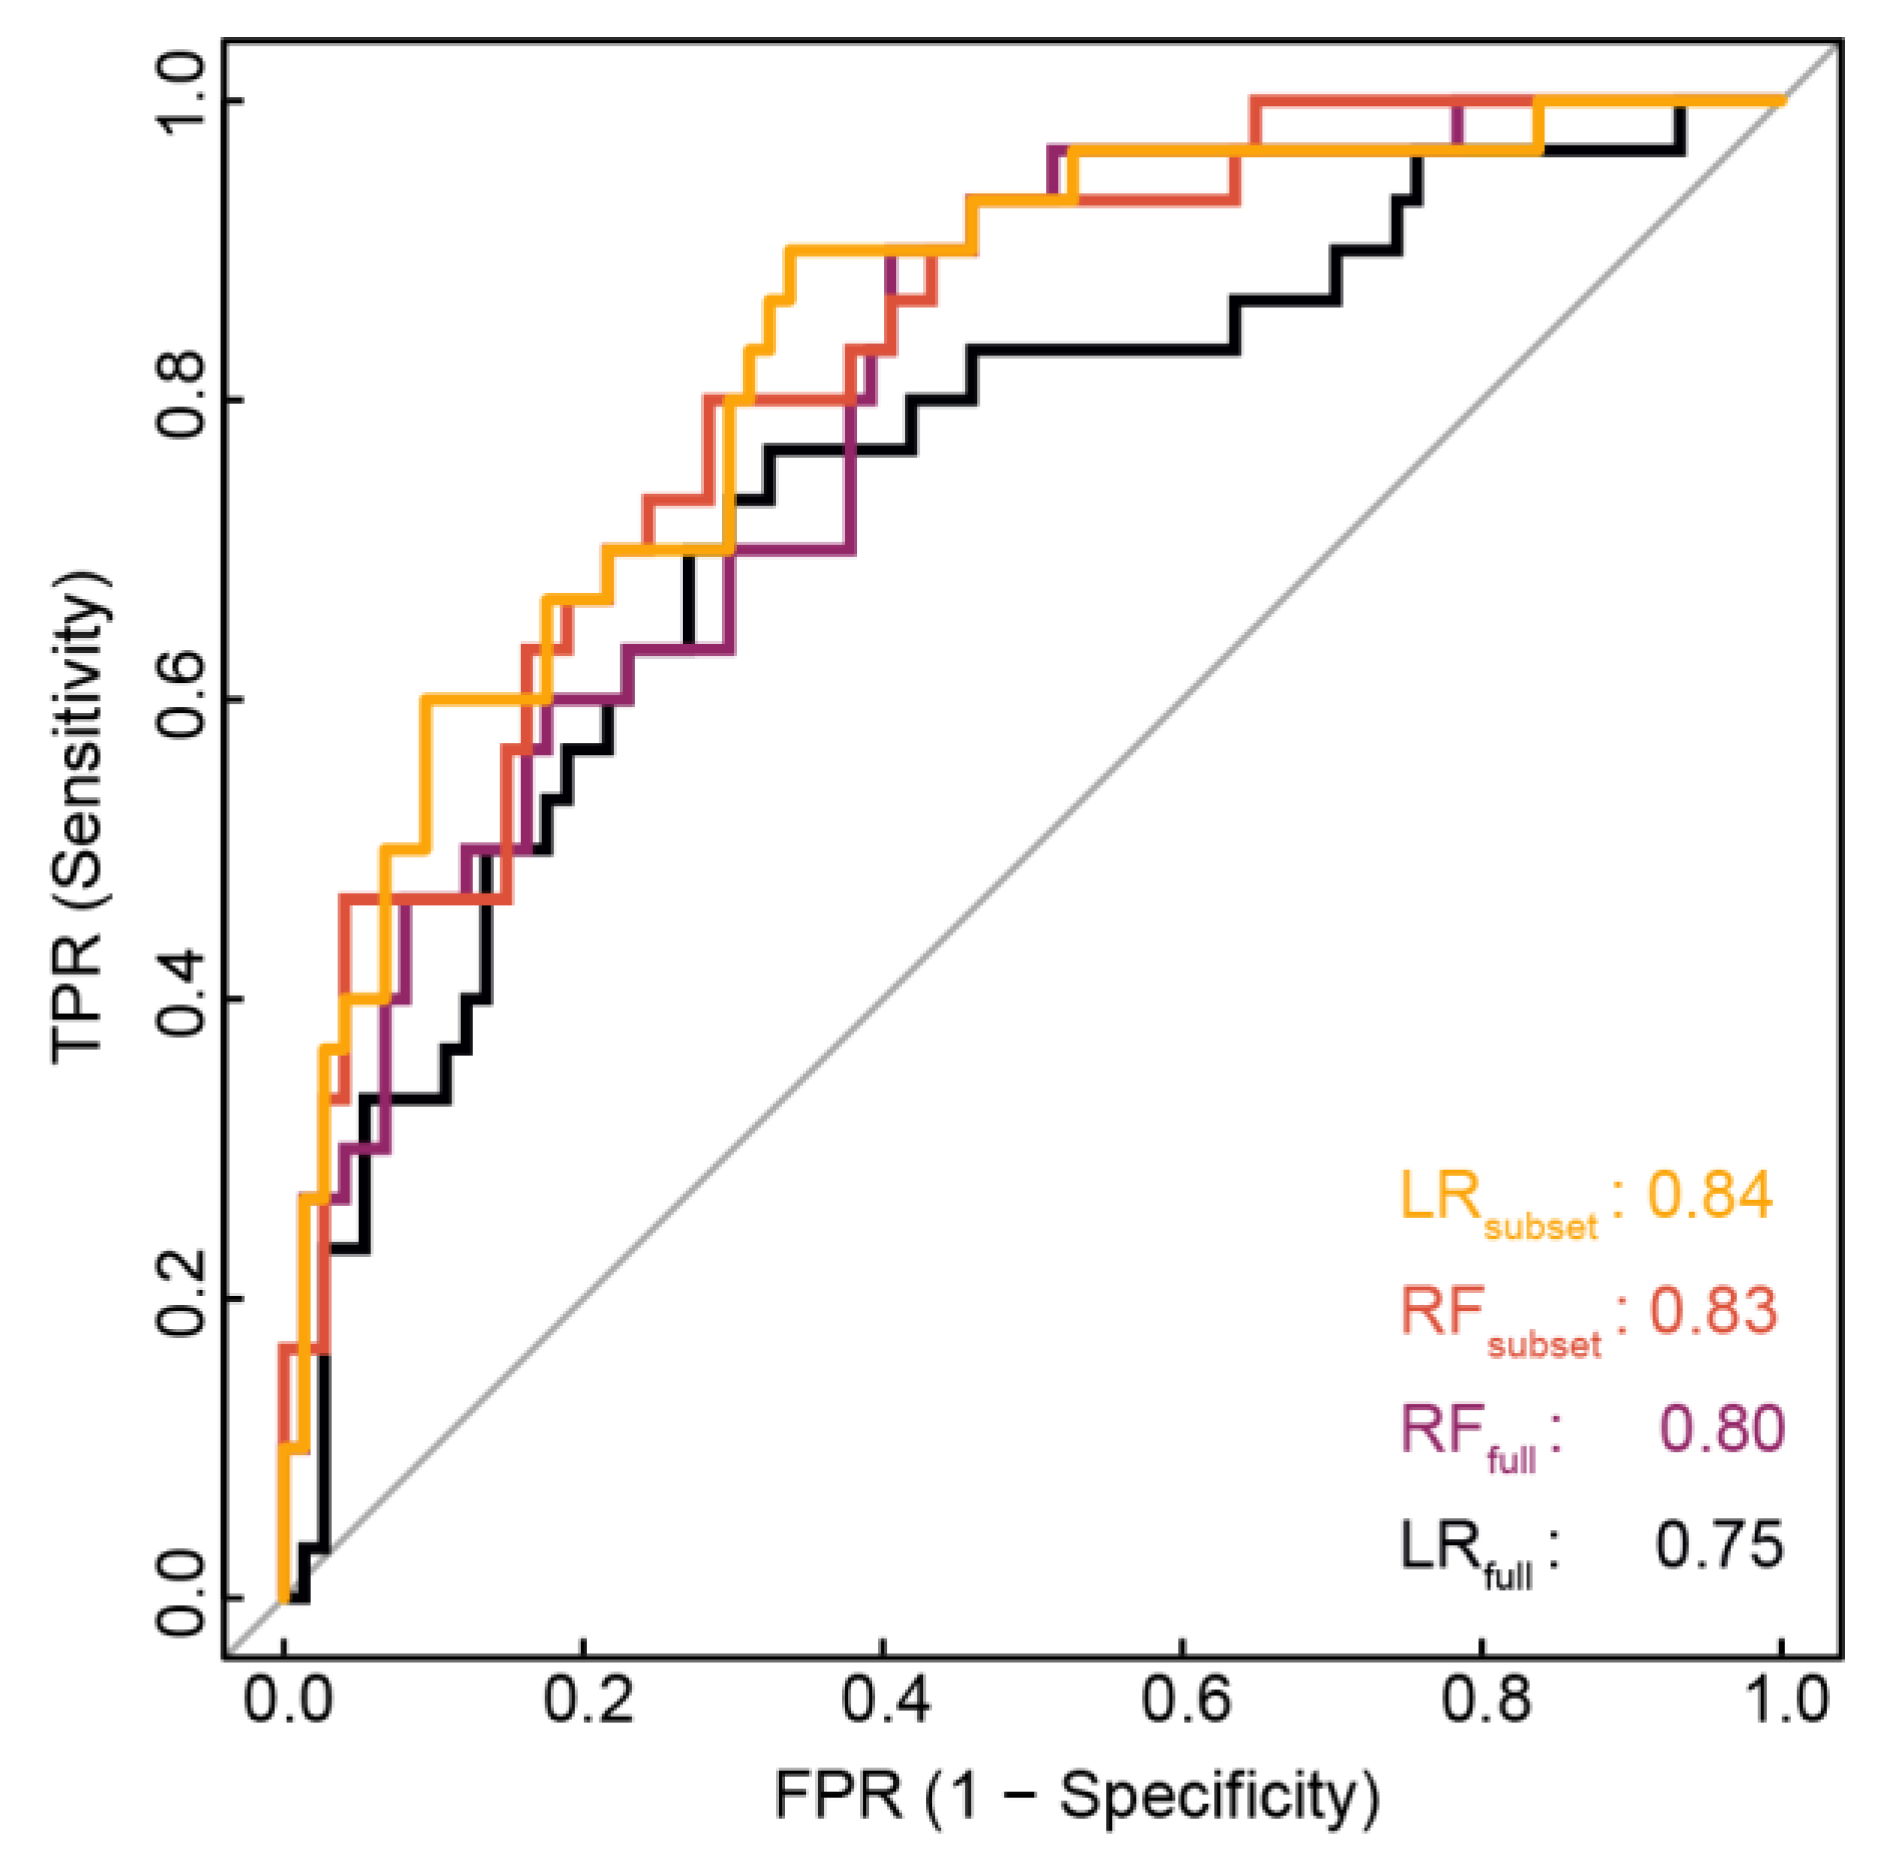
Figure 9.
Variable importance within random forest classification models of rock glacier activity, shown as mean decrease in Gini coefficient. Results are shown for models derived from full parameter set (green lines and points) and parameter subset (blue lines and triangles), respectively. Note that the mean decrease in Gini coefficient is a relative measure and values are not comparable between the two models. Abbreviations are: RG = rock glacier, FB = Feeder basin, HW = headwall.
Figure 10.
Horizontal surface velocities on the southern lobe of the Kaiserberg rock glacier (RG12) (upper panel) in relation to deviations in mean annual air temperature (MAAT) from mean over entire time-series (lower panel). Average rock glacier velocities were tracked in image-pairs from airplane survey flights for the epochs 2003 to 2010 and 2010 to 2015 (dark green) and in a combination of airplane survey data and UAV-derived imagery for 2015 to 2018 (dark red), respectively. Air temperature is shown as the deviation from MAAT over the entire observation period of the respective station; data from Weißsee meteorological station, Kaunertal courtesy of Tiroler Wasserkraft AG (TIWAG) and data from Obergurgl meteorological station, Ötztal courtesy of Zentralanstalt für Meteorologie und Geodynamik (ZAMG).
Figure 11.
Vertical surface changes of the Kaiserberg rock glacier (RG12), illustrated as a DEM of Difference (DoD) between 2010 and 2018 (left panel) and its frequency distribution (upper-right panel). For comparison, changes between 2006 and 2010 are shown as well (lower-right panel). Most elevation gains can be attributed to the advance of the eastern rock glacier front, while areas of surface lowering indicate subsidence through permafrost degradation and extension-conditioned thinning.
Table 1.
Available aerial imagery for the Kaunertal rock glaciers between 2001 and 2018. Coverage is given in m2 and as a percentage share of the rock glacier inventory.
Table 1.
Available aerial imagery for the Kaunertal rock glaciers between 2001 and 2018. Coverage is given in m2 and as a percentage share of the rock glacier inventory.
| Period | Acquisition | Ground Resolution | Coverage of Inventory | |
|---|---|---|---|---|
| 2001–2003 | 2001-09-03 2003-07-19 2003-09-05 | 0.2 m * | 39,994 m2 1,795,254 m2 5,884,029 m2 | 0.5% 23.3% 76.2% |
| 2005–2009 | 2005-09-06 2007-09-24 2009-09-08 2009-09-09 | 0.2 m * | 39,994 m2 1,996,841 m2 1,338,780 m2 4,343,662 m2 | 0.5% 25.9% 17.3% 56.3% |
| 2010 | 2010-07-31 2010-09-20 | 0.2 m * | 5,135,343 m2 2,583,934 m2 | 66.5% 33.5% |
| 2015 | 2015-08-03 2015-08-26 2015-08-27 2015-08-28 | 0.2 m * | 2,495,913 m2 1,622,088 m2 3,547,282 m2 53,994 m2 | 32.3% 21.0% 46.0% 0.7% |
| 2018 | 2018-09-28 | 0.05 m † | 126,002 m2 | 1.6% |
* Orthoimagery provided by the government of Tyrol (Land Tirol). † SfM-MVS derived orthophoto of the Kaiserberg rock glacier (RG12) from acquisition using a UAV-System.
Table 3.
R2-values for iteratively reweighted least squares (IRLS) regression on selected parameters for different percentiles of velocity distribution. Values are only given for slope coefficients significantly different from zero (p-value ≤ 0.05). The direction of correlation is indicated in parentheses.
| Velocity Percentiles | |||||
|---|---|---|---|---|---|
| Parameters | 25th | 50th | 75th | 95th | Maximum |
| RG east exposedness | 0.38 (−)** | 0.18 (−) | |||
| RG slope | 0.19 (₊) | 0.16 (₊) | 0.21 (₊) | 0.43 (₊) | 0.26 (₊)* |
| RG riser height | 0.14 (₊) | 0.21 (₊) | 0.25 (₊)* | ||
| RG height | 0.19 (₊) | ||||
| RG roughness | 0.22 (₊)* | 0.19 (₊) | 0.19 (₊) | 0.30 (₊)* | 0.20 (₊) |
| FB area | 0.16 (₊) | ||||
| FB height | 0.14 (₊) | ||||
| FB slope | 0.25 (₊)* | 0.16 (₊) | 0.14 (₊) | 0.24 (₊)* | 0.28 (₊)** |
| Geometric slope | 0.31 (₊)* | 0.27 (₊)* | 0.32 (₊)* | 0.30 (₊)* | 0.35 (₊)** |
| HW area | 0.15 (₊) | ||||
| HW slope | 0.35 (₊)** | 0.40 (₊)** | 0.28 (₊)* | ||
* p-value ≤ 0.01; ** p-value ≤ 0.001.
© 2019 by the authors. Licensee MDPI, Basel, Switzerland. This article is an open access article distributed under the terms and conditions of the Creative Commons Attribution (CC BY) license (http://creativecommons.org/licenses/by/4.0/).
Share and Cite
MDPI and ACS Style
Groh, T.; Blöthe, J.H. Rock Glacier Kinematics in the Kaunertal, Ötztal Alps, Austria. Geosciences 2019, 9, 373. https://doi.org/10.3390/geosciences9090373
AMA Style
Groh T, Blöthe JH. Rock Glacier Kinematics in the Kaunertal, Ötztal Alps, Austria. Geosciences. 2019; 9(9):373. https://doi.org/10.3390/geosciences9090373
Chicago/Turabian StyleGroh, Till, and Jan Henrik Blöthe. 2019. "Rock Glacier Kinematics in the Kaunertal, Ötztal Alps, Austria" Geosciences 9, no. 9: 373. https://doi.org/10.3390/geosciences9090373
Note that from the first issue of 2016, this journal uses article numbers instead of page numbers. See further details here.