Abstract
This study discusses the influence of soil compaction on runoff generation with a special focus on forested Andosol sites. Because of their typical soil physical characteristics (low bulk density, high pore volumes) and the existent land use, these areas are expected to show low to no measurable overland flow during heavy rainfall events. However, due to heavy machinery traffic in the course of forestry actions and pumice excavations, skid trails have been established. Here, a distinct shift of soil dry bulk density (DBD) was observable, using a detailed soil mapping and data interpolation in order to generate in-depth DBD-cross profiles. Additionally, infiltration measurements and rainfall simulations (I = 45 mm·h−1, t = 30 min) were conducted to evaluate effects of observed soil compaction on infiltration rates and overland flow formation. Results show that soil compaction was increased by 21% on average in skid trail wheel ruts. As a consequence, observed runoff was 8.5-times higher on skid trails, while saturated hydraulic conductivity was diminished by 36%. These findings show, that soil compaction leads to a higher possibility of runoff formation during heavy rainfall events, especially at sites which showed initial conditions with presumably low tendencies of runoff formation.
1. Introduction
Wide areas of northern Rhineland-Palatinate (southwest-Germany) are covered by Laacher See Tephra (LST), originated from the last major eruption of the Laacher See volcano 12,916 yr B.P. Mostly pumice lapilli and ashes were deposited; initial base condition for an Andosol-pedogenesis in these areas [1,2,3]. Andosols feature soil physical properties that prevent a quick formation of overland flow during heavy rainfall events: The rather coarse pumice lapilli lead to characteristically low dry bulk densities (DBD) and high pore volumes [4,5,6,7]. This leads typically to a low tendency of runoff formation [8,9,10,11,12,13].
However, observed sites are subject to two different anthropogenic impacts on pedosphere and hydrosphere: First of all, forestry actions taking place condition the establishment of a skid trail network in order to increase trafficability. Secondly, pumice is being excavated leading not only to a total conversion of soil physical properties—which has to be discussed in future studies – but also to increased heavy machinery traffic in the course of these operations.
Soil hydrological and soil physical consequences of machinery traffic on unprotected forest soil are widely discussed. Studies clearly show that, due to soil compaction, an increase of overland flow during heavy rainfall events is expectable [14,15,16,17,18,19,20]. That is why traffic induced compaction can compromise beneficial effects of forest soils regarding decentral water retention. However, studies that discuss these effects for Andosols and their typical soil physical properties are scarce when it comes to forestry sites in humid oceanic climate [21]. Yet, detailed results were publicized in [22] for the Inland-northwest USA. Here, all of the basic assumptions are affirmed: Soils originated from volcanic ashes are described as low-density soils with a high porosity, which are easily affected by machinery traffic.
Therefore, Andosols have to be observed even more carefully because of two reasons: 1) The shift between undisturbed and disturbed conditions is presumably quite significant, as the initial soil physical conditions should lead to comparatively high infiltration rates. 2) Moreover, andic soils show the tendency that “(…) soil material changes, under pressure or by rubbing, from a plastic solid into a liquefied stage and back into the solid condition.” [23] (pp. 146–147). This means, that they are exceptionally well formable when it comes to pressure-induced impacts, leading to presumably noteworthy changes caused by traffic load.
This study concentrates on a site were a complete deforestation was conducted, allowing a subsequent pumice excavation. Because of the intensive machinery traffic during deforestation, new skid trails were established. This allowed a detailed analysis of alterations made by traffic. The aim is to investigate if there is a notable change in soil DBD due to traffic load leading to diminished infiltration rates, and if there is a measurable shift in runoff formation during heavy rainfall events that could possibly trigger side-effects like flash-flooding or soil erosion processes.
2. Materials and Methods
2.1. Study Area
Studies took place in the forest district Bendorf, located approximately 20 km East of the Laacher See in northern Rhineland-Palatinate (Figure 1).
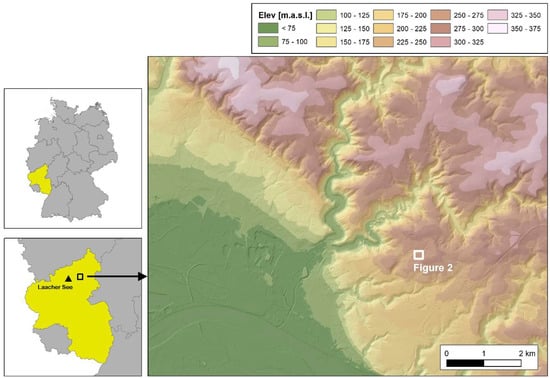
Figure 1.
Location of the study area.
The forest district is located on the plateau of the Rhenish Massif, representing the peneplain of the Variscan basal complex, which drops off steeply towards river Rhine about 3 km E of the study area. Because of the rather large elevation difference (study area 260 m.a.s.l., Rhine 60 m.a.s.l.), all tributaries in the forest district are deeply cut into the surrounding landscape, leading to partially steep slopes.
Soil compaction and runoff formation were investigated along a newly established skid trail featuring distinct wheel ruts, which was built parallel to the line of inclination (Figure 2a). Pumice deposits, according to a historical geological mapping conducted by the Geological State Office of Rhineland-Palatinate (LGB RLP), are shown in Figure 2b.
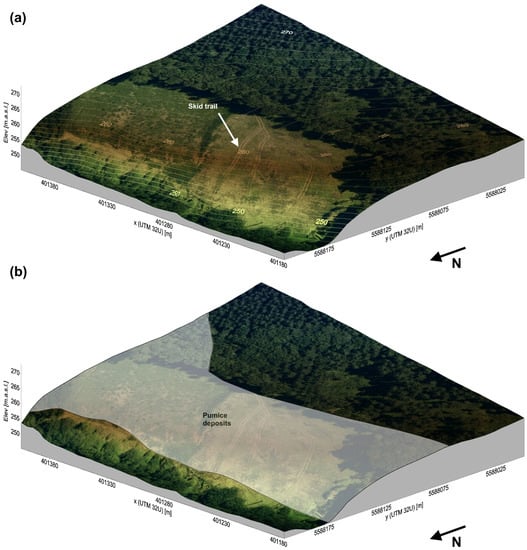
Figure 2.
(a) Aerial view of the study site, sampled skid trail indicated by arrow; (b) pumice deposits according to Geological State Office of Rhineland-Palatinate (LGB RLP) mapping.
The skid trail spans a former beech stand which was deforested because of subsequent pumice excavation. Overall, 14 cross sectional plots were sampled. Even though the study site lies within a rather flat-angled secondary valley and features a mean sloping of α = 5°, steep slope sections are existent at the lower slope, exceeding α = 10° (Figure 3, Table 1).
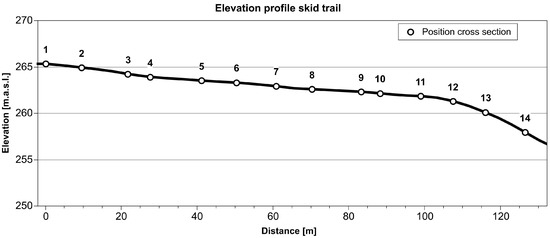
Figure 3.
Elevation profile of the sampled skid trail. Positions of soil sampling cross sections are indicated. Colored cross sections indicate cross sections which are presented in more detail in this study (Section 3.1.2).

Table 1.
Cross section slope (α) and mean soil physical properties of undisturbed forest soil.
2.2. Soil Physical Properties
A detailed soil sampling was conducted to evaluate the effects of soil compaction induced by overpassing forestry equipment on skid trails. For this purpose, samples were taken at three different locations: 1) Directly in the wheel ruts of skid trails, 2) in the area between the ruts to differentiate between the direct (ruts) and indirect impacts (between ruts), and 3) samples of undisturbed forest topsoil to obtain benchmarks for sites without alteration.
All of the samples were collected using soil sample rings with a volume of 100 cm³. In a first step, the field-fresh samples were weighed and then dried at 105 °C until reaching constant weight. With known sample ring volume, the soil bulk density could be derived by dividing the oven-dry mass of the sample by sample ring volume [24]. Since all samples were dried, dry bulk density (DBD) is indicated throughout this manuscript. Subsequently, all samples were sieved to obtain the percentage of sand and gravel as a proxy for notable pumice deposits. Additionally, particle density was measured using the Pycnometer method proposed by [25]. Concluding, a sedimentary analysis of soil texture (World Reference Base (WRB) classification based on [23]) took place.
Generally, a detailed cross sectional depth profiling was conducted. The aim of these investigations was to deliver detailed insight into the spatial distribution of soil bulk density. Overall, 14 cross sections were sampled, covering the whole skid trail (Figure 3). For each section, samples were taken at a minimum of two depths, always trying to reach substratum layers. Laterally, according to the surface categories described, five different positions were sampled: Undisturbed forest topsoil left and right of the skid trail; and wheel ruts left/right and the space between the ruts. Using this dataset, an interpolation of the surveyed data was conducted using a semivariogram-based kriging interpolation.
2.3. Soil Hydrological Properties
Infiltration rates for undisturbed forest soils and skid trails were investigated using a double ring infiltrometer. This assessment was ought to deliver an estimation of saturated hydraulic conductivity (Ksat) by observing the final steady-state infiltration flux by the end of each sampling (steady state was defined as <0.5% change of infiltration rate between time intervals) [9,26,27,28]. Soil permeability was classified using the classification of Bear [29] (Table 2).
Table 2.
Permeability classes, modified after Bear [29].
Furthermore, rainfall simulation was conducted using a small-scale rainfall simulator presented in [14]. The simulator was designed specifically for the use on small plots like skid trails and wheel ruts. It was built using an aluminum frame, fixing a nozzle (Lechler 460.608) 2 m above ground and a battery-driven bilge pump delivering a constant water pressure of 0.09 bar at the nozzle. The setup featured a plot size of 0.8 × 0.8 m (0.64 m²), limited by a stainless-steel frame equipped with an outlet. Rainfall characteristics were calibrated to match natural rainfall conditions regarding drop spectrum and rainfall erosivity [30]. Calibration setup followed a standardized procedure suggested by [31]. Sampling interval for collected runoff was set to one minute, allowing to create detailed hydrographs for every simulated heavy rainfall event.
As the rainfall simulator provided a constant precipitation input of 0.76 mm·min−1 (leading to a total precipitation sum of 22.8 mm for each simulated rainfall event of 30 min), it was possible to calculate the runoff coefficient (RC) for every given time interval (e.g., per minute or per rainfall event) using Equation (1).
RC [%] = (Q [mm]/P [mm]) × 100
The coefficient of variance (cv) was calculated to assess runoff variability using Equation (2), dividing the runoff dataset’s standard deviation (σ) by its mean (µ).
cv [-] = σ [mm]/µ [mm]
Foltz et al. [15] suggested, that high cv values represent a suitable indicator for disturbance of soil physical properties due to machinery traffic.
Rainfall simulations were performed on wheel ruts and at adjacent undisturbed sites. Deeply incised ruts allowed a precise identification of areas influenced by traffic. Because of the compact design, it was possible to ensure plots covering only areas impacted by traffic, respective to areas with no notable disturbance (Figure 4).
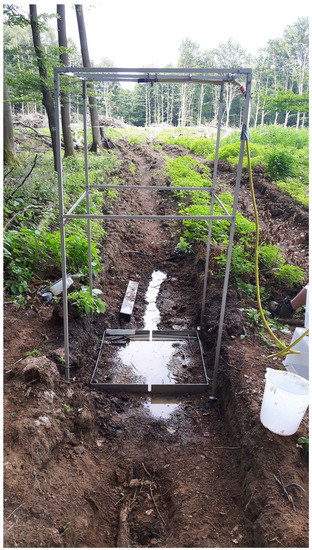
Figure 4.
Rainfall simulator after a 30 min heavy rainfall simulation, positioned in a wheel rut. Relative position between cross sections 3 and 4 (cf. Figure 2).
3. Results
3.1. Soil Physical Properties
3.1.1. Undisturbed Soil Physical Properties
Before evaluating the anthropogenic influence of machinery traffic, a view at natural site conditions, regarding soil texture, soil DBD, and percentage of coarse material and sand had to be undertaken for delivering standard values. Only undisturbed forest soil samples are discussed within this sub-section. With the help of these samples, naturally caused dataset heterogeneity could be addressed.
Undisturbed soil physical properties reveal rather homogeneous characteristics along the observed skid trail. However, there are still some differences depending on slope position: On the upper slope (cross sections 1,2), comparatively high DBD were measured. Here, only shallow pumice deposits were found, indicating pumice thickness leveling off in uphill direction. In the middle part of the slope (cross sections 8–10), noticeably lower DBD accompanied by higher gravel contents were found. Here, the thickest pumice layers were located. On the lower part of the slope, pumice layer thickness was again decreasing, represented by lower gravel content and rising DBD. These findings match the geological mapping of LGB RLP, postulating only a narrow band of pumice crossing the observed slope (cf. Figure 2b). Overall, a rather low soil DBD was present (Ø 0.82 g·cm−3), while sandy and loamy soil textures dominated. Gravel contents differed along the skid trail while mostly exhibiting values >10%.
3.1.2. Soil Compaction
Exemplary interpolated DBD-cross sections deliver a good insight into the spatial distribution of compacted areas (Figure 5).
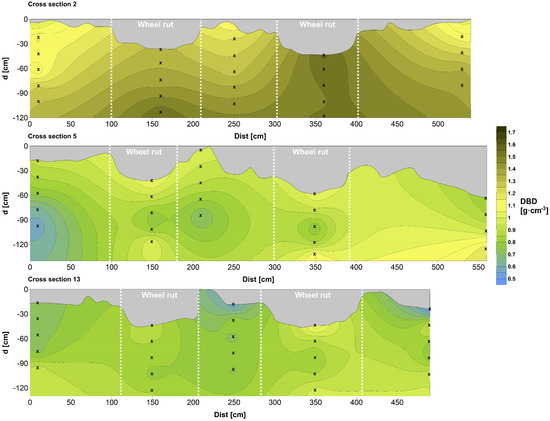
Figure 5.
Exemplary interpolated DBD cross sections (upper slope (2), middle slope (5), lower slope (13)); relative position of wheel ruts and sampling points are indicated.
These exemplary sections reveal the same pattern previously mentioned in Section 3.1.1, with highest DBD at the upper slope, lowest at the middle slope, and again higher DBD at the lower slope. Each wheel rut shows more or less concentric DBD-contour lines with higher DBD in relation to the outer, undisturbed areas, indicating a compaction caused by machinery traffic. This relative difference between undisturbed subareas and wheel ruts, functioning as main indicator for soil compaction, is listed for all cross sections in Table 3. Sampling data proves a measurable increase of soil DBD with a mean of 21%.
Table 3.
Number of samples and differences between undisturbed soil and wheel ruts regarding soil dry bulk density (DBD).
3.2. Soil Hydrological Properties
3.2.1. Infiltration
Infiltration measurements revealed distinct differences between undisturbed forest topsoil and wheel ruts. Exemplary infiltration curves show typical infiltration progress for each surface category (Figure 6).
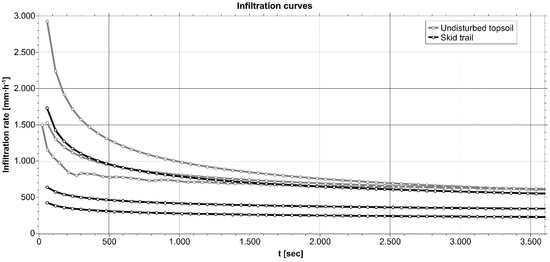
Figure 6.
Exemplary infiltration curves for undisturbed topsoil and skid trails.
Especially at the beginning, undisturbed topsoil’s exhibited high infiltration rates, while skid trails tended to show rather low initial infiltration rates. (Table 4).
Table 4.
Mean initial infiltration rate and mean saturated hydraulic conductivity (Ksat), aggregated by surface category. Relative deviation on skid trails noted in brackets.
However, both surface categories show less diverging saturated hydraulic conductivities: This indicates, most likely, a fast-vertical water transport due to large pore space caused by coarse pumice particles, which were present on both undisturbed sites and skid trails. Therefore, permeability class is pervious for both surfaces with 1.79 (undisturbed) and 1.98 (skid trail)–log10·K (cm·s−1). Still, skid trails exhibit almost 40% less Ksat than adjacent undisturbed soils and were almost classified as semipervious, since breaking point between both classes lies at 2.0–log10·K (cm·s−1)
3.2.2. Rainfall Simulation
As distinct soil compaction and diminished saturated hydraulic conductivity in wheel ruts were proven, negative consequences regarding runoff formation during simulated heavy rainfall events were expectable. Figure 7 shows hydrographs for all rainfall experiments conducted for this study, the constant rainfall input of 0.76 mm·min−1, delivered by the small-scale rainfall simulator, is also indicated.
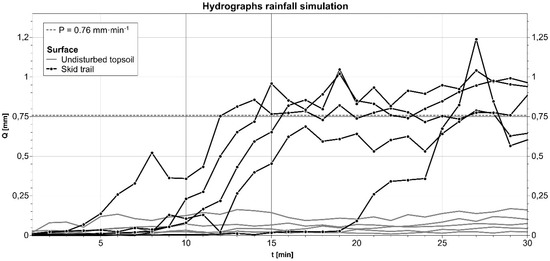
Figure 7.
Hydrographs for rainfall simulations conducted; surface categories and constant precipitation input are indicated.
On first sight, differences between both surface categories are apparent. Skid trail surfaces feature much higher runoff sums per minute, in most cases even exceeding precipitation input by the end of each simulation run. These high values indicate small pools, which developed in the first minutes of a rainfall event. When there was enough flowing and/or stagnating water to breach through the pool boundaries, temporarily retained water reached the outlet.
Most of the skid trail surfaces showed an almost parallel hydrograph progression between minute 10 and minute 15. Here, runoff rates begin to approximate rainfall input, indicating a fully saturated topsoil layer, prohibiting quick infiltration and leading to increased overland flow formation. Undisturbed topsoil exhibited nearly constant—and notably lower—runoff rates over time, representing, most likely, Hortonian overland flow (HOF) occurring because of high rainfall intensity.
Overall, skid trail surfaces showed a stronger tendency for runoff formation, accompanied by a much more variable runoff (Figure 8).
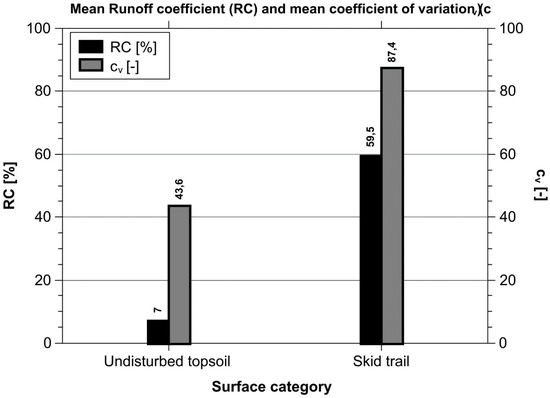
Figure 8.
Mean runoff coefficients (RC) and mean coefficients of variation (cv) for each surface category.
RC was 8.5 times higher on skid trails than on undisturbed sites, while cv was twice as high on skid trails compared to forest soil. Both values indicate noticeable changes of soil hydrological responses to heavy rainfall events.
4. Discussion
Mean soil DBD of undisturbed sites was quite low (0.82 g·cm−3), compared to typical soil DBD. The latter is often described to lie within a range of 1.0–1.7 g·cm−3, based on the assumption that mineral particle densities range from 2.5–2.8 g·cm−3 and pore space makes up about 50% of the soil matrix [24,32,33,34,35]. While coarse pumice material leads to a wider pore system, densities of only 0.4–1.4 g·cm−3 for LST pumice [36] additionally cause comparatively low particle densities of the observed soils, ranging from 1.84 to 2.12 g·cm−3. Therefore, a basic assumption—low densities of undisturbed pumice originated Andosols—was verified.
Concerning soil compaction in wheel ruts, a clear statement is possible: These areas showed consistently higher soil DBD with a mean DBD +21% compared to areas not affected by machinery traffic. A classification of this increase on the basis of other studies is difficult, as reference values differ. For example, [37] assessed a mean DBD increase of <7% for Luvisols, Podzols, and Gleysols, with textures comparable to those in this study. Lenhard et al. [38] described, in one of the few studies viewing volcanic ash soils, an increase of about 39%, but his study features a high dataset variability. Generally, sandy soils are described to be rather insensitive towards soil compaction [39,40], but there are also studies discussing severely compacted sandy forest soils [41,42]. Cambi et al. [43]; therefore, deliver only a qualitative but very comprehensive review on forest soil compaction due to machinery traffic. Amongst other factors, they address a low initial DBD—as observed in this study—as a contributory factor for severe compaction on the basis of [39,44,45,46]. Croke et al. [47], for example, recorded an increase of 30% for topsoil with an initial DBD of 0.63 g·cm−3. However, even [43] account for lacking studies observing Andosols, respective to soils with high porosities. Proving this, [48] stated that Andosols are less compressible than other soils. In contrast, [49,50,51,52] propose the exact opposite for young volcanic ash soils. That is why, for example, [53] stress the need for a better differentiation of Andosols from other soil types when considering machinery compaction—not least because they represent excellent soils for forestry use [54].
Possible negative hydrological side-effects of compaction are proven by numerous other studies [55,56,57,58,59], but as the overall soil DBD was rather low, the question arises as to whether they are relevant for the observed study area. Regarding infiltration rates, exceptionally high values were measured both on undisturbed sites and skid trails compared to literature benchmarks [60]. Yet, considering given land-use (deciduous forest), Jimènez et.al., [9] discovered comparable and even higher Ksat rates for Andosols (796 mm·h−1). Therefore, observed infiltration rates seem to represent realistic values for given boundary conditions. While even disturbed Andosols exhibited high absolute infiltration rates, leading to the conclusion that there might be no concern regarding soil hydrologic downsides, an identifiable relative decrease due to machinery traffic (−36%) is still present. Compared to other skid trail-related studies, [58] report a mean Ksat reduction of 37% for Luvisols, and [49] and [61] proved that Andosols in the NW-USA revealed a Ksat reduction of up to 81% (initial Ksat 3850 mm·h−1). However, comparing gross Ksat values is difficult, as these datasets always hold volatile values because of a wide variety of interference factors.
Apart from that, rainfall simulations showed a measurable increase of overland flow during heavy rainfall events. Here, an even stronger alteration of soil hydraulic properties was proven. A runoff increase with a factor of 8.5 is an indicator for potentially occurring runoff events during heavy rainfall. Providing a better classification of this result, previous studies even proved an increase by factor 18 for andic soils in direct vicinity of the Laacher See volcano [14]. However, these soils were predominantly originated from older basanite deposits and only thin layers of LST ashes; therefore, showing higher soil DBD (1.08 g·cm−3 for undisturbed topsoil, 1.23 g·cm−3 for wheel ruts). Because of the less porous material, lacking coarse pumice particles, a generally increased plasticity and decreased infiltration capacity has to be assumed. While there are studies also conducting rainfall simulations on skid trails, it is difficult to compare them, as the simulated heavy rainfall events differ in duration and intensity [15]. Some studies even intentionally used higher intensities to ensure visible runoff, having in mind the high infiltration capacities of Andosols [11].
Concluding, a distinct relative shift of DBD, Ksat and runoff rates was observable. Therefore, a negative anthropogenic influence was proven. However, Andosols with high contents of coarse pumice particles seems to be quite resilient against traffic compaction compared to other mineral soil types.
5. Conclusions
This study discussed consequences of machinery traffic on Andosols with a special focus on soil physical and soil hydrological topics. As one of the first studies for humid oceanic Andosol sites in Central Europe, basic statements about machinery traffic-induced soil compaction and its hydrological consequences were possible. A notable relative increase of soil DBD, resulting in decreased infiltration rates and a stronger tendency of runoff formation, was proven. Hence, there is a need for mitigating these negative effects, for example, by using more soil conserving harvesting techniques (e.g., bandtracks or caterpillar drives instead of wheels, leading to a better pressure distribution). However, observed Andosols with high contents of coarse pumice particles seem to be comparatively resilient against negative impacts of forestry traffic, as even compacted areas still exhibited low absolute soil DBD and high absolute infiltration rates. This leads to the conclusion that these sites and their beneficial soil physical characteristics have to be preserved as they can function as a valuable component of decentral water retention. Yet, as described in the introduction, pumice is being excavated leading to altered site conditions in the aftermath. This is an additional anthropogenic impact that is going to be considered in upcoming studies.
Author Contributions
Conceptualization, J.J.Z., M.E., A.K. and M.S.; methodology, J.J.Z.; formal analysis, J.J.Z., M.E., A.K. and M.S.; investigation, J.J.Z., M.E., A.K. and M.S.; resources, J.J.Z.; data curation, J.J.Z., M.E., A.K. and M.S.; writing—original draft preparation, J.J.Z.; writing—review and editing, J.J.Z.; visualization, J.J.Z.; supervision, J.J.Z.
Funding
This research received no external funding.
Conflicts of Interest
The authors declare no conflicts of interest.
References
- Baales, M.; Jöris, O.; Street, M.; Bittmann, F.; Weninger, B.; Wiethold, J. Impact of the Late Glacial Eruption of the Laacher See Volcano, Central Rhineland, Germany. Quat. Res. 2002, 58, 273–288. [Google Scholar] [CrossRef]
- Schmincke, H.-U.; Park, C.; Harms, E. Evolution and environmental impacts of the eruption of Laacher See Volcano (Germany) 12,900 a BP. Quat. Int. 1999, 61, 61–72. [Google Scholar] [CrossRef]
- Riede, F.; Bazely, O.; Newton, A.J.; Lane, C.S. A Laacher See-eruption supplement to Tephrabase: Investigating distal tephra fallout dynamics. Quat. Int. 2011, 246, 134–144. [Google Scholar] [CrossRef]
- Kleber, M.; Jahn, R. Andosols and soils with andic properties in the German soil taxonomy. J. Plant Nutr. Soil Sci. 2007, 170, 317–328. [Google Scholar] [CrossRef]
- Rennert, T.; Eusterhues, K.; Hiradate, S.; Breitzke, H.; Buntkowsky, G.; Totsche, K.U.; Mansfeldt, T. Characterisation of Andosols from Laacher See tephra by wet-chemical and spectroscopic techniques (FTIR, 27Al-, 29Si-NMR). Chem. Geol. 2014, 363, 13–21. [Google Scholar] [CrossRef]
- Kleber, M.; Mikutta, C.; Jahn, R. Andosols in Germany—Pedogenesis and properties. Catena 2004, 56, 67–83. [Google Scholar] [CrossRef]
- Hahn, J.; Opp, C. Eigenschaften von Laacher See-Tephra enthaltenden Bodensubstraten in eruptionsnaher und eruptionsferner Position. In Proceedings of the Jahrestagung der DBG 2011, Berlin, Germany, 3–9 September 2011. [Google Scholar]
- Jimènez, C.C.; Tejedor, M.; Morillas, G.; Neris, J. Infiltration rate of andisols: Effect of changes in vegetation cover (Tenerife, Spain). J. Soil Water Conserv. 2006, 61, 153–158. [Google Scholar]
- Neris, J.; Jimènez, C.; Fuentes, J.; Morillas, G.; Tejedor, M. Vegetation and land-use effects on soil properties and water infiltration of Andisols in Tenerife (Canary Islands, Spain). Catena 2012, 98, 55–62. [Google Scholar] [CrossRef]
- Tejedor, M.; Neris, J.; Jimènez, C. Soil properties controlling infiltration in volcanic soils (Tenerife, Spain). Soil Sci. Soc. Am. J. 2012, 77, 202–212. [Google Scholar] [CrossRef]
- Neris, J.; Tejedor, M.; Rodríguez, M.; Fuentes, J.; Jiménez, C. Effect of forest floor characteristics on water repellency, infiltration, runoff and soil loss in Andisols of Tenerife (Canary Islands, Spain). Catena 2013, 108, 50–57. [Google Scholar] [CrossRef]
- Nanzyo, M.; Shoji, S.; Dahlgren, R. Physical characteristics of volcanic ash soils. In Volcanic Ash Soils: Genesis, Properies and Utilization; Shoji, S., Nazyo, M., Dahlgren, R., Eds.; Elsevier Science Publishers B.V.: Amsterdam, The Netherlands, 1993; p. 288. [Google Scholar]
- Orradottir, B.; Archer, S.R.; Arnalds, O.; Wilding, L.P.; Thurow, T.L. Infiltration in Icelandic Andisols: The role of vegetation and soil frost. Arct. Antarct. Alp. Res. 2008, 40, 412–421. [Google Scholar] [CrossRef]
- Zemke, J.J. Runoff and Soil Erosion Assessment on Forest Roads Using a Small Scale Rainfall Simulator. Hydrology 2016, 3, 25. [Google Scholar] [CrossRef]
- Foltz, R.B.; Copeland, N.S.; Elliot, W.J. Reopening abandoned forest roads in northern Idaho, USA: Quantification of runoff, sediment concentration and infiltration, and interrill erosion parameters. J. Environ. Manag. 2009, 90, 2542–2550. [Google Scholar] [CrossRef]
- La Marche, J.L.; Lettenmaier, D.P. Effetcs of forest roads on flood flows in the Deschutes River, Washington. Earth Surf. Process. Landf. 2001, 26, 115–134. [Google Scholar] [CrossRef]
- Horn, R.; Vossbrink, J.; Becker, S. Modern forestry vehicles and their impacts on soil physical properties. Soil Tillage Res. 2004, 79, 207–219. [Google Scholar] [CrossRef]
- Luce, C.H. Hydrological processes and pathways affected by forest roads: What do we still have to learn? Hydrol. Process. 2002, 16, 2901–2904. [Google Scholar] [CrossRef]
- Wemple, B.C.; Clark, E.C.; Ross, D.S.; Rizzo, D.M. Identifying the spatial pattern and importance of hydro-geomorphic drainage impairments on unpaved roads in the northeastern USA. Earth Surf. Process. Landf. 2017, 42, 1652–1665. [Google Scholar] [CrossRef]
- Jones, J.A.; Achterman, G.L.; Augustine, L.A.; Creed, I.F.; Ffolliott, P.F.; MacDonald, L.; Wemple, B.C. Hydrologic effects of a changing forested landscape—Challenges for the hydrological sciences. Hydrol. Process. 2009, 23, 2699–2704. [Google Scholar] [CrossRef]
- Selby, M.J.; Hosking, P.J. Causes of infiltration into yellow-brown pumice soils. J. Hydrol. (N. Z.) 1971, 10, 113–119. [Google Scholar]
- Page-Dumroese, D.; Miller, R.; Mital, J.; McDaniel, P.; Miller, D. Volcanic-Ash-Derived Forest Soils of the Inland Northwest: Properties and Implications for Management and Restoration; Proceedings RMRS-P-44; U.S. Department of Agriculture, Forest Service, Rocky Mountain Research Station: Fort Collins, CO, USA, 2007.
- Food and Agriculture Organization of the United Nations (FAO). World Reference Base for Soil Resources 2014. International Soil Classification System for Naming Soils and Creating Legends for Soil Maps. Update 2015; FAO: Rome, Italy, 2015; pp. 146–147. [Google Scholar]
- Shukla, M.K. Soil Physics: An Introduction; CRC Press: Boca Raton, FL, USA, 2014. [Google Scholar]
- Blake, G.R.; Hartge, K.H. Particle density. In Methods of Soil Analysis. Part 1; Klute, A., Ed.; ACSESS DL: Madison, WI, USA, 1986; pp. 377–382. [Google Scholar]
- Bouwer, H. Intake rate: Cylinder infiltrometer. In Methods of Soil Analysis. Part 1; Klute, A., Ed.; ACSESS DL: Madison, WI, USA, 1986; pp. 825–844. [Google Scholar]
- Johnson, A.I. A Field Method for Measurement of Infiltration; Geological Survey Water Supply Paper 1544-F; U.S. Government Printing Office: Washington, DC, USA, 1963.
- Eijkelkamp Company. Double Ring Infiltrometer Operating Instructions; Eijkelkamp: Giesbeek, NL, USA, 2012; Available online: https://www.eijkelkamp.com/files/media/Gebruiksaanwijzingen/EN/m1-0904eringinfiltrometer.pdf (accessed on 15 April 2019).
- Bear, J. Dynamics of Fluids in Porous Media; American Elsevier Publishing Company Inc.: New York, NY, USA, 1972. [Google Scholar]
- Zemke, J.J. Set-up and calibration of a portable small scale rainfall simulator for assessing soil erosion processes at interrill scale. Cuad. De Investig. Geográfica 2017, 43, 63–81. [Google Scholar] [CrossRef]
- Iserloh, T.; Ries, J.B.; Arnáez, J.; Boix Fayos, C.; Butzen, V.; Cerdà, A.; Echeverría, M.T.; Fernández-Gálvez, J.; Fister, W.; Geißler, C.; et al. European small portable rainfall simulators: A comparison of rainfall characteristics. Catena 2013, 110, 100–112. [Google Scholar] [CrossRef]
- Hillel, D. Introduction to Soil Physics; Academic Press Inc.: New York, NY, USA, 1982. [Google Scholar]
- Hillel, D. Introduction to Environmental Soil Physics; Elsevier Science: San Diego, CA, USA, 2004. [Google Scholar]
- Arshad, M.A.; Lowery, B.; Grossmann, B. Physical tests for monitoring soil quality. In Methods for Assessing Soil Quality. Soil Science Society of America Special Publication 49; Doran, J.W., Jones, A.J., Eds.; Soil Science Society of America: Madison, WI, USA, 1996; pp. 123–142. [Google Scholar]
- United States Department of Agriculture (USDA). Soil Quality Test Kit Guide; USDA Agricultural Research Service, Natural Resources Conservation Service, Soil Quality Institute: Washington, DC, USA, 1999.
- Landesamt für Geologie und Bergbau Rheinland-Pfalz (LGB RLP). Steckbriefe: Charakteristik rheinland-pfälzischer Steine und Erden; MWVLW RLP: Mainz, Germany, 2015; Available online: https://www.lgb-rlp.de/fileadmin/service/lgb_downloads/rohstoffe/rohstoffe_allgemein/steckbriefe_-_charakteristik_rheinland-pfaelzischer_steine_und_erden_01.pdf (accessed on 8 March 2019).
- Ampoorter, E.; Van Nevel, L.; De Vos, B.; Hermy, M.; Verheyen, K. Assessing the effects of initial soil characteristics, machine mass and traffic intensity on forest soil compaction. For. Ecol. Manag. 2010, 260, 1664–1676. [Google Scholar] [CrossRef]
- Lenhard, R.J. Changes in Void Distribution and Volume During Compaction of a Forest Soil. Soil Sci. Soc. Am. J. 1986, 50, 462–464. [Google Scholar] [CrossRef]
- Hillel, D. Environmental Soil Physics; Academic Press: San Diego, CA, USA, 1998. [Google Scholar]
- Fisher, R.F.; Binkley, D. Ecology and Management of Forest Soils; Wiley: New York, NY, USA, 2000. [Google Scholar]
- Brais, S.; Camiré, C. Soil compaction induced by careful logging in the claybelt region of northwestern Quebec (Canada). Can. J. Soil Sci. 1998, 78, 197–206. [Google Scholar] [CrossRef]
- Ampoorter, E.; Goris, R.; Cornelis, W.M.; Verheyen, K. Impact of mechanized logging on compaction status of sandy forest soils. For. Ecol. Manag. 2007, 241, 162–174. [Google Scholar] [CrossRef]
- Cambi, M.; Certini, G.; Neri, F.; Marchi, E. The impact of heavy traffic on forest soils: A review. For. Ecol. Manag. 2015, 338, 124–138. [Google Scholar] [CrossRef]
- Ampoorter, E.; Schrijver, A.; Nevel, L.; Hermy, M.; Verheyen, K. Impact of mechanized harvesting on compaction of sandy and clayey forest soils: Results of a meta-analysis. Ann. Sci. 2012, 69, 533–542. [Google Scholar] [CrossRef]
- Powers, R.F.; Scott, D.A.; Sanchez, F.G.; Voldseth, R.A.; Page-Dumroese, D.; Elioff, J.D.; Stone, D.M. The North American long-term soil productivity experiment: Findings from the first decade of research. Ecol. Manag. 2005, 220, 31–50. [Google Scholar] [CrossRef]
- Williamson, J.R.; Neilsen, W.A. The influence of forest site on rate and extent of soil compaction and profile disturbance of skid trails during ground-based harvesting. Can. J. Res. 2000, 30, 1196–1205. [Google Scholar] [CrossRef]
- Croke, J.; Mockler, S. Gully initiation and road-to-stream linkage in a forested catchment, Southeastern Australia. Earth Surf. Process. Landf. 2001, 26, 205–217. [Google Scholar] [CrossRef]
- McNabb, D.H.; Boersma, L. Evolution of the relationship between compressibility and shear strength of Andisols. Soil Sci. Soc. Am. J. 1993, 57, 923–929. [Google Scholar] [CrossRef]
- Cullen, S.J.; Montagne, C.; Ferguson, H. Timber harvest trafficking and soil compaction in western Montana. Soil Sci. Soc. Am. J. 1991, 55, 1416–1421. [Google Scholar] [CrossRef]
- Geist, J.M.; Hazrd, J.W.; Seidel, K.W. Assessing physical conditions of some Pacific Northwest volcanic ash soils after forest harvest. Soil Sci. Am. J. 1989, 53, 946–950. [Google Scholar] [CrossRef]
- Page-Domroese, D.S. Susceptibility of Volcanic Ash-Influenced Soils in Northern Idaho to Mechanical Compaction; Research Note Int-409; U.S. Department of Agriculture, Forest Service, Intermountain Research Station: Ogden, UT, USA, 1993.
- Parker, R.T.; Maguire, D.A.; Marshall, D.D.; Cochran, P. Ponderosa Pine growth response to soil strength in the volcanic ash soils of Central Oregon. West. J. Appl. 2007, 22, 134–141. [Google Scholar]
- Ares, A.; Terry, T.A.; Miller, R.E.; Anderson, H.W.; Flaming, B.L. Ground-Based Forest Harvesting Effetcs on Soil Physical Properties and Douglas-Fir Growth. Soil Sci. Soc. Am. J. 2005, 69, 1822–1832. [Google Scholar] [CrossRef]
- Kimble, J.M.; Ping, C.L.; Sumner, M.E.; Wilding, L.P. Classification of Soils: Andisols. In Handbook of Soil Science; Sumner, M.E., Ed.; CRC Press: New York, NY, USA, 2000. [Google Scholar]
- Croke, J.; Hairsine, P.; Fogarty, P. Soil recovery from track construction and harvesting changes in surface infiltration, erosion and delivery rates with time. Ecol. Manag. 2001, 143, 3–12. [Google Scholar] [CrossRef]
- Christopher, E.; Visser, R. Methodology for evaluating post-harvest erosion risk for the protection of water quality. N. Z. J. Sci. 2007, 52, 20–25. [Google Scholar]
- Bonell, M. Progress in the understanding of runoff generation dynamics in forests. J. Hydrol. 1993, 150, 217–275. [Google Scholar] [CrossRef]
- Grant, G.E.; Lewis, S.L.; Swanson, F.J.; Cissel, J.H.; McDonnell, J.J. Effects of Forest Practices on Peak Flows and Consequent Channel Response: A State-of-Science Report for Western Oregon and Washington; USDA Forest Service General Technical Report PNW-GTR-760; U.S. Department of Agriculture, Forest Service, Pacific Northwest Research Station: Portland, OR, USA, 2008.
- Brouwer, C.; Prins, K.; Kay, M.; Heibloem, M. Irrigation Water Management. Training Manual No 5. Irrigation Methods; Food and Agriculture Organization of the United Nations (FAO): Rome, Italy; Available online: http://www.fao.org/3/S8684E/s8684e00.htm#Contents (accessed on 8 March 2019).
- Startsev, A.D.; McNabb, D.H. Effects of skidding on forest soil infiltration in west-central Alberta. Can. J. Soil Sci. 2000, 80, 617–624. [Google Scholar] [CrossRef]
- MacDaniel, P.A.; Wilson, M.A. Physical and Chemical Characteristics of Ash-influenced Soils of Inland Northwest Forests. In Volcanic-Ash-Derived Forest Soils of the Inland Northwest: Properties and Implications for Management and Restoration; Page-Dumroese, D., Miller, R., Mital, J., McDaniel, P., Miller, D., Eds.; Proceedings RMRS-P-44; USDA Forest Service, Rocky Mountain Research Station: Fort Collins, CO, USA, 2007. [Google Scholar]
© 2019 by the authors. Licensee MDPI, Basel, Switzerland. This article is an open access article distributed under the terms and conditions of the Creative Commons Attribution (CC BY) license (http://creativecommons.org/licenses/by/4.0/).