The Idea of Using Bayesian Networks in Forecasting Impact of Traffic-Induced Vibrations Transmitted through the Ground on Residential Buildings


Abstract
:1. Introduction
2. Motivation and the Study Objective
3. Materials and Methods
- The PC algorithm (see [30] for details). It relies on minimizing the amount of necessary d-separation tests, which means quick and effective execution of lower-order tests. In the first phase of the algorithm’s operation, the structure of the network is determined, and then some of the edges are oriented as far as possible. Thus, a partially oriented structure is generated representing the whole class of potential Bayesian networks. Algorithms take two input parameters. The first one is the confidence level for the independence test. The lower the confidence level, the more attributes are considered to be independent and the smaller edge has the resulting network. The second parameter is the strategy of selecting pairs for the d-separation test. The d-separation test is performed for all attribute pairs in the sample. The complexity of the test for each pair depends on the number of edges eliminated in previous tests.
- The expectation–maximization (EM) algorithm (see [31] for details). It is an iterative algorithm to find the maximum likelihood or maximum a posteriori estimates of parameters in statistical models, where the model depends on unobserved latent variables. The EM iteration alternates between performing an expectation (E) step, which creates a function for the expectation of the log-likelihood evaluated using the current estimate for the parameters and a maximization (M) step, which computes parameters maximizing the expected log-likelihood found on the E step. These parameter-estimates are then used to determine the distribution of the latent variables in the next E step.
4. Results
4.1. Experimental Study
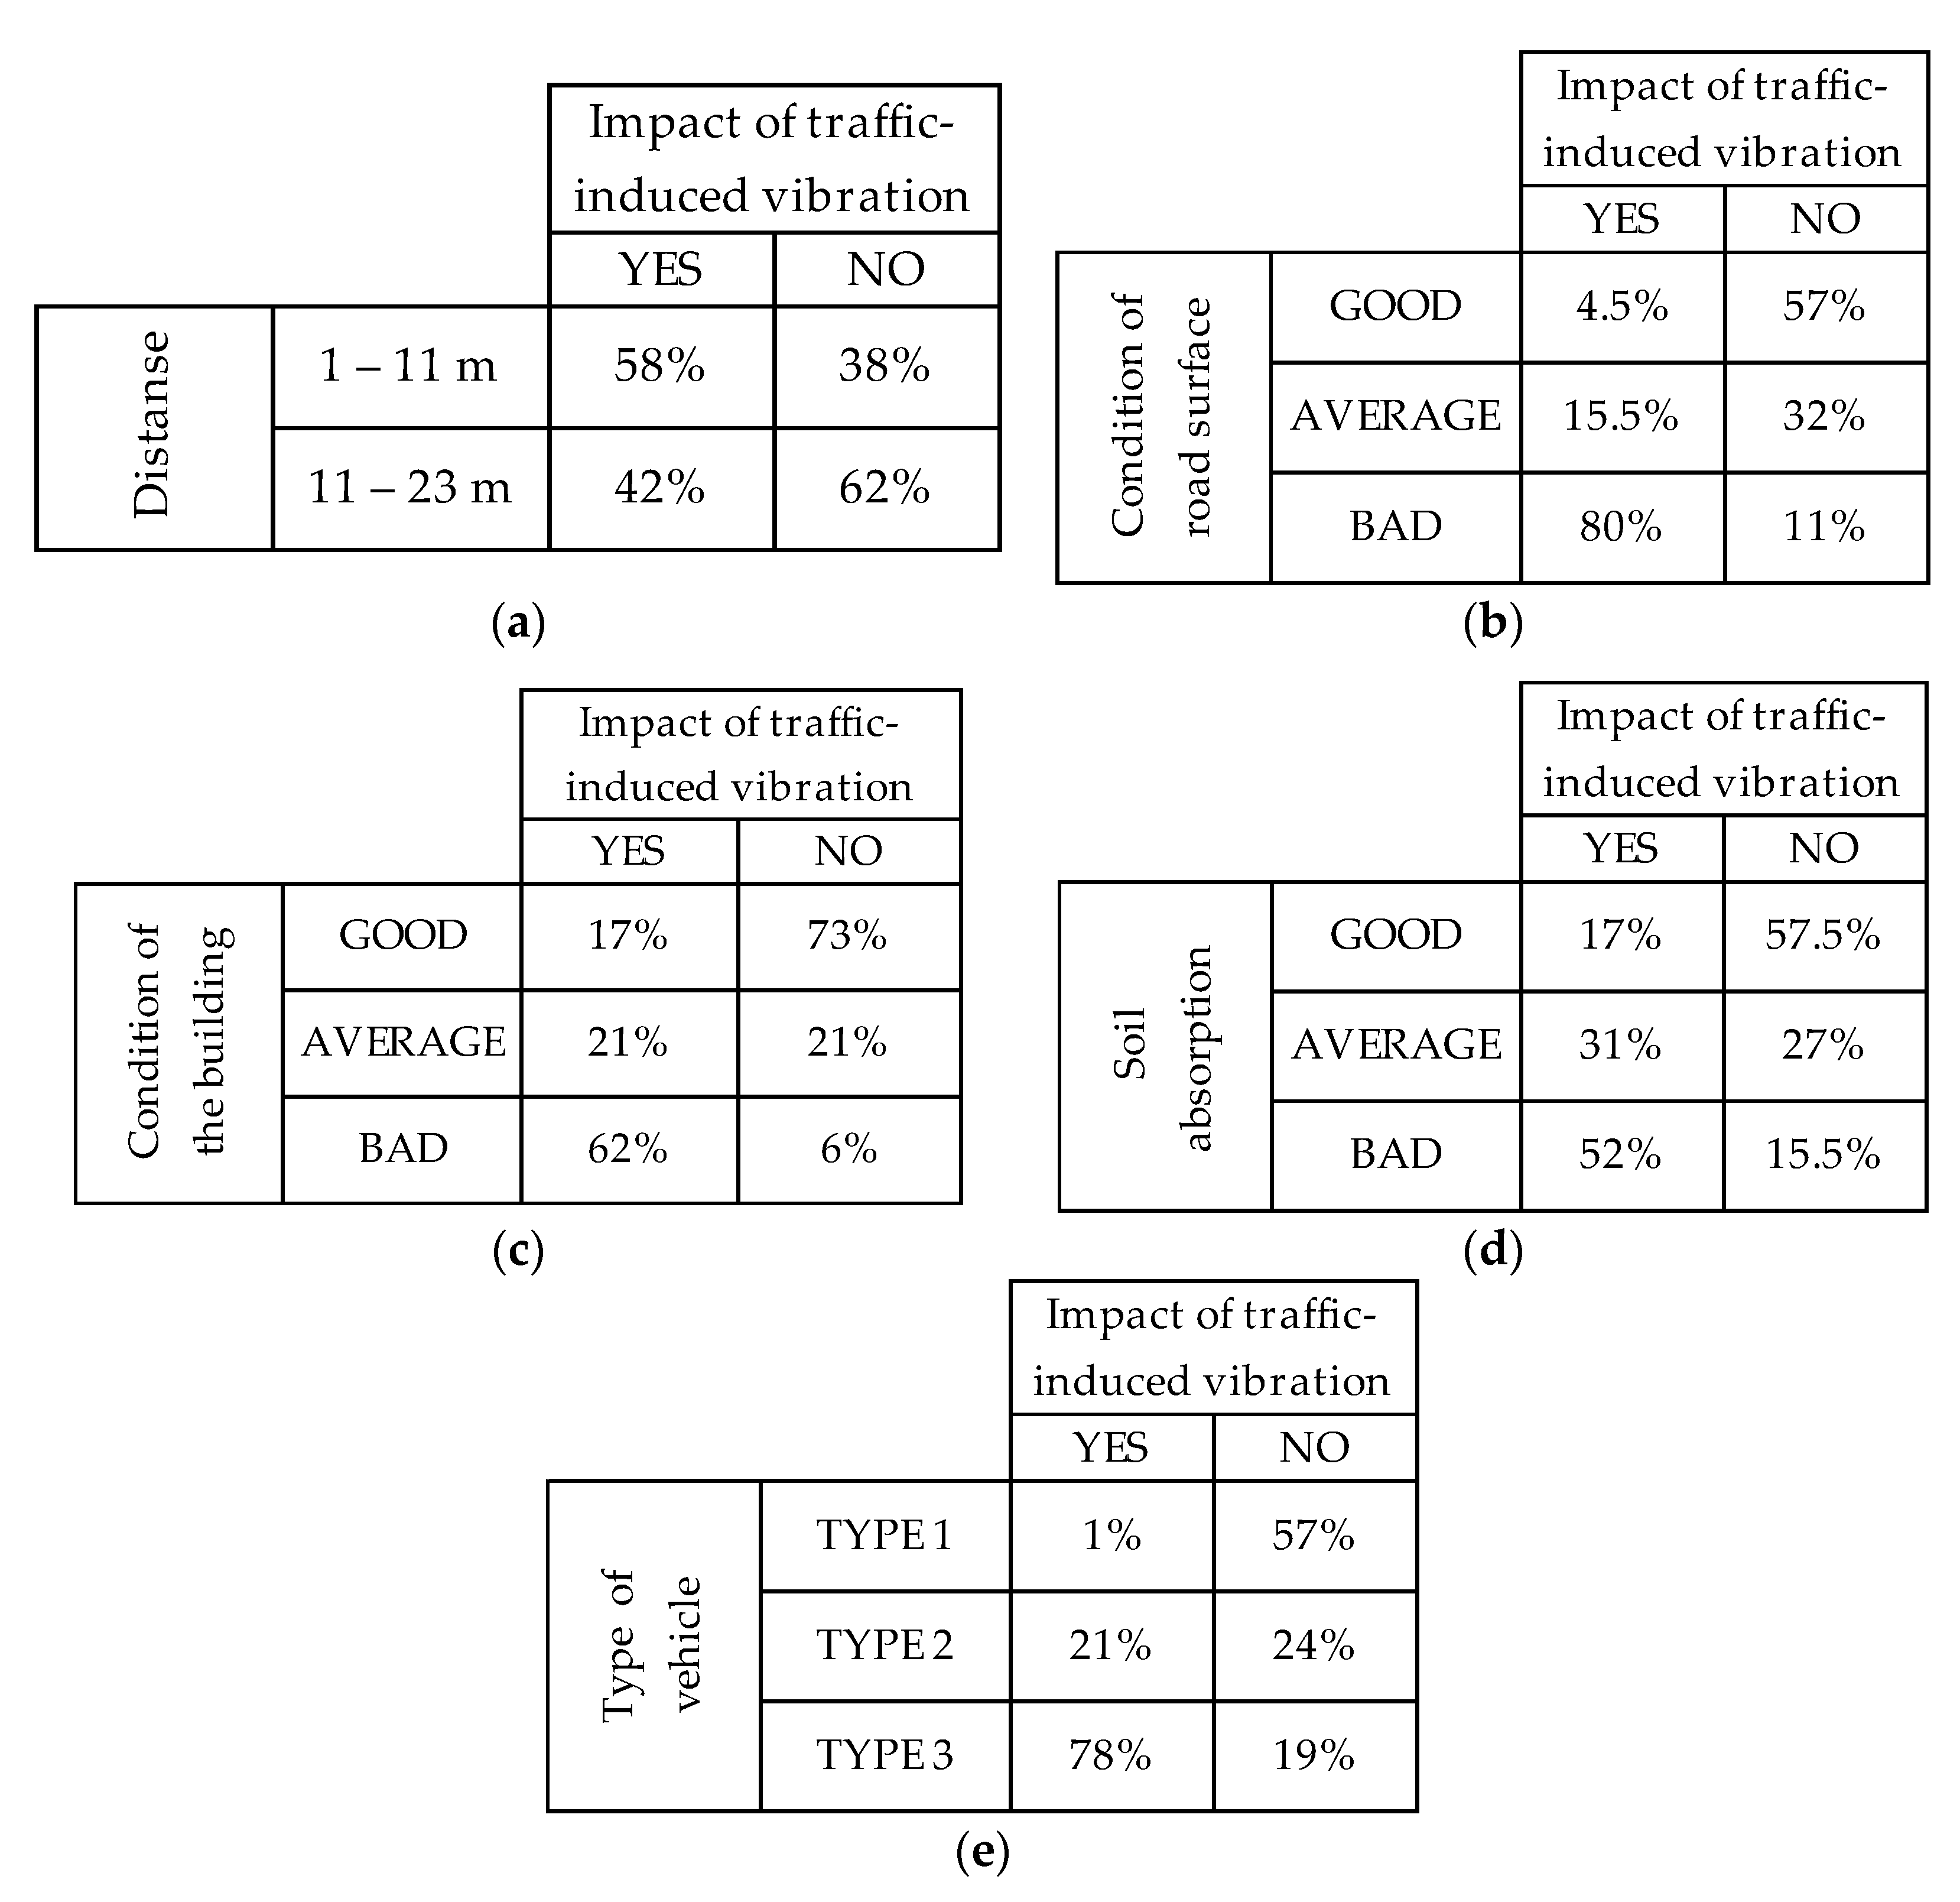
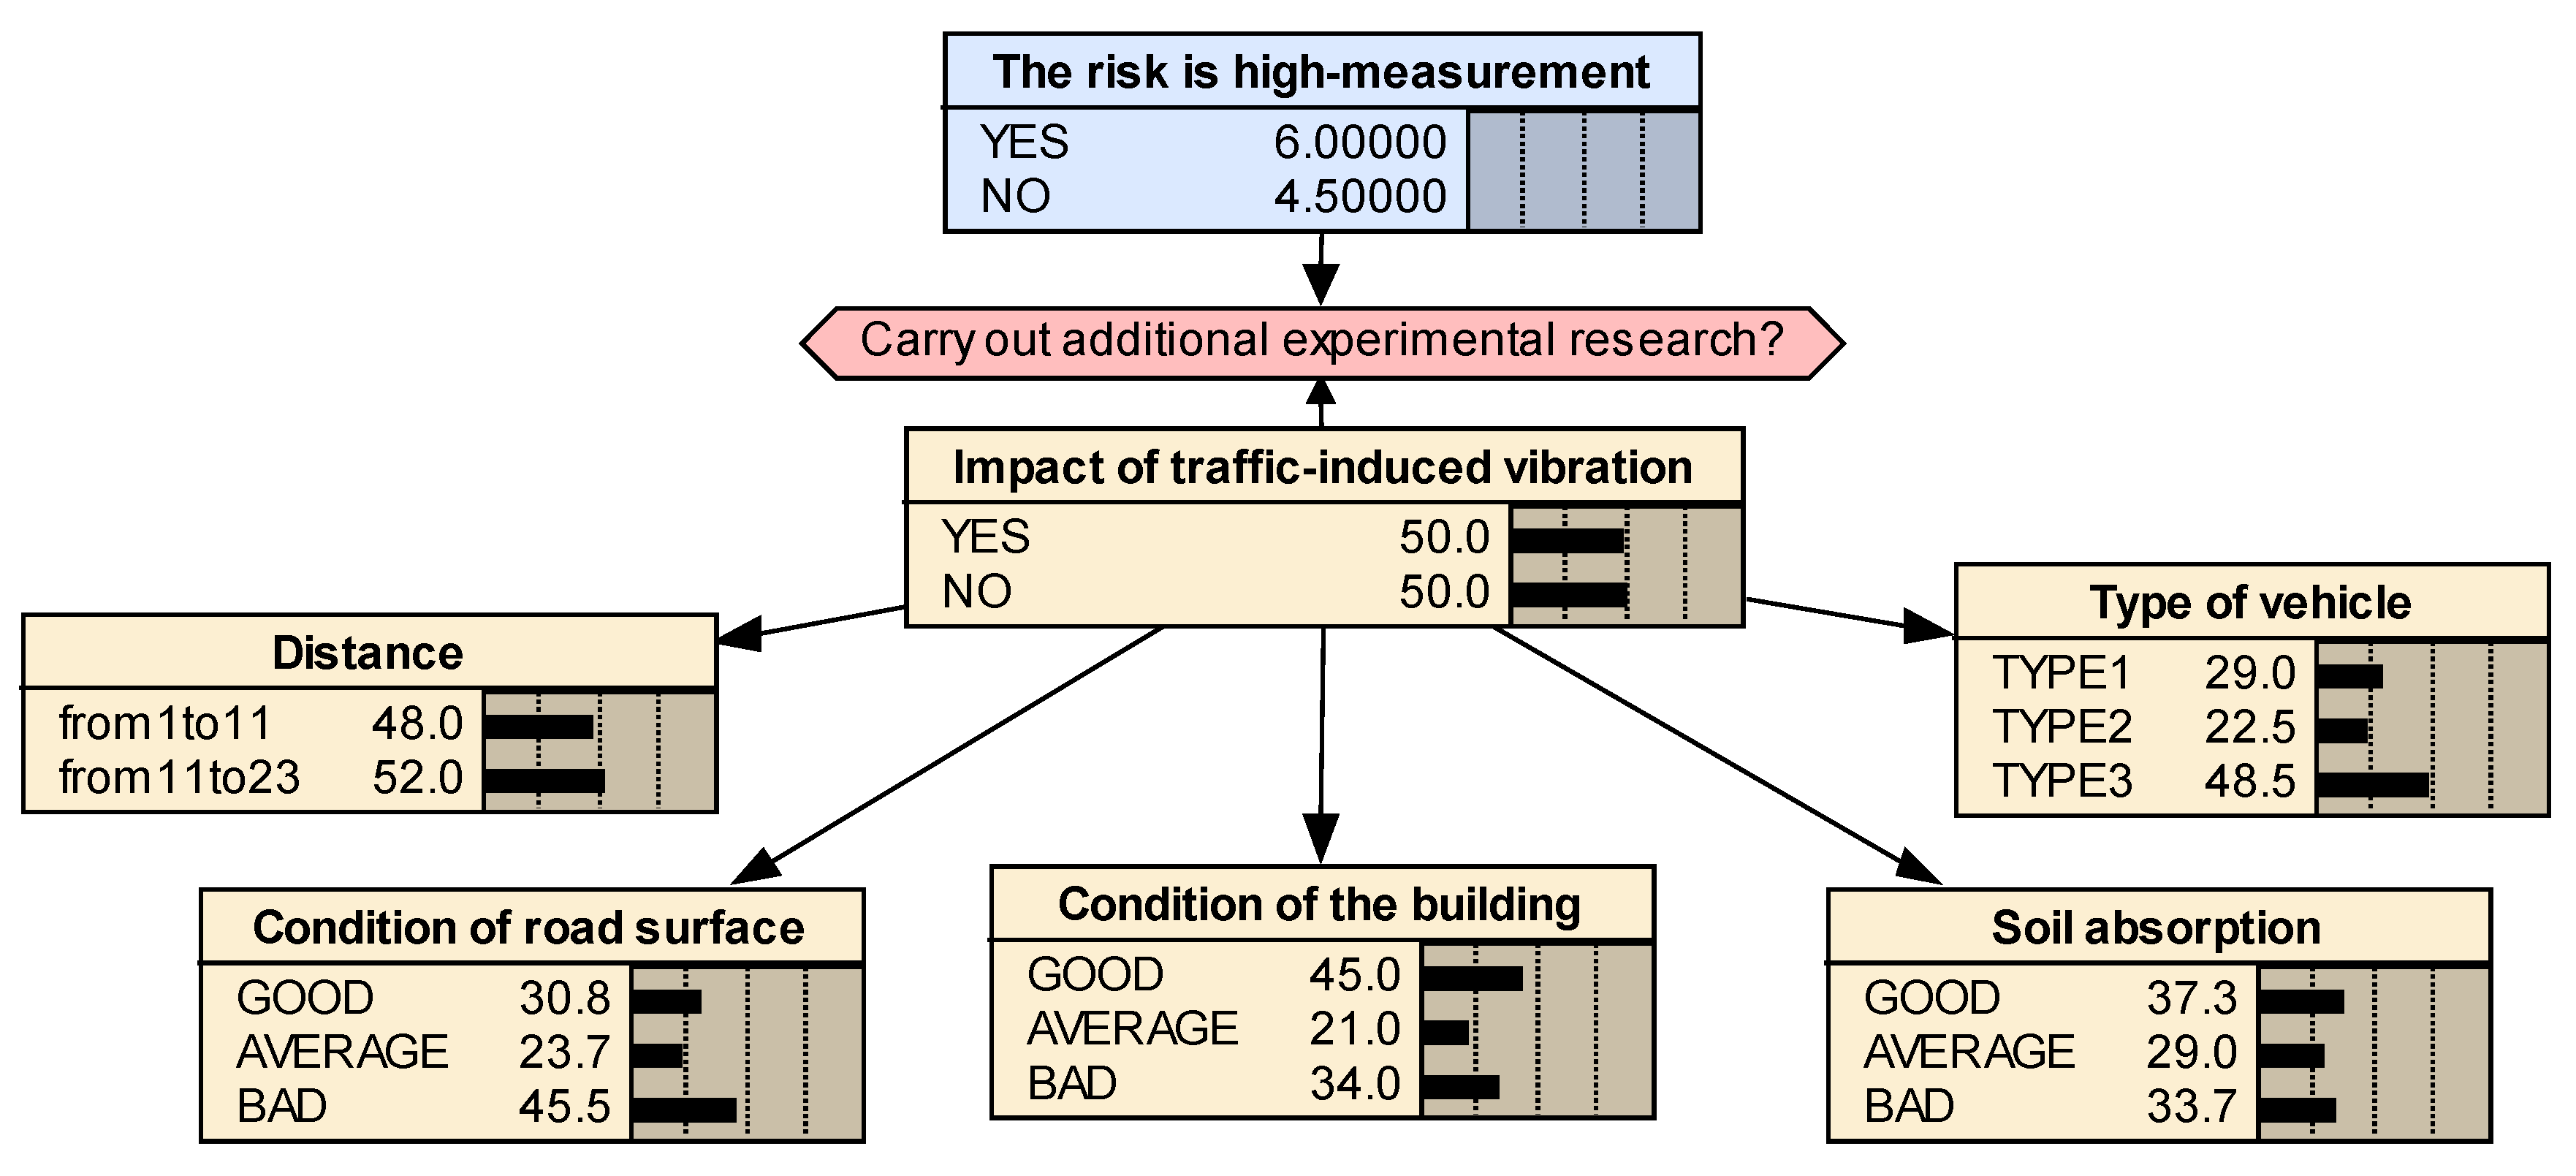
4.2. Problem Model
4.3. Rating the Value of Information
- EMV—expected decision value without any additional testing;
- EV|SI—expected decision value as a result of an additional testing, which can be determined as:
- p(z|e)—a priori conditional probability from a result of experiment (e) and observed state (z);
- u(e, z)—value of the most preferred decision from a result of experiment (e) and observed state (z).
- EV|SI1 = 0.45 × 7.30 + 0.21 × 6.00 + 0.34 × 9.29 = 7.705,
- EVSI1 = 7.705 – 6 = 1.705.
- k—base of logarithm,
- N—number of possible states.
- Napier—if the natural logarithm is used in formula (5);
- Decibel—if decimal logarithm is applied in formula (5);
- Bit—if log with base 2 is used in formula (5).
- M—number of symptom Y variable states;
- p(ym)—probability of the a priori state ym;
- H(X|ym)—entropy of the diagnostic variable at the given state ym of the symptom variable.
- H(X) = – (0.5 × log20.5 + 0.5 × log20.5) = 1.
- H(X|’Condition of the building’ = GOOD) = – (0.189 × log20.189 + 0.811 × log20.811) = 0.6993,
- H(X|’Condition of the building’ = AVERAGE) = – (0.5 × log20.5 + 0.5 × log20.5) = 1,
- H(X|’Condition of the building’ = BAD) = – (0.912 × log20.912 + 0.088 × log20.088) = 0.4298,
- H(X|’Condition of the building’) = 0.45 × 0.6996 + 0.21 × 1 + 0.34 × 0.4298 = 0.671,
- δH(X|’Condition of the building’) = 1 – 0.671 = 0.329.
5. Conclusions
Author Contributions
Funding
Conflicts of Interest
References
- Jankowski, R.; Mahmoud, S. Linking of adjacent three-storey buildings for mitigation of structural pounding during earthquakes. Bull. Earthq. Eng. 2016, 14, 3075–3097. [Google Scholar] [CrossRef] [Green Version]
- Falborski, T.; Jankowski, R. Polymeric bearings — A new base isolation system to reduce structural damage during earthquakes. In Key Engineering Materials; Trans Tech Publications: Zürich, Switzerland, 2013; Volume 569–570, pp. 143–150. [Google Scholar] [CrossRef]
- Elwardany, H.; Seleemah, A.; Jankowski, R. Seismic pounding behavior of multi-story buildings in series considering the effect of infill panels. Eng. Struct. 2017, 144, 139–150. [Google Scholar] [CrossRef]
- Naderpour, H.; Naji, N.; Burkacki, D.; Jankowski, R. Seismic response of high-rise buildings equipped with base isolation and non-traditional tuned mass dampers. Appl. Sci. 2019, 9, 1201. [Google Scholar] [CrossRef]
- Mezeh, R.; Sadek, M.; Hage Chehade, F.; Mroueh, H. Adaptive meshing scheme for prediction of high-speed moving loads induced ground vibrations. Comput. Geotech. 2018, 100, 188–202. [Google Scholar] [CrossRef]
- Mezeh, R.; Sadek, M.; Hage Chehade, F.; Shahrour, I. Adaptive analysis of infinite beams dynamics problems using the periodic configuration update method in the time domain. Int. J. Numer. Anal. Methods Geomech. 2017, 42, 618–635. [Google Scholar] [CrossRef]
- Hunaidi, O. Traffic vibrations in buildings. Constr. Tech. Update 2000, 39, 1–6. [Google Scholar]
- Jakubczyk–Gałczyńska, A.; Jankowski, R. Traffic–induced vibrations. The impact on buildings and people. In Environmental Engineering, Proceedings of the International Conference on Environmental Engineering, Vilnius, Lithuania, 22–23 May 2014; Vilnius Gediminas Technical University Press Technika: Vilnius, Lithuania, 2014. [Google Scholar] [CrossRef]
- Goetz, T. The Decision Tree: How to Make Better Choices and Take Control of Your Health; Rodale: Emmaus, PA, USA, 2010. [Google Scholar]
- Schmidt, V. Stochastic Geometry, spatial Statistics and Random Fields: Models and Algorithms; Springer: New York, NY, USA, 2015. [Google Scholar] [CrossRef]
- Jankowski, R.; Walukiewicz, H. Modeling of two-dimensional random fields. Probab. Eng. Mech. 1997, 12, 115–121. [Google Scholar] [CrossRef]
- Neapolitan, R.E. Learning Bayesian Networks; Pearson Prentice Hall: Upper Saddle River, NJ, USA, 2003. [Google Scholar]
- Arangio, S.; Beck, J.L. Bayesian neural networks for bridge integrity assessment. Struct. Control. Health Monit. 2012, 19, 3–21. [Google Scholar] [CrossRef]
- Kembłowski, M.W.; Grzyl, B.; Kristowski, A.; Siemaszko, A. Risk modelling with Bayesian Networks - case study: construction of tunnel under the Dead Vistula River in Gdansk. Procedia Eng. 2017, 196, 585–591. [Google Scholar] [CrossRef]
- Cárdenas, I.C.; Al-Jibouri, S.; Halman, J.I. A Bayesian belief networks approach to risk control in construction projects. In Proceedings of the 14th International Conference on Computing and Civil Engineering, Moscow, Russia, 27–29 June 2012. [Google Scholar]
- Lombaert, G.; Degrande, G. The experimental validation of a numerical model for the prediction of the vibrations in the free field produced by road traffic. J. Sound Vib. 2003, 262, 309–331. [Google Scholar] [CrossRef]
- Mhanna, M.; Shahrour, I.; Sadek, M.; Dunez, P. Efficiency of heavy mass technology in traffic vibration reduction: Experimental and numerical investigation. Comput. Geotech. 2014, 55, 141–149. [Google Scholar] [CrossRef]
- Mezeh, R.; Mroueh, H.; Sadek, M.; Hosseingholian, M. New approach for the assessment of train/track/ground dynamics using in-situ measurements of high-speed train induced vibrations. Soil Dyn. Earthq. Eng. 2019, 116, 50–59. [Google Scholar] [CrossRef]
- PN-B-02170:2016–12. Ocena szkodliwości drgań przekazywanych przez podłoże na budynki: Evaluation of the harmfulness of building vibrations due to ground motion; Polish Committee for Standardization of Measurement and Quality: Warszawa, Poland, 2016. (In Polish) [Google Scholar]
- ISO 2631-5:2018. Mechanical Vibration and Shock. Evaluation of Human Exposure to Whole-Body Vibration Part 5: Method for Evaluation of Vibration Containing Multiple Shocks; ISO: Geneva, Switzerland, 2018. [Google Scholar]
- BS 6472–1:2008. Guide to Evaluation of Human Exposure to Vibration in Buildings. Part 1: Vibration Sources Other Than Blasting; BSI: Plano, TX, USA, 2008. [Google Scholar]
- ISO 10137:2007. Bases for Design Of Structures – Serviceability of Buildings and Walkways against Vibrations; ISO: Geneva, Switzerland, 2007. [Google Scholar]
- DIN 4150–2. Structural Vibration, Part 2: Human Exposure to Vibration in Buildings; Deutsches Institut für Normung e.V.: Berlin, Germany, 1999. [Google Scholar]
- European Commission. Directive 2002/49/EC of the European parliament and the Council of 25 June 2002 relating to the assessment and management of environmental noise. Off. J. Eur. Communities 2002, 189, 12–25. [Google Scholar]
- Kawecki, J.; Stypula, K. Designing roads near the buildings providing the necessary vibrational comfort for the residents. Procedia Eng. 2013, 57, 549–556. [Google Scholar] [CrossRef]
- Fenton, N.; Neil, M. Risk Assessment and Decision Analysis with Bayesian Networks; CRC Press: Boca Raton, FL, USA, 2012. [Google Scholar]
- Kjaerulff, U.; Madsen, A. Bayesian networks and influence diagrams. Springer Sci. Bus. Media 2008, 200, 114. [Google Scholar] [CrossRef]
- Koller, D.; Friedman, N. Probabilistic Graphical Models: Principles and Techniques; MIT Press: Cambridge, MA, USA, 2009. [Google Scholar]
- Friedman, N.; Goldszmidt, M. Learning Bayesian networks with local structure. Learn. Graph. Model. 1998, 89, 421–459. [Google Scholar] [CrossRef]
- Heckerman, D.; Geiger, D.; Chickering, D.M. Learning Bayesian networks: The combination of knowledge and statistical data. Mach. Learn. 1995, 20, 197–243. [Google Scholar] [CrossRef] [Green Version]
- Dempster, A.P.; Laird, N.M.; Rubin, D.B. Maximum likelihood from incomplete data via the EM algorithm. J. R. Stat. Soc. 1997, 39, 1–38. [Google Scholar] [CrossRef]
- Jakubczyk-Gałczyńska, A. Predicting the impact of traffic–induced vibrations on buildings using artificial neural networks. In Proceedings of the 2nd Baltic Conference for Students and Young Researchers, Gdynia, Poland, 20–23 April 2018; p. 219. [Google Scholar] [CrossRef]
- Central Geological Database. Available online: http://baza.pgi.gov.pl (accessed on 27 December 2016).
- Hanson, C.E.; Towers, D.A.; Meister, L.D. Transit Noise And Vibration Impact Assessment; Report FTA-VA-90-1003-06; U.S. Department of Transportation, Federal Transit Administration, Office Planning and Environment: Washington, DC, USA, 2006.
- Ciesielski, R. Podstawy i nowości naukowe w inżynierii parasejsmicznej. Zesz. Naukowe Politech. Rzeszowskiej Mech. 2002, 60, 85–115. (In Polish) [Google Scholar]
- Dulińska, J.; Kawecki, J.; Kozioł, K.; Stypuła, K.; Tatara, T. Oddziaływania Parasejsmiczne Przekazywane na Obiekty Budowlane; Wydawnictwo Politechniki Krakowskiej: Kraków, Poland, 2014. (In Polish) [Google Scholar]
- Singpurwalla, N.D. Reliability and Risk: A Bayesian Perspective; John Wiley & Sons: Austin, TX, USA, 2016. [Google Scholar]
- Apollo, M.; Kembłowski, M.W. Observation value analysis – integral part of Bayesian diagnostics. Procedia Eng. 2015, 123, 24–31. [Google Scholar] [CrossRef]
- Xiang, Y.; Wong, S.K.M.; Cercone, N.A. Microscopic study of minimum entropy search in learning decomposable markov networks. Mach. Learn. 1997, 26, 65–92. [Google Scholar] [CrossRef]
- Mays, D.C.; Faybishenko, B.A.; Finsterle, S. Information entropy to measure temporal and spatial complexity of unsaturated flow in heterogeneous media. Water Resour. Res. 2002, 38, 1313. [Google Scholar] [CrossRef]
- Shannon, C.E. A mathematical theory of communication. Bell Syst. Tech. J. 1948, 27, 379–423. [Google Scholar] [CrossRef]
- Kucharek, M.; Treichel, W. Assessment of groundwater quality monitoring network based on information theory. In Recent Advances in Stochastic Modeling and Data Analysis; World Scientific: Singapore, 2007; pp. 636–644. [Google Scholar] [CrossRef]
- Beskou, N.D.; Theodorakopoulos, D.D. Dynamic effects of moving loads on road pavements: A review. Soil Dyn. Earthq. Eng. 2011, 31, 547–567. [Google Scholar] [CrossRef]
- Grundmann, H.; Lieb, M.; Trommer, E. The response of a layered half-space to traffic loads moving along its surface. Arch. Appl. Mech. 1999, 69, 55–67. [Google Scholar] [CrossRef]
- Paneiro, G.; Durão, F.O.; Costa e Silva, M.; Falcão Neves, P. Artificial neural network model for ground vibration amplitudes prediction due to light railway traffic in urban areas. Neural Comput. Appl. 2016, 29, 1045–1057. [Google Scholar] [CrossRef]
- Watts, G.R.; Krylov, V.V. Ground-borne vibration generated by vehicles crossing road humps and speed control cushions. Appl. Acoust. 2000, 59, 221–236. [Google Scholar] [CrossRef]


| No. | Photo | Distance | Surface Road | Surface Condition | Building Condition | Absorption of Soil | Dynamic Influence Scale |
|---|---|---|---|---|---|---|---|
| 1 |  | 7 m | Bitumen | GOOD | AVERAGE | GOOD | DIS I |
| 2 |  | 10 m | Bitumen | GOOD | GOOD | GOOD | DIS I |
| 3 |  | 9 m | Bitumen | BAD | GOOD | AVERAGE | DIS II |
| 4 |  | 15 m | Bitumen | AVERAGE | GOOD | AVERAGE | DIS I |
| 5 |  | 20 m | Bitumen | GOOD | GOOD | AVERAGE | DIS II |
| 6 |  | 8 m | Bitumen | GOOD | AVERAGE | AVERAGE | DIS I |
| 7 | 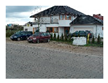 | 15 m | Reinforced concrete slabs | BAD | GOOD | GOOD | DIS II |
| 8 |  | 15 m | Reinforced concrete slabs | BAD | GOOD | GOOD | DIS II |
| 9 |  | 23 m | Bitumen | AVERAGE | GOOD | BAD | DIS II |
| 10 | 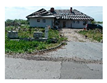 | 20 m | Bitumen | AVERAGE | GOOD | BAD | DIS II |
| 11 |  | 12 m | Ground | AVERAGE | GOOD | AVERAGE | DIS II |
| No. | Distance | Condition of Road Surface | Condition of Building | Soil Absorption | Type of Vehicle | Impact of Vibrations—BN Model | Impact of Vibrations—Experiment |
|---|---|---|---|---|---|---|---|
| 1 | 1–11 m | GOOD | AVERAGE | GOOD | TYPE 1 | NO 99.9% | NO |
| 2 | 1–11 m | GOOD | GOOD | GOOD | TYPE 2 | NO 99.3% | NO |
| 3 | 11–23 m | AVERAGE | GOOD | AVERAGE | TYPE 1 | NO 99.8% | NO |
| 4 | 1–11 m | BAD | GOOD | AVERAGE | TYPE 3 | YES 92.4% | YES |
| 5 | 1–11 m | GOOD | AVERAGE | AVERAGE | TYPE 2 | NO 89.2% | NO |
| 6 | 1–11 m | BAD | GOOD | AVERAGE | TYPE 2 | YES 72.2% | YES |
| 7 | 11–23 m | BAD | GOOD | GOOD | TYPE 3 | YES 58.2% | YES |
| 8 | 11–23 m | AVERAGE | GOOD | BAD | TYPE 1 | NO 99.6% | NO |
| 9 | 11–23 m | AVERAGE | GOOD | BAD | TYPE 2 | NO 81.7% | NO |
| 10 | 11–23 m | BAD | GOOD | AVERAGE | TYPE 1 | NO 97.2% | NO |
| 11 | 1–11 m | GOOD | GOOD | BAD | TYPE 2 | NO 92.4 % | NO |
| 12 | 1–11 m | BAD | AVERAGE | BAD | TYPE 3 | YES 99.4% | YES |
| 13 | 11–23 m | GOOD | AVERAGE | BAD | TYPE 3 | NO 57.6% | NO |
| 14 | 11–23 m | BAD | GOOD | BAD | TYPE 1 | NO 93.7% | NO |
| 15 | 11–23 m | AVERAGE | GOOD | BAD | TYPE 2 | NO 81.7% | NO |
| 16 | 11–23 m | AVERAGE | GOOD | BAD | TYPE 3 | YES 51.3% | YES |
| 17 | 11–23 m | BAD | GOOD | AVERAGE | TYPE 1 | NO 97.7% | NO |
| 18 | 11–23 m | BAD | GOOD | AVERAGE | TYPE 2 | YES 53.5% | YES |
| No. | Parameter | EVSI Method | Entropy Method |
|---|---|---|---|
| 1 | Distance | 0.070 | 0.029 |
| 2 | Condition of road surface | 2.116 | 0.426 |
| 3 | Condition of building | 1.705 | 0.329 |
| 4 | Soil absorption | 1.862 | 0.360 |
| 5 | Type of vehicle | 2.145 | 0.393 |
© 2019 by the authors. Licensee MDPI, Basel, Switzerland. This article is an open access article distributed under the terms and conditions of the Creative Commons Attribution (CC BY) license (http://creativecommons.org/licenses/by/4.0/).
Share and Cite
Siemaszko, A.; Jakubczyk-Gałczyńska, A.; Jankowski, R. The Idea of Using Bayesian Networks in Forecasting Impact of Traffic-Induced Vibrations Transmitted through the Ground on Residential Buildings. Geosciences 2019, 9, 339. https://doi.org/10.3390/geosciences9080339
Siemaszko A, Jakubczyk-Gałczyńska A, Jankowski R. The Idea of Using Bayesian Networks in Forecasting Impact of Traffic-Induced Vibrations Transmitted through the Ground on Residential Buildings. Geosciences. 2019; 9(8):339. https://doi.org/10.3390/geosciences9080339
Chicago/Turabian StyleSiemaszko, Agata, Anna Jakubczyk-Gałczyńska, and Robert Jankowski. 2019. "The Idea of Using Bayesian Networks in Forecasting Impact of Traffic-Induced Vibrations Transmitted through the Ground on Residential Buildings" Geosciences 9, no. 8: 339. https://doi.org/10.3390/geosciences9080339
APA StyleSiemaszko, A., Jakubczyk-Gałczyńska, A., & Jankowski, R. (2019). The Idea of Using Bayesian Networks in Forecasting Impact of Traffic-Induced Vibrations Transmitted through the Ground on Residential Buildings. Geosciences, 9(8), 339. https://doi.org/10.3390/geosciences9080339