Abstract
The development of modern technologies and accessibility of data on space and the natural environment has led to their increasing use for socio-economic purposes. Data users believe that these systems reflect the reality in the field. This applies in particular to databases used for construction investment projects or as the basis for calculations of financial obligations, e.g., taxes. The Land and Property Register (LPR), which is part of the Land Administration System, serves a number of economic and legal purposes. This geo-system often contains low-quality information regarding the technical potential of modern data acquisition methods and is continuously updated. The authors propose a two-step analysis of data contained in the LPR. The first step identified the sources of discrepancies between data from the LPR and the reality in the field. The second step emphasises the importance of the factors under analysis, which include both a plot’s geometric parameters, the geo-location features (associated with the natural environment elements) and factors associated with the supplementary data acquisition methods. The results show that sufficient quality data play the main role in achieving compatibility between the data in the Land and Property Register and with reality. Studies conducted so far have dealt with data on a global scale and were based on in situ data and focused on the specific values of each plot under analysis.
1. Introduction
A Land and Property Register (LPR) is a part of a land administration system, which is an essential national infrastructure element in many countries [1,2]. It should be an interdisciplinary register which meets the environmental, social and economic needs of society and guarantees sustainable development through the use of modern technologies [3,4,5]. Cadastral data can be organised differently in different countries [6,7,8,9]. A cadastre has to perform basic functions, including land registration, cadastral surveying and mapping, fiscal, legal and multi-purpose cadastres and land information systems [10,11,12]. As it is used so widely in different areas of the economy, an LPR has to be reliable, accurate and up-to-date [13,14]. Data in this register has to be frequently updated. Systematic registration of land titles and land geometry requires regularity, a constant process of updating as changes occur [15]. The demand for updating data is increasing as the use of this data has expanded into various fields and as the environment has changed over time. Data quality and consistency in various information systems have been discussed in numerous comparative studies. Kilpeläinen and Sarjakoski [16] discussed incremental updates based on map generalization. Harrie and Hellström [17] developed a prototype system for propagating updates from large-scale to small-scale data. Badard and Lemarie [18] described a tool of matching for updating, HU et al. [19] used new data for a generalization map, whereas Willrich [20] presented a procedure for the automatic control of cartographic data quality for testing the data consistency with reality (acronym ATKIS). Wing and Eklund [21], Wing et al. [22], Danskin et al. [23] and Wing and Frank [24] investigated the accuracy of various objects (forests, water bodies, roads, forest routes) mapped using global positioning satellite (GPS) tools. The issue of assessing the quality of the data in the Polish cadastre has only recently attracted academic attention [13,15,25,26]. Felcenloben [25] proposed a universal algorithm to monitor and assess the quality of cadastral data and the performance of the real estate cadastre on a global scale. Hanus et al. [14] evaluated errors in the position of boundary points in a cadastral database relative to legal requirements. Siejka et al. [27] verified topological errors in LPR databases.
The research results indicate that the quality and consistency of data are determined by numerous factors, including the terrain, the applied devices and technologies, as well as the legal requirements in different European Union (EU) countries. The majority of the studies quoted here take a global approach to the cadastral data or use algorithms to compare data quality automatically. In this study, individual differences and relationships in data measured in situ were analysed and the results reflect the data quality in the LPR.
The aim of this study was to test the compatibility of data in the LPR relative to reality. This would create a model of the relationships between the originating discrepancies with the geometric parameters of the plots (area, number of plot border bends), geo-location, environmental factors and the data sources and would enable the correction of the data in the register.
This paper is constructed in the following manner: the introduction (Section 1) is followed by Section 2 which focuses on the literature analysis with respect to the origin of data in the LPR and legal opportunities of its correction, and Section 3 presents the study methodology as well as the area and scope of the data under analysis. Section 4 presents the study results, which include the results of comparisons and modelling of the arising discrepancies based on hedonic regression. Section 4 presents the study results discussion and Section 5 summarises the analyses.
2. Literature Review
2.1. Origin of the Data in the Polish Land and Property Registry (LPR)
Operation (organisation, financing, sharing, control, data update, etc.) of the land and property registry in Poland is based on legal regulations. Although the LPR is a set of data which supports the perpetual register system, it also serves other functions, including: property management, economic and spatial planning, public statistics, calculations of taxes and charges and (following EU accession) the register of agricultural farms [28]. The principles of creating the first register maps in Poland were laid down in the land and building register decree of 1955 [29] and an instruction on establishing and maintaining the land register [30]. According to these legal regulations, in order to preserve the content continuity and consistency, the use of other maps, prepared in accordance with the valid technical standards as of the time of their creation, is acceptable until the basic maps are created. In particular, the technical regulations (1) of the Ministry of Public Works of 1920 and 1928 were accepted [30]; (2) technical instructions of the Ministry of Agriculture and Agricultural Reforms of 1930 on the principles of conducting the agricultural reform, land consolidation and its division [30]; (3) Prussian cadastral instructions No II, VIII and IX; [30]; (4) Austrian cadastral instructions of 1904 and 1907 [30]; (5) the cadastral instruction No II for supplementary survey of 1926 [30]; (6) other survey regulations applicable in the Polish land before 1920, particularly those concerning separations and liquidations of servitudes etc. [30], (7) general regulations on the national survey issued by the Central Office of Geodesy and Cartography, and [30], and (8) survey regulations issued by ministries following consultations with the Central Office of Geodesy and Cartography (on regulations, land exchange, state forest surveys, state-run agricultural farms surveys, surveys for investment execution, etc.) [30]. These legal acts, procedures, regulations and ordinances allowed the use of source materials on land and buildings to create a LPR from the partitioning powers (Poland lost its independence in 1772, when it was partitioned by Prussia, Russia and Austria-Hungary, and regained it after the First World War). Maps and documents which were the basis for creating the first property database were of varying technical value (because different surveying techniques and rules were employed at the time, as well as equipment whose accuracy differed much from that used these days). After a long period when politics and the economy were influenced by the former USSR, a political transformation started in Poland and in other East European countries in 1989 [31]. It not only affected the lives of individuals, but also the way property was perceived (legal protection of rights to property, official registration of legal status of property, the free real estate market), access to modern technologies used in geodetic surveys and creating maps. Further considerable changes with respect to the requirement of having up-to-date and accurate data on property took place after Poland’s accession to the European Union. As a result of these changes, the authorities were obliged to construct new real estate databases to obtain subsidies from the EU, among other things. Of considerable influence on accelerating the LPR data update was Directive 2007/2/EC of the European Parliament of the European Union on infrastructure of spatial information (INSPIRE) [32], which provided the basis for creating uniform spatial data sets [33]. The main aim of this document was to enable sharing spatial data accumulated at one level of public authorities by other public authorities for actions related to the natural environment and for actions related to social policy and knowledge [34].
Updating the LPR data is a permanent process, which has to be spread over many years due to its scale (there are approximately 30 million plots in Poland) and cost [15,35,36]. It is a very important process, as it affects (1) communes’ income from real estate tax (the tax on real estate is Poland is still based on the area of the plot and way of land use), (2) land management (it is difficult to determine who is responsible for the plot ), including crisis situations; (3) the possibility of the plot development (with respect to the minimum distance from infrastructural objects); (4) conflicts within the community arising from an unclear course of the border between plots.
2.2. Legal and Technical Procedures Which Enable Changes in the Land and Property Registry
According to the current regulations in Poland, LPR data can be changed by means of a regular update or as part of the modernization procedure [28]. The plot border can be delimited on the basis of various geodetic and legal actions. The choice depends mainly on the quality of data. For a full set of data for a plot border to be updated and its course to be consistent with the documentation, the procedure for mapping out the border points previously disclosed in the LPR is required [28]. If the data are incomplete, both legally and in the field, it is possible to restore the border markers [28], to establish the border of a registered plot [37,38], to separate pieces of real estate [28,39], to establish the line of a water body border [40] and to adopt a real estate border in the procedure of a plot division [41]. Table 1 presents border attributes with the legal procedure by which their course can be determined.

Table 1.
Listing of border attributes with the legal procedure by which their course can be determined.
3. Materials and Methods
3.1. Methodology, Data Collecting and Analysis
LPR data compatibility determinants were examined in several steps (Figure 1). The first step involved acquiring existing survey documentation and assessing its utility for data updates. This step demonstrated that there are existing surveys for the area, data from which can be used for digital description of record plot borders; however, this did not apply to all plots. Subsequently, points of the geodetic control network, established for the survey established for land and property register and some border points were sought and measured. They were used to calculate the area of individual plots with linear and angular measures, rectangular grid sampling or transformations (from the local to national system). The existing digital cadastral map was updated with the measurement results. When the existing documentation did not allow for delimiting the borders, screen vectorisation was performed to delimit the existing borders which easily fluctuate (they are unstable because of their characteristic position). Subsequently, the area of all the plots (in the LPR) under study was listed and compared to the area newly determined from the documents in hand and additional surveys. The geo-location of each plot was examined and described with respect to the attributes under analysis. Subsequently, a model was created of the relationship between the area change index (expressed as absolute percentage), factors selected based on the literature analysis [21,22,23,24,25,26] and the study material.
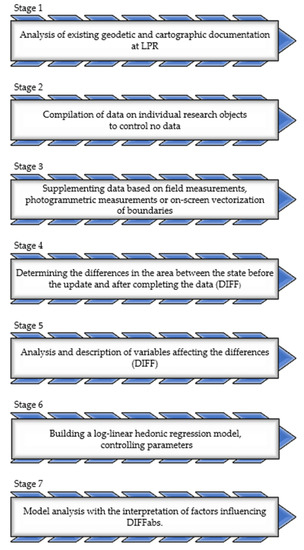
Figure 1.
Stages of research. Source: own study.
The model of the relationship between the independent variables and the dependent variable (DIFFabs.) was based on the hedonic regression analysis. This model was based on the assumption that heterogenic factors can be described with individual characteristics or their attributes [42,43,44,45,46]. Therefore, hedonic regression models can be used to assess how individual attributes affect the final area change index. This means that the final difference (DIFFabs.) depends on a combination of individual characteristics, which—for the model under study—include such attributes as the data source (SOURCE), the plot position in the vicinity of objects with blurred borders (SLOC), the number of plot border points (NBOR) and the plot area (AREA). Three types of function forms: linear, logarithmic and logarithmic-linear are often used in empirical analyses which employ the hedonic regression models [47]. Several researchers prefer to use the so-called semi-logarithmic model for different reasons [42,48]. One reason given is that the semi-logarithmic model coefficients can be interpreted as the percentage change of the independent variable [49,50]. These models can be expressed in the following form:
where is the calculated area change factor for plot i under study, is the vector of attributes affecting the differences, is the vector of the associated coefficients to be estimated, and is the vector of error terms. Attributes were selected based on a literature analysis and they were obtained by deduction following the practical LPR database update. The analysed variables are described in Table 2. The effect of independent variables was interpreted [49,50,51] according to the formula (2), which allowed for determination of the percentage effect of each attribute under study on the final area change index:
where importance of an attribute, and regression coefficient.
Table 2.
Basic statistical data of the model, together with attribute description.
3.2. Description of Area Research
The area covered by the analysis is situated in the Podlaskie Voivodship, in the north-east of Poland, in the geographical centre of Europe. The region borders Belarus and Lithuania. The municipality of Wąsosz (administrative unit), in which the villages (cadastral district) under study are situated, is an agricultural area (arable land accounts for 67.4% of the area, pastures and meadows −28.9%, forest −21.6%). The municipality area is 117.98 km2, the population is 4050 people and the population density is 34 people/km2. The municipality landscape is dominated by open agricultural land on wavy hills divided along the meridian with the Wissa River proglacial valley with a grassy land complex. There is a marshy lowland in the eastern part of the municipality, linked to the Biebrza proglacial valley. Two large forest complexes can be identified: Żebry and Ławsk. There are two nature reserves: Ławski Las I (area: 108.93 ha) and Ławski Las II (area: 75.38 ha). The air in the municipality of Wąsosz is clean and there are no industrial plants; large amounts of gravel are its natural resource. The coordinates of the central part of the commune: N: 53°31’27”, E: 22°19’00” (X: 633975, Y: 719695—PUWG 1992). Figure 2 shows the position of the area under analysis.
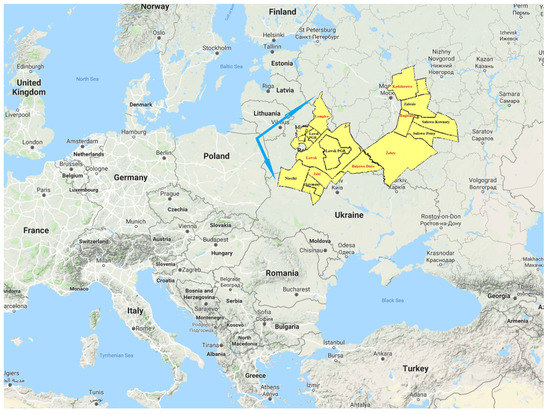
Figure 2.
The map showing the study area position. Source: own study on [52].
The study area included 3273 plots, for which the area change index was determined. The plots were situated in the villages (cadastral districts) of Żebry, Ławsk, Jaki, Bukowo Duże, Kudłaczewo, Kędziorowo, Łempice, Modzele and Bagiennice, in the municipality of Wąsosz, in the district of Grajewo, in Podlaskie Voivodship (Poland). The study data were acquired from the County Centre for Geodetic and Cartographic Documentation in Grajewo and in situ surveys. The portal [52] was used, which contains cadastral data and an orthophotomap (using the Web Map Servis browsing service compliant with the Open Geospatial Consortium standards).
4. Results
The first study stage involved an analysis of the DIFF index. 3273 plots situated in nine villages were analysed (see Supplementary Table S1). The largest number of plots were situated in the villages of Ławsk (927), Żebry (684), Kędziorowo (354), and the fewest were in Kudłaczewo (122) and Jaki (198) (see Table 3 providing the basic data for the cases under analysis). The maximum plot area increase index was 135%, for a plot situated in the village of Bukowo Duże (before 20 m2, after 47 m2). The maximum decrease was −83.88%, for a plot situated in the village of Żebry, bordering on the Wissa River (see Figure 3 showing the distribution of differences in the villages). The area of nearly 48% of the plots under study decreased, 50% increased and the area of approx. 2% (51 plots) remained unchanged.
Table 3.
Description of nominal data.
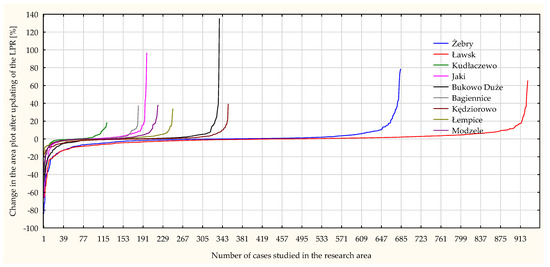
Figure 3.
Distribution of the plot area change index [%] in the villages under study. Source: own study on Statistica 13.1.
In general, the area of the villages under study neither increased nor decreased. The index analysis in the absolute approach (DIFFabs.) showed that the area of each plot changed by an average of 4%. The greatest changes occurred in the village of Jaki (6.029%) and the smallest occurred in the village of Kędziorowo (2.754%) (see Table 3).
The next stage of analysis involved listing the DIFFabs. index and describing each plot with respect to four attributes: (a) source of data on the position of border points on which the LPR data was updated (SOURCE); (b) position of the plot under analysis in the vicinity of objects whose border is fuzzy because of the environmental conditions (e.g., meandering rivers, the border being overgrown by forest plants, agricultural machines driving along non-hardened roads, etc.) (SLOC); (c) the number of border bends (polygonal plots in agricultural areas have a number of border points, they are susceptible to being destroyed) (NBOR); (d) plot area (AREA) (see Tab. 2). The choice of attributes was based on a literature analysis [21,22,23,24,25,26] and deduction during the data accumulation and geo-location analysis for each plot. The distribution of the DIFFabs. index in the model was examined with the Kolmogorov–Smirnov test, which makes the assumption that the analysed variables have normal distribution [53]. The tested distribution was not statistically significant (p >0.05), and the null hypothesis was confirmed. Since the F-test for four independent variables and 3268 (N-m-1) cases equaled F = 959.30, the hypothesis that regression coefficients are not statistically significant was rejected, and an alternative hypothesis was adopted. The multiple correlation coefficient for the model, which determines the total impact degree of all explaining variables on the explained variable is R = 0.7349. Since the log-linear model explained 54% of total variance in the dependent variable (R2 = 0.5394), the model was, therefore, fitted to the data (see Figure 4). It should be noted that the model takes into account all the observed and calculated cases of discrepancy, without rejecting any plot under analysis. Independent (explaining) variables describing the model are statistically significant at α = 0.05, they do not exhibit co-linearity (after performing the correlation matrix analysis).
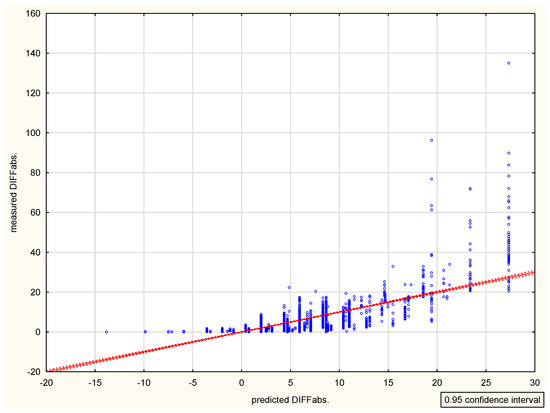
Figure 4.
Distribution of the expected value of the DIFFabs. discrepancy model relative to the measured values. Source: own study on Statistica 13.1.
The hedonic model (see Table 4) shows that the differences in DIFFabs. are affected to the greatest extent by SOURCE (data source) and AREA (plot area) attributes.
Table 4.
Modelling results.
5. Discussion
The aim of the study was to analyse the plot area change index (DIFF) and DIFFabs. generated by updating the data and creating a model whose attributes determine the originating differences. As the results show, discrepancies can originate for various reasons. Their sources may include the quality of source (primary) materials upon which the LPR was based. The use of different geodetic and cartographic materials of varied quality was allowed in the initial stage of creating the Polish LPR. These materials, now archival, were made using the manual technique, on easily-deformed bases [54,55]. The survey techniques, survey principles and the precision of equipment used several decades ago was different than today. Another factor which could favour the formation of distortions was the process of rasterisation, which enabled the transformation of analogue maps into digital maps. According to Liao et al. [56], Wade et al. [57], the process did not often improve the primary data quality or eliminate map deformation errors, and it also may have even lowered the accuracy and shape of objects on the map.
Close examination of the case study under analysis shows that the differences were affected to the greatest extent by: the plot area AREA (65% impact when the other factors were constant) and the origin of data used in the SOURCE update (64% impact when the other factors were constant). The AREA attribute had a negative impact on the DIFFabs. This means that the area change index decreased with an increasing area of the plot under analysis. Therefore, small plots are more susceptible to discrepancies than large plots. This attribute was graded by adopting surface thresholds (see description in Table 2). The smallest perceptible discrepancies were observed for plots exceeding 20 ha, whereas the largest discrepancies were for plots up to 1000 m2.
In the case of the SOURCE attribute, the greatest negative impact on the plot area change index was observed for data acquisition/supplementation based on screen vectorisation of plot borders. This is usually done on the latest orthophotomaps. The operator’s experience and the photo-interpreter’s ability to interpret field details [58] is of great importance in this action [59]. Similar conclusions were arrived at by Grandgiard and Zieliński [60] in their analysis of the development field reported by farmers with respect to the payment of subsidies from the European Union.
The smallest discrepancies in DIFFabs. originated when a complete set of documents from earlier surveys existed, usually prepared for investment purposes. The process of obtaining a building permit in Poland is based on the accumulated geodetic and cartographic documentation. Each investor has to have a 1:500 map covering the area of a future investment project, which requires him to hire a geodetist with a state licence and to have a map made (or updated). Following an update, such a map is transferred to the Land and Property Register, which ensures the investment areas usually have high-quality data.
The other attributes taken for the analyses also had an impact on the discrepancies (DIFFabs.). The NBOR attribute, which describes the number of bends on the plot border, had an impact of 28% (with a constant level of the other attributes). The plots with four border points had a smaller impact on the discrepancies than the polygonal ones, with multiple bend points. The last attribute (SLOC) describes the vicinity of natural objects whose borders are often destroyed, such as a river, dirt road, forest or a drainage ditch and had an impact of 15% on the emerging differences (with the constant level of the other attributes). In practice, the field and document stability of such a border is low (see Figure 5). A river meanders in a natural manner, the river channel shape in the horizontal plane is affected not only by the level of inflowing precipitation, but also by all changes in the method of land use, both in the micro- and macro-location (buildings, land hardening, grass growing, etc.).
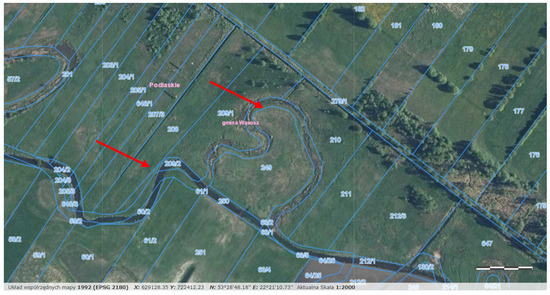
Figure 5.
An example of an object with an easily modified border: the Wissa River. Source: own study on [52].
It is similar with the vicinity of dirt roads, the border between arable land and a forest, of a plot border, which is also an edge or the axis of a drainage ditch. Because of a small number of permanent elements of infrastructure, such a border is easily eroded, overgrown by forest vegetation, bushes or tall grass. A dirt road as an example of plots whose borders are easily modified is shown in Figure 6.
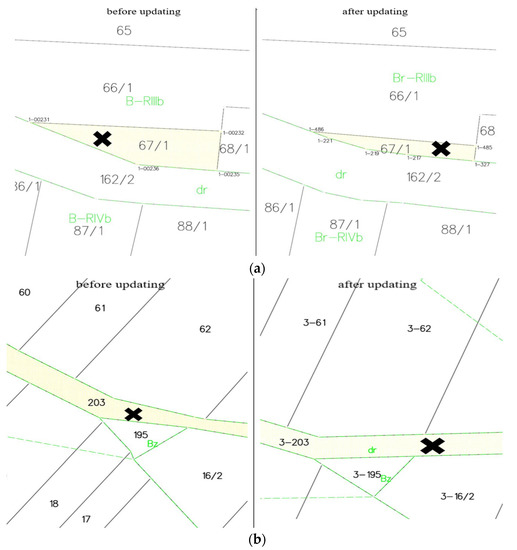
Figure 6.
An example of changing borders of dirt road (a—change of the plot area in the vicinity of a dirt road, b—change of the area of the dirt road). Source: own study.
Having up-to-date data in the Land and Property Register is very important for each country, because it affects several aspects of socio-economic life. According to the law, officials are obliged to keep the database up-to-date [28,61,62]. LPR data provide the basis for tax calculations [28]. Any office charging an agricultural, forest or real estate tax takes data from the register as the basis for calculations, because the fiscal model applicable in Poland depends on the land area and its way of use. Residential and industrial purposes have a higher tax rate while forest and agricultural land have a lower tax rate. Precise determination of the plot area, taking into account its current use, allows a fair amount of tax to be calculated. The data, therefore, have an indirect effect on the commune revenue [63,64] (in Poland, real estate tax is an income source of the commune), which is the main source of financing the activities of a local government unit. Credibility is necessary to calculate taxes in a fair way, to increase the citizens’ sense of safety and to guarantee their ownership rights [11,65]. Out-of-date LPR data may result in hindering investments in spatial development. A real estate property with an unclear legal status extends the time necessary to prepare land for investment projects [66] or even cancel the project [67]. According to Noszczyk, Hernik [15], Głowacka et al. [68] the poor update status of cadastral data also has social consequences. These include, first and foremost, potential socio-spatial conflicts and social dissatisfaction caused by such factors as lack of access to a public road, joint ownership, land easements, incorrect boundaries, discrepancies between legal documentation and the actual situation, the procedure for converting land from agricultural use and relevant fees [69].
6. Conclusions
Changes in space, development of infrastructure and survey technology and, in many cases, outdated LPR data, mean that the documents held by officials may fail to reflect the situation in the field. This situation affects the socioeconomic processes in each country. Making the register data compatible with the situation in the field is a long and costly process. However, this should not be an argument against updating the data. This study examined 3273 cases of discrepancies between the situation in the documents and the situation in the field. An analysis of each case of discrepancy revealed data which can be used to update the geometric parameters of the plots under analysis and their geo-location and surroundings, including natural elements with unstable borders. A hedonic model of relationships was also built, which demonstrated that the discrepancies are affected the most by the quality of source data and the terrain conditions. The proposed model can be used with other real estate databases.
However, this study also has its limitations. The number of analysed cases accounts for only a small fraction of all the plots in Poland (approximately 30 million). Another limitation may be the number of variables in the modelling process. Both of these elements will be developed further in the project, which will include an analysis of data quality in the land and property register on urban areas and their compatibility with data obtained from high resolution orthophotomaps.
Supplementary Materials
The following are available online at https://www.mdpi.com/2076-3263/9/7/303/s1: Table S1: Data used to build the model.
Author Contributions
Conceptualization, K.K.-B.; methodology, K.K.-B.; software, K.K.-B. and M.S.; validation, K.K.-B. and M.S.; formal analysis, K.K.-B.; investigation, K.K.-B.; resources, K.K.-B.; data curation, K.K.-B. and M.S.; writing—original draft preparation, K.K.-B.; writing—review and editing, K.K.-B.; visualization, K.K.-B. and M.S.; supervision, K.K.-B.; project administration, K.K.-B.; funding acquisition, K.K.-B.
Funding
This research was financed by the Ministry of Science and Higher Education of the Republic of Poland under grant No. 28.610.015-300.
Conflicts of Interest
The authors declare no conflict of interest. The funders had no role in the design of the study; in the collection, analyses, or interpretation of data; in the writing of the manuscript, or in the decision to publish the results.
References
- Williamson, I.P.; Grant, D.M. United Nations-FIG Bathurst Declaration on Land Administration for Sustainable Development: Development and Impact. FIG XXII International Congress 2002, Geomatics and Property Valuation for Global Sustainable Development. Session TS7.5. Available online: http://www.csdila.unimelb.edu.au/publication/conferences/UN_Fig_BathurstDeclaration.pdf (accessed on 10 May 2019).
- Rajabifard, A.; Williamson, I.; Steudler, D.; Binns, A.; King, M. Assessing the worldwide comparison of cadastral systems. Land Use Policy 2007, 24, 275–288. [Google Scholar] [CrossRef]
- Bennett, R.; Rajabifard, A.; Kalantari, M.; Wallace, J.; Williamson, I. Cadastral Futures: Building a New Vision for the Nature and Role of Cadastres. International Federation of Surveyors. FIG Peer Rev. J. 2010, 4096. FIG Congress 2010, Australia, ISBN 978-87-90907-87-7. Available online: http://www.fig.net/resources/proceedings/fig_proceedings/fig2010/papers/ts08k/ts08k_bennett_rajabifard_et_al_4096.pdf (accessed on 10 May 2019).
- Mika, M. An analysis of possibilities for the establishment of a multipurpose and multidimensional cadastre in Poland. Land Use Policy 2018, 77, 446–453. [Google Scholar] [CrossRef]
- Dawidowicz, A.; Źróbek, R. A methodological evaluation of the Polish cadastral system based on the global cadastral model. Land Use Policy 2018, 73, 59–72. [Google Scholar] [CrossRef]
- Divithure, H.; Tang, C. Evolution of land registration and cadastral survey systems in Sri Lanka. Surv. Rev. 2013, 45, 126–135. [Google Scholar] [CrossRef]
- Lisec, A.; Navratil, G. The Austrian land cadastre: From the earliest beginnings to the modern land information system. Geod. Vestn. 2014, 58, 482–516. [Google Scholar] [CrossRef]
- Shibeshi, G.B.; Fuchs, H.; Mansberger, R. Lessons from systematic evaluation of land administration systems. the case of amhara national regional state of Ethiopia. World Dev. 2015, 68, 282–295. [Google Scholar] [CrossRef]
- Ilyushina, T.V.; Noszczyk, T.; Hernik, J. Cadastral system in the Russian Federation after the modern transformation. Surv. Rev. 2017, 50, 437–446. [Google Scholar] [CrossRef]
- Steudler, D. A Framework for the Evaluation of Land Administration Systems. Ph.D. Thesis, University of Melbourn, Parkville, Australia, 2019. Available online: http://www.geom.unimelb.edu.au/research/publications/PhDThesisDanielS.pdf (accessed on 16 April 2019).
- Çağdaş, V.; Stubkjær, E. Doctoral research on cadastral development. Land Use Policy 2009, 26, 869–889. [Google Scholar] [CrossRef]
- Leitmanová, M.; Bažík, J.; Muchová, Z. New methods for gathering the spatial data from land consolidation project. Acta Sci. Pol. Form. Circumiectus 2015, 14, 125–133. [Google Scholar] [CrossRef]
- Kocur-Bera, K. Data compatibility between the Land and Building Cadaster (LBC) and the Land Parcel Identification System (LPIS) in the context of area-based payments: A case study in the Polish Region of Warmia and Mazury. Land Use Policy 2019, 80, 370–379. [Google Scholar] [CrossRef]
- Hanus, P.; Pęska-Siwik, A.; Szewczyk, R. Spatial analysis of the accuracy of the cadastral parcel boundaries. Comput. Electron. Agric. 2018, 144, 9–15. [Google Scholar] [CrossRef]
- Noszczyk, T.; Hernik, J. Understanding the cadastre in rural areas in Poland after the socio-political transformation. J. Spat. Sci. 2019, 64, 73–95. [Google Scholar] [CrossRef]
- Kilpeläinen, T.; Sarjakoski, T. Incremental generalization for multiple representations of geographic objects. In GIS and Generalization; Lagrange, J., Weibel, R., Eds.; Taylor & Francis: London, UK, 1995; pp. 209–218. [Google Scholar]
- Harrie, L.; Hellström, A.K. A prototype system for propagating updates between cartographic data sets. Cartogr. J. 1999, 36, 133–140. [Google Scholar] [CrossRef]
- Badard, T.; Lemarié, C. Propagating updates between geographic databases with different scales. In Innovations in GIS VII: GeoComputation; Atkinson, P., Martin, D., Eds.; Taylor and Francis: London, UK, 1999; pp. 135–146. [Google Scholar]
- Hu, Y.G.; Chen, J.; Li, Z.L.; Zhao, R.L. Road data updating using tools of matching and map generalization. Int. Arch. Photogramm. Remote Sens. Spat. Inf. Sci. XXXVII Part B 2008, 4. Available online: https://www.isprs.org/proceedings/XXXVII/congress/4_pdf/52.pdf (accessed on 5 March 2019).
- Willrich, F. Quality control and updating of road data by GIS-driven road extraction from imagery. In Proceedings of the Joint International Symposium on ‘Geospatial Theory, Processing, and Applications’, Ottawa, ON, Canada, 8–12 July 2002; Available online: https://pdfs.semanticscholar.org/e07e/8050863dc7b8bc791b8a7547437834ccdb42.pdf?_ga=2.70702480.1090911911.1559565628-257693347.1554364820 (accessed on 10 May 2019).
- Wing, M.G.; Eklund, A. Performance comparison of a low-cost mapping grade global positioning systems (GPS) receiver and consumer grade GPS receiver under dense forest canopy. J. For. 2007, 105, 9–14. [Google Scholar] [CrossRef]
- Wing, M.G.; Eklund, A.; Sessions, J.; Karsky, R. Horizontal measurement performance of five mapping-grade GPS receiver configurations in several forested settings. West. J. Appl. For. 2008, 23, 66–171. [Google Scholar] [CrossRef]
- Danskin, S.; Bettinger, P.; Jordan, T. Multipath mitigation under forest canopies: A choke ring antenna solution. For. Sci. 2009, 55, 109–116. [Google Scholar] [CrossRef]
- Wing, M.G.; Frank, J. Vertical measurement accuracy and reliability of mapping-grade GPS receivers. Computers Electron. Agriculture 2011, 78, 188–194. [Google Scholar] [CrossRef]
- Felcenloben, D. Ocena jakości danych ewidencyjnych oraz efektywności funkcjonowania katastru nieruchomość (Assessment of the quality of register data and the effectiveness of the functioning of the real estate cadastre). Monografie 2015, 181, 203. [Google Scholar]
- Kocur-Bera, K.; Piórkowska, K. The role of the Land Administration System in the process of developing and updating the Land Parcel Identification System—A case study of high nature value farmland in north-eastern Poland. In Proceedings of the 25th Anniversary Conference Geographic Information Systems Conference and Exhibition GIS ODYSSEY, Perugia, Italy, 10–14 September 2018; pp. 252–261. Available online: http://www.gis.us.edu.pl/index.php/conference-proceedings-2018 (accessed on 5 March 2019).
- Siejka, M.; Ślusarski, M.; Zygmunt, M. Verification technology for topological errors in official databases with case study in Poland. Surv. Rev. 2014, 46. [Google Scholar] [CrossRef]
- Geodetic and Cartographic Law of 17 May 1989 (Journal of Laws 30, item 163). Available online: http://www.isap.gov.pl (accessed on 4 March 2019).
- Decree on 2 February 1955 r. On the Registration of Land and Buildings (Journal of Laws 6, item 32). Available online: http://www.isap.gov.pl (accessed on 4 March 2019).
- Instructions on 8 September 1956 on Establishing and Maintaining Land Records, Principles of Drawing up Lists of Land and Fees for Extracts from Maps and for Excerpts and Extracts from Registers and Documents Forming Part of the Registration Survey in the Area of the Capital City of Warsaw, of Lodz and Cities Constituting Poviats (Journal of Laws 98, item 1135). Available online: http://www.isap.gov.pl (accessed on 10 March 2019).
- Cetl, V.; Roic, M.; Mastelic, S.I. Towards a real property cadastre in Croatia. Surv. Rev. 2012, 44, 17–22. [Google Scholar] [CrossRef]
- Directive 2007/2/ EC of the European Parliament and of the Council of 14 March 2007 Establishing an Infrastructure for Spatial Information in the European Community (INSPIRE). Available online: http://data.europa.eu/eli/dir/2007/2/oj (accessed on 14 March 2019).
- Portele, C. Spatial Data Interoperability in INSPIRE. Interactive Instruments. Available online: https://www.paikkatietoikkuna.fi/documents/108478/45ee0d1c-7285-4ae5-9170-7f8ea75411ab (accessed on 24 March 2019).
- Bielecka, E.; Dukaczewski, D.; Janczar, E. Spatial Data Infrastructure in Poland—Lessons learnt from so far achievements. Geod. Cartogr. 2018, 67, 3–20. [Google Scholar] [CrossRef]
- Zwirowicz, K. Selected economic and technical aspects of the use of cadastral data for the purpose of land use. J. Pol. Real Estate Sci. Soc. 2010, 18, 67–75. [Google Scholar]
- Konieczna, J. Agricultural land and updated surveys as the basis of the spatial structure of rural areas. Infrastruct. Ecol. Rural Areas 2012, 1, 197–206. [Google Scholar]
- Regulation of the Minister of Regional Development and Construction on 29 March 2001 on the Registration of Land and Buildings. Available online: http://www.isap.gov.pl (accessed on 3 March 2019).
- Announcement of 3 January 2019 regarding the Publication of a Uniform Text of the Regulation of the Minister of Regional Development and Construction on the Registration of Land and Buildings (item 393). Available online: http://www.isap.gov.pl (accessed on 4 March 2019).
- Balawejder, M.; Świerzb, K. Technology of demarcation the real estate in Poland. In Proceedings of the International Scientific and Practical Internet-Conference of Young Scientists, Lviv, Ukraine, 18 May 2016; Available online: http://www.lnau.lviv.ua/lnau/attachments/3665_Konf_LNAU_18.05.2016.pdf#page=97 (accessed on 15 May 2019).
- The Act of 20 July 2017 Law of Water (item 1566). Available online: http://www.isap.gov.pl (accessed on 4 March 2019).
- Act of 21 August 1997 on Real Estate Management (Journal of Laws 115, item 741). Available online: http://www.isap.gov.pl (accessed on 4 March 2019).
- Malpezzi, S. Hedonic pricing models: A selective and applied review. In Housing Economics and Public Policy; Gibb, K., O’Sullivan, T., Eds.; Wiley Online Library: Madison, WI, USA, 2003; pp. 67–89. [Google Scholar] [CrossRef]
- Combris, P.; Lecocq, S.; Visser, M. Estimation of a hedonic price equation for Bordeaux wine: Does quality matter? Econ. J. 1997, 107, 390–402. [Google Scholar] [CrossRef]
- Baranzini, A.; Ramirez, J.; Schaerer, C.; Thalmann, P. Hedonic Methods in Housing Markets. Pricing Environmental Amenities and Segregation; Springer Nature: Basel, Switzerland, 2008. [Google Scholar] [CrossRef]
- Khalid, H. Spatial heterogeneity and spatial bias analyses in hedonic price models: Some practical considerations. Bull. Geogr. Socio Econ. Ser. 2015, 28, 113–129. [Google Scholar] [CrossRef][Green Version]
- De Haan, J.; Diewert, E. Handbook on Residential Property Price Indices; Publications Office of the European Union: Luxembourg, 2013; pp. 49–64. [Google Scholar] [CrossRef]
- Wen, H.; Jia, S.; Guo, X. Hedonic Price Analysis of Urban Housing: An Empirical Research on Hangzhou, China. J. Zhejiang Univ. 2005, 6, 907–914. [Google Scholar] [CrossRef]
- Sopranzetti, B.J. Hedonic regression analysis in real estate markets: A primer. In Handbook of Quantitative Finance and Risk Management; Springer: Boston, MA, USA, 2010; pp. 1201–1207. [Google Scholar]
- Cebula, R.J. The Hedonic Pricing Model Applied to the Housing Market of the City of Savannah and Its Savannah Historic Landmark District. Rev. Reg. Stud. 2009, 39, 9–22. [Google Scholar]
- Kocur-Bera, K. Determinants of agricultural land price in Poland—A case study covering a part of the Euroregion Baltic. Cah. Agric. 2016, 25, 25004. [Google Scholar] [CrossRef]
- Potrykus, M. Fancy colored diamonds—Characteristics of investing properties. Wyd. Uniwerystet Łódzki 2017. [Google Scholar] [CrossRef]
- Geoportal, Interactive Map. Available online: www.mapy.geoportal.gov.pl (accessed on 4 June 2019).
- Singh, A.S.; Masuku, M.B. Normality and data transformation for applied statistical analysis. Int. J. Econ. Commer. Manag. 2014, 2, 1–11. [Google Scholar]
- Mierzwa, W. Problems of modernization of land registration system on areas of former Austrian cadastre. Zesz. Nauk. AGH Geodezja 2002, 8, 323–330. [Google Scholar]
- Taszakowski, J. Methodology of Using the Former Austrian Cadastre Maps for Legal Purposes. Ph.D. Thesis, AGH, Poland, Krakow, Unpublished work. 2011. [Google Scholar]
- Liao, S.; Bai, Z.; Bai, Y. Errors prediction for vector-to-raster conversion based on map load and cell size. Chin. Geogr. Sci. 2012, 22, 695–704. [Google Scholar] [CrossRef]
- Wade, T.G.; Wickham, J.D.; Nash, M.S.; Neale, A.C.; Riitters, K.H.; Jones, K.B. A comparison of vector and raster GIS methods for calculating landscape metrics used in environmental assessments. Photogramm. Eng. Remote Sens. 2003, 69, 399–1405. [Google Scholar] [CrossRef]
- Pawłowski, W.; Damięcka, M.; Jagoda, M.; Suchocki, W. Determination of the building wall deviations from the vertical plane for diagnostic needs. Zesz. Nauk. 2007, 56, 168–177. [Google Scholar]
- Montaghi, A.; Larsen, R.; Greve, M.H. Accuracy assessment measures for image segmentation goodness of the Land Parcel Identification System (LPIS) in Denmark. Remote Sens. Lett. 2013, 4, 946–955. [Google Scholar] [CrossRef]
- Grandgirard, D.; Zielinski, R. Land Parcel Identification System (LPIS) Anomalies’ Sampling and Spatial Pattern towards Convergence of Ecological Methodologies and GIS Technologies; EUR 23484; Publications Office of the European Union: Luxemburg, 2008. [Google Scholar] [CrossRef]
- Noszczyk, T.; Hernik, J. Modernization of the land and property register. Acta Sci. Pol. Form. Circumiectus 2016, 15, 3–17. [Google Scholar] [CrossRef]
- Góźdź, K.; Parzyński, Z.; Radzio, W. Polish real estate cadastre as the element of INSPIRE. Rocz. Geomatyki 2014, 1, 51–66. [Google Scholar]
- Ciryt, B. Czy sprawiedliwe podatki wywołają niezadowolenie? Available online: http://www.dziennikpolski24.pl/artykul/3128820,czy-sprawiedliwe-podatki-wywolaja-niezadowolenie,1,id,t,sa.html (accessed on 27 May 2019).
- Sadowski, J. Modernizacja ewidencji gruntów w Michałowicach. Gaz. Gm. Michałowice 2012, 50. Available online: http://www.ckip.com.pl/ggm/ggm50.pdf (accessed on 29 May 2018).
- Bandeira, P.; Sumpsi, J.M.; Falconi, C. Evaluating land administration systems: A comparative method with an application to Peru and Honduras. Land Use Policy 2010, 27, 351–363. [Google Scholar] [CrossRef]
- Busko, M.; Przewiezlikowska, A. The problem of demonstrating cadastral changes in surveying documentation. In Proceedings of the Geographic Information Systems Conference and Exhibition—GIS ODYSSEY 2016, Perugia, Italy, 5–9 September 2016; Bieda, A., Bydlosz, J., Kowalczyk, A., Eds.; Croatian Information Technology Society GIS Forum: Zagreb, Croatia, 2016; pp. 50–62. [Google Scholar]
- Mika, M. Proposals for changes in surveying-legal procedures for the needs of cadastre in Poland. Rep. Geod. Geoinformatics 2016, 102, 67–77. [Google Scholar] [CrossRef]
- Głowacka, A.; Noszczyk, T.; Taszakowski, J.; Hernik, J. Socio-spatial conflicts caused by an unfavourable rural structure and out-of date land and property register. Environ. Socio Econ. Stud. 2017, 5, 37–45. [Google Scholar] [CrossRef]
- Eliseev, I.N.; Hernik, J.; Noszczyk, T. The change of the purpose of agricultural lands for nonagricultural in Russia and Poland. Acta Sci. Pol. Form. Circumiectus 2014, 13, 55–64. [Google Scholar] [CrossRef]


© 2019 by the authors. Licensee MDPI, Basel, Switzerland. This article is an open access article distributed under the terms and conditions of the Creative Commons Attribution (CC BY) license (http://creativecommons.org/licenses/by/4.0/).