Article

Heat as a Proxy to Image Dynamic Processes with 4D Electrical Resistivity Tomography

1
AQUALE sprl, Rue Ernest Montellier 22, 5380 Noville-les-Bois, Belgium
2
Urban and Environmental Engineering, University of Liege, 4000 Liege, Belgium
3
F.R.S.—FNRS (Fonds de la Recherche Scientifique), Rue d’Egmont 5, 1000 Brussels, Belgium
4
UCLouvain, Louvain School of Engineering, Rue Archimède 1, 1348 Louvain-la-Neuve, Belgium
5
Raco bvba, Meylandtlaan 39, 3550 Heusden-Zolder, Belgium
6
ENSEGID, Allée Fernand Daguin, 33607 Pessac, France
7
Department of Geology, Ghent University, Krijgslaan 281, 9000 Gent, Belgium
*
Author to whom correspondence should be addressed.
The two first authors contributed equally to the publication.
Geosciences 2019, 9(10), 414; https://doi.org/10.3390/geosciences9100414
Submission received: 26 June 2019 / Revised: 2 September 2019 / Accepted: 23 September 2019 / Published: 24 September 2019
(This article belongs to the Special Issue Subsurface Thermography and the Use of Temperature in Geosciences)

Abstract

:
Since salt cannot always be used as a geophysical tracer (because it may pollute the aquifer with the mass that is necessary to induce a geophysical contrast), and since in many contaminated aquifer salts (e.g., chloride) already constitute the main contaminants, another geophysical tracer is needed to force a contrast in the subsurface that can be detected from surface geophysical measurements. In this context, we used heat as a proxy to image and monitor groundwater flow and solute transport in a shallow alluvial aquifer (<10 m deep) with the help of electrical resistivity tomography (ERT). The goal of our study is to demonstrate the feasibility of such methodology in the context of the validation of the efficiency of a hydraulic barrier that confines a chloride contamination to its source. To do so, we combined a heat tracer push/pull test with time-lapse 3D ERT and classical hydrogeological measurements in wells and piezometers. Our results show that heat can be an excellent salt substitution tracer for geophysical monitoring studies, both qualitatively and semi-quantitatively. Our methodology, based on 3D surface ERT, allows to visually prove that a hydraulic barrier works efficiently and could be used as an assessment of such installations.

1. Introduction

Geophysical techniques can provide spatially and temporally distributed information on the subsurface and related processes in a non-invasive way thanks to measurements taken on the ground surface or from the sky [1]. That’s one of the reasons for the emergence of hydrogeophysics for the improved understanding of subsurface processes over multiple scales [2]. In the context of hydrogeology, we can mention groundwater flow, solute transport, and heat transfer among the most frequently monitored physical processes [3]. To follow a physical process in the subsurface using geophysical techniques, it is necessary to have a sufficient contrast of the associated geophysical property that is measured or imaged, hence the importance of properly dimensioning geophysical surveys [4]. This contrast can be either natural or forced. Examples of natural processes that can be imaged with geoelectrical methods are seawater intrusion in fresh water-bearing aquifers [5], as seawater is far more electrically conductive than freshwater, and moisture dynamics in soils [6] or in the epikarst [7], since bulk electrical resistivity ρb decreases with increasing water content and vice versa. One example of forced contrast is lowering ρb (by e.g., injecting salt water) to image a preferential groundwater flow path in fractured-rock [8] or alluvial aquifers [9] with electrical resistivity tomography (ERT). As ρb is sensitive to many important hydrogeological parameters or properties (e.g., fluid electrical conductivity, water content, temperature, porosity…), it is not surprising that ERT (and in general, all geoelectrical methods) has become one of the favorite geophysical monitoring techniques [3], and that ERT devices fully dedicated to monitoring studies are now available. Moreover, the ERT installation itself is well suited for a monitoring setup compared to other geophysical methods such as ground penetrating radar or seismic refraction. ERT has been used in a time-lapse modality to monitor many subsurface processes such as the migration of dissolved CO2 in a shallow aquifer [10], the reinjection of leachate in an old landfill with the help of horizontal drains to reactivate the digestion process of municipal waste [11], biogeochemical changes of an aged hydrocarbon contamination [12], the bioremediation of hydrocarbons [13], to image and quantify salt tracer transport in a riparian groundwater system [14], to characterize solute transport in aquifers with different types of tracers [15], or even to better understand the thawing of frozen ground and permafrost [16]. A full review of geoelectrical monitoring can be found in [3] for the interested reader.
In the context of shallow alluvial aquifers (the focus of our work) which are characterized by a maximum depth of 15 to 20 m, surface ERT does not suffer too much from its depth of investigation versus resolution problem [17], especially when the monitoring is only qualitative or even semi-quantitative. The latter is generally common for real-world applications. Indeed, ERT monitoring should be able to give a quick answer about (non-exhaustive list) the groundwater flow direction, the risk of thermal feedback between two wells in aquifer thermal energy storage systems and, in the context of this work, the validation of the efficiency of a hydraulic barrier to confine a pollutant to its source.
Thanks to the presence of large rivers, alluvial plains have historically become the place to be for big cities and industries. Nowadays, many brownfield sites still bear witness to this fact and many alluvial aquifers are contaminated by pollutants of all sort. Among the pollutants, we can cite chlorides and other dissolved salts that increase the groundwater electrical conductivity to the point where the injection of a saline tracer to force a geoelectrical contrast becomes difficult due to the extra mass of tracer that is required. When considering drinking water aquifers, injecting large quantities of salt to force the required geophysical contrast is probably not a good solution either, even if this would work (see Table 1 in [8] for a review on this topic). The use of negative tracers might be a solution to counteract these problems. For example, Müller et al. [15] used deionized water that increases bulk electrical resistivity and compared it with traditional (positive) tracer, such as salt, that decreases bulk electrical resistivity. However, the implementation of such experiments using deionized water seems difficult to carry out in real-world applications. For all these reasons, we believe that, in this specific context, modifying water chemistry to force a geophysical contrast is not the easiest and the most sustainable method.
Although the effect of temperature on bulk or fluid electrical conductivity is known for long [18,19], we have seen during the last decade an increasing amount of studies using ERT to quantify temperature changes in the subsurface and more precisely, in aquifers [20]. In 1993, Ramirez et al. [21] already proved that heat (in the form of steam) could be monitored qualitatively with electrical measurements. In 2012, Hermans et al. [17] successfully monitored a heat storage experiment in a very shallow sandy aquifer (<5 m deep) with a 2D ERT profile. They injected heated tap water (ΔT = 30 K) to create a heat plume that could be imaged and estimated in a semi-quantitative way [22] by surface ERT measurements. In 2013, Hermans et al. [23] took profit of a multiple tracer test (which included heated groundwater with a ΔT of 30 K) conducted by [24] to monitor temperature changes in a shallow alluvial aquifer (<10 m deep) with a cross-hole ERT profile. They were able to image spatially and temporally the distribution of temperature from the bulk electrical resistivity changes. Their results show a very good agreement with direct temperature measurements in piezometers (maximum discrepancy of 20%, i.e., 1.5 °C). Robert et al. [25] showed that for medium (T > 40 °C) and higher injection temperatures, ERT-derived temperature estimates do not follow a linear relationship anymore as shown by Hayley et al. [18]. Indeed, at this temperature range, calcite, if close to saturation, starts to precipitate and the induced temperature change does not only increase the mobility of ions anymore but also modify the composition of dissolved minerals. In 2016, Giordano et al. [26] showed in the laboratory that apparent resistivity from a few electrodes might be sufficient to monitor temperature changes in a qualitative way, an idea that is interesting for a rapid scan of temperature changes. In the context of underground thermal energy systems, several authors used ERT to image and characterize the thermal affected zone [27] in aquifer with heated water injection [28] or borehole heat exchanger [29,30,31]. These time-lapse ERT data were also used for numerical model calibration and/or validation [30,32,33], or for system design [34,35]. For more information on this topic, the reader is referred to the following articles [20] and [36].
Through a case study, we will establish and validate a methodology focused on ERT monitoring and heat as a geophysical tracer to monitor the confinement of chloride contamination in a shallow alluvial aquifer. In addition to this introduction (Section 1), we will present the experimental site in its geological, hydrogeological, and geophysical aspects (Section 2.1). We will also present in detail the one-week push/pull test with heat as a tracer (Section 2.2) and its 3D ERT monitoring (Section 2.3) in all these aspects: field implementation, data error analysis, time-lapse data inversion, and image filtering with resolution indicators. We will then present our 3D ERT results and discuss them in the context of contaminated aquifer remediation and confinement of dissolved pollutant (Section 3). Section 4 concludes this study.

2. Materials and Methods

2.1. Experimental Site

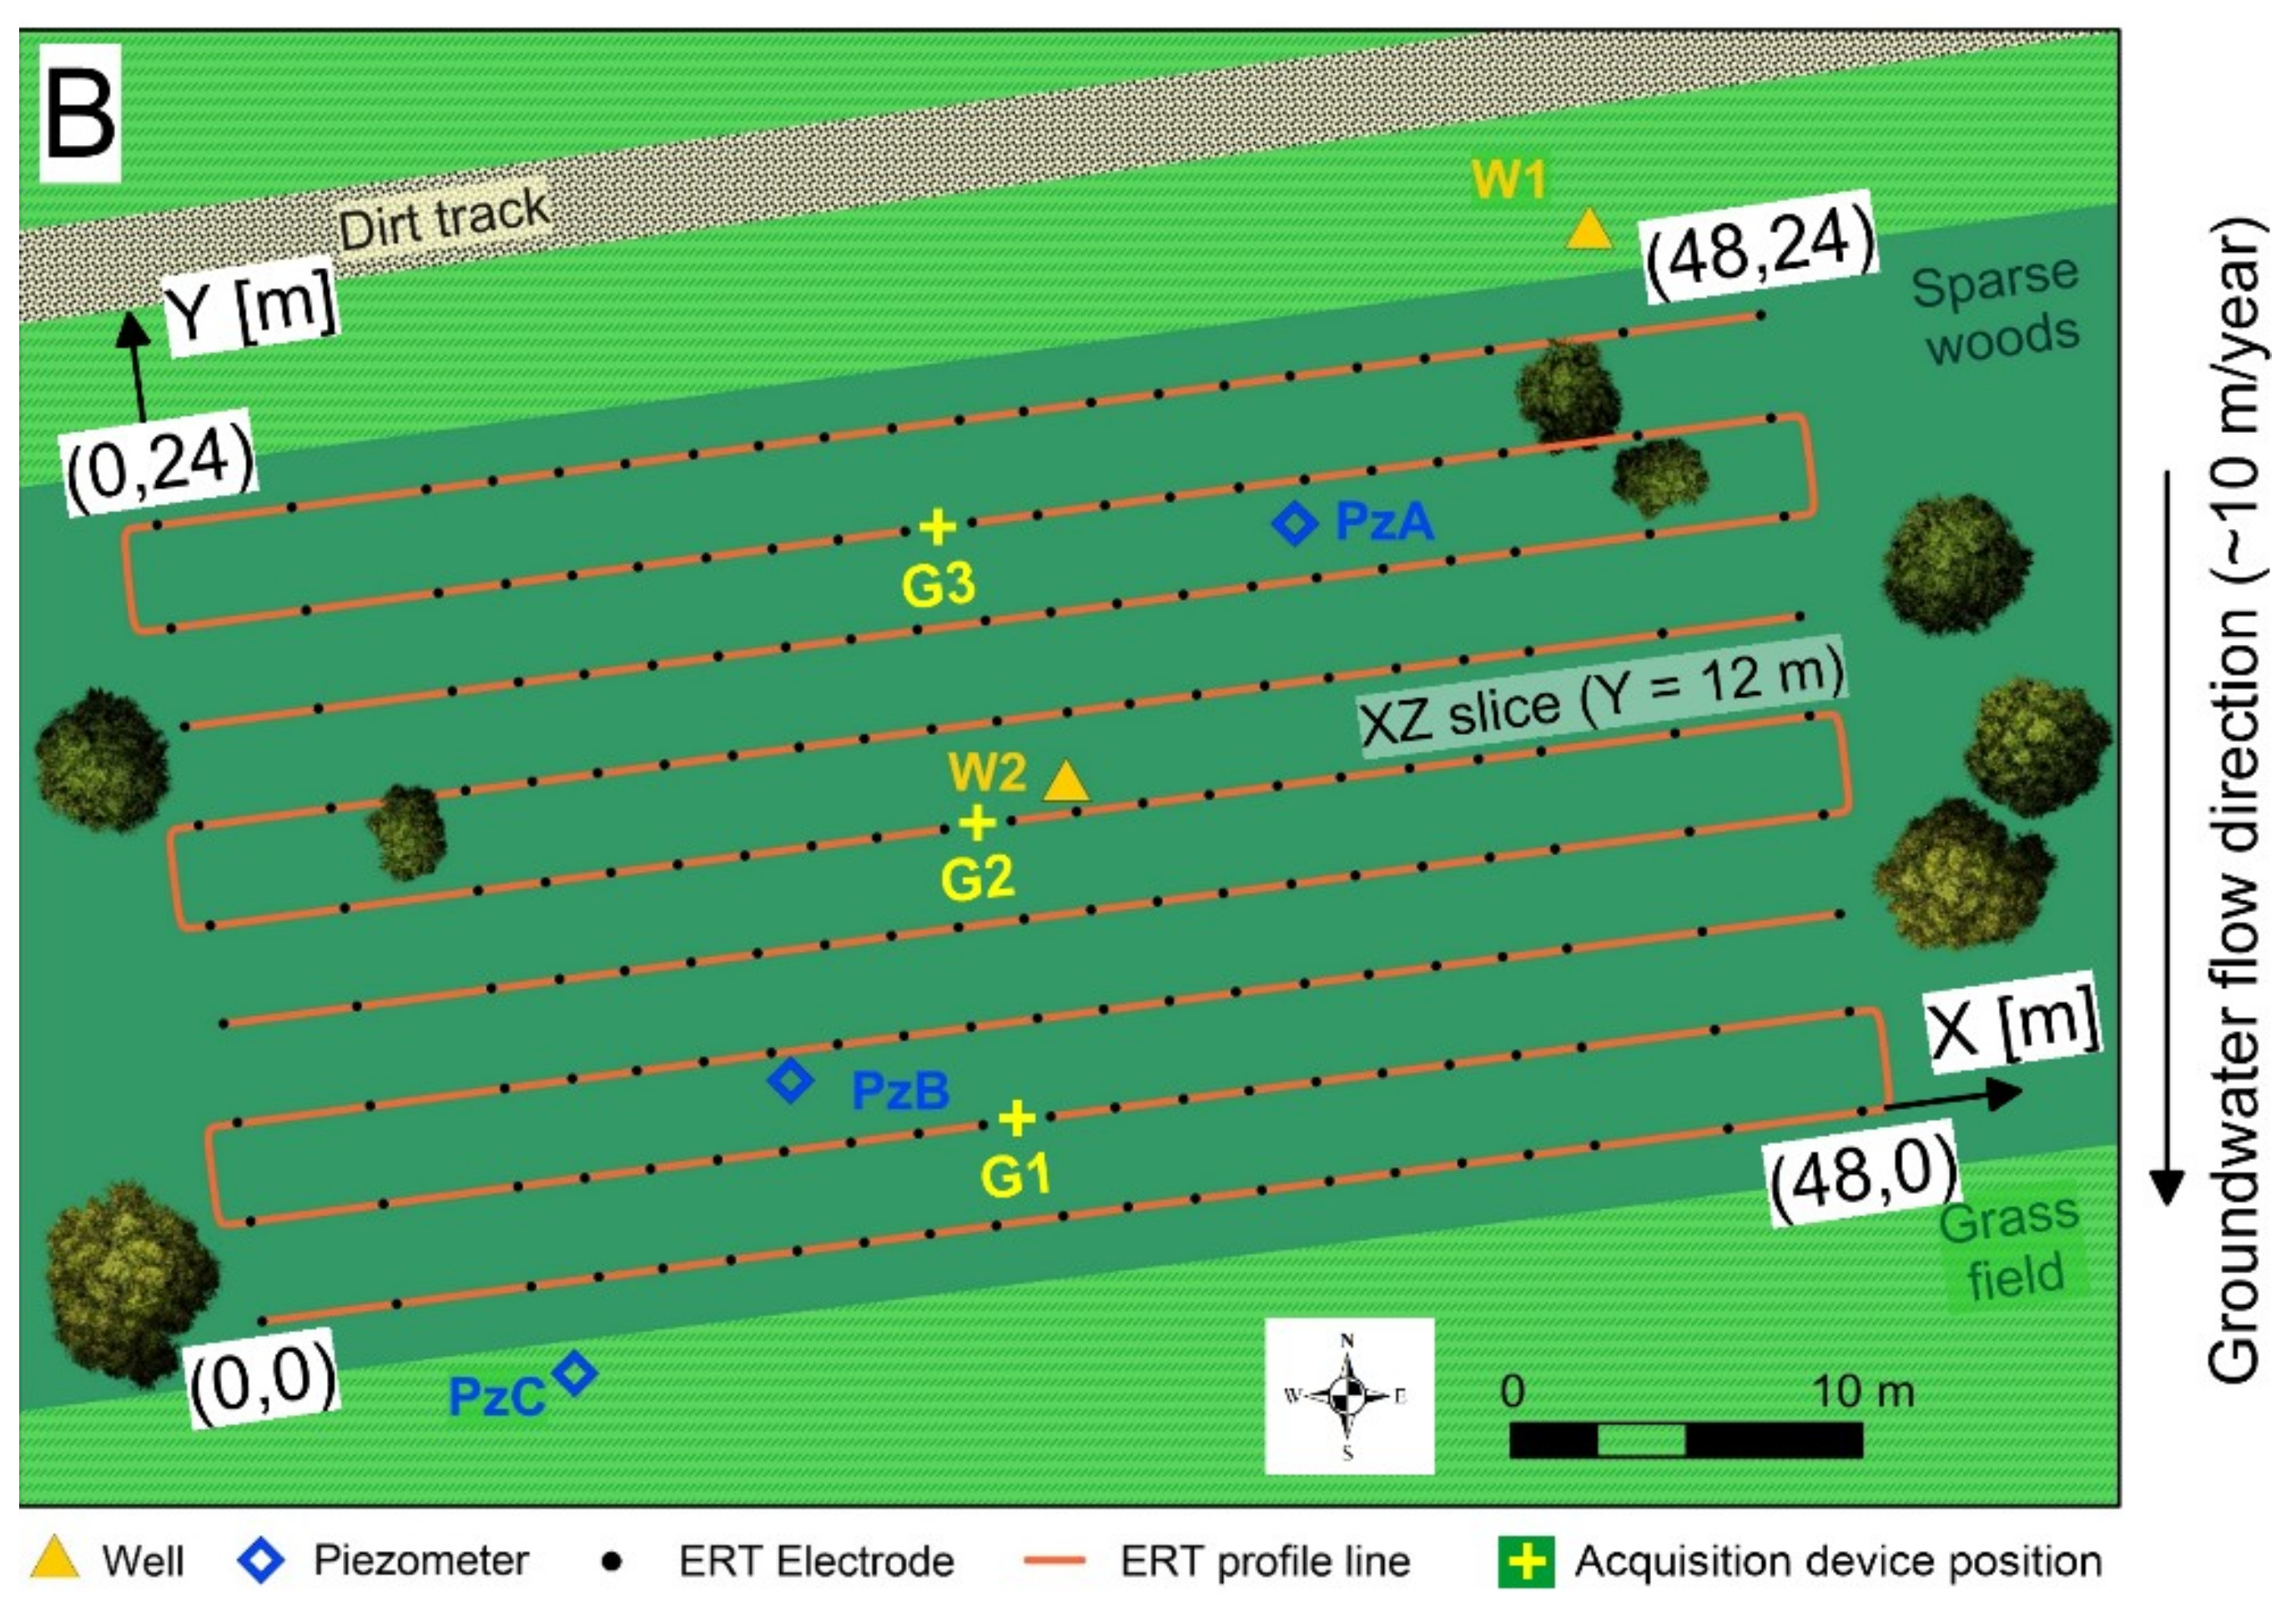
The experimental site is located in an old alluvial plain of the Sambre River in Wallonia, Belgium, (Figure 1A) which has been extensively studied in the past due to its chloride contamination. As a consequence of this contamination, more than a hundred piezometers have been drilled and equipped in the alluvial aquifer, which has provided a very clear view of the underlying geology and hydrogeology. In the investigated area, two wells (W1 and W2) and three piezometers (PzA, PzB, and PzC) were drilled, screened in the alluvial aquifer, and equipped with CTD divers (at a depth of 6 m) measuring water level, groundwater temperature (T), and specific (i.e., corrected at 25 °C) electrical conductivity (Figure 1B) on a five-minute basis.
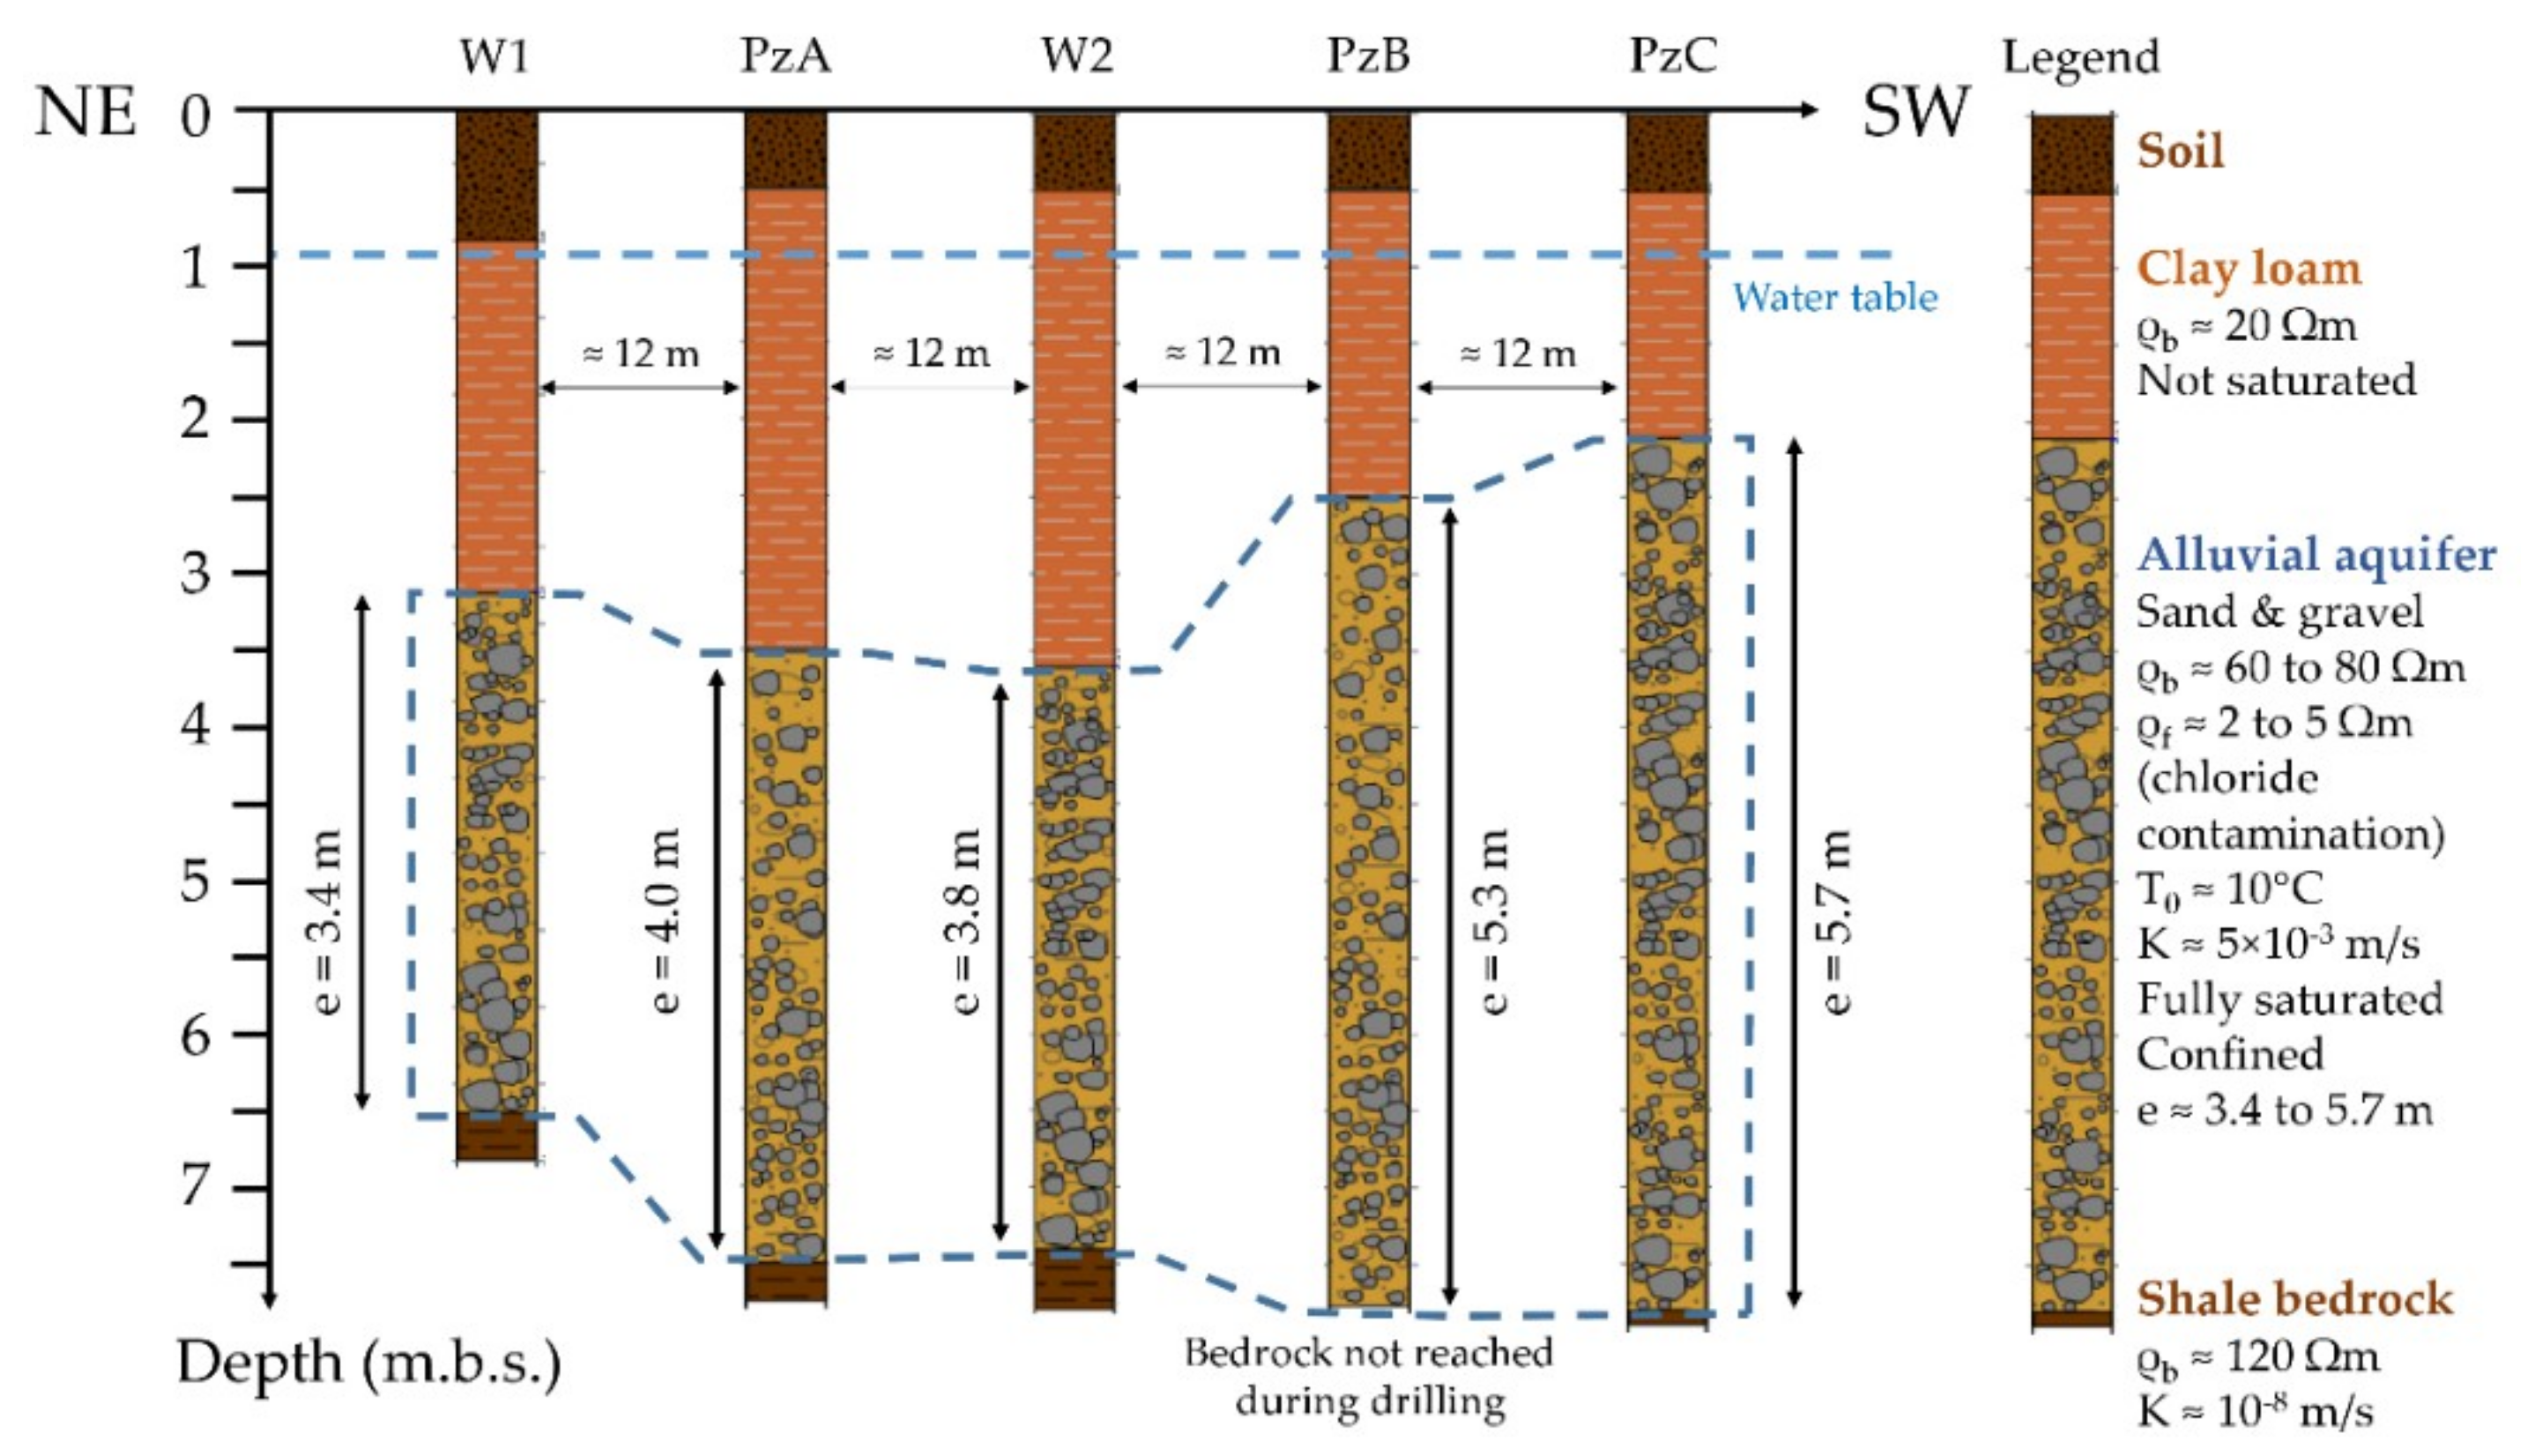
The geological setting is typical of alluvial deposits, although quite heterogeneous in terms of the thickness of the different geological layers and the depth of the bedrock (Figure 2). From the ground surface, and on average, is found a 2–3 m thick layer of clay loam (possibly mixed with backfill on the upper first meter) and a 3–6 m thick layer composed of sand and gravel above the shale bedrock located at about 7.5 m.
From a hydrogeological point of view, only the second layer composed of sand and gravel can be qualified as an aquifer. This aquifer, fully saturated, is confined by the clay loam layer that is only partially saturated. Preliminary pumping tests conducted before the experiment also showed an heterogeneity in terms of hydraulic conductivity (K) with a difference of at least one order of magnitude between the vicinities of wellW1 (K ~ 4 × 10⁻⁴ m/s) and well W2 (K ~ 4 × 10⁻³ m/s). Such heterogeneity has also been demonstrated by inverse calibration in [32]. Around well W2 (where the entire experiment took place), the alluvial aquifer is found between 3.5 m (base of the clay loam layer) and 7.5 m deep (top of the bedrock). The local hydraulic gradient is low (i ~ 0.0001) resulting in a very slow groundwater flow from North to South (towards the Sambre River that prescribes the base level of the aquifer) of ~10 m/year on average (Figure 1B).
From a geophysical point of view, the different layers composing the site are relatively electrically conductive with the clay loam, alluvial aquifer, and shale bedrock respectively characterized by a bulk electrical resistivity of ~20, 60 to 80, and 120 Ωm. In terms of groundwater electrical conductivity, there is a gradient from North (closer to the source of contaminant) to South, in the investigated area, resulting in a different ambient groundwater electrical resistivity around W1 (~ 4 Ωm) and W2 (~ 4.5 Ωm). This means that, in addition to heat, a slightly higher chloride concentration contributed to induce a geophysical contrast (see Section 2.2).

2.2. The Push/Pull Test

In May 2015, we conducted the push/pull test using heat as a geophysical tracer as follows:
  • Groundwater is pumped out of W1 at a flow rate of 2.55 m3/h (T0 = 10 °C) using a surface pump;
  • Water is heated (ΔT = 30 K) using a mobile water flow heater (Swingtec AquaMobil DH7);
  • Heated water (T = 40 °C) is injected in W2 with the same flow rate of 2.55 m3/h and for 5.33 h (13.6 m3 in total) at an injection depth of about 6 m;
  • Resting phase of 72 h during which full 3D ERT images are collected;
  • Groundwater is pumped back out of W2 during 4.5 h at a mean flow rate of 7.6 m3/h (34.2 m3 in total).

2.3. 3D Electrical Resistivity Monitoring

2.3.1. Electrodes Configuration

The 3D ERT setup was composed of nine parallel ERT profiles with 21 electrodes each for a total of 189 classical stainless-steel electrodes. The origin of the local reference system (shown in Figure 1B) is the most southwestern electrode. The unit electrode spacing in the X direction was 2 m whereas it was 3 m in the Y direction. Each profile was therefore spaced 3 m apart, which is in line with the recommendation made by Van Hoorde et al. [38] (i.e., less than twice the unit electrode spacing of the main profiles). The distance between the first two and last two pairs of electrodes on each of the nine ERT profiles has been doubled (i.e., 4 m) to increase the depth of investigation without sacrificing resolution in the central part of the ERT grid (where the push/pull test took place). Each of the nine ERT profiles was therefore 48 m long. More details on the 3D ERT grid can be seen in Figure 1B and the interested reader is referred to Van Hoorde et al. [38] or Cho and Yeon [39] for more details on 3D ERT implementation.
To acquire ERT data, we used the ABEM Terrameter LS device with eight acquisition channels. To take advantage of multichannel acquisition, we used a combination of inline and cross-line dipole-dipole [38,39] (with a maximum spacing factor of eight) and gradient arrays. The acquisition has been split into three groups of three profiles as we did only have one Terrameter and no ES 1064 selector to branch all electrical lines altogether. This means that we had to manually move the acquisition device from one group to another for each ERT image (from G1 to G3, see Figure 1B) (roll-along in the Y direction). Cross-line measurements (current electrodes on one line and potential electrodes on an adjacent line as defined by [39]) were therefore only done inside a group of three profiles. The total time needed to acquire a full set of 3D ERT measurements took two hours, whereas it was about 35 min for a faster 3D ERT survey (see Table 1 and Table 2). Acquisition parameters are shown in Table 1. A full 3D ERT image is composed of the nine electrical lines whereas the faster survey (called light 3D ERT image in Table 2) used only the central group (G2) composed of three electrical lines.
We collected full 3D ERT images before the experiment (two background images), directly after the push phase (one image), during the resting phase (about two images per day), and directly following the pull phase (one image). We collected light 3D ERT surveys during the most transient phases of the experiment, namely the push (three images) and the pull (six images) phases in order to have a better temporal resolution. Note that we also collected a few light 3D ERT images during the resting phase (see Table 2).
In hindsight, and by anticipating slightly the discussion section (Section 3), our electrode configuration could have been optimized. First, the sole gradient array would have been enough and would have permitted a better temporal resolution. Also, since the added value of cross-line measurements in the above-mentioned configuration is only in the first few upper meters where no change is expected, we could have done without them.

2.3.2. Data Error and Time-Lapse Data Analysis

Improving the signal-to-noise ratio is crucial in time-lapse studies as measured resistance variations are generally low (here, <1 Ω, Figure 3A) and could be masked by noise. In this study, we have taken all necessary precautions to limit noise in the data as much as possible starting with the contact resistances RC that present a mean ± standard deviation value equal to 50 ± 25 Ω for the first background data set and 25 ± 12 Ω for the second background data set and all the following ones (Figure 3C). The difference in RC between the two background data sets is caused by the heavy rainfall that occurred during the first night (Table 2). Except for a few outliers that were discarded from the data set, 96% of the data points present a repetition error (also called quality factor Q, which is the standard deviation value of a measurement) below 1% (Figure 3B) and 99.5% below 5%. The mean and standard deviation values of the repetition error distribution are respectively 0.20% and 0.60% (Figure 3B). We accepted all data with a repetition error below 5%.
Many authors use the reciprocal error to estimate the data noise level in static [40,41,42] and time-lapse ERT images [43]. The reciprocal error is the difference between normal and reciprocal (swapping current and potential electrodes) electrical resistances. The acquisition of full reciprocal measurements takes time because an acquisition sequence needs to be collected twice. In our case, for a full 3D image, it means a total acquisition time of four hours to collect both normal and reciprocal measurements. Another point of interest regarding reciprocal measurements in time-lapse studies concerns the most transient phases of our experiment (the push and the pull phases). Indeed, within two hours, reciprocal data are not equivalent to the normal data collected two hours before since we induce some changes in the aquifer. One way of partially solving this is to acquire the reciprocal measurement right after the normal one. However, in this case, the multichannel acquisition optimization is not optimal anymore. We then collected reciprocals only for a subset of sequences and during more steady-state phases as the background profiles. We were able to maintain the reciprocal error below 2%, except for a few outliers that were removed from all data sets. We also used this 2% value as the stopping criterion for the inversion process.
Before proceeding to data inversion, it is crucial to ensure that our data set actually contains information about the physical process that is monitored. One simple of way of proving that is to plot the mean value of the data set (in our case, the mean value of the 1506 data points composing the fast surveys) with time.
Figure 3D shows that the mean electrical resistance value decreases during the push phase, stays more or less stable during the resting phase, and increases during the pull phase as expected. Figure 3D shows actually the difference between the mean value of the second background data set called R0 and the mean value R of the following time-steps. Interestingly, the mean electrical resistance value of the last time-step (after the push phase) goes back to its initial value (the difference between R0 and R is almost null).

2.3.3. Data Inversion

We used the RES3DINV software (https://www.geotomosoft.com/) to perform our inversions. We used a robust data constraint (L1 norm) to deal with eventual bad data that would remain and a standard smoothness model constraint (L2 norm) corresponding to Occam’s inversion [44,45]. Although there are different regularization techniques allowing to recover sharper and more focused thermal plumes such as the blocky inversion [46,47] or the minimum gradient support [48,49], we believe the standard smoothness-constraint scheme is well adapted to the smooth changes that are expected with injecting heated water in the aquifer.
Although data difference inversion seems the most robust time-lapse inversion technique [8,50], when data quality is good, simple independent inversions can provide reliable results when the forced electrical resistivity contrast is high enough and when data quality is good. We used then independent inversion as a time-lapse scheme. This means that each data set is inverted separately and compared to the same background image (here the second one). However, to be able to compare apple with apple, we ensure that our final absolute error for all 3D ERT images was fixed at a constant value (2% here, given the noise level estimated with reciprocal error analysis). This 2% absolute error was achieved after the third iteration. The rapid convergence of the inversion process is another proof of the good data quality.
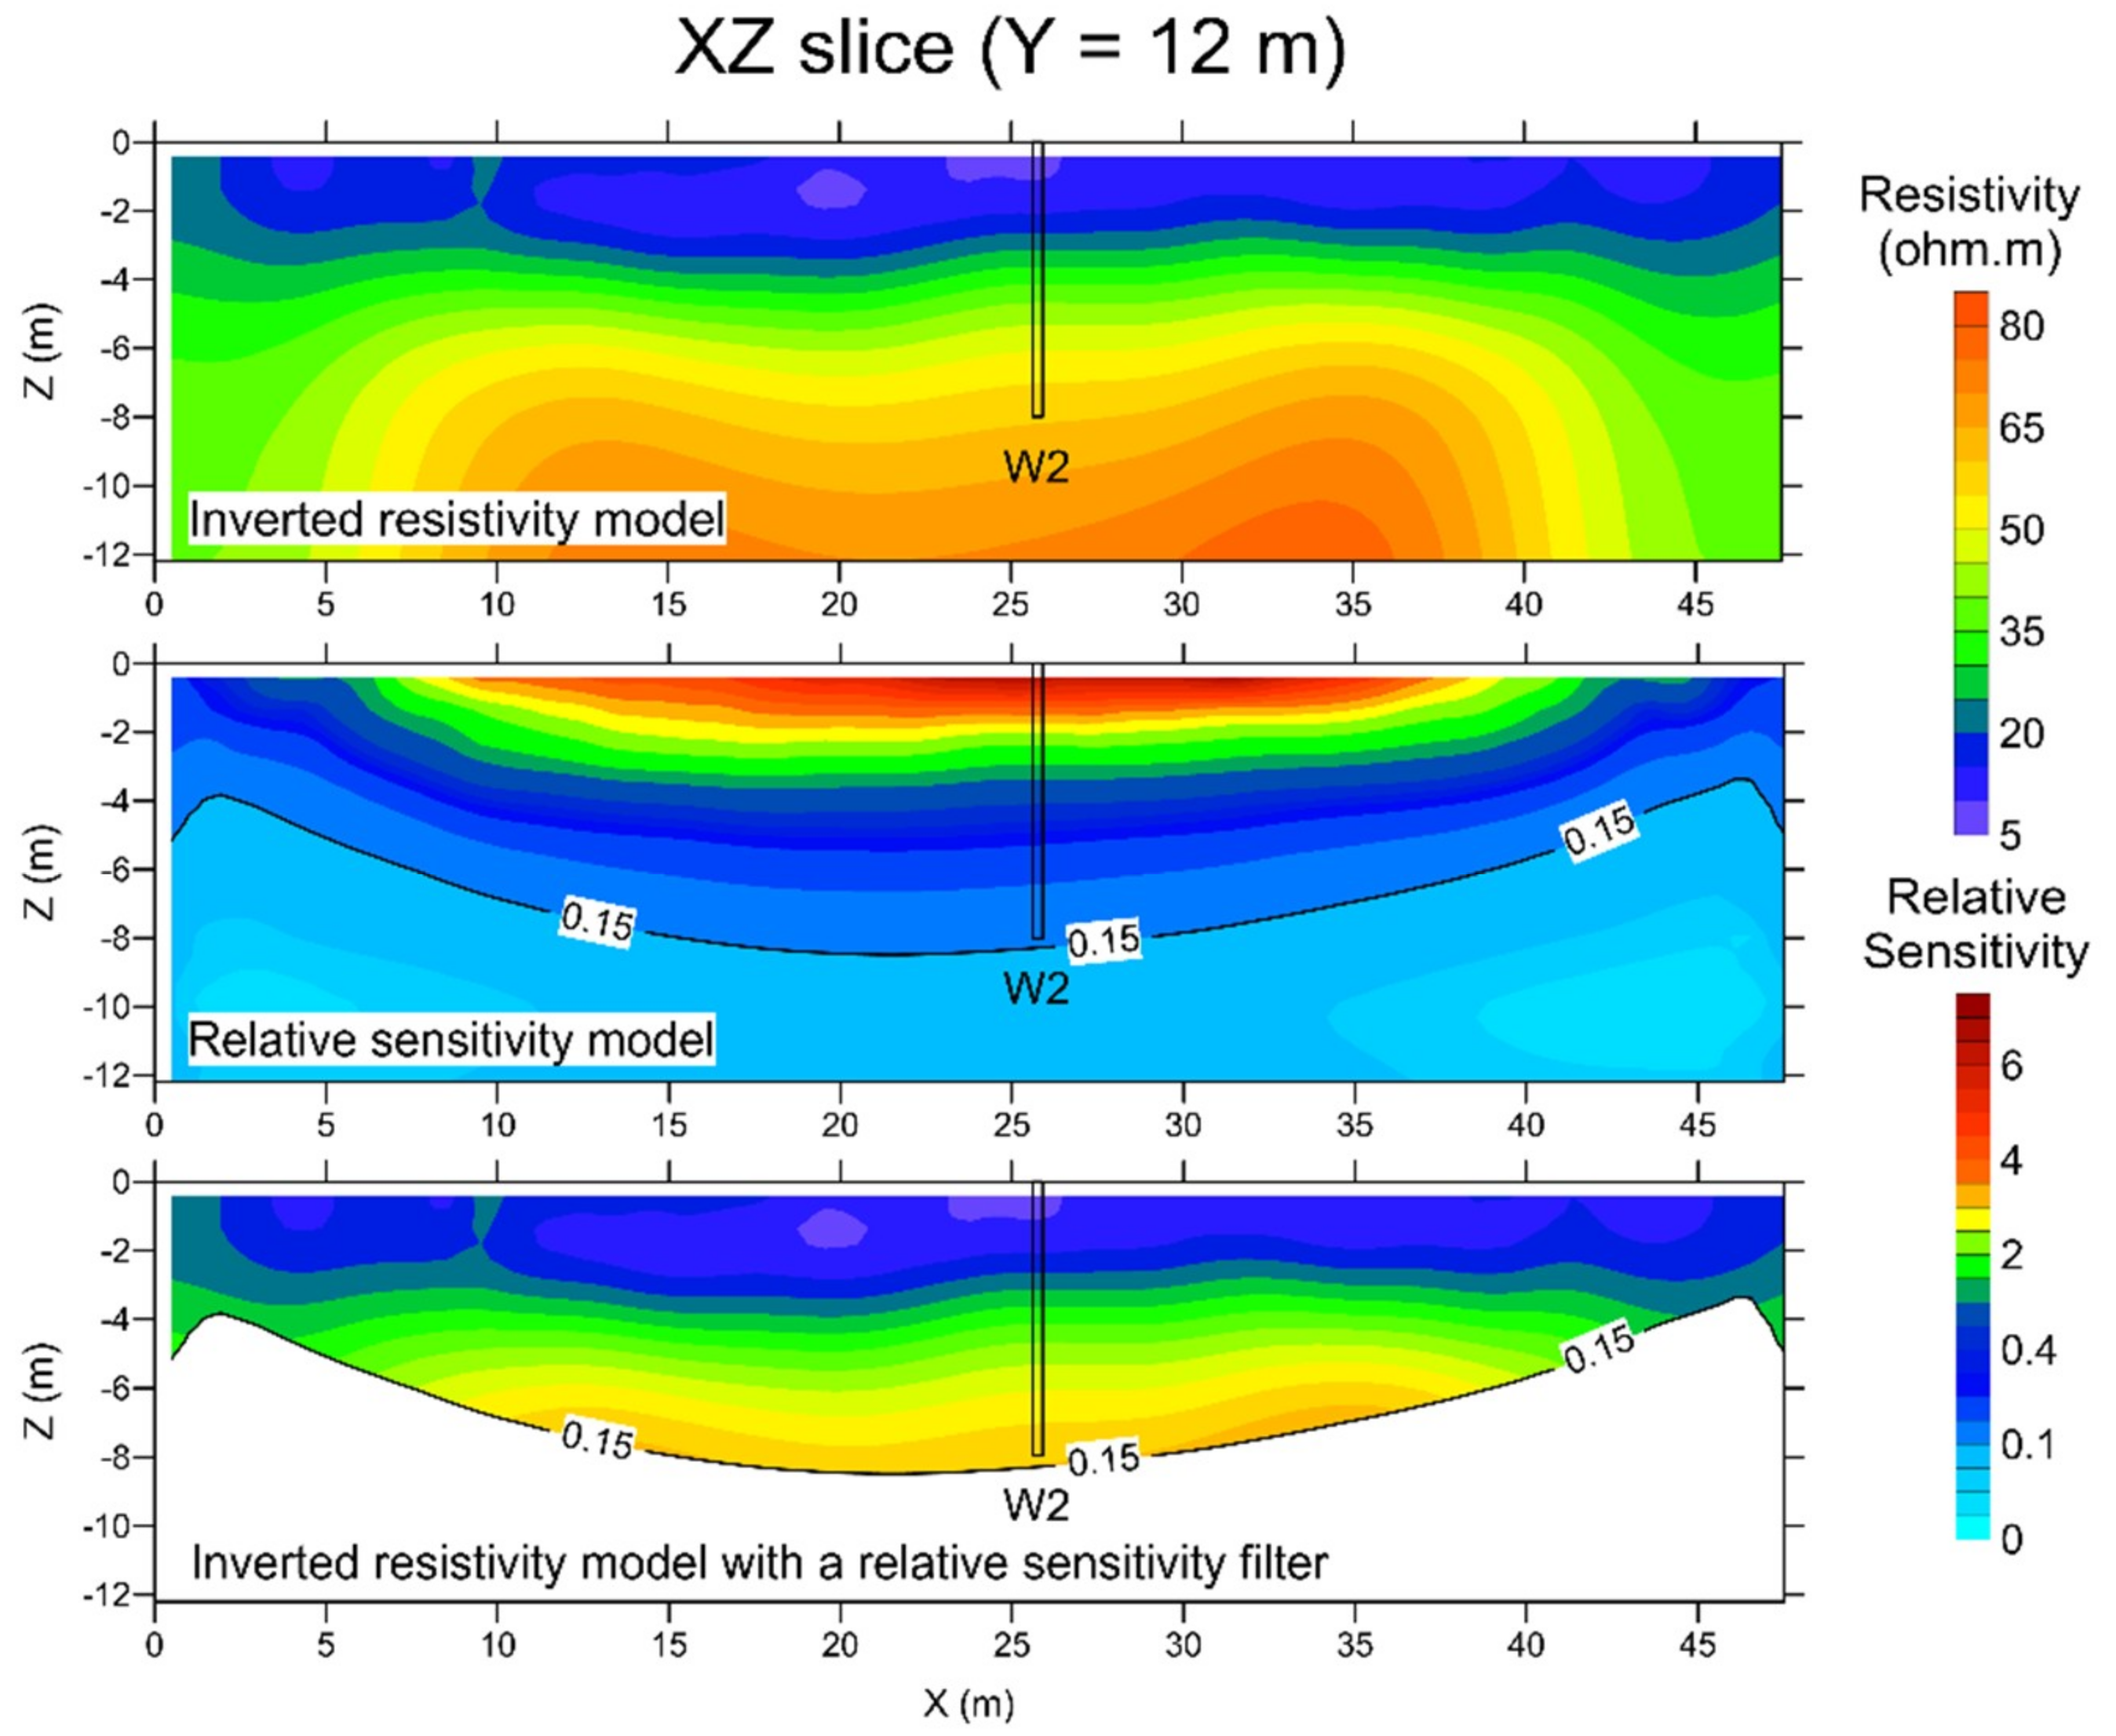
When looking at inversion results (e.g., the second background inverted model is shown in Figure 4), it is important to assess ERT images with resolution indicators to avoid any misinterpretation of inverted model (especially the over interpretation of artifacts) [51] and for example with the sensitivity matrix. Around well W2 (where the push/pull test took place), the extracted sensitivity (Figure 5) becomes almost null below 8 m deep (i.e., in the shale bedrock), which was expected as we sized our 3D ERT set-up to provide the best sensitivity inside the alluvial aquifer. This means that changes in bulk electrical resistivity imaged between the ground surface and 8 m deep are physically-based and can be interpreted.

2.3.4. Post-Processing

To visualize bulk electrical resistivity variations, we used the following formula.
ρ b i   =   100 %   ρ b 0     ρ b i ρ b 0
where ρ b 0 is background bulk electrical resistivity, ρ b i the bulk electrical resistivity at time i, and ρ b i   is the percentage change in bulk electrical resistivity between time i and 0. Since we expect a decrease in bulk electrical resistivity with increasing temperature and chloride concentration, we will observe positive ρ b i .
We don’t expect changes in bulk electrical resistivity in the shale bedrock (i.e., below 7.5 m deep). First, the shale bedrock presents lower hydraulic conductivity. Second, heated water will tend to be transported upward in the aquifer because of density. Finally, sensitivity below 8 m deep is almost null (see Figure 4). According to the definition of the sensitivity matrix, if an electrical resistivity change occurs in a non-sensitive zone, the data set will not be affected by this change. For all these reasons, we blanked all our images below 8 m deep to avoid any over/misinterpretation of 3D ERT results.
In the same way, bulk electrical resistivity variations that occur in the clay loam layer were also blanked. Indeed, even if they are physically plausible (e.g., heavy rainfalls that occur during the week of the test), they are considered as noise in the sense that they are not linked to the physical process of interest (the recovery of a heat and chloride plume).
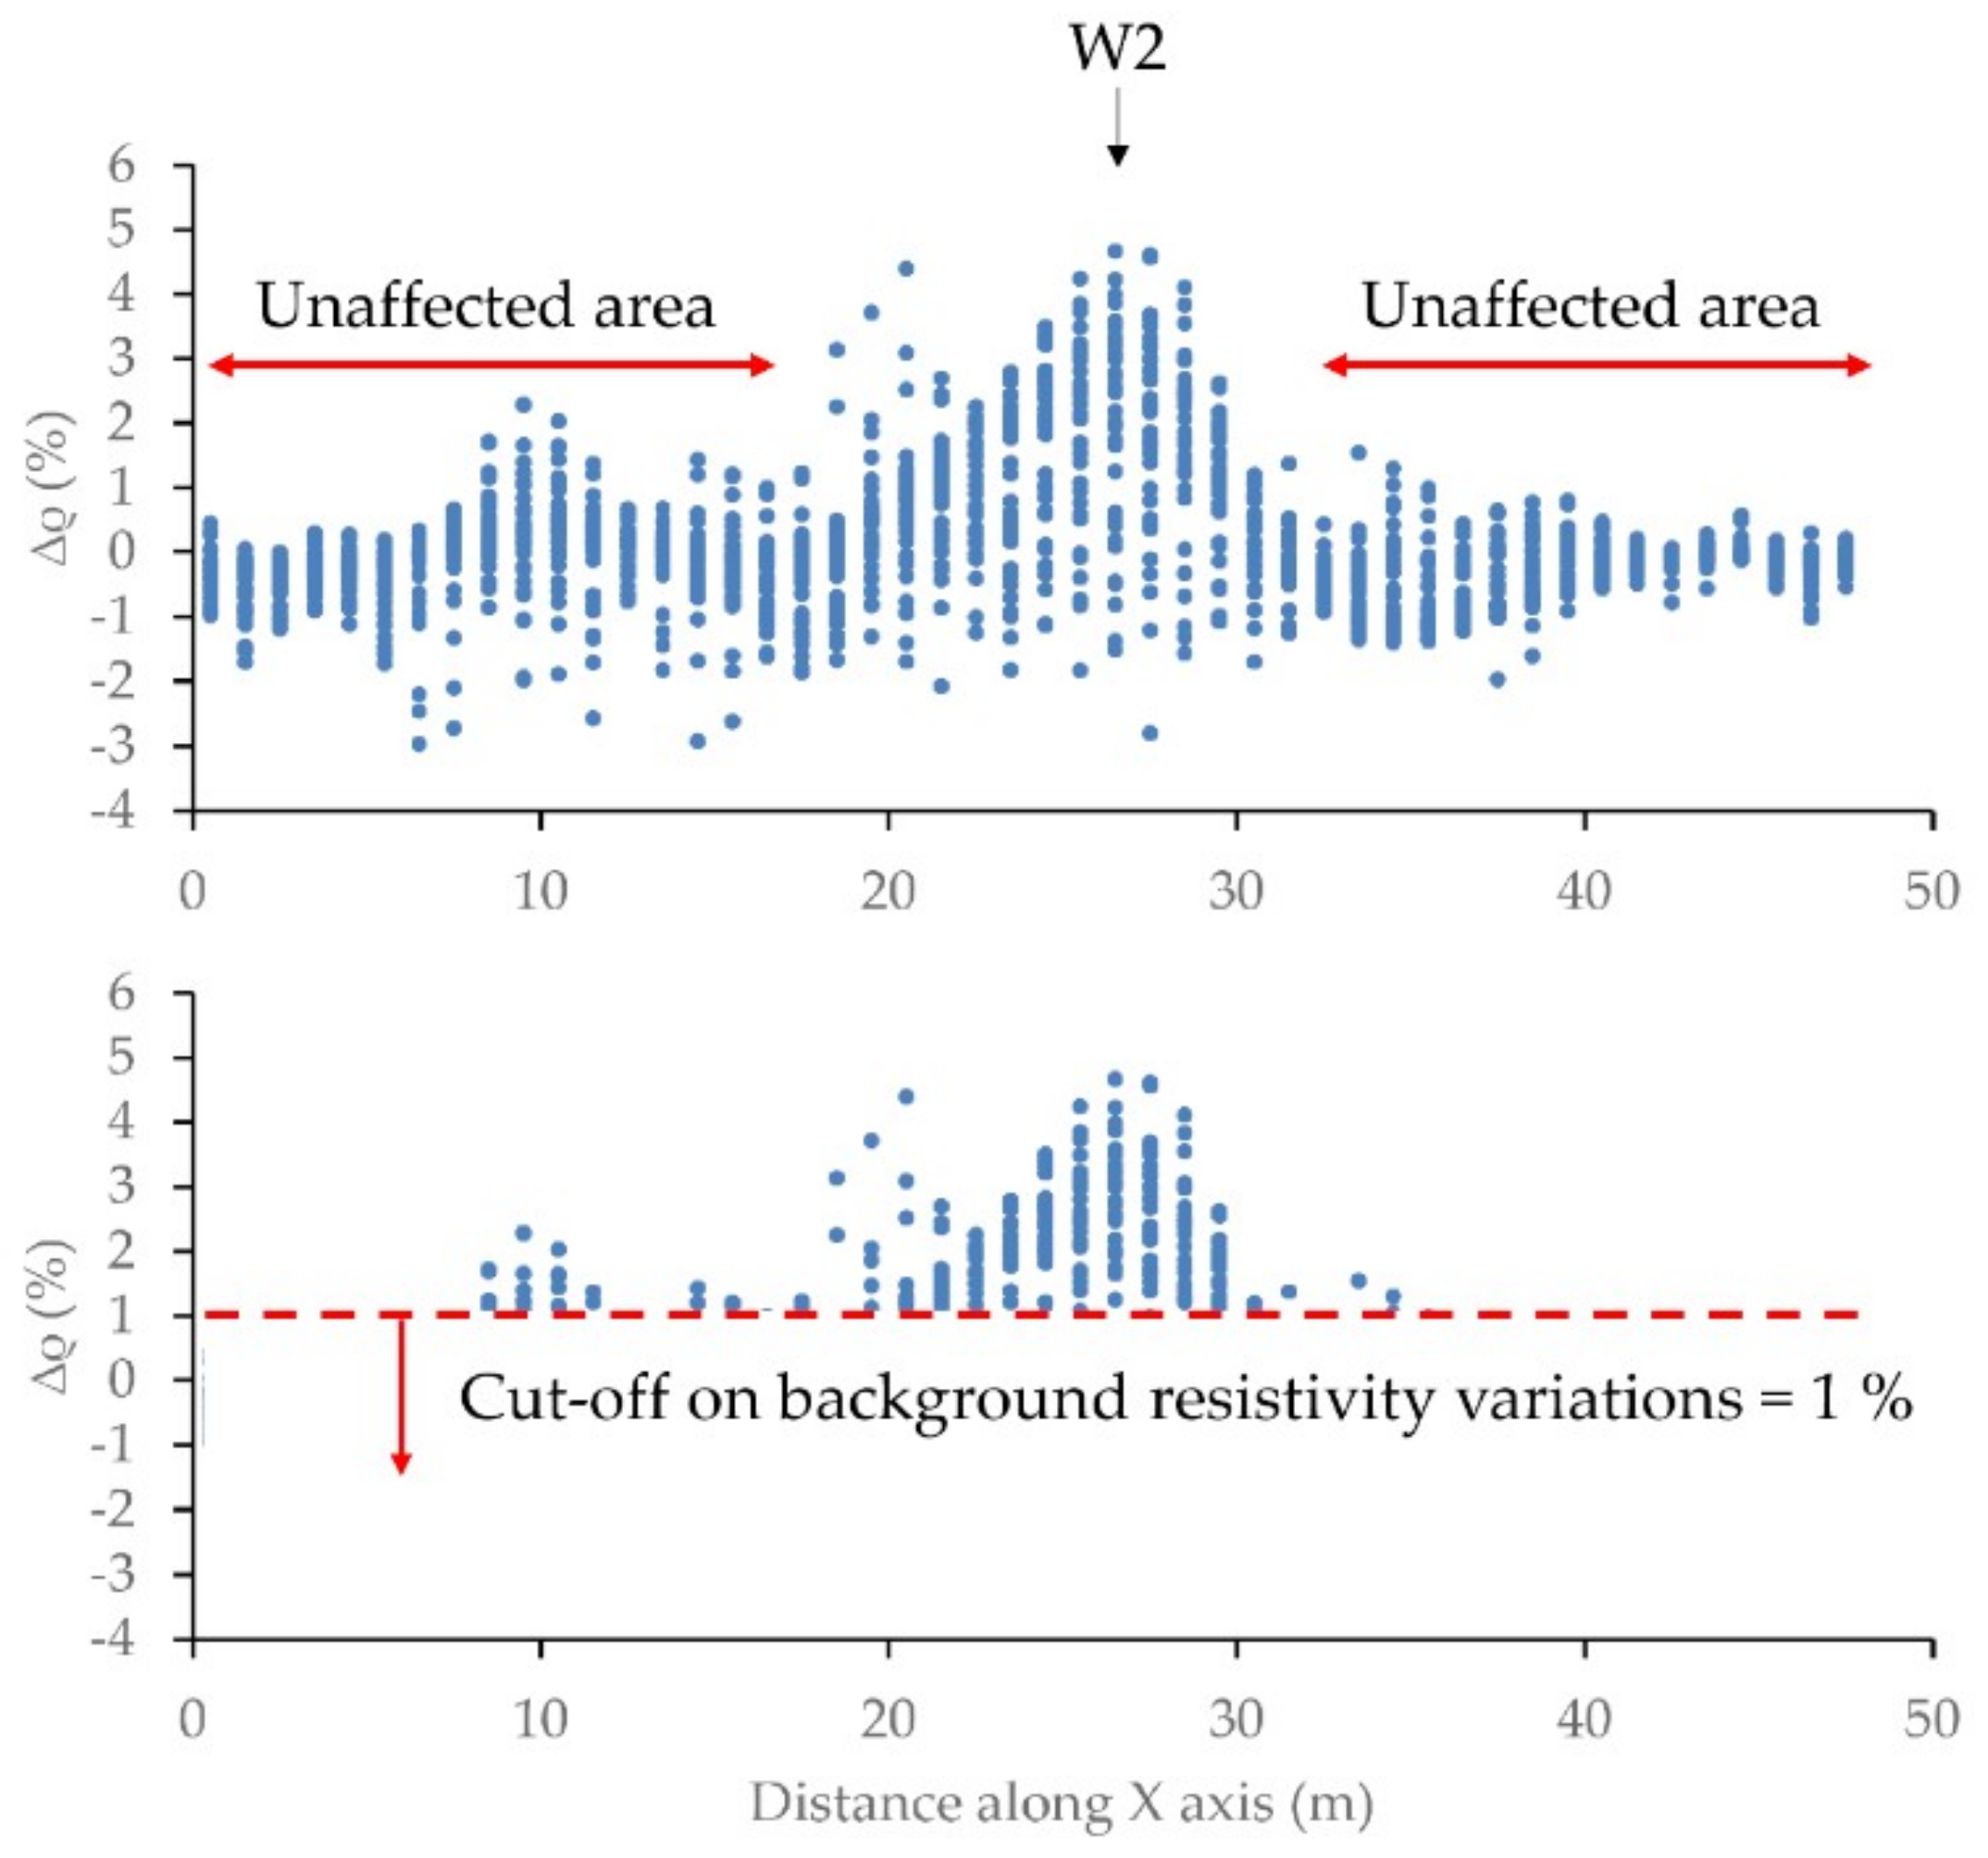
The last filter we used is based on the background resistivity variations methodology developed by Robert et al. [8]. This methodology analyses bulk electrical resistivity variations imaged in a time-lapse modality between (at least) two data sets acquired before the injection of a geophysical tracer. For example, Robert et al. [8] and Chrétien et al. [52] showed that such background resistivity variations were below 3% in their experimental site. In our case, we collected two background data sets: the first one on May 04 (the day before the injection) and the second one on May 05, just before the injection. However, heavy rainfall occurred during the night between the two acquisitions. As a result, bulk electrical resistivity changed a lot in the upper layer between both background images and the methodology of Robert et al. [8] cannot be applied as this. We modified it by using the second background and the first data set acquired right after the start of the injection (light 3D image a). Since we only injected 3 m3 of water at that time, we simply applied the methodology in zones which were not near the injection well W2. In this case, we can see that a cut-off value of about 2% on bulk resistivity variations is adequate (see Figure 6) but maybe too safe as we might miss secondary processes related to chloride transport due to the pumping in W1 and the injection in W2. As a consequence, we took +1% as a cut-off value.
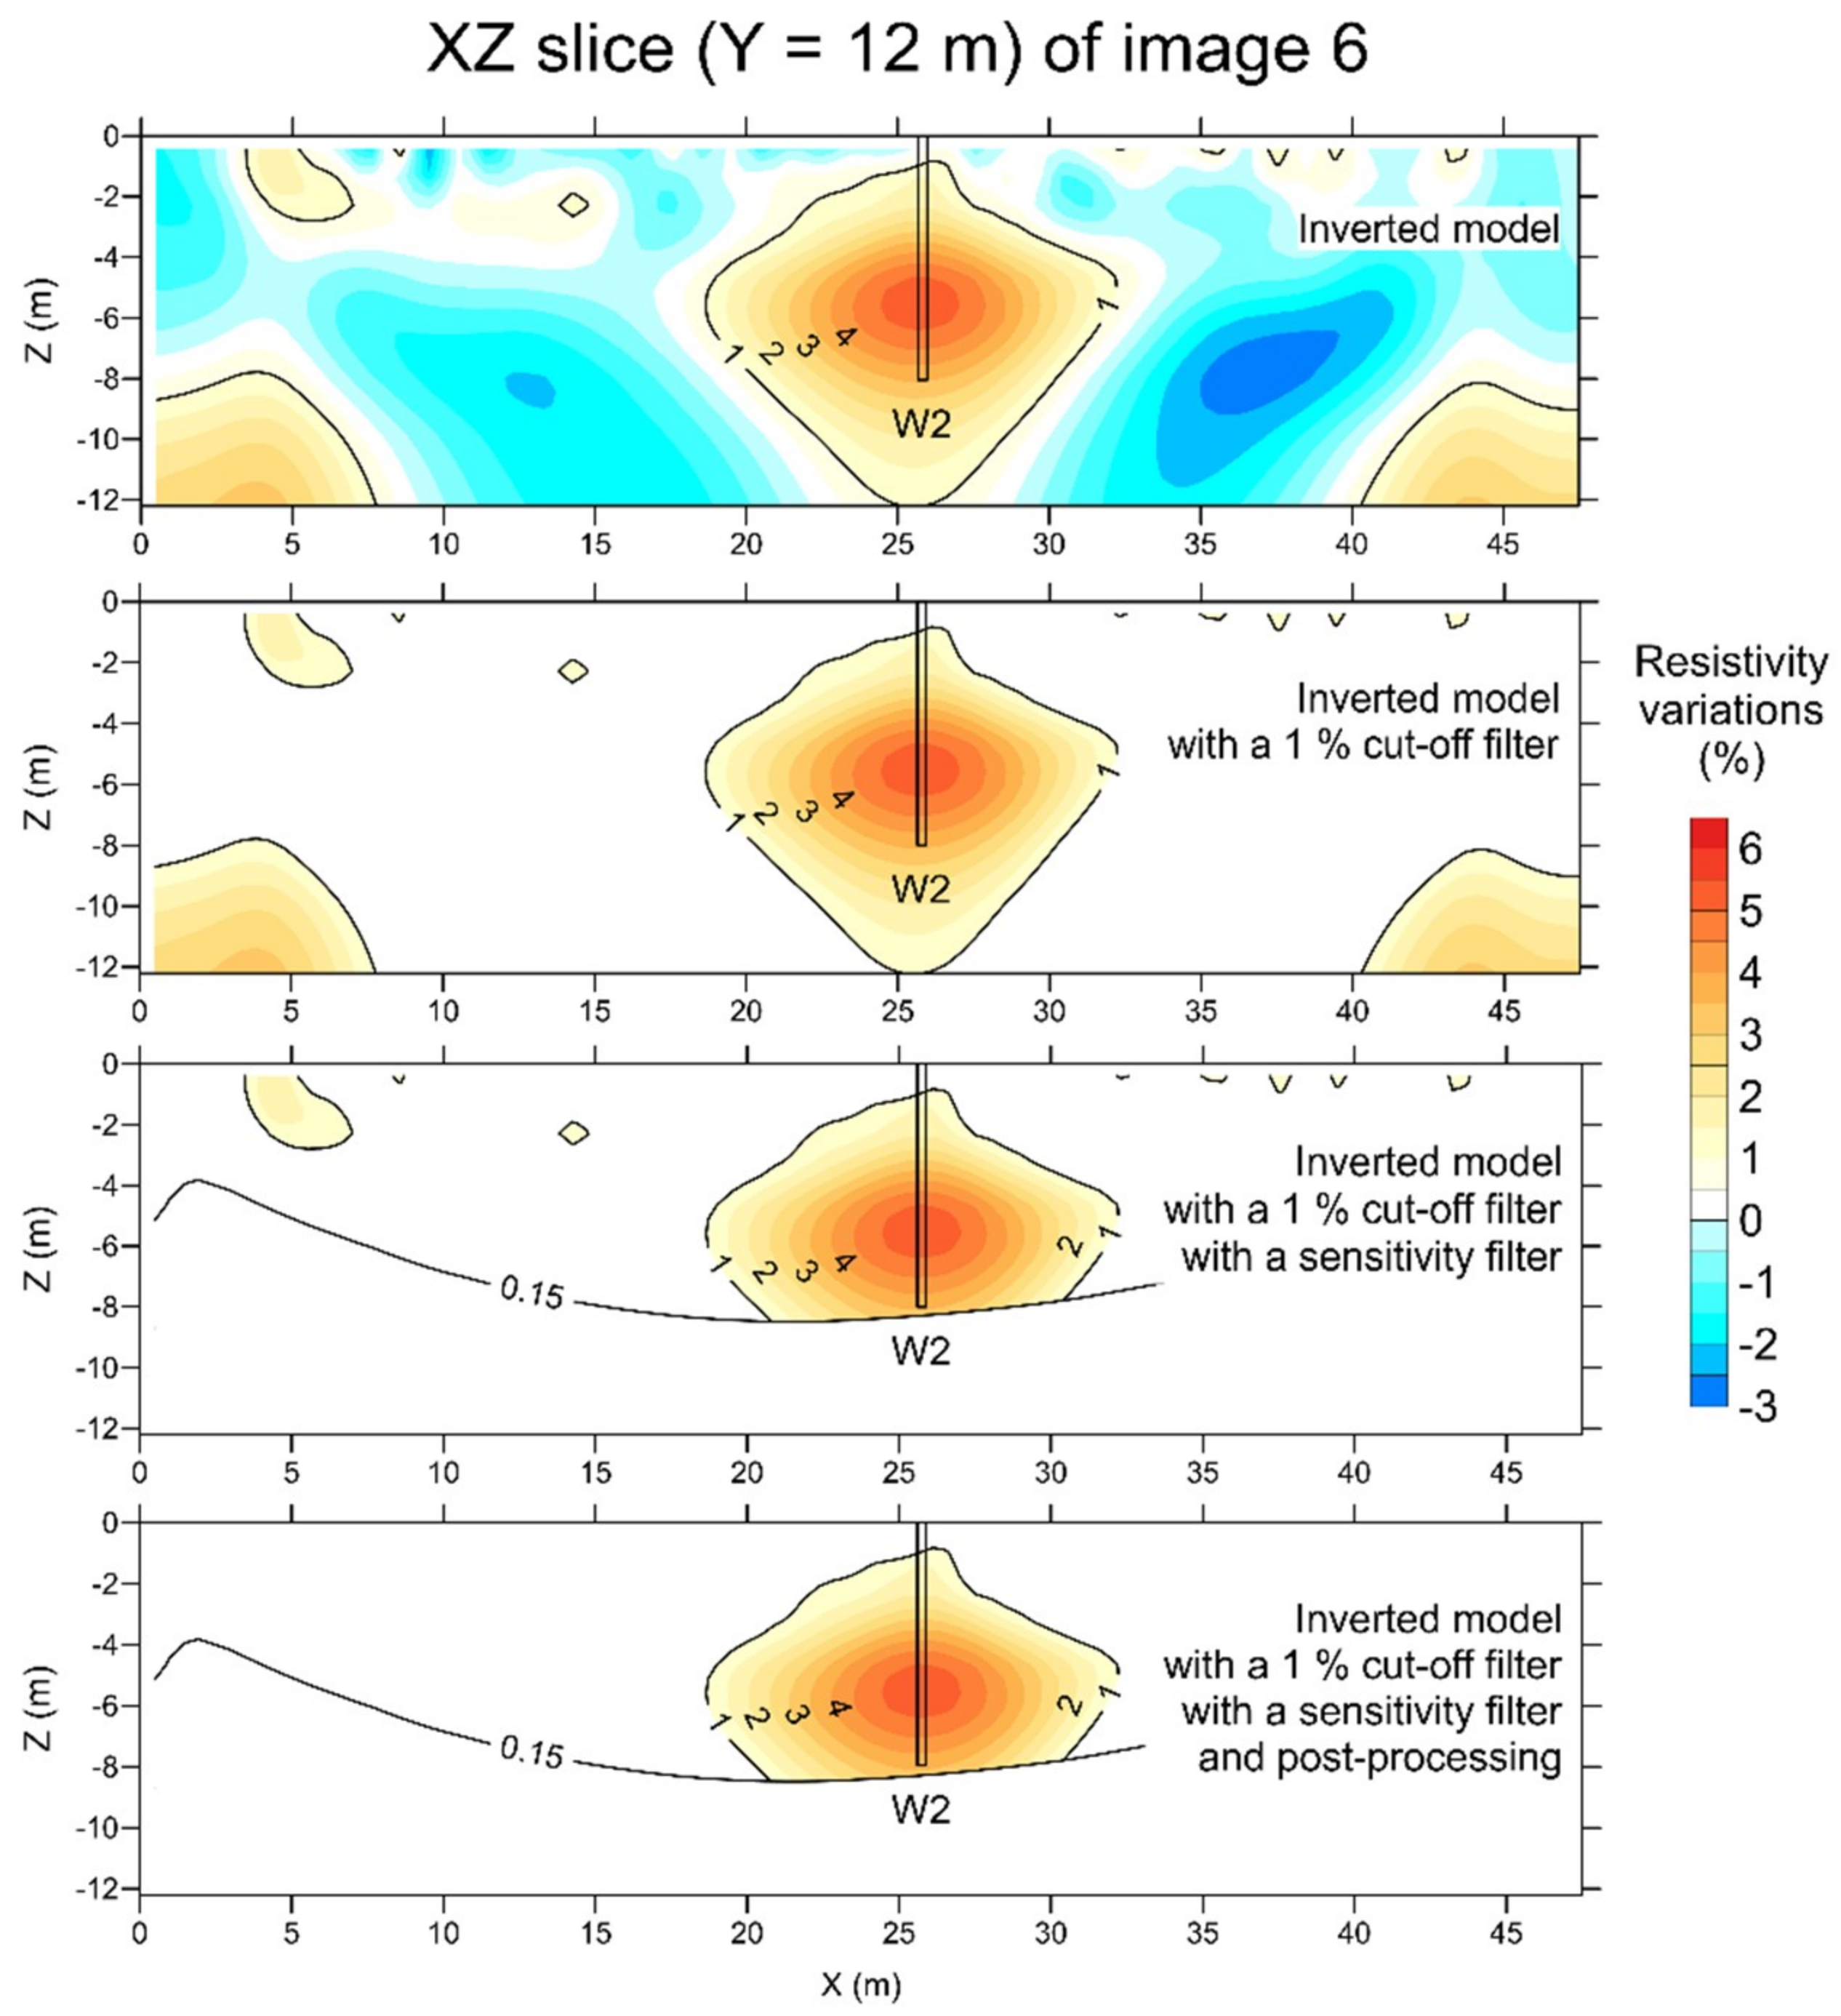
Figure 7 shows the application of the different aforementioned filters on a vertical slice (in the XZ plane, Y = 12 m) of image 6 (see Figure 1B for the exact position in the setup). The first panel presents the unfiltered resistivity changes (in %) associated to the thermal plume. The second panel shows the application of the 1% cut-off value on background resistivity variations. The third panel shows the application of the relative sensitivity filter which removes artefacts in the left and right corners which are not physically-based. The last panel shows the removal of the remaining resistivity changes that are present in the first upper meters (not associated to the targeted process we want to highlight). Thanks to these three filters, the thermal plume can be presented in 3D views with very clean figures (Figure 8 and Figure 9).

3. Results and Discussion

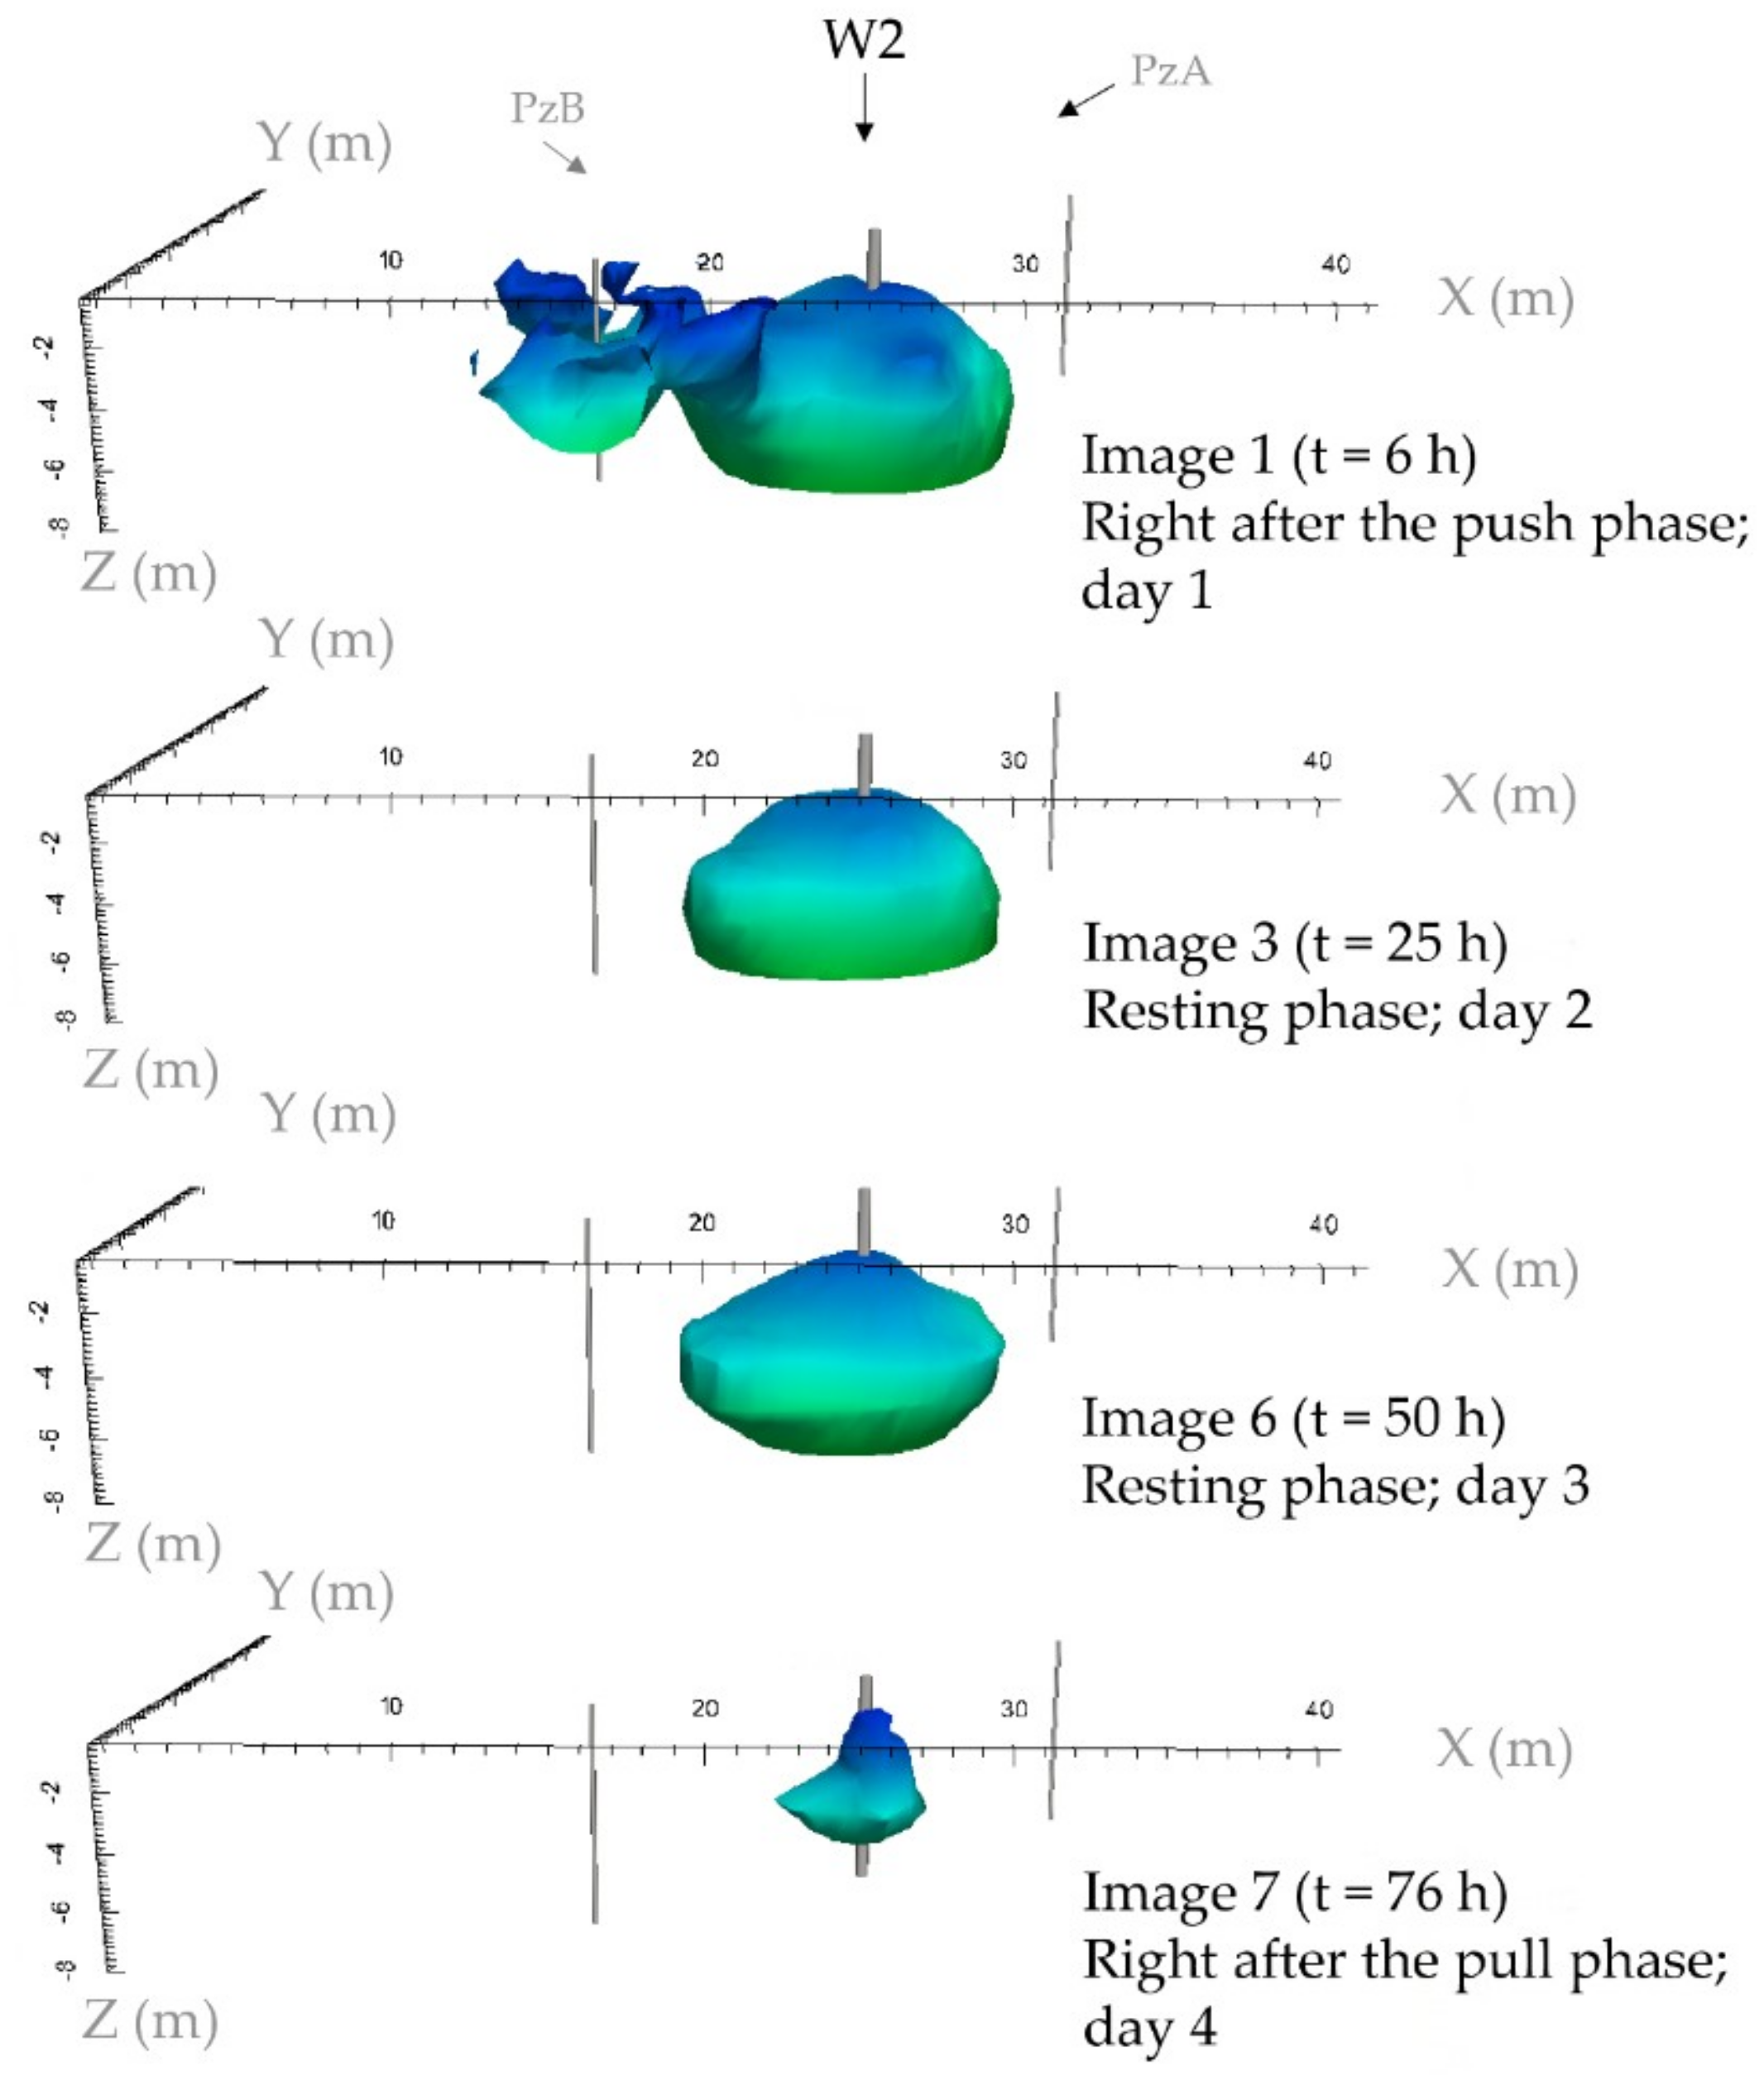
A selection of the different filtered (full, i.e., issued from the nine ERT profiles) 3D ERT images are presented in Figure 8 (3D view from SW) and Figure 9 (view from above). They present the thermal plume created around W2 and to some extent, the displacement of some chloride from a higher concentration zone to a lower concentration zone due to the pumping-injection scheme.
The first image in Figure 8 (Image 1) corresponds to the end of the push phase (t = 6 h). We can see a spherical thermal plume around W2 corresponding to the injection of heated groundwater and some changes in bulk electrical resistivity around PzB which can be due to the displacement of chloride downgradient of W2. With a +2% cut-off value on ρ b i , interestingly, the plume around PzB disappears (not shown). The two next images (Image 3, t = 25 h and Image 6, t = 50 h) correspond to the resting phase. The plume shape has not changed much during the two days after the resting phase. This was expected with the very slow fluxes characterizing the site (~10 m/year). The fourth (and last) image (Image 7, t = 76 h) corresponds to the end of the pull phase. Note that we could not recover all the heat during this step, as evidenced by the energy recovery rate [32] and obviously by the 3D ERT image itself since a sphere with a diameter of ~2 m is still visible in Image 7.
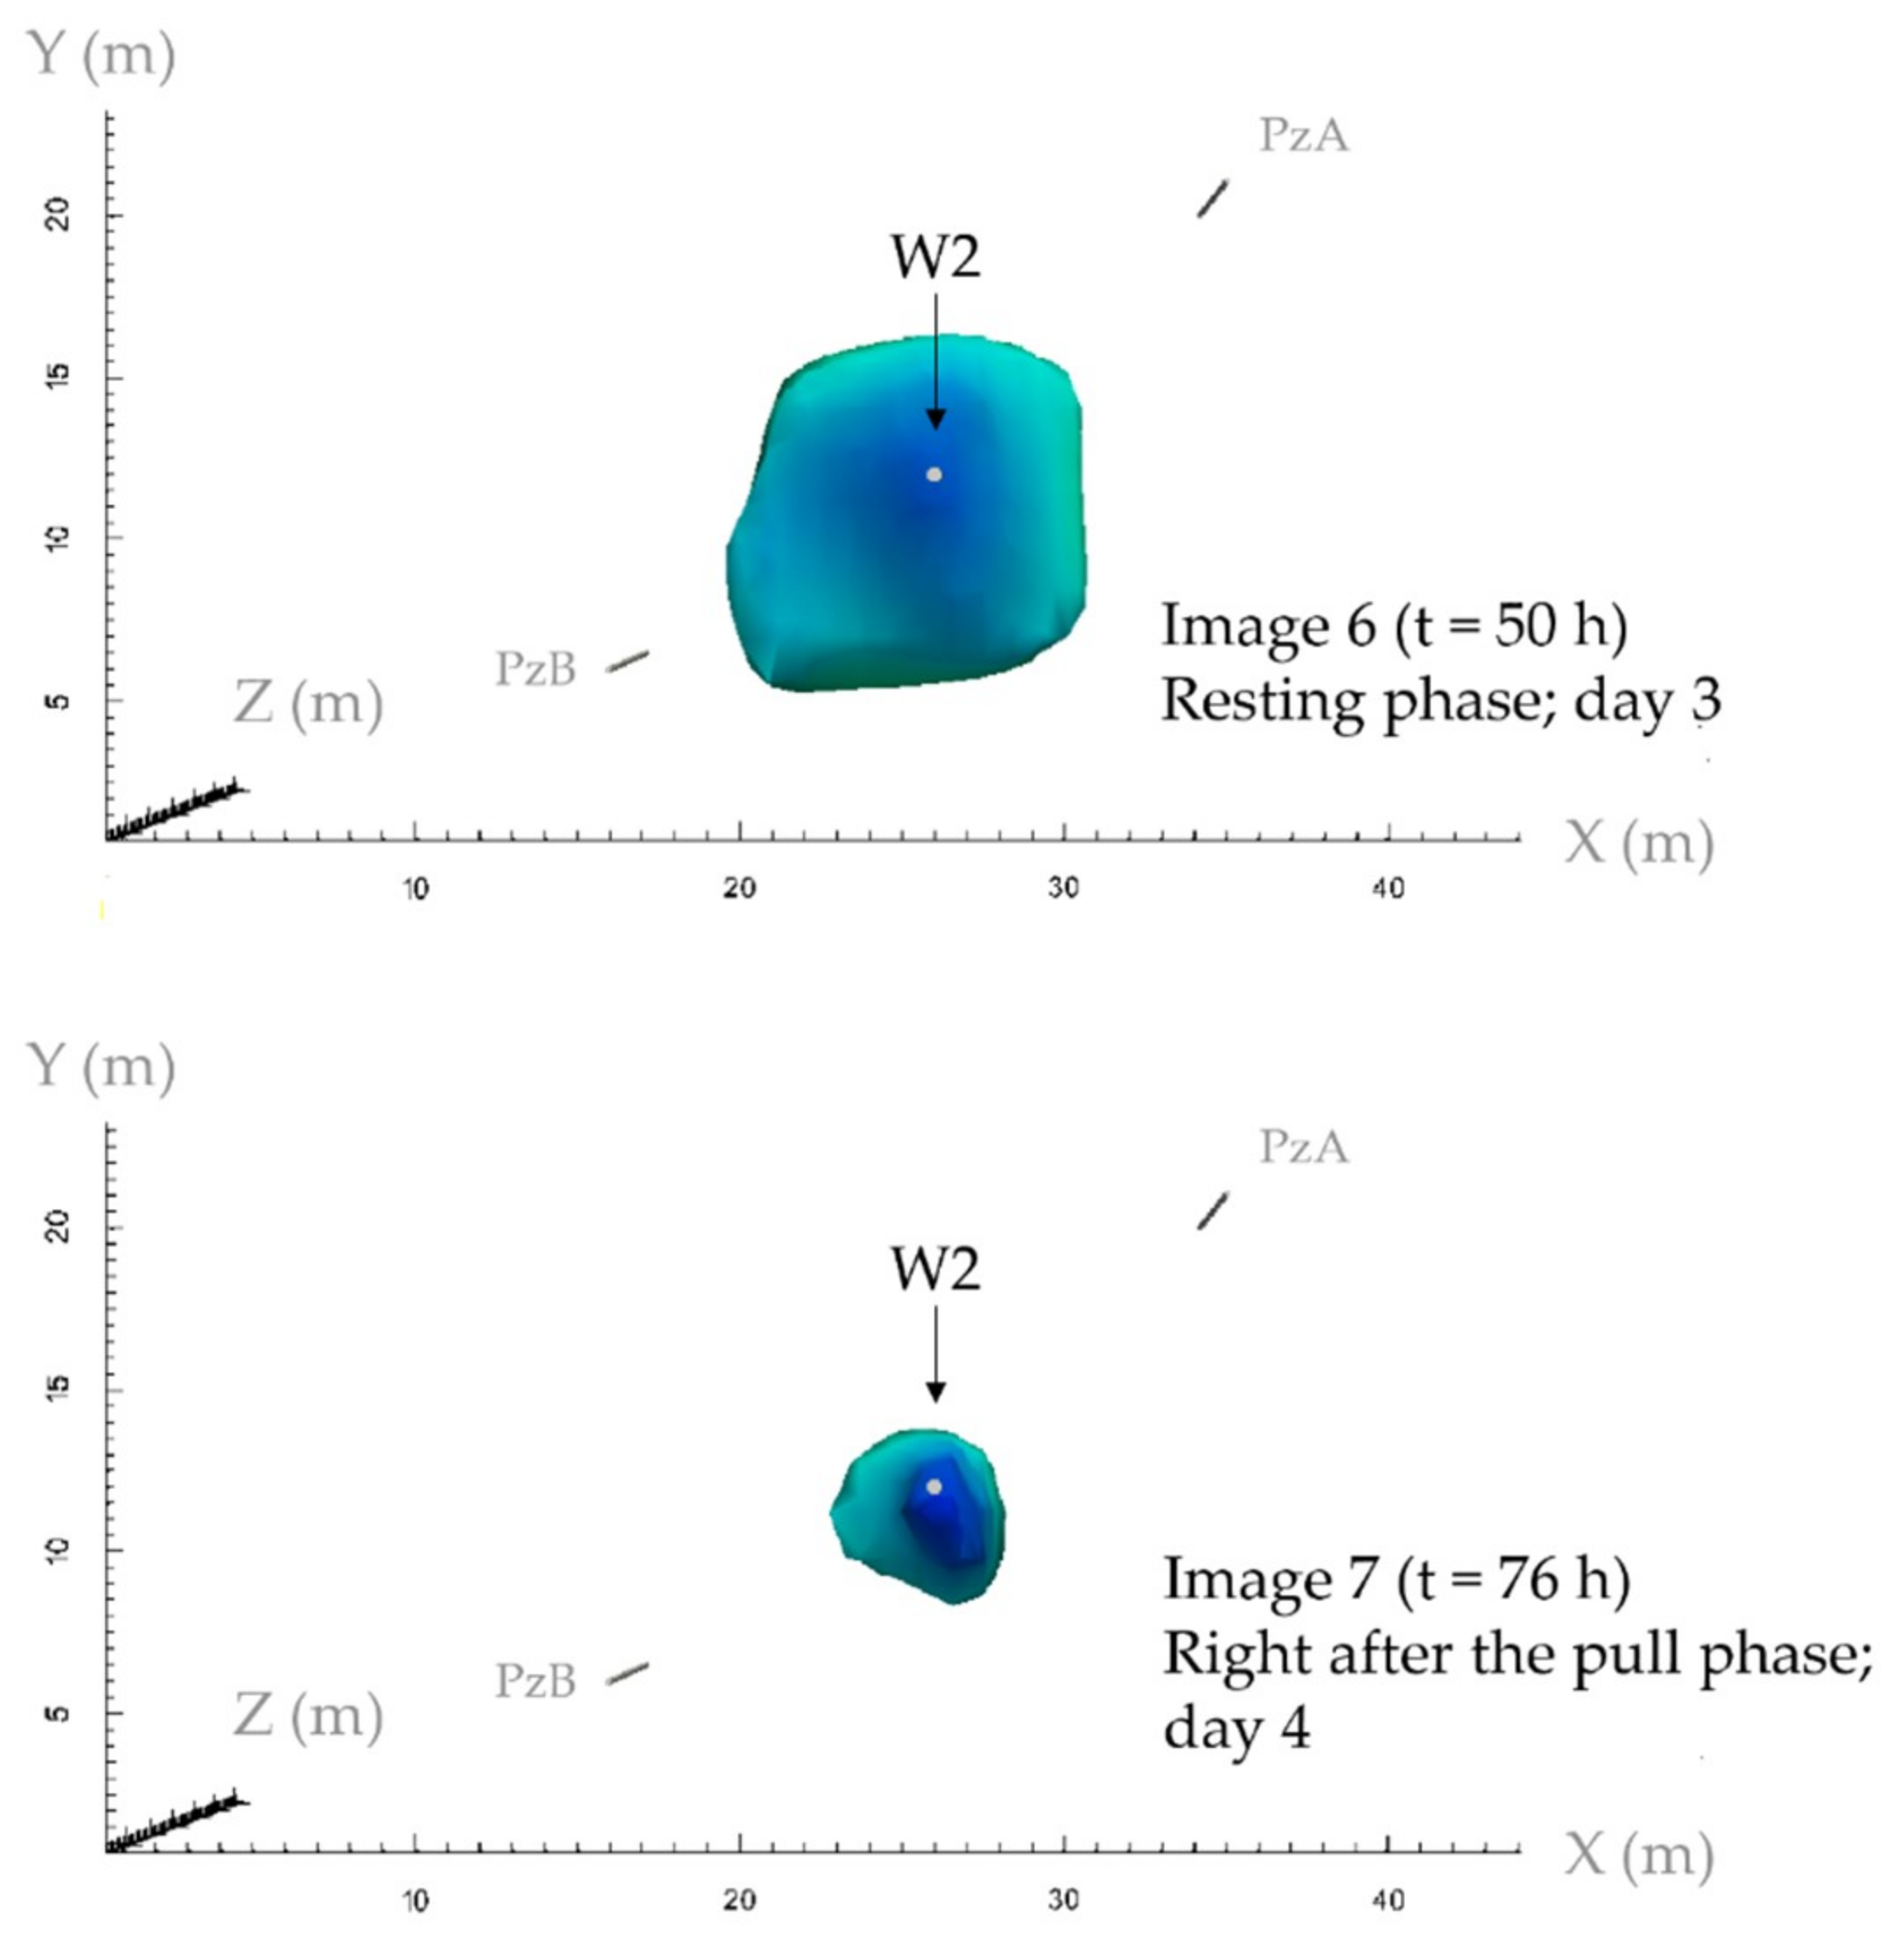
The first image in Figure 9 shows Image 6 from above. It can be seen that, after two days of resting, the thermal plume has moved slightly towards SW (and PzB) since it does not keep its spherical shape in the direction of natural groundwater fluxes. The second image in Figure 9 shows Image 7 from above too. It can be seen that a small portion of the heat plume remained inside the aquifer.
These 3D views of the thermal plume clearly demonstrate the ability of 4D ERT to image qualitatively the entire dynamics of physical processes taking place in the subsurface (here, groundwater injection and recovery highlighted with heat as a proxy for ERT). We can easily extrapolate this finding to hydraulic barrier assessment where heat could be used as a geophysical tracer to validate the efficiency of pumping wells to confine any contaminants to its source.
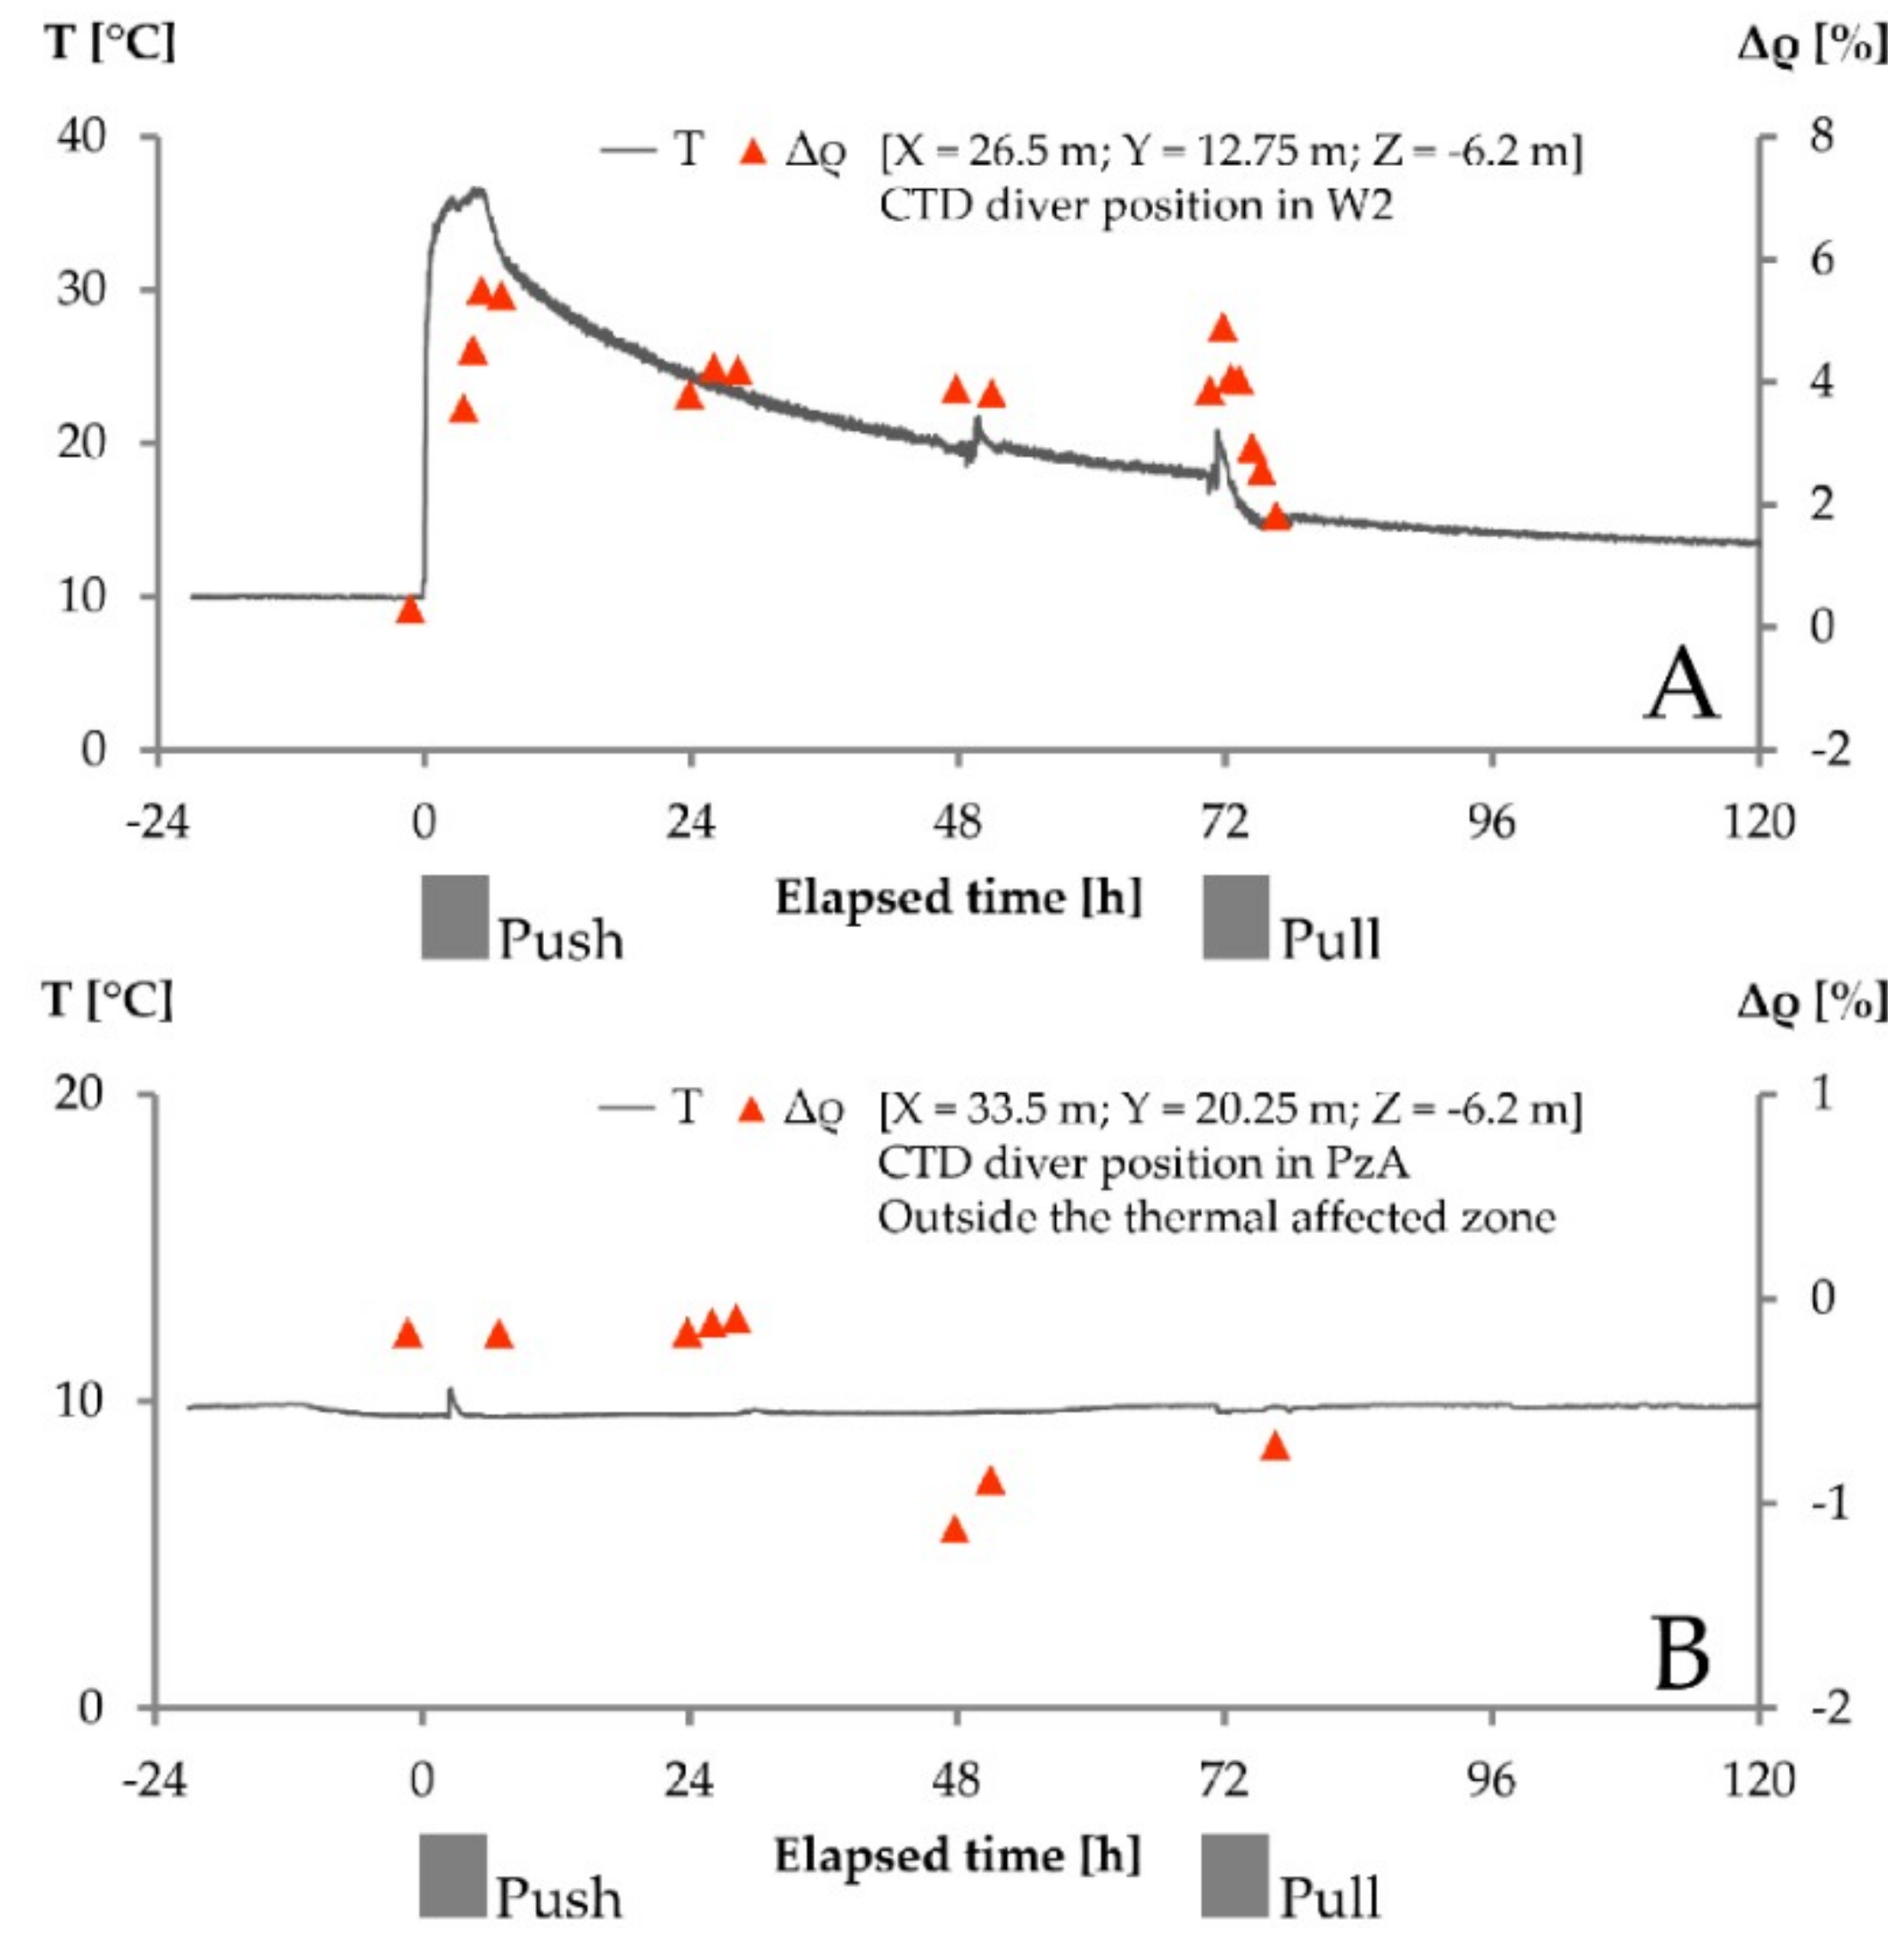
If we focus on a specific cell of the 3D mesh (for example, the cell located at a depth of 6.2 m at W2 location—so exactly at the same position as the CTD diver for comparison), we can extract changes in bulk electrical resistivity and construct a breakthrough curve (see Figure 10A). For this breakthrough curve, we also added the light 3D ERT images in addition to the full ones. Figure 10A thus presents a comparison of the groundwater temperature measured with the CTD diver with the percentage change in bulk electrical resistivity at the same location (W2, 6.2 m deep). It can be seen that when the heated water injection starts, the percentage change in resistivity starts to increase to reach its maximum value (~ 6%) when the push phase is finished. During the resting phase, the percentage change in resistivity does not vary much and stays around 4%. During the pull phase, we can see a rapid decrease of the percentage change in resistivity which stabilizes at around 1.5% once the experiment is finished. Note that the last point of this breakthrough curve does not get back to zero as some energy (in the form of heat) is still stored in the aquifer.
If we now focus on a cell which is outside the thermal plume (for example, the cell located at a depth of 6.2 m at PzA location; so exactly at the same position as the CTD diver for comparison, Figure 10B), we can see that the percentage change in resistivity does not vary. Since the groundwater temperature recorded in PzA does not vary either, we can conclude that 4D ERT sees the thermal plume where it is and not elsewhere.
Although 3D views of the thermal plume (as presented in Figure 8 and Figure 9) are a powerful way of presenting the results, especially for a validation purpose, they remain qualitative. In Figure 11, we present horizontal (in the XY plane, at a depth of 6.2 m) and vertical (in the XZ plane, Y = 12 m, see Figure 1b for the exact position) slices of contoured percentage changes in resistivity.
Figure 11A–C show the vertical slice for three time-steps: Image 1, collected just after the push phase (A), Image 6, collected at the end of the resting phase (B), and Image 7, collected after the pull phase (C). The same filtering scheme has been applied (see Figure 7). The comparison between Figure 11A,B (so respectively in the beginning and the end of the resting phase) better shows that the thermal plume moved slightly towards South during the resting phase than shown in 3D views. Figure 11D–F shows the horizontal slice for same three time-steps.

4. Conclusions and Perspective

We demonstrated that 4D ERT can be a powerful tool to image dynamic processes in the shallow subsurface, especially using heat as a (sustainable) geophysical tracer. Even with classical tools, softwares, and inversion approaches, practitioners will be able to successfully reproduce this methodology providing they focus on data quality. In a semi-quantitative point-of-view, we can conclude that 4D ERT is able to correctly image the dynamics of the heat (and to some extent, chloride) injection and recovery. In particular, the faster ERT surveys collected during the pushing and pulling phases captured the physics very nicely. The match is not perfect but this is easily explained by the “blurred” characteristics of 3D ERT coming from inversion and transient processes. Another concern is the comparison of a punctual measurement of temperature (via the CTD diver) with a volumetric ERT-derived estimation. Both methods do not measure the same volume of aquifer. If heat seems to be a good tracer in our context, it might not be in other ones presenting a higher hydraulic gradient, a higher hydraulic conductivity, or a higher aquifer thickness, all leading to strong dilution that could prevent its detection with ERT.
The quantitative interpretation of resistivity into temperature is difficult in deterministic approach due to the presence of a varying chloride concentration with uncertain prior distribution. To go fully quantitative on bulk temperature estimations, adapted petrophysical laws have to be developed, e.g., taking into account (in our case) the chloride transport and chemical reactions induced by the high increase in temperature (e.g., calcite precipitation).

Author Contributions

Conceptualization, T.R., C.P., T.H., and P.-Y.B.; methodology, C.P.; software, C.P. and E.K.S.L.; validation, T.R., C.P., and T.H.; formal analysis, C.P. and E.K.S.L.; investigation, C.P., T.R., E.K.S.L., and T.H.; resources, P.-Y.B. and T.R.; data curation, C.P.; writing—original draft preparation, T.R. and C.P.; writing—review and editing, T.R. and T.H.; visualization, T.R., C.P., E.K.S.L.; supervision, T.R.; project administration, T.R. and C.P.; funding acquisition, P.-Y.B.

Funding

This research received no external funding.

Acknowledgments

The authors would like to thank the owner of the site who preferred to remain anonymous and three anonymous reviewers for their constructive comments that contributed a lot improving the manuscript.

Conflicts of Interest

The authors declare no conflict of interest.

References

  1. Auken, E.; Boesen, T.; Christiansen, A.V. Chapter Two—A Review of Airborne Electromagnetic Methods with Focus on Geotechnical and Hydrological Applications From 2007 to 2017. In Advances in Geophysics; Nielsen, L., Ed.; Elsevier: London, UK, 2017; Volume 58, pp. 47–93. ISBN 0065-2687. [Google Scholar]
  2. Binley, A.; Hubbard, S.S.; Huisman, J.A.; Revil, A.; Robinson, D.A.; Singha, K.; Slater, L.D. The emergence of hydrogeophysics for improved understanding of subsurface processes over multiple scales: The Emergence of Hydrogeophysics. Water Resour. Res. 2015, 51, 3837–3866. [Google Scholar] [CrossRef] [PubMed]
  3. Singha, K.; Day-Lewis, F.D.; Johnson, T.; Slater, L.D. Advances in interpretation of subsurface processes with time-lapse electrical imaging. Hydrol. Process. 2015, 29, 1549–1576. [Google Scholar] [CrossRef]
  4. Wilkinson, P.B.; Uhlemann, S.; Meldrum, P.I.; Chambers, J.E.; Carrière, S.; Oxby, L.S.; Loke, M.H. Adaptive time-lapse optimized survey design for electrical resistivity tomography monitoring. Geophys. J. Int. 2015, 203, 755–766. [Google Scholar] [CrossRef] [Green Version]
  5. Nguyen, F.; Kemna, A.; Antonsson, A.; Engesgaard, P.; Kuras, O.; Ogilvy, R.; Gisbert, J.; Jorreto, S.; Pulido-Bosch, A. Characterization of seawater intrusion using 2D electrical imaging. Near Surf. Geophys. 2009, 7, 377–390. [Google Scholar] [CrossRef] [Green Version]
  6. Chambers, J.E.; Gunn, D.A.; Wilkinson, P.B.; Meldrum, P.I.; Haslam, E.; Holyoake, S.; Kirkham, M.; Kuras, O.; Merritt, A.; Wragg, J. 4D electrical resistivity tomography monitoring of soil moisture dynamics in an operational railway embankment. Near Surf. Geophys. 2014, 12, 61–72. [Google Scholar] [CrossRef]
  7. Watlet, A.; Kaufmann, O.; Triantafyllou, A.; Poulain, A.; Chambers, J.E.; Meldrum, P.I.; Wilkinson, P.B.; Hallet, V.; Quinif, Y.; Van Ruymbeke, M.; et al. Imaging groundwater infiltration dynamics in the karst vadose zone with long-term ERT monitoring. Hydrol. Earth Syst. Sci. 2018, 22, 1563–1592. [Google Scholar] [CrossRef] [Green Version]
  8. Robert, T.; Caterina, D.; Deceuster, J.; Kaufmann, O.; Nguyen, F. A salt tracer test monitored with surface ERT to detect preferential flow and transport paths in fractured/karstified limestones. Geophysics 2012, 77, B55–B67. [Google Scholar] [CrossRef]
  9. Perri, M.; Cassiani, G.; Gervasio, I.; Deiana, R.; Binley, A. A saline tracer test monitored via both surface and cross-borehole electrical resistivity tomography: Comparison of time-lapse results. J. Appl. Geophys. 2012, 79, 6–16. [Google Scholar] [CrossRef]
  10. Auken, E.; Doetsch, J.; Fiandaca, G.; Christiansen, A.V.; Gazoty, A.; Cahill, A.G.; Jakobsen, R. Imaging subsurface migration of dissolved CO2 in a shallow aquifer using 3-D time-lapse electrical resistivity tomography. J. Appl. Geophys. 2014, 101, 31–41. [Google Scholar] [CrossRef]
  11. Dumont, G.; Robert, T.; Nguyen, F. Electrical resistivity tomography and distributed temperature sensing monitoring to assess the efficiency of horizontal recirculation drains on retrofit bioreactor landfills. Geophysics 2018, 83, B13–B23. [Google Scholar] [CrossRef]
  12. Caterina, D.; Flores Orozco, A.; Nguyen, F. Long-term ERT monitoring of biogeochemical changes of an aged hydrocarbon contamination. J. Contam. Hydrol. 2017, 201, 19–29. [Google Scholar] [CrossRef] [PubMed]
  13. Masy, T.; Caterina, D.; Tromme, O.; Lavigne, B.; Thonart, P.; Hiligsmann, S.; Nguyen, F. Electrical resistivity tomography to monitor enhanced biodegradation of hydrocarbons with Rhodococcus erythropolis T902.1 at a pilot scale. J. Contam. Hydrol. 2016, 184, 1–13. [Google Scholar] [CrossRef] [PubMed]
  14. Doetsch, J.; Linde, N.; Vogt, T.; Binley, A.; Green, A.G. Imaging and quantifying salt-tracer transport in a riparian groundwater system by means of 3D ERT monitoring. Geophysics 2012, 77, B207–B218. [Google Scholar] [CrossRef] [Green Version]
  15. Müller, K.; Vanderborght, J.; Englert, A.; Kemna, A.; Huisman, J.A.; Rings, J.; Vereecken, H. Imaging and characterization of solute transport during two tracer tests in a shallow aquifer using electrical resistivity tomography and multilevel groundwater samplers. Water Resour. Res. 2010, 46. [Google Scholar] [CrossRef] [Green Version]
  16. Supper, R.; Ottowitz, D.; Jochum, B.; Römer, A.; Pfeiler, S.; Gruber, S.; Keuschnig, M.; Ita, A. Geoelectrical monitoring of frozen ground and permafrost in alpine areas: Field studies and considerations towards an improved measuring technology. Near Surf. Geophys. 2014, 12, 93–115. [Google Scholar] [CrossRef]
  17. Hermans, T.; Vandenbohede, A.; Lebbe, L.; Nguyen, F. A shallow geothermal experiment in a sandy aquifer monitored using electric resistivity tomography. Geophysics 2012, 77, B11–B21. [Google Scholar] [CrossRef] [Green Version]
  18. Hayley, K.; Bentley, L.R.; Gharibi, M.; Nightingale, M. Low temperature dependence of electrical resistivity: Implications for near surface geophysical monitoring. Geophys. Res. Lett. 2007, 34. [Google Scholar] [CrossRef]
  19. Hayley, K.; Bentley, L.R.; Pidlisecky, A. Compensating for temperature variations in time-lapse electrical resistivity difference imaging. Geophysics 2010, 75, WA51–WA59. [Google Scholar] [CrossRef]
  20. Hermans, T.; Nguyen, F.; Robert, T.; Revil, A. Geophysical Methods for Monitoring Temperature Changes in Shallow Low Enthalpy Geothermal Systems. Energies 2014, 7, 5083–5118. [Google Scholar] [CrossRef] [Green Version]
  21. Ramirez, A.; Daily, W.; LaBrecque, D.J.; Owen, E.; Chesnut, D. Monitoring an underground steam injection process using electrical resistance tomography. Water Resour. Res. 1993, 29, 73–87. [Google Scholar] [CrossRef]
  22. Hermans, T.; Daoudi, M.; Vandenbohede, A.; Robert, T.; Caterina, D.; Nguyen, F. Comparison of temperature estimates from heat transport model and electrical resistivity tomography during a shallow heat injection and storage experiment. Ber. Geol. Bundesanst. 2012, 93, 43–48. [Google Scholar]
  23. Hermans, T.; Wildemeersch, S.; Jamin, P.; Orban, P.; Brouyère, S.; Dassargues, A.; Nguyen, F. Quantitative temperature monitoring of a heat tracing experiment using cross-borehole ERT. Geothermics 2015, 53, 14–26. [Google Scholar] [CrossRef] [Green Version]
  24. Wildemeersch, S.; Jamin, P.; Orban, P.; Hermans, T.; Klepikova, M.; Nguyen, F.; Brouyère, S.; Dassargues, A. Coupling heat and chemical tracer experiments for estimating heat transfer parameters in shallow alluvial aquifers. J. Contam. Hydrol. 2014, 169, 90–99. [Google Scholar] [CrossRef]
  25. Robert, T.; Hermans, T.; Dumont, G.; Nguyen, F.; Rwabuhungu, D.E. Reliability of ERT-derived Temperature-Insights from Laboratory Measurements. In Proceedings of the Near Surface Geoscience 2013-19th EAGE European Meeting of Environmental and Engineering Geophysics, Bochum, Germany, 9–11 September 2013. [Google Scholar]
  26. Giordano, N.; Comina, C.; Mandrone, G. Laboratory scale geophysical measurements aimed at monitoring the thermal affected zone in Underground Thermal Energy Storage (UTES) applications. Geothermics 2016, 61, 121–134. [Google Scholar] [CrossRef]
  27. Arato, A.; Boaga, J.; Comina, C.; De Seta, M.; Di Sipio, E.; Galgaro, A.; Giordano, N.; Mandrone, G. Geophysical monitoring for shallow geothermal applications - Two Italian case histories. First Break 2015, 33, 75–79. [Google Scholar]
  28. Lesparre, N.; Robert, T.; Nguyen, F.; Boyle, A.; Hermans, T. 4D electrical resistivity tomography (ERT) for aquifer thermal energy storage monitoring. Geothermics 2019, 77, 368–382. [Google Scholar] [CrossRef]
  29. Giordano, N.; Arato, A.; Comina, C.; Mandrone, G. Time-lapse electrical resistivity imaging of the thermally affected zone of a Borehole Thermal Energy Storage system near Torino (Northern Italy). J. Appl. Geophys. 2017, 140, 123–134. [Google Scholar] [CrossRef]
  30. Cultrera, M.; Boaga, J.; Di Sipio, E.; Dalla Santa, G.; De Seta, M.; Galgaro, A. Modelling an induced thermal plume with data from electrical resistivity tomography and distributed temperature sensing: A case study in northeast Italy. Hydrogeol. J. 2018, 26, 837–851. [Google Scholar] [CrossRef]
  31. Comina, C.; Giordano, N.; Ghidone, G.; Fischanger, F. Time-Lapse 3D Electric Tomography for Short-time Monitoring of an Experimental Heat Storage System. Geosciences 2019, 9, 167. [Google Scholar] [CrossRef]
  32. De Schepper, G.; Paulus, C.; Bolly, P.Y.; Hermans, T.; Lesparre, N.; Robert, T. Assessment of short-term aquifer thermal energy storage for demand-side management perspectives: Experimental and numerical developments. Appl. Energy 2019, 242, 534–546. [Google Scholar] [CrossRef] [Green Version]
  33. Vandenbohede, A.; Hermans, T.; Nguyen, F.; Lebbe, L. Shallow heat injection and storage experiment: Heat transport simulation and sensitivity analysis. J. Hydrol. 2011, 409, 262–272. [Google Scholar] [CrossRef]
  34. Hermans, T.; Lesparre, N.; De Schepper, G.; Robert, T. Bayesian evidential learning: a field validation using push-pull tests. Hydrogeol. J. 2019, 27, 1661–1672. [Google Scholar] [CrossRef] [Green Version]
  35. Hermans, T.; Nguyen, F.; Klepikova, M.; Dassargues, A.; Caers, J. Uncertainty quantification of medium-term heat storage from short-term geophysical experiments using Bayesian Evidential Learning. Water Resour. Res. 2018, 54, 2931–2948. [Google Scholar] [CrossRef]
  36. Hermans, T.; Nguyen, F.; De Schepper, G.; Lesparre, N.; Robert, T. 10 years of temperature monitoring experiments using electrical resistivity tomography: What have we learned? In Proceedings of the 1st Conference on Geophysics for Geothermal-Energy Utilization and Renewable-Energy Storage, The Hague, The Netherlands, 8–12 September 2019; pp. 1–4. [Google Scholar]
  37. Robert, T.; Hermans, T.; Lesparre, N.; De Schepper, G.; Nguyen, F.; Defourny, A.; Jamin, P.; Orban, P.; Brouyère, S.; Dassargues, A. Towards a subsurface predictive-model environment to simulate aquifer thermal energy storage for demand-side management applications. In Proceedings of the 10th International Conference on System Simulation in Buildings, Liège, Belgium, 10–12 December 2018; p. 017. [Google Scholar]
  38. Van Hoorde, M.; Hermans, T.; Dumont, G.; Nguyen, F. 3D electrical resistivity tomography of karstified formations using cross-line measurements. Eng. Geol. 2017, 220, 123–132. [Google Scholar] [CrossRef]
  39. Cho, I.K.; Yeom, J.Y. Crossline resistivity tomography for the delineation of anomalous seepage pathways in an embankment dam. Geophysics 2007, 72, G31–G38. [Google Scholar] [CrossRef]
  40. LaBrecque, D.J.; Miletto, M.; Daily, W.; Ramirez, A.; Owen, E. The effects of noise on Occam’s inversion of resistivity tomography data. Geophysics 1996, 61, 538–548. [Google Scholar] [CrossRef]
  41. Slater, L.; Binley, A.M.; Daily, W.; Johnson, R. Cross-hole electrical imaging of a controlled saline tracer injection. J. Appl. Geophys. 2000, 44, 85–102. [Google Scholar] [CrossRef]
  42. Koestel, J.; Kemna, A.; Javaux, M.; Binley, A.; Vereecken, H. Quantitative imaging of solute transport in an unsaturated and undisturbed soil monolith with 3-D ERT and TDR. Water Resour. Res. 2008, 44, W12411. [Google Scholar] [CrossRef]
  43. Lesparre, N.; Nguyen, F.; Kemna, A.; Robert, T.; Hermans, T.; Daoudi, M.; Flores-Orozco, A. A new approach for time-lapse data weighting in electrical resistivity tomography. Geophysics 2017, 82, E325–E333. [Google Scholar] [CrossRef]
  44. Oldenburg, D.W.; Li, Y. Subspace linear inverse method. Inverse Probl. 1994, 10, 915–935. [Google Scholar] [CrossRef]
  45. de Groot-Hedlin, C.D.; Constable, S.C. Occam’s inversion to generate smooth, two-dimensional models from magnetotelluric data. Geophysics 1990, 55, 1613–1624. [Google Scholar] [CrossRef]
  46. Loke, M.H.; Acworth, I.; Dahlin, T. A comparison of smooth and blocky inversion methods in 2D electrical imaging surveys. Explor. Geophys. 2003, 34, 182–187. [Google Scholar] [CrossRef]
  47. Hilbich, C.; Marescot, L.; Hauck, C.; Loke, M.; Mäusbacher, R. Applicability of electrical resistivity tomography monitoring to coarse blocky and ice-rich permafrost landforms. Permafr. Periglac. Process. 2009, 20, 269–284. [Google Scholar] [CrossRef] [Green Version]
  48. Blaschek, R.; Hördt, A.; Kemna, A. A new sensitivity-controlled focusing regularization scheme for the inversion of induced polarization data based on the minimum gradient support. Geophysics 2008, 73, F45–F54. [Google Scholar] [CrossRef]
  49. Nguyen, F.; Kemna, A.; Robert, T.; Hermans, T. Data-driven selection of the minimum-gradient support parameter in time-lapse focused electric imaging. Geophysics 2016, 81, A1–A5. [Google Scholar] [CrossRef]
  50. Miller, C.R.; Routh, P.S.; Brosten, T.R.; McNamara, J.P. Application of time-lapse ERT imaging to watershed characterization. Geophysics 2008, 73, G7–G17. [Google Scholar] [CrossRef] [Green Version]
  51. Caterina, D.; Beaujean, J.; Robert, T.; Nguyen, F. A comparison study of different image appraisal tools for electrical resistivity tomography. Near Surf. Geophys. 2013, 11, 639–657. [Google Scholar] [CrossRef]
  52. Chrétien, M.; Lataste, J.F.; Fabre, R.; Denis, A. Electrical resistivity tomography to understand clay behavior during seasonal water content variations. Eng. Geol. 2014, 169, 112–123. [Google Scholar] [CrossRef]
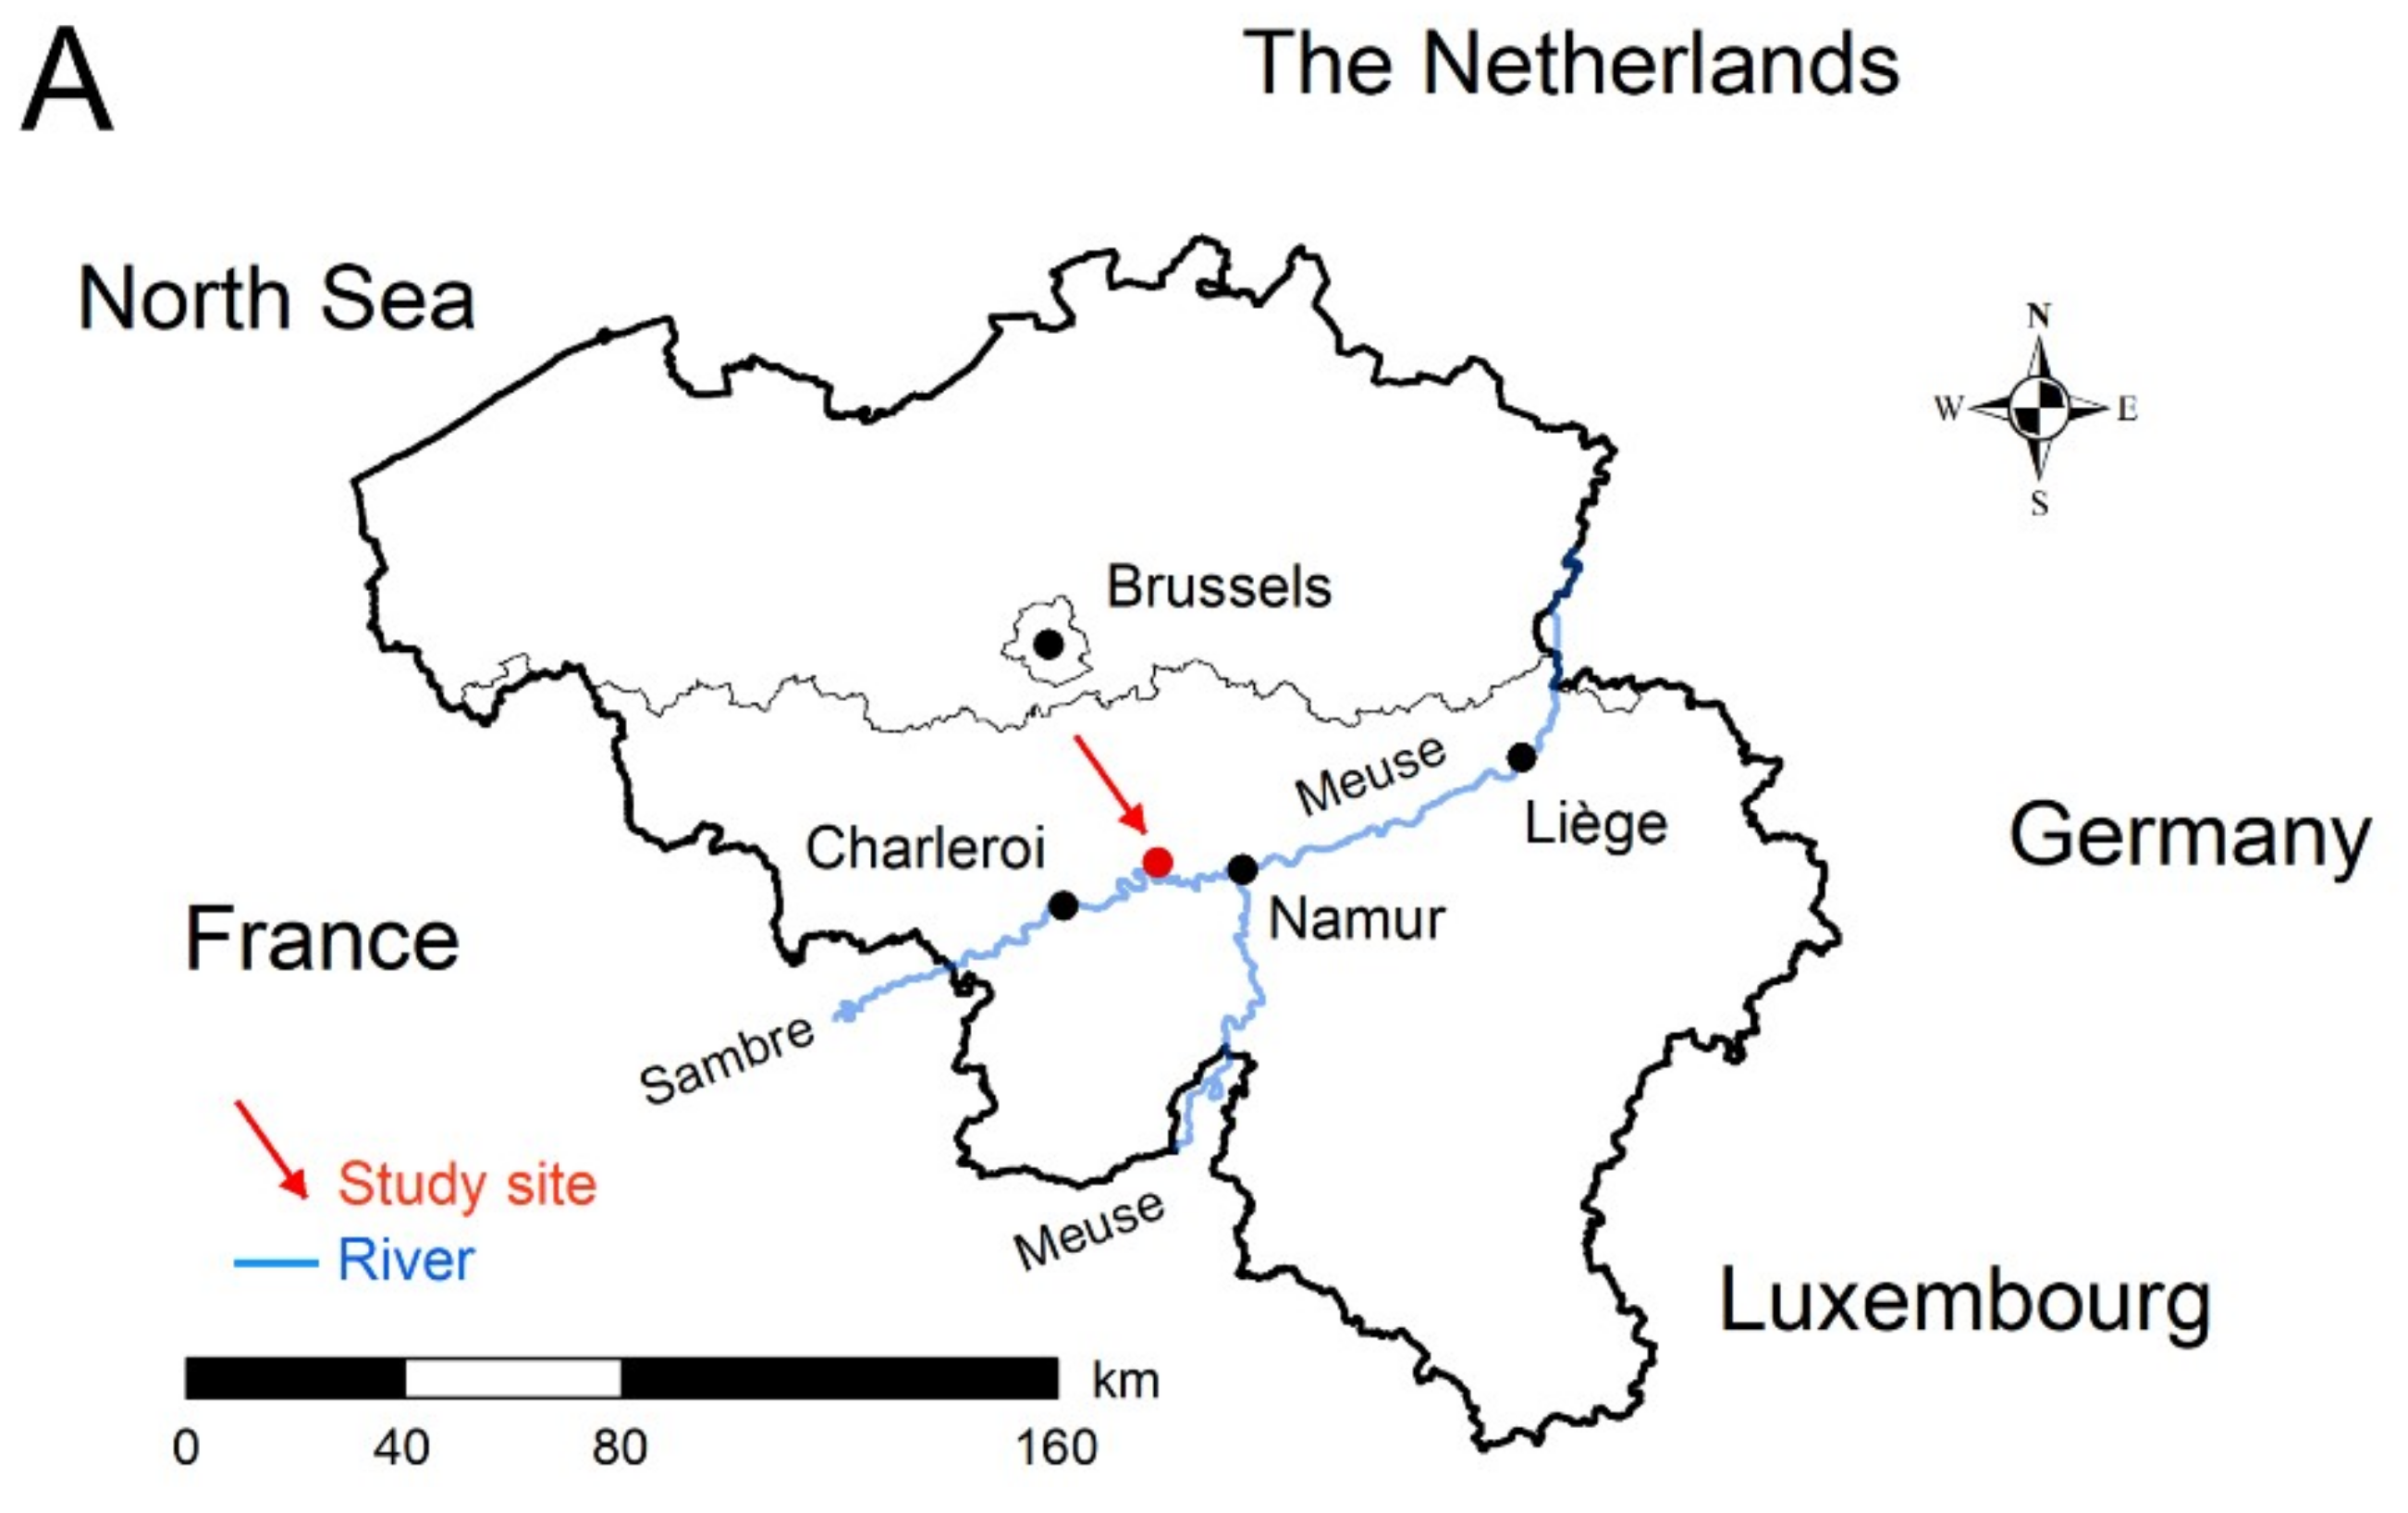
Figure 1. Location of the experimental site in an old alluvial plain of the Sambre River in Wallonia, Belgium (A). The experimental setup (B) shows the location of wells (W1 and W2) and piezometers (PzA, PzB, and PzC) equipped with CTD divers for water level (D), groundwater temperature (T), and specific electrical conductivity (C) measurements. The 3D ERT (electrical resistivity tomography) setup is composed of nine ERT profile lines and 189 electrodes in total (modified after [32]).
Geosciences 09 00414 g001aGeosciences 09 00414 g001b
Figure 2. NE-SW cross-section of the investigated area presenting the underlying geology and hydrogeophysical parameters (modifier after [37]). ρ is the electrical resistivity; the subscripts b and f respectively stand for bulk and fluid (groundwater); K is the hydraulic conductivity; T0 is the ambient groundwater temperature; e is the aquifer thickness; and m.b.s. is meters below surface.
Geosciences 09 00414 g002
Figure 3. Histograms presenting (A) the distribution of the electrical resistance values of the second background data set (with values <1 Ω), (B) the distribution of the repetition errors for the second background data set, and (C) the distribution of the contact resistances RC for the first (blue) and second (red) background data sets. (D) shows the evolution of the mean value of our data sets during the experiment and the effect of the pump test (Table 2) on the temperature curve recorded in W2.
Geosciences 09 00414 g003
Figure 4. XZ slice (Y = 12 m) of the inverted bulk electrical resistivity model (2nd background) showing the 2 to 3 m tick clay loam layer (<20 Ω.m) on top of the alluvial aquifer (60 to 80 Ω.m) (top panel); the associated relative sensitivity model (middle panel) and the application of the relative sensitivity filter on electrical images (bottom panel).
Geosciences 09 00414 g004
Figure 5. Average sensitivity in the middle part of the 3D ERT set-up (i.e., at well W2 location).
Geosciences 09 00414 g005
Figure 6. Filtering scheme and the +1% cut-off value on ρ b i .
Geosciences 09 00414 g006
Figure 7. XZ slice (Y = 12 m) of the full 3D ERT image 6 showing the unfiltered changes in bulk electrical resistivity (1st panel), the application of the 1% cut-off filter calculated with the background resistivity variations (2nd panel), the application of the relative sensitivity filter (3rd panel), and the removal of artefacts in the very shallow subsurface (in the first 2 meters where no temperature changes due to the heated water injection is expected) (4th panel).
Geosciences 09 00414 g007
Figure 8. Plain view showing changes in bulk electrical resistivity at different time steps showing the thermal plume right after the end of the push phase (1st panel), one day (2nd panel) and two days after (3rd panel) during the resting phase, and finally right after the pull phase (4th panel). The filtering scheme is explained in Figure 7.
Geosciences 09 00414 g008
Figure 9. Plain view showing changes in bulk electrical resistivity (view from above) at the end of the resting phase (1st panel, Image 6) and right after the pull phase (2nd panel, Image 7). The same filtering scheme has been used.
Geosciences 09 00414 g009
Figure 10. Changes in bulk electrical resistivity in comparison with changes in groundwater temperature at well W2 location (depth of 6.2 m, position of the CTD diver) (A) and outside the thermal affected zone, at piezometer PzA location (depth of 6.2 m, position of the CTD diver) (B).
Geosciences 09 00414 g010
Figure 11. XY slices (Z = -6.2 m) (left) and XZ slices (Y = 12 m) of changes in bulk electrical resistivity for different timesteps (images 1, 6, and 7, respectively in A, B, and C and in D, E, and F) with all the filters applied.
Geosciences 09 00414 g011
Table 1. ERT data acquisition and inversion parameters.
Acquisition DeviceABEM Terrameter LS
Number of Acquisition Channels8
Contact Resistancemaximum 50 ± 25 Ω
Current Intensityfrom 20 to 500 mA
Stacking2–3 repetitions with a quality factor of 1%
Repetition Errormean 0.20%, std. 0.60%
Delay Time0.2 s
Acquisition Time0.3 s
Total injection Time0.5 s
Unit Electrode Spacing in X2 m
Unit Electrode Spacing in Y3 m
Number of Electrodes Per Profile (in X)21
Number of Profiles (in Y)9
Total Number of Electrodes189
Dimension of the Full Set-up (X × Y)48 m × 24 m
Reciprocal MeasurementsFor selected sequences only
Reciprocal Error<2%
Depth of Investigation~8 m
Electrodes ArraysInline dipole-dipoleCross-line dipole-dipole Inline gradient
Number of Quadrupoles Per Group654480372
Acquisition Time Per Group15 min10 min8 min
Total Number of Quadrupoles Per Image4518 (full) and 1506 (light)
Acquisition Time for a Full Image2 h
Acquisition Time for a Light Image35 min
Inversion ParametersRobust data constraint (L1 norm)
Standard “smoothness” model constraint (L2 norm)
Stopping CriterionIteration 3 with a final absolute error ~2%
Time-lapse SchemeIndependent inversions
Time-lapse Reference2nd background image for each time step
Table 2. Workflow of the experiment.
PhaseElapsed Time [h] 1Date (May [dd] 2015) and Time
Implementation-04 (11:00 AM)
1st background ERT image-04 (04:00 PM)
Storm and heavy rain-at night
2nd background ERT image-05 (08:30 AM)
Push start005 (11:00 AM)
Light 3D ERT image a305 (02:00 PM)
Light 3D ERT image b405 (03:00 PM)
Light 3D ERT image c505 (04:00 PM)
Push end5.3305 (04:20 PM)
Full 3D ERT image 1605 (05:00 PM)
Heavy rain-06 (AM & PM)
Full 3D ERT image 22306 (10:00 AM)
Full 3D ERT image 32506 (12:00 AM)
Full 3D ERT image 42706 (02:00 PM)
Light 3D ERT image d2906 (04:00 PM)
Full 3D ERT image 54707 (10:00 AM)
Pump test48.507 (11:30 AM)
Full 3D ERT image 65007 (01:00 PM)
Light 3D ERT image e7008 (09:00 PM)
Pull start71.1508 (10:10 AM)
Light 3D ERT image f71.508 (10:30 AM)
Light 3D ERT image g72.1508 (11:10 AM)
Light 3D ERT image h72.808 (11:50 AM)
Light 3D ERT image i73.4508 (12:30 AM)
Light 3D ERT image j74.108 (01:10 PM)
Light 3D ERT image k74.7508 (01:50 PM)
Pull end75.508 (02:30 PM)
Full 3D ERT image 77608 (02:30 PM)
1 Time t = 0 is at the start of the injection (push phase of the test).