Article

Thermal Effects of Magmatism on Surrounding Sediments and Petroleum Systems in the Northern Offshore Taranaki Basin, New Zealand

1
Institute of Geology and Geochemistry of Petroleum and Coal, RWTH Aachen University, 52062–52080 Aachen, Germany
2
Institute of Geological and Nuclear Sciences, 5010 Lower Hutt, New Zealand
3
Energy and Mineral Resources Group, Geological Institute, RWTH Aachen University, 52062–52080 Aachen, Germany
*
Author to whom correspondence should be addressed.
Geosciences 2019, 9(7), 288; https://doi.org/10.3390/geosciences9070288
Submission received: 8 May 2019 / Revised: 24 June 2019 / Accepted: 26 June 2019 / Published: 29 June 2019
(This article belongs to the Special Issue Geostatistical Applications in Petroleum Geology)

Abstract

:
In the past two decades, numerical forward modeling of petroleum systems has been extensively used in exploration geology. However, modeling of petroleum systems influenced by magmatic activity has not been a common practice, because it is often associated with additional uncertainties and thus is a high risk associated with exploration. Subsurface processes associated with volcanic activity extensively influence all the elements of petroleum systems and may have positive and negative effects on hydrocarbon formation and accumulation. This study integrates 3D seismic data, geochemical and well data to build detailed 1D and 3D models of the Kora Volcano—a buried Miocene arc volcano in the northern Taranaki Basin, New Zealand. It examines the impact of magmatism on the source rock maturation and burial history in the northern Taranaki Basin. The Kora field contains a sub-commercial oil accumulation in volcanoclastic rocks that has been encountered by a well drilled on the flank of the volcano. By comparing the results of distinct models, we concluded that magmatic activity had a local effect on the thermal regime in the study area and resulted in rapid thermal maturation of the surrounding organic matter-rich sediments. Scenarios of the magmatic activity age (18, 11 and 8 Ma) show that the re-equilibration of the temperature after intrusion takes longer (up to 5 Ma) in the scenarios with a younger emplacement age (8 Ma) due to an added insulation effect of the thicker overburden. Results of the modeling also suggest that most hydrocarbons expelled from the source rock during this magmatic event escaped to the surface due to the absence of a proper seal rock at that time.

1. Introduction

Basin modeling is a powerful tool for integrating geological and geophysical data over a range of scales and provides a means to test and refine concepts related to basin evolution. The term “basin modeling” is used here for dynamic forward modeling of geological and physical processes taking place in sedimentary basins over a certain geological time span [1]. Modeling incorporates deposition, subsidence and compaction, heat flow analysis, as well as hydrocarbon generation, expulsion and accumulation. Numerical forward modeling of petroleum systems is common practice in exploration, but areas with magmatic activity are often perceived as a high risk target for hydrocarbon exploration [2]. There are, however, multiple examples of petroleum systems associated with igneous intrusions all over the globe, some of which contain significant hydrocarbon accumulations (e.g., references [3,4]).
Volcanic activity includes multiple surface and subsurface processes that have an extensive impact on the thermal regime in the surrounding region. Subsurface volcanic processes such as sills/dikes emplacement and magma-chamber formation are of particular interest because the complex interaction between host rock and magmatic intrusion may have both positive and negative effects on all elements of a petroleum system. High heat flow resulting from magmatic activity, for example, may accelerate the thermal maturation of petroleum source rocks, whereas it may also lead to “overcooking” of organic matter and the loss of generated hydrocarbons [5,6]. It is, therefore, important to develop a good understanding of the architecture of a magmatic system, its age, and its geometric relationship to intruded strata, as well as associated heat flow variation through time when assessing a petroleum system. Interaction of magmatic intrusions (sills and dikes) with surrounding organic material may play a significant role in the timing of the hydrocarbon expulsion and accumulation, whereas the timing of emplacement and the size of intrusive body defines the volume of influence [7]. Hydrocarbon generation associated with strata rapidly heated by magmatic intrusion has been studied numerically for several regions [2,8,9,10,11]. Modeling of magmatic intrusions is, however, rarely conducted in 3D petroleum systems models as their effects are generally considered to be local rather than regional in scale.
The offshore northern Taranaki Basin, New Zealand is an ideal location to study the influence of magmatism on a petroleum system due to a proven hydrocarbon presence within a well-preserved buried submarine volcanic center. To complement these data, exploration boreholes around the Kora volcano provide valuable information for petroleum system model calibration. The results of this study are relevant to other petroleum regions with magmatic activity.
This study focuses on detailed 1D and 3D numerical models of a buried Miocene arc volcano (Kora) to examine the impact of magmatism on source rock maturation and burial history in the northern Taranaki Basin. The geometries of the stratigraphic layers were interpreted from 3D seismic data. Recent studies have focused on the geomorphology, structure, and geometry of sills and dikes associated with the Kora volcano [12,13,14]. Previous numerical studies have focused on 1D thermal modeling and heat anomalies associated with shallow and deep seated intrusions of Kora and their impact on hydrocarbon generation [15]. However, a study that provides a full 3D perspective of magmatic thermal influence on maturation of organic matter is lacking.
The modeling results are used to answer the following scientific questions:
  • How does the magmatic intrusion affect the thermal maturation of the surrounding source rock?
  • What is the sensitivity of the results to the shape and distribution of volcanic intrusion?
  • What are the effects of a deep seated magmatic intrusion (e.g., magma chamber) in comparison to dikes and sills intruding the sedimentary sequence?
These questions, although widely discussed in the last decades based on 1D and 2D studies, remain not fully answered when the third dimension is added. Recent studies on the thermal effects of magmatic intrusion on hydrocarbon maturity show a strong relation between sill thickness and temperature, as well as maturation of the surrounding organic matter [16,17,18,19].
Industry 3D seismic reflection data tied to exploration wells were used to map the major stratigraphic units around Kora to define the geometry and shape of this sub-sea stratovolcano and underlying dikes and sill complexes. We use 3D numerical simulation to assess the influence of magmatic intrusion on the thermal maturation of organic matter and the petroleum system. The effects of deep seated intrusion, sill emplacement, and a system of dikes building a volcanic center are analyzed in this paper. We discuss local lateral changes in heat flow associated with different scenarios and its effect on hydrocarbon generation. To construct petroleum systems models we integrated previously published research data, core and well data, well completion reports, and geochemistry reports available online in the New Zealand Petroleum and Minerals Exploration Database, as well as further geological data from New Zealand Petroleum Exploration Data Pack 2018 provided by New Zealand Petroleum and Minerals.

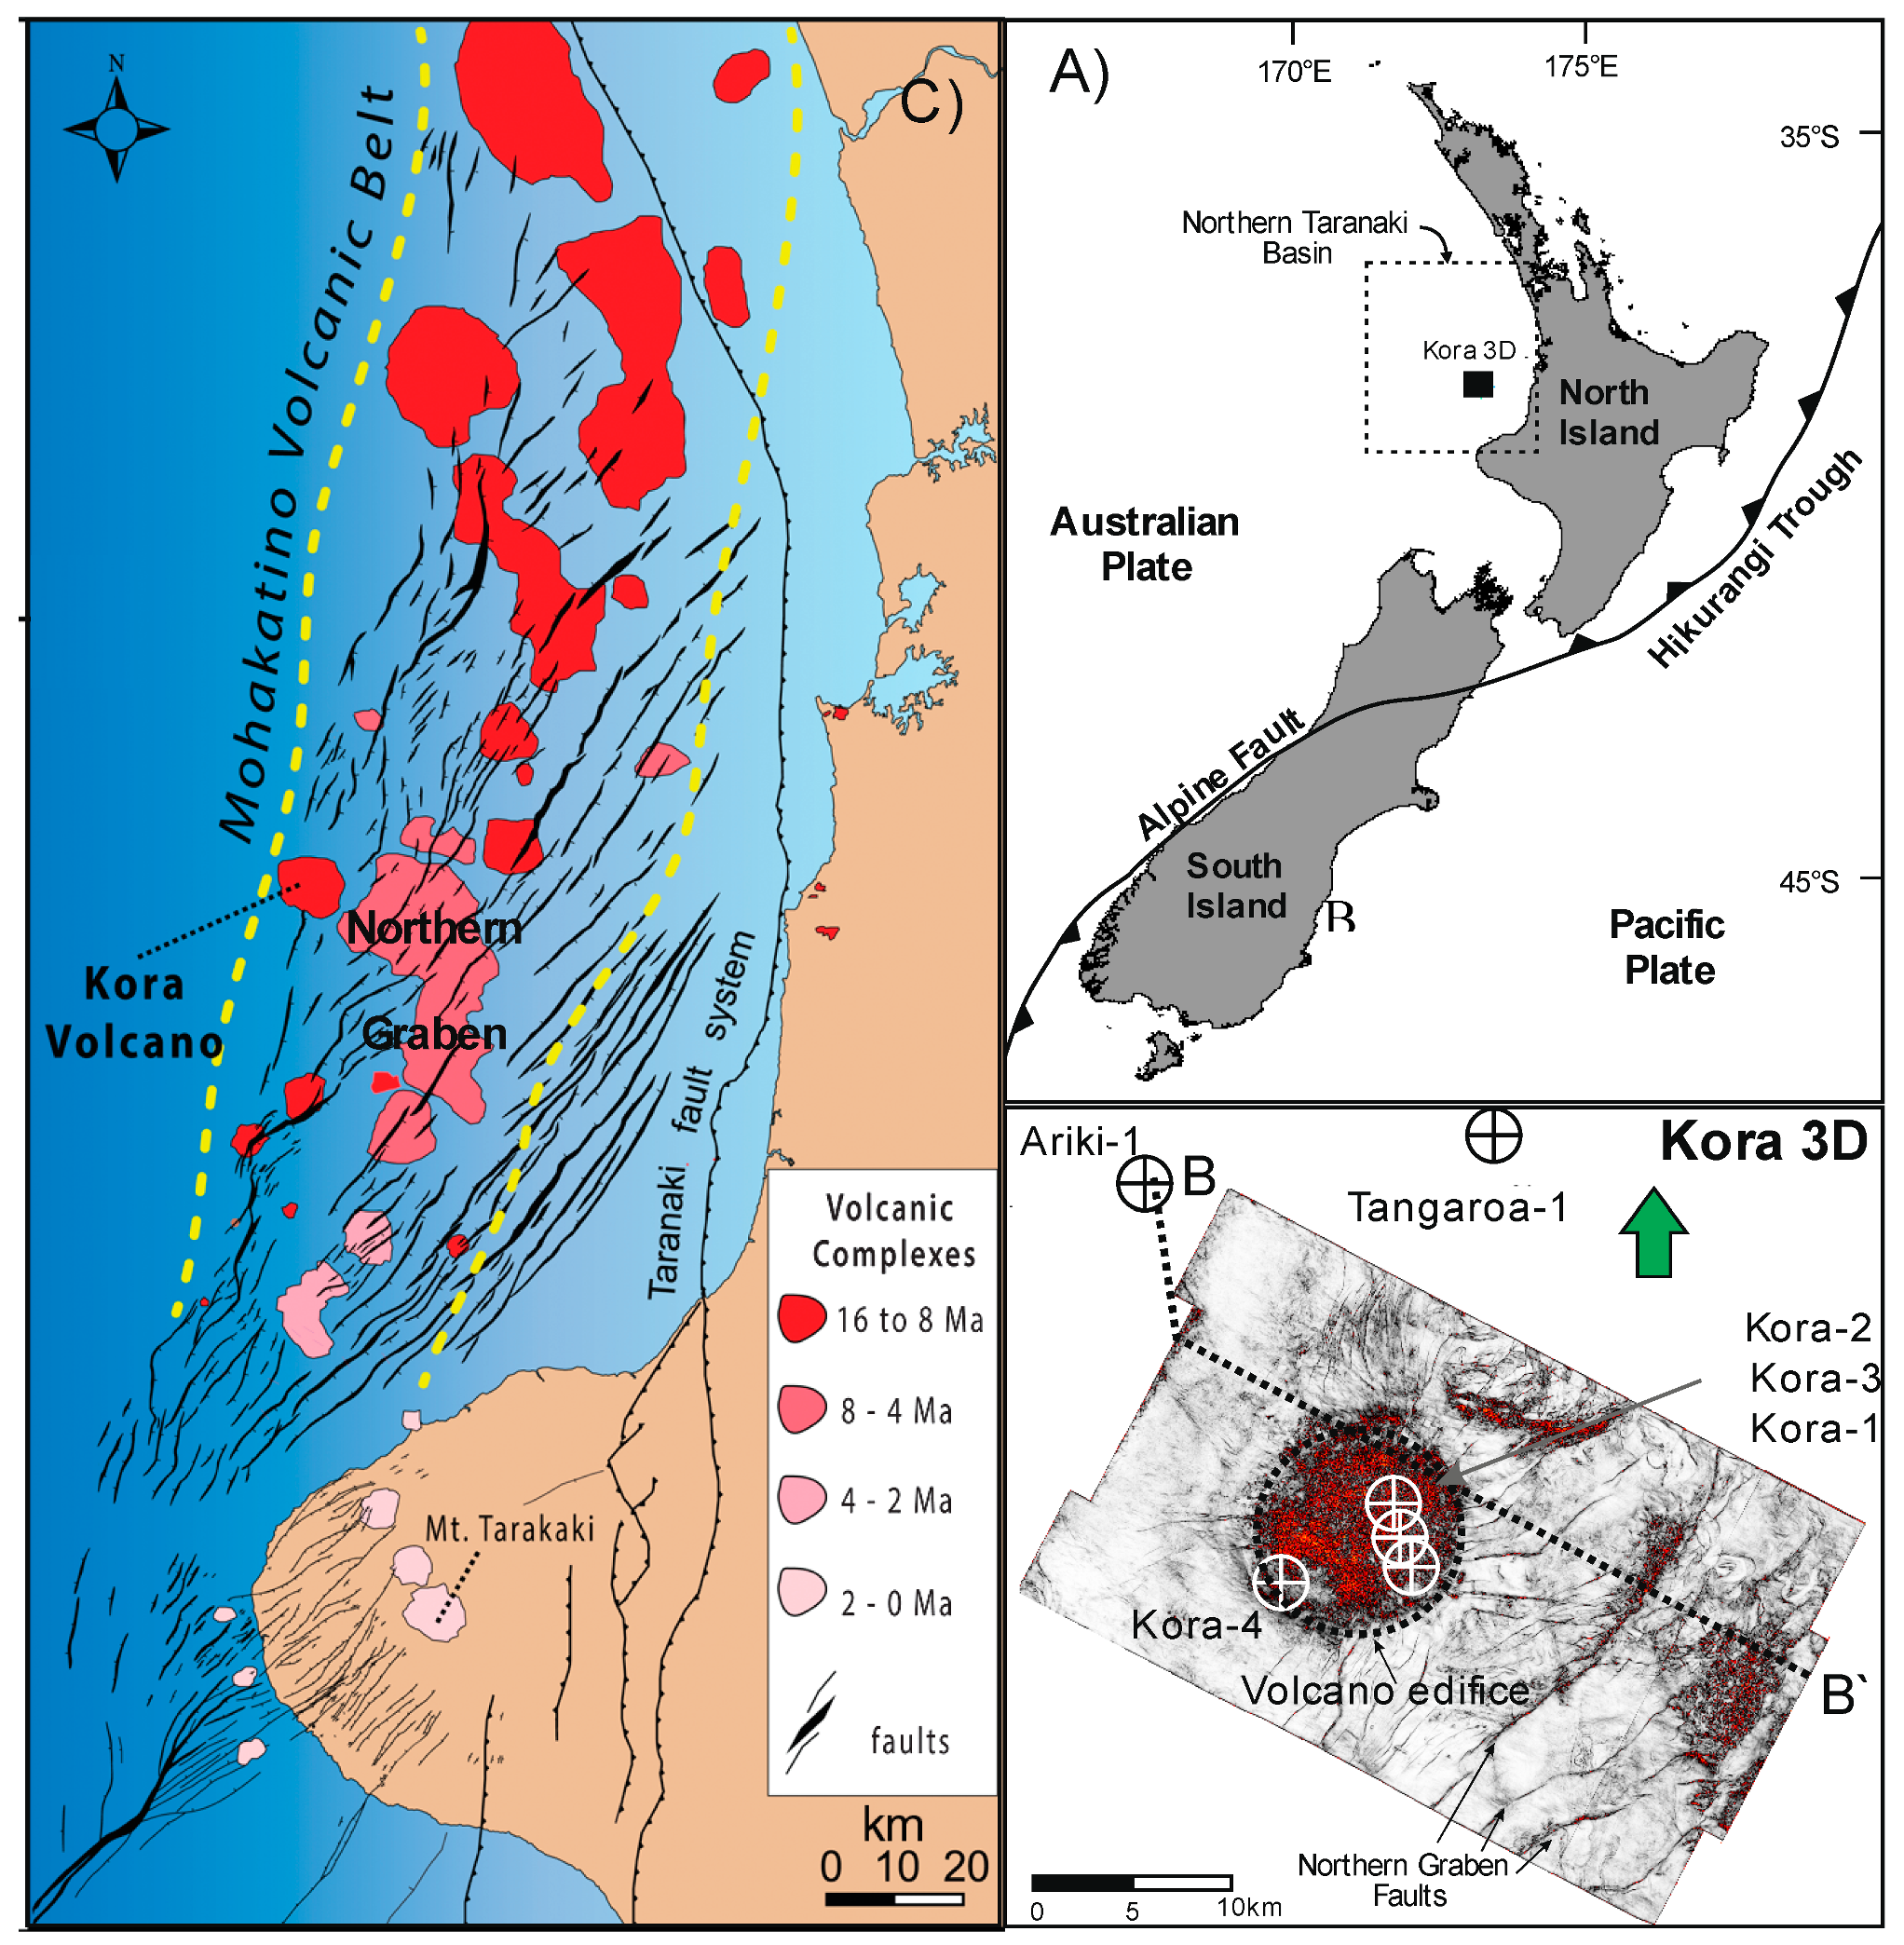
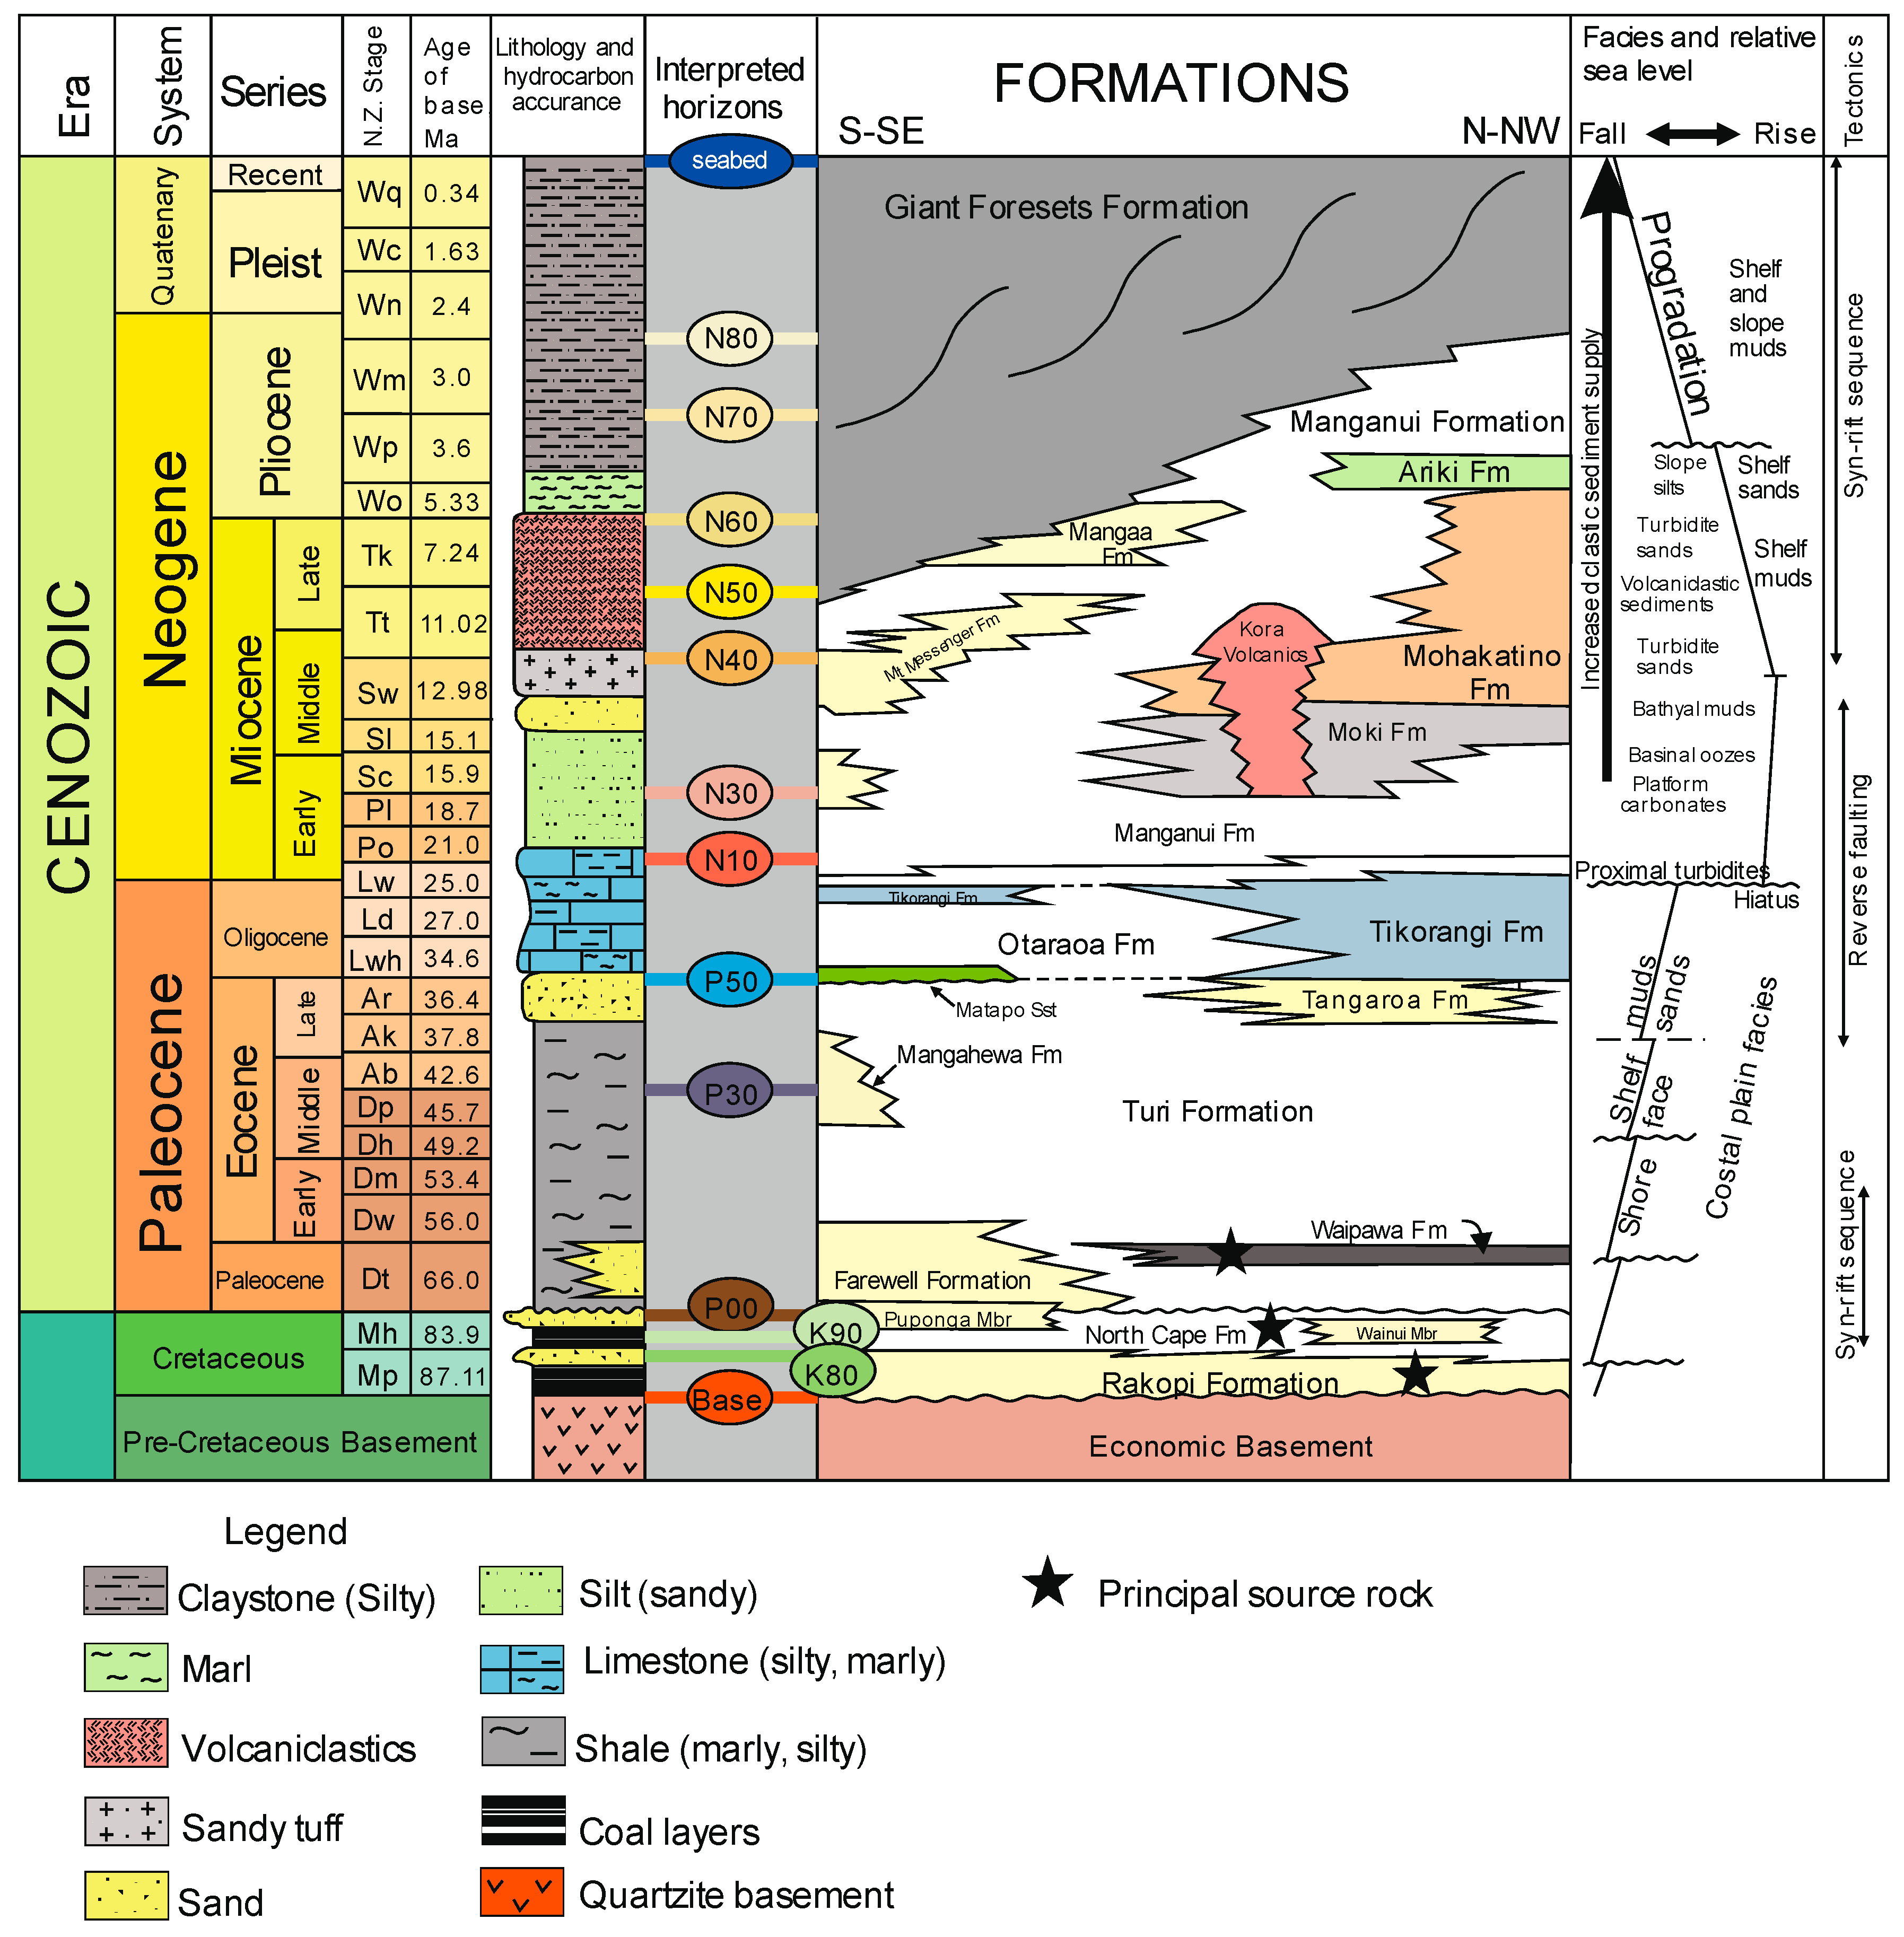
2. Geological Setting

Taranaki Basin, situated beneath and to the west of the western North Island is presently New Zealand’s only producing hydrocarbon province (Figure 1). The study area is located offshore west of New Zealand’s North Island on the western margin of Neogene arc volcanism and intra-arc rifting [20,21] (Figure 1). The sedimentary and tectonic history of the northern Taranaki Basin can be subdivided into three major periods: an early syn-rift phase (Late Cretaceous to Paleocene), a post-rift phase (Eocene to Mid Miocene) and a young extensional and volcanic back-arc phase (Late Miocene to Recent) phase (Figure 2).
Taranaki Basin developed in the Late Cretaceous as Zealandia separated from the continental landmass of Gondwana [20,23]. The basin contains up to 11 km of Late Cretaceous to Recent strata that records continental breakup through to passive margin subsidence and the subsequent development of the modern plate boundary through New Zealand [20,24].
In its early phase, Late Cretaceous rifting in the Taranaki Basin was characterized by widely distributed NW-NNW to NE trending half-grabens developed in response to the Gondwana break-up and the opening of the Tasman Sea [23,25]. The predominantly Late Cretaceous extensional episodes developed large normal faults with thick terrestrial to marginal syn-rift sequences (2 to 3 km) [20]. In subsequent deformation phases, these Late Cretaceous faults have, in some cases, reactivated multiple times [24]. Extension waned in the Latest Cretaceous/Early Paleocene, resulting in a transition to a passive transgressive margin undergoing gradual thermal subsidence [20,23]
The development of the modern Australia-Pacific plate boundary through New Zealand began in the middle Eocene resulting in contraction along the eastern margin of the Taranaki Basin [26]. This contraction, characterized by reverse faulting and foreland basin development, resulted in uplift and erosion of Late Cretaceous to Paleocene strata along the eastern margins of the basin [20,27]. Maximum transgression in the basin occurred during the Oligocene and was followed by regression in the Early Miocene contemporaneous with initiation/reactivation of subduction along the Hikurangi margin to the east [20,24]. Arc volcanism along the Mohakatino Volcanic Centre developed in the northern Taranaki Basin from this time (ca. 18–20 Ma) and continued until ca. 5 Ma [22,28].
Contraction along the eastern basin margin continued until the Mid Miocene (ca. 12 Ma), when oblique subduction and steepening/roll back of the subducting Pacific plate resulted in extension across the northern part of the basin [20,21,29]. Arc volcanism and intra-arc rifting in the northern Taranaki Basin migrated southwards during the Late Miocene to Pliocene to its present location on the Taranaki peninsula (Mt. Taranaki) [21,22] (Figure 1C). From the Latest Miocene, uplift and exhumation of the central North Island and the southern Taranaki Basin resulted in high sedimentation rates, the rapid westward progradation of the shelf, and burial of stratovolcanoes of the northern Taranaki Basin [20,24,30]. The stratigraphic and tectonic framework for the northern Taranaki Basin is shown in Figure 2.
The Kora volcano belongs to a chain of buried arc-related stratovolcanoes and intrusions (Mohakatino Volcanic Centre) that developed in the northern Taranaki Basin from the Early Miocene [20,22,28]. This north-northeast-trending volcanic arc was subsequently dissected during rifting associated with the development of the Northern Graben [20,21,28]. Volcanic edifices of the Mohakatino Volcanic Centre cover about 20% of the Northern Graben area [20]. Radiometric dating and seismic reflection mapping tied to nearby exploration wells indicate that Kora developed between 19.5 and 5.5 Ma [22,28].
Petroleum exploration of the Mohakatino Volcanic Centre started in the 1960s with acquisition of 2D seismic data and drilling of the first well, targeting an off-shore volcanic center (Mangaa-1) in 1970 [12]. The first well into the Kora volcanic structure (Kora-1) was drilled in 1987 by Arco Petroleum NZ Ltd. The target of this drilling operation was a structural high within Eocene sandstones (Tangaroa Formation). However, an oil productive interval was discovered within Miocene volcanoclastics [28,31]. Therefore, based on the estimated hydrocarbon accumulations and reservoir rock properties, the Miocene volcanics became an attractive target for further exploration around the Kora volcano and a further three wells were drilled (Kora-2, Kora-3, and Kora-4).
Kora-1 well penetrated the Eocene to present day stratigraphic sequence represented by deep to shallow marine sediments and volcanoclastics, reaching a depth of 3421 m. Seismic reflection data and mapping show the Kora stratovolcano overlying deformed Early Miocene strata and onlapped by Pliocene-Recent strata (Figure 3; [28]). The oldest stratigraphic units encountered include several hundreds of meters of Eocene Turi Formation, which is predominated by shales with siltstones and sandstones. This unit is directly overlain by late Eocene-early Oligocene turbidite sandstones of the Tangaroa Formation submarine fan complex [32]. The Oligocene-early Miocene section is represented by deep-water limestones of Tikorangi and Taimana Formations. Series of pyroclastic deposits of andesite composition and volcanoclastics related to Miocene volcanic activity represent the equivalent of Mohakatino Formation in the region and possess good reservoir rock properties in several wells drilled around the Kora volcano. This volcanoclastic interval is underlain by up to 1000 m of claystones of Manganui Formation and overlain by a thick layer of progradational Giant Foresets Formation [33].
The main target of the drilling of the Kora-1/1A wells, the Eocene Tangaroa Formation was found to contain hydrocarbons [34], but in a too low permeability reservoir rock to be commercially productive. However, in the Kora-1A well, petroleum was produced from the Miocene volcano-sedimentary section with an average flow rate of 668 barrels of oil per day for several days. The other wells either encountered oil shows in Miocene volcanics or were dry. During a drill stream test in well Kora-3, only formation water was produced and core saturation analysis of the well Kora-2 indicated the presence of only residual oil in the formation [34,35,36].
Geochemical analyses indicate that the oils from the Kora discovery were expelled from the Late Paleocene Waipawa Formation [37,38]. The Waipawa Formation is a widespread source rock in New Zealand basins, represented by about 2 to 80 m thick marine mudstone. Higher contributions of terrestrial (mainly woody) plant matter are indicated by higher land plant biomarkers and high phenol/naphthalene ratios [39]. The presence of a Late Paleocene source rock in the study region is confirmed by Ariki-1 well, where the Waipawa Formation is represented by a 12 m thick organic-rich marine shale located at depth of 4122–4134 m with total organic carbon (TOC) averaging 3.6 wt% [40]. A maximum TOC value of 11.5 wt% was derived for the samples from Ariki-1 well [41]. The Waipawa Formation is mainly characterized by terrigenous organic matter [39,42] but HI values are partly above 400 mg/g TOC falling into the field of type II and type II/III source rock. This is consistent with general marine nature of the Waipawa Formation, but with a major contribution of terrestrial – derived woody material [39].

3. Methods

3.1. Input Data

The dataset for this study comprises a 3D seismic survey with an approximate area of 900 km2 acquired by OMV and Argo in 2006, and well data for six exploration wells (Kora-1 and 1A, Kora-2, Kora-3, Kora-4, Ariki-1 and Tangaroa-1) (Figure 1B). The 3D seismic data are in SEG normal polarity, 12.5 m × 25 m binning, and post-stack time migrated. Well data used for seismic interpretation and depth conversion include check-shot data, tops of the stratigraphic units, and well-log data. Well reports [33,34,35,36,43] and electric logs were used to provide additional input data for the numerical models.
Analysis of 3D seismic reflection data was carried out using reflectivity and variance/coherency (edge detect attribute) analysis. Seismic-to-well tie and an integration with stratigraphic data were carried out to create a framework for the initial seismic interpretation and a subsequent tectono-stratigraphic analysis. 3D seismic was tied to Ariki-1 well using an additional 2D seismic section.
Time-to-depth conversion was performed with Petrel 2016. Check-shot data were used to calculate interval velocities for the interpreted seismic units, and included in a final velocity model used for depth conversion (Table 1). Additionally, a high velocity interval of Miocene volcanics was introduced as a separate horizon. Uncertainties in the time-depth relationships (TDR) in the study area were analyzed by comparing the check-shots of all other wells with the TDR curve derived from synthetic seismograms at well Ariki-1. For the stratigraphic units below Kora volcano that are not present in Ariki-1 and Tangaroa-1 wells, interval velocities were assigned by extrapolating the TDR curve.

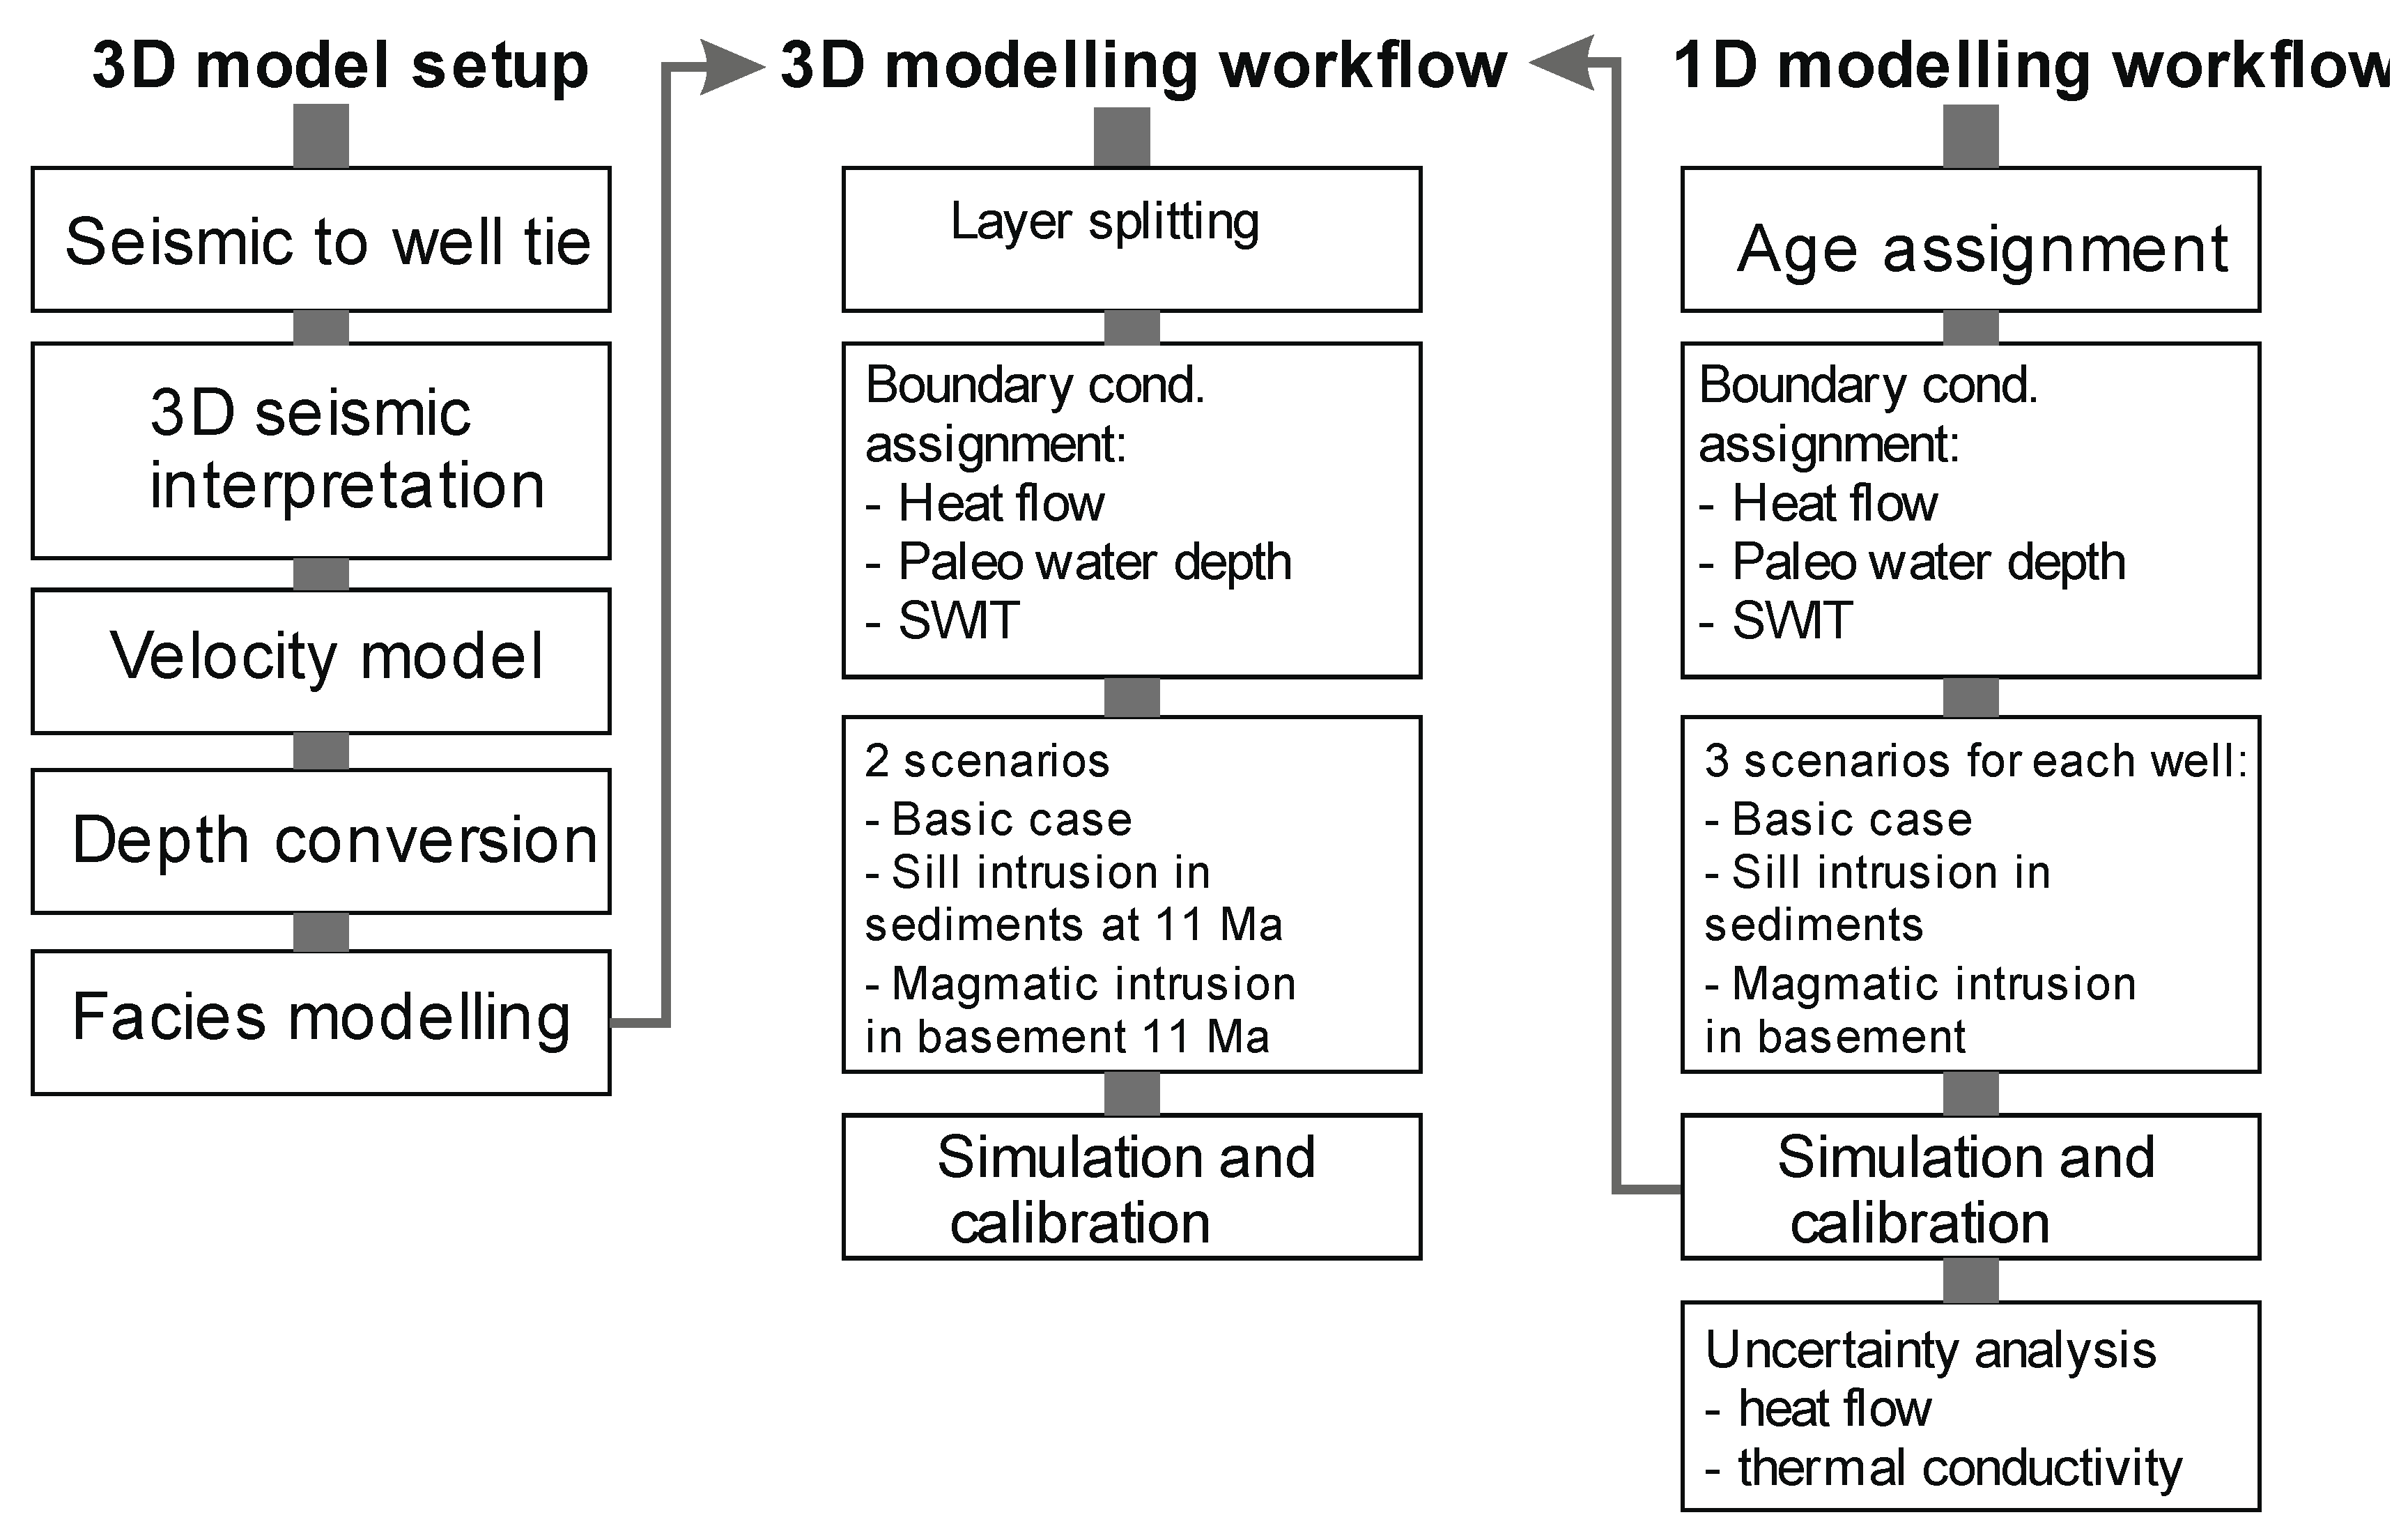
3.2. 1D and 3D Modeling

The general workflow implemented in this study is shown on Figure 4.
To analyze the effect of volcanic activity in the Kora volcano region 1D, models were constructed for four wells (Ariki-1, Kora-1, Kora-4 and Tangaroa-1). In this study 1D models were used to simulate different scenarios for the timing of magmatic activity and to analyze the uncertainties of the models. To reconstruct the thermal and burial history of the area, well data were used that include the information about the depth of stratigraphic tops, formation age and its lithology. The cuttings description was used for defining the lithologies of the sediments and thickness of the stratigraphic units [33,34,35,36,43]. The input data used for the 1D model for Ariki-1 well are summarized in Table 2. Biostratigraphic ages, ages of intrusion emplacement, corrected borehole temperatures, and thermal maturation parameters were used to constrain the models.
Thermal conductivity data for the lithologies in the model were introduced as reported in Funnel et al. [44] for Ariki-1 well. Physical rock properties such as permeability and compaction with depth were used as default settings for the specific lithologies from the software. Compaction calculation within the software is based on Athy’s law.
Source rock kinetics for the Waipawa Formation as well as Rock-Eval data were available from the geochemical report for Ariki-1 well [41] (Table 3). Vitrinite reflectance measurements and borehole temperatures were used for calibration of the thermal history for each well [45].

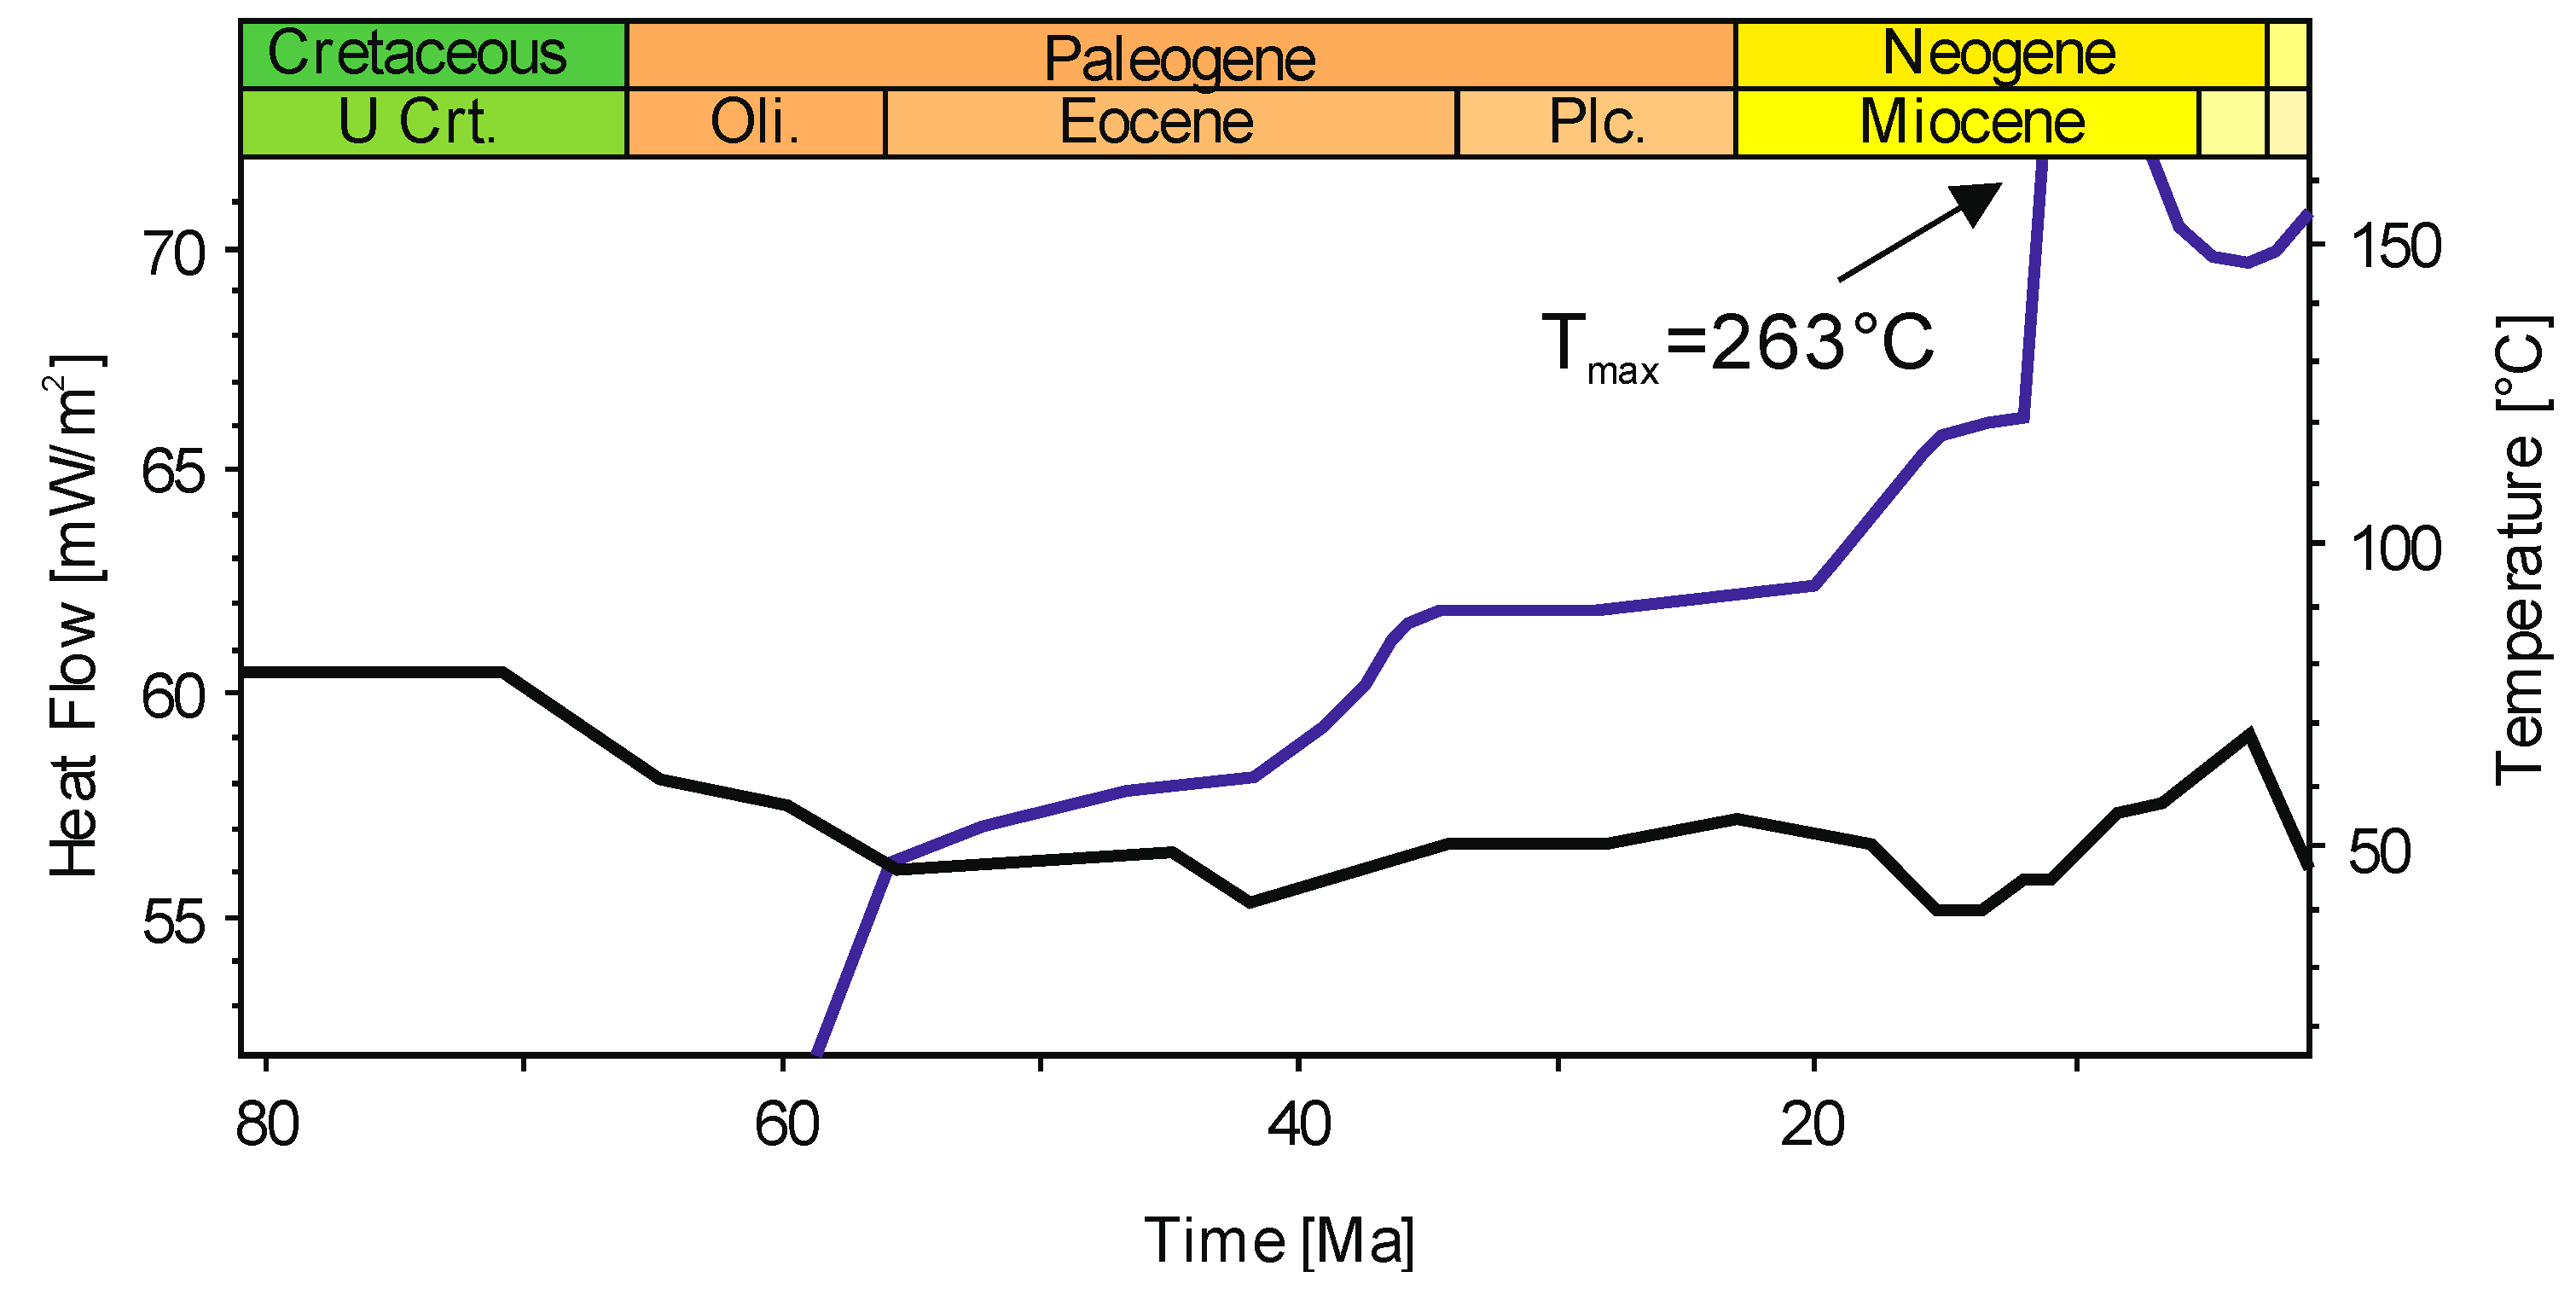
3.3. Thermal Calibration and Heat Flow

To reconstruct the thermal history of the study area, the knowledge of the present-day and paleo-heat flows is crucial. Present day heat flow was determined by calibration of the model to bottom-hole temperatures that were available from previous studies [45]. The paleo-heat flow from previous regional modeling [46] was used as a basis for the present study and modified to fit the modeled wells using the calibration data by implementing different scenarios of intrusion emplacement. Heat-flow input data and paleo-temperature used in the base case model and temperature history predicted for the Waipawa Formation are shown in Figure 4. The basal heat flow without taking into account magmatism decreases from 62 mW/m2 at 80 Ma to a present day heat flow of 50 mW/m2 (Figure 5). The temperature history indicates the temperatures that a particular layer experienced at a certain point of time and primarily depends on the burial history and heat flow. The upper boundary condition is defined by the sediment/water interface temperature (SWIT), which depends on the paleowater depth (PWD), paleolatitude and climatic evolution [47]. The PWD in the northern Taranaki Basin was assigned based on Strogen et al. [48] and varies between 0 and 1500 m. SWIT was defined using an automatic function in PetroMod that is based on Wygrala [49].

3.4. Intrusion Modeling

Sub-volcanic intrusion was modeled for several stages during the Late Miocene. The timing for the Kora volcano activity and Mangaa volcano was adopted based on ages reported by Bergman et al. [28] and Giba et al. [22], who primarily used K-Ar dating and seismic stratigraphy as a method to determine the start and duration of the volcanic activity. Seismic stratigraphy analysis indicates that Kora volcano had been active between 12 and 8 Ma [22]. Results of K-Ar dating of andesitic tuffs from Kora wells give the age of 12.1 ± 2.6 Ma. The intrusion emplacement is a short lived event on the geological time scale and generally lasts no longer than several thousands to tens of thousands of years. However, volcanic activity on a regional scale might continue for several millions of years. In this study, the volcanic activity was modeled in two different ways. First the PetroMod “Intrusion” tool was used with magmatic intrusion being introduced to one or a number of layers. “Intrusion tool” for 1D allows to model a magmatic event by emplacing the “original lithology” by magmatic intrusion with corresponding parameters (type of intrusion, temperature etc.). In 3D, the “Intrusion” tool was used by replacing the host rock with a magmatic intrusion at the predefined area of a facies map. In this scenario (sub-) volcanic magmatic activity was introduced as andesitic type intrusion at 11 Ma to the model as described by Bergman et al. [28]. There is no direct evidence of the mechanism of intrusion emplacement at Kora, such as sill intrusions and/or dykes penetrated by a well. Therefore seismic reflection data showing high amplitude reflectors, interpreted as igneous intrusions, beneath Kora wells and widely distributed beneath the Kora volcano at the interpreted late Paleocene–Late Cretaceous layers were used as an input data source for the magmatic intrusion modeling (Figure 6 and Figure 7C). The base of layers P10-P00-K90 have been chosen for the emplacement of the intrusion. The intruded material is modeled to replace the original sedimentary rock with an andesitic melt, the thermal properties of which are shown in Table 4. We have modeled a second scenario of intrusion emplacement that represents a deep seated intrusion below the modeled section. In this scenario, the basal heat flow is dramatically increased at 11 Ma from 43 mW/m2 to 200 mW/m2. The thermal effect of a deep seated intrusion gradually decreases from the basement to the upper layers.
In the simulations for 1D models of Kora-1 and Kora-4 wells and the 3D models we assumed that that the magma temperature corresponds to the lower limit of andesite melts upon extrusion (950 °C). The heat pulse generated by the intrusion is highly dependent on the intrusion temperature and its thickness and significantly influences the overall output of the model. Convective heat transfer associated with volcanic activity such as hydrothermal fluid flows was not modeled in this study.

4. Model Setup

A 3D model covering about 900 km2 was built with a grid resolution of 250 × 250 m. This resolution allows for the construction of a detailed volcanic intrusion geometry and provides sufficient detail on the lithology distribution around the Kora volcano. Distribution of lithologies in the 3D model was based on interpolation between Kora wells. Lithologies for deeper stratigraphic units of Eocene to Late Cretaceous age were assigned based on the paleogeographic maps from Strogen [48]. The volcano edifice was introduced in the model as a uniform intrusion body in the shape of a cone with constant physical properties. The maps of stratigraphic units (see next chapter) were integrated with well data through lithological modeling and used as an input data for the 3D numerical model. A model simulating magmatic intrusion placed in basement rock was constructed using an increase in basal heat flow.

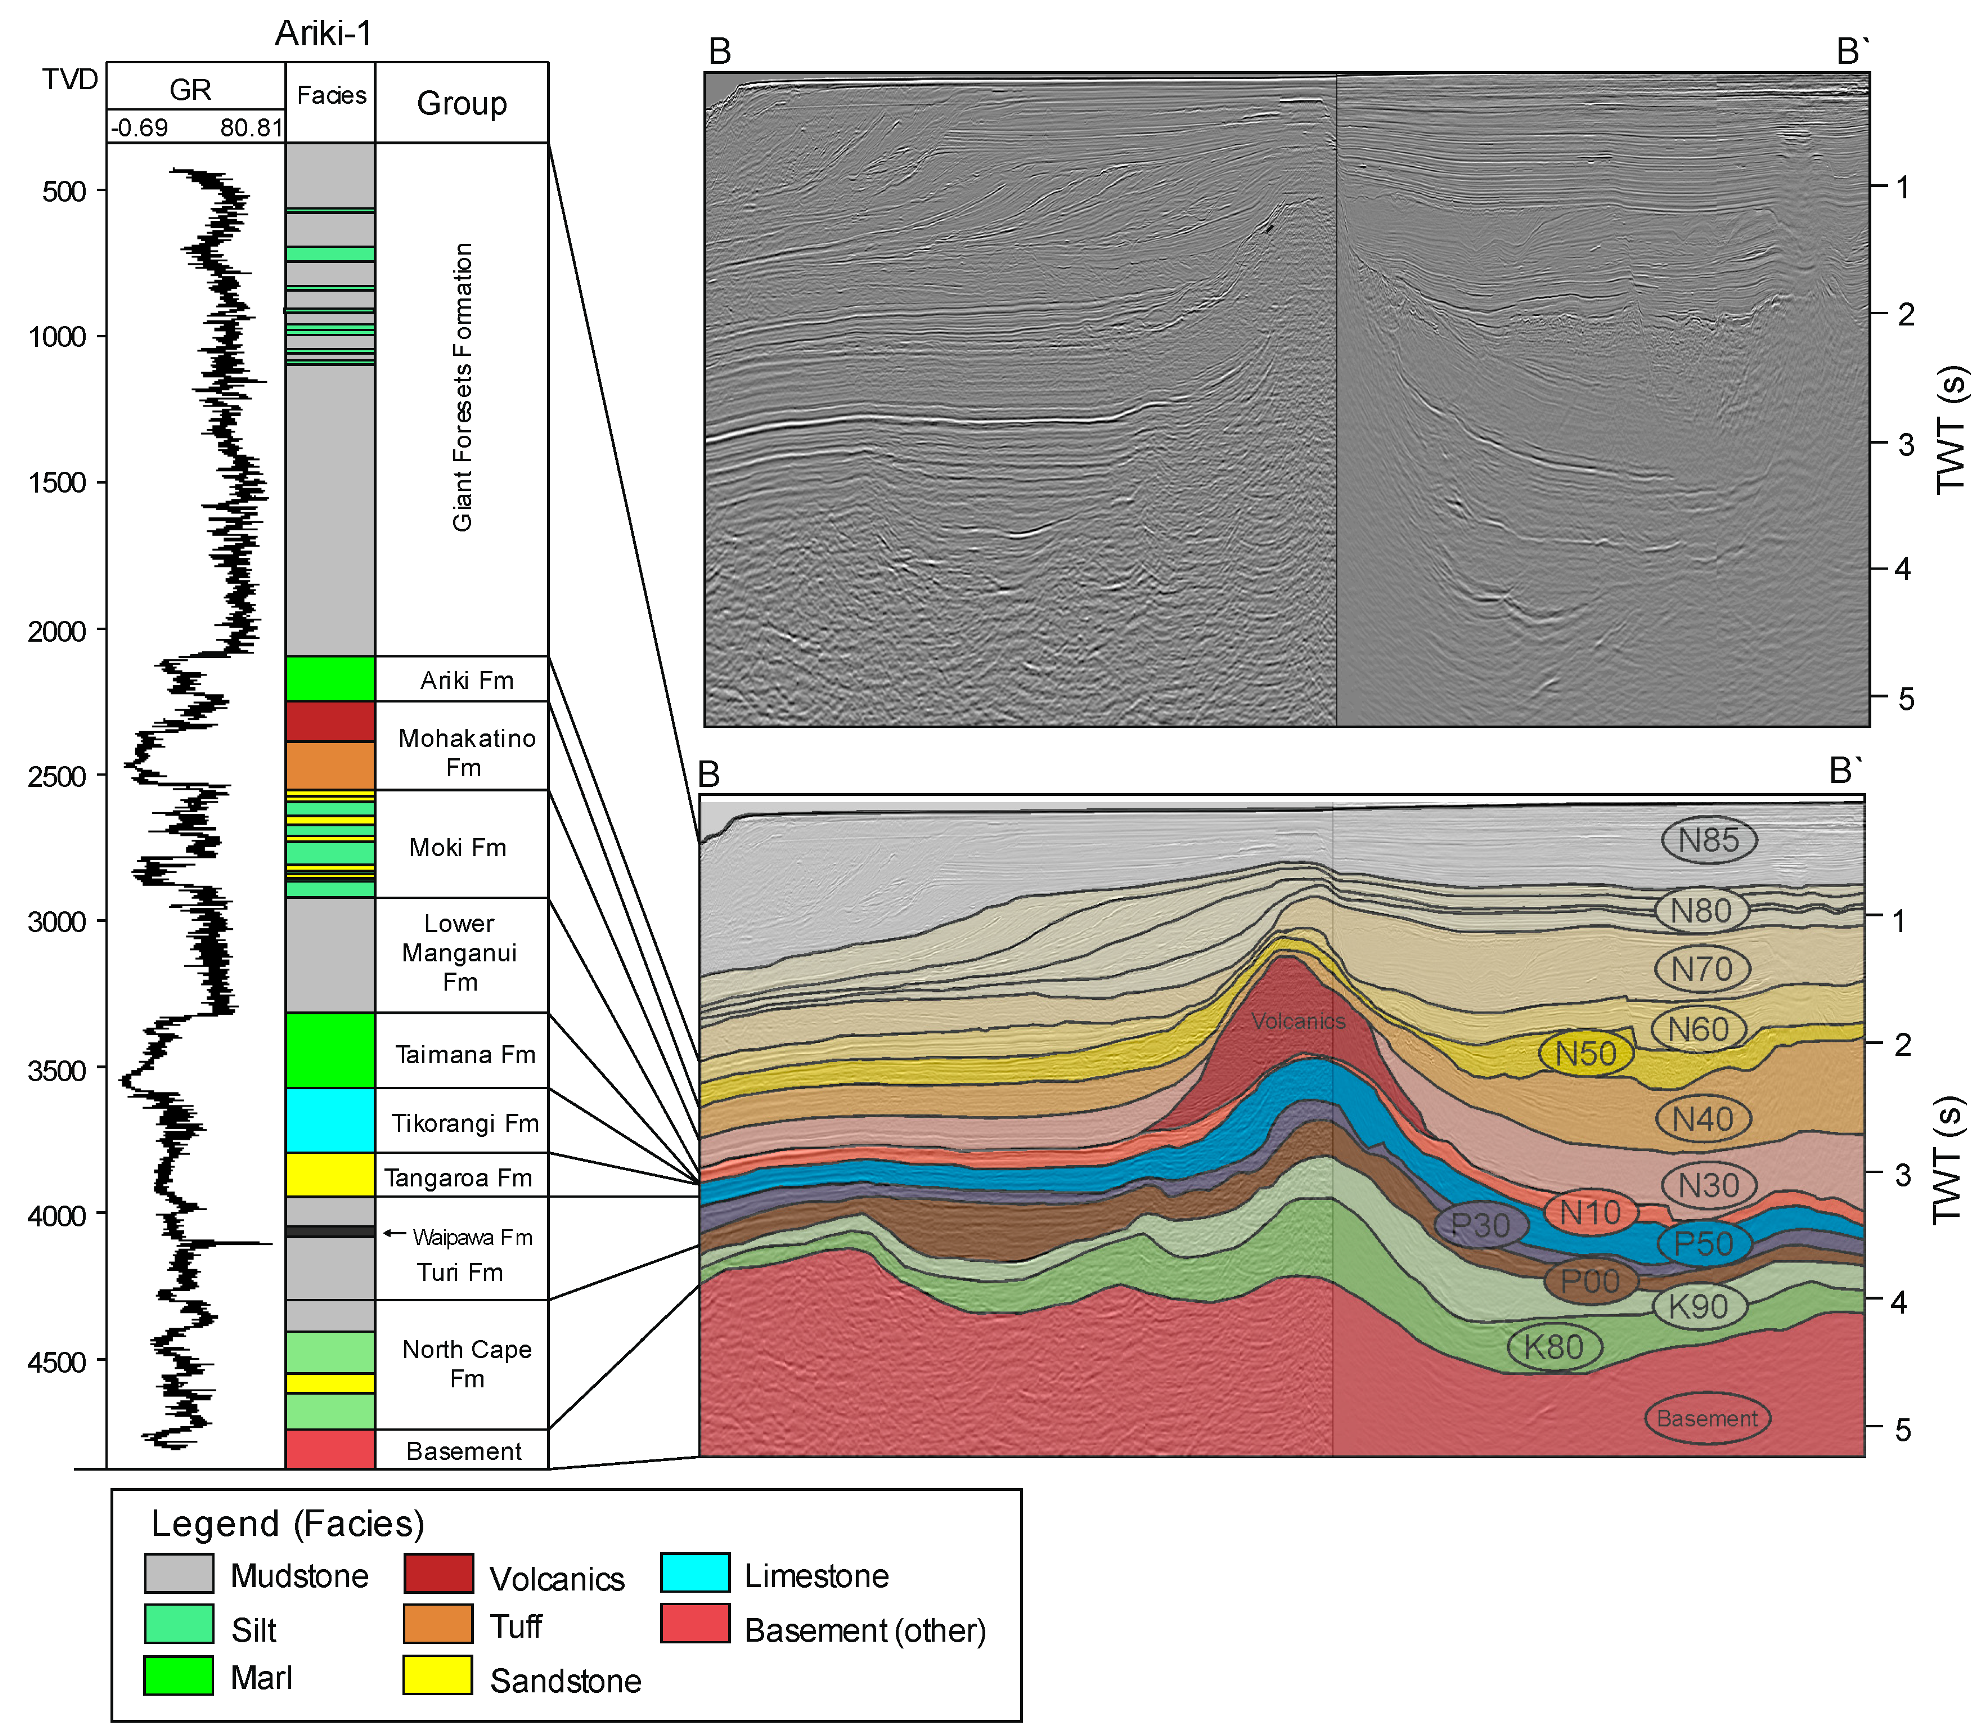
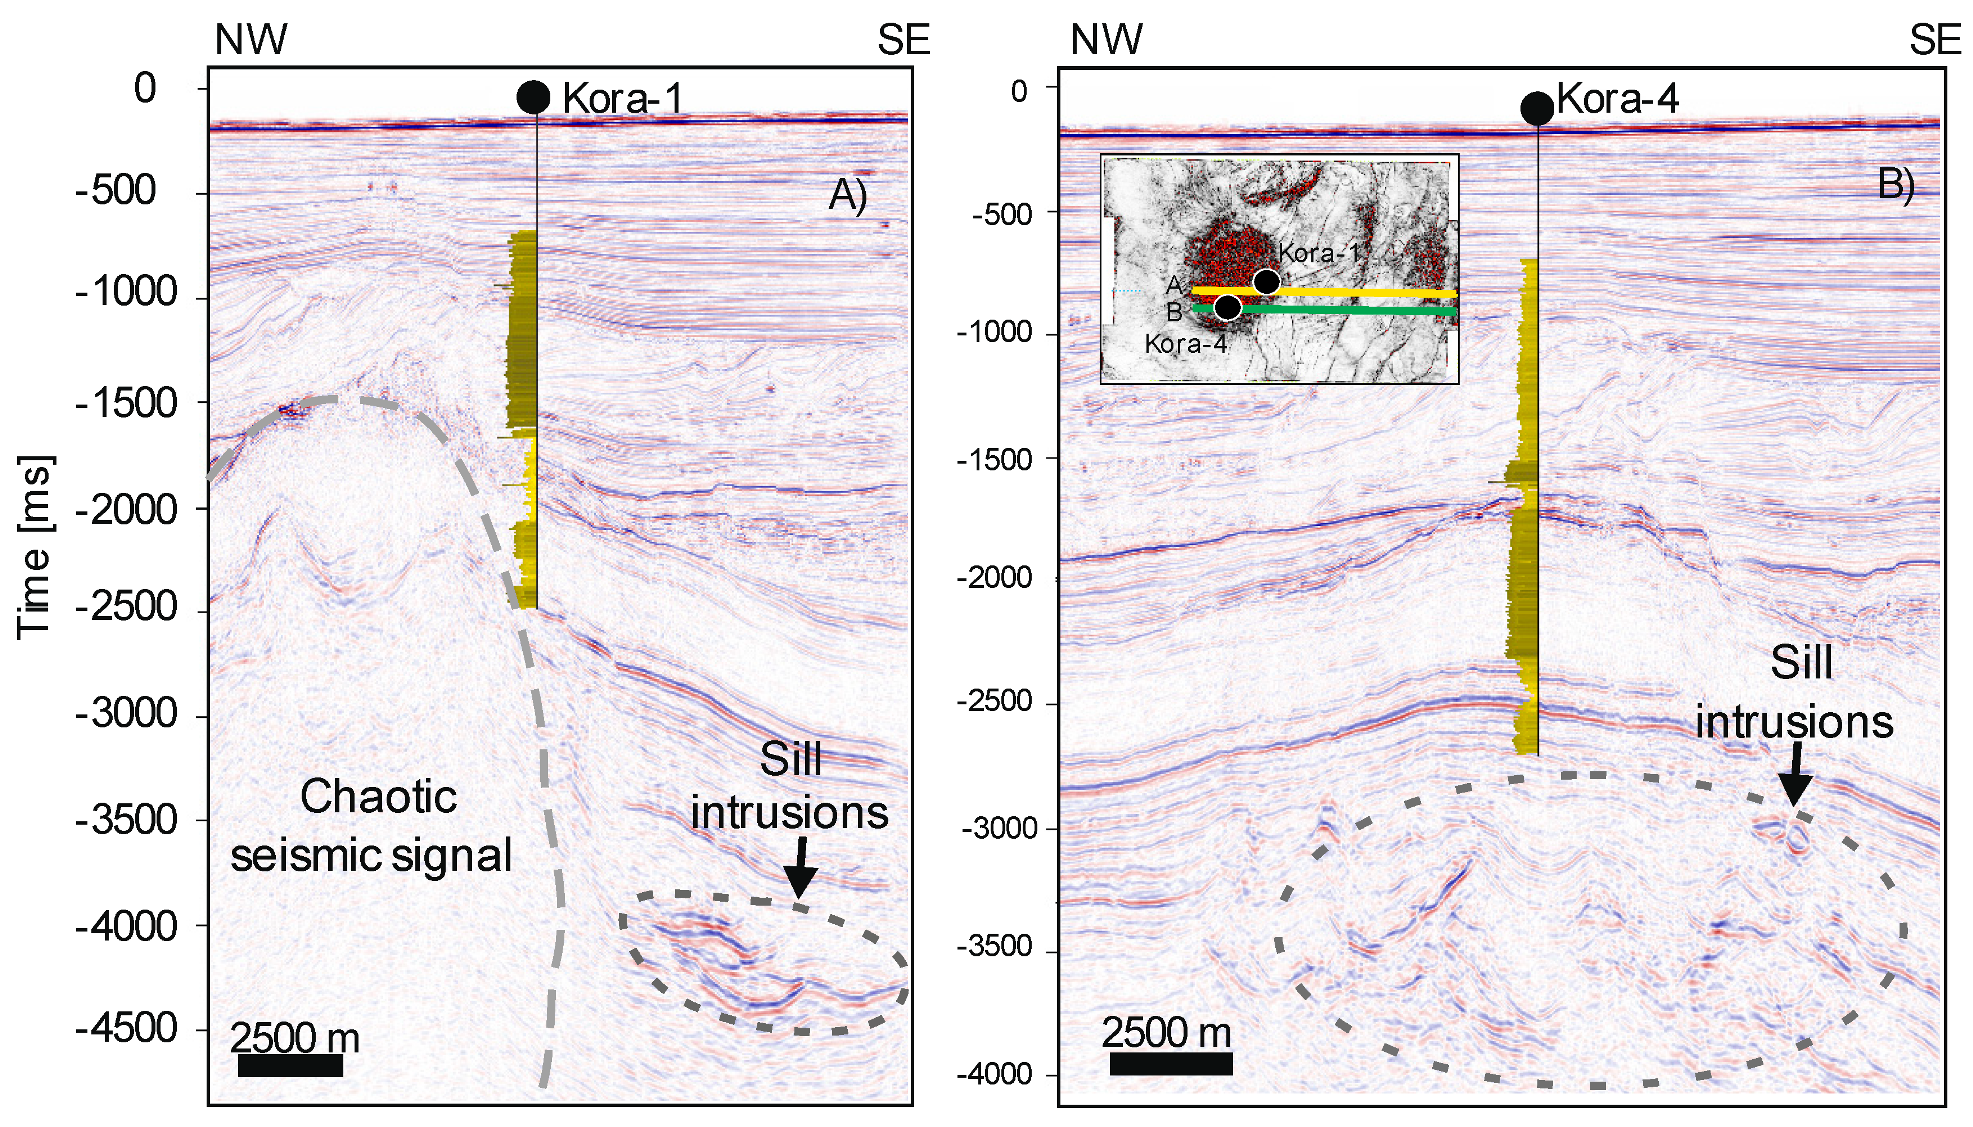
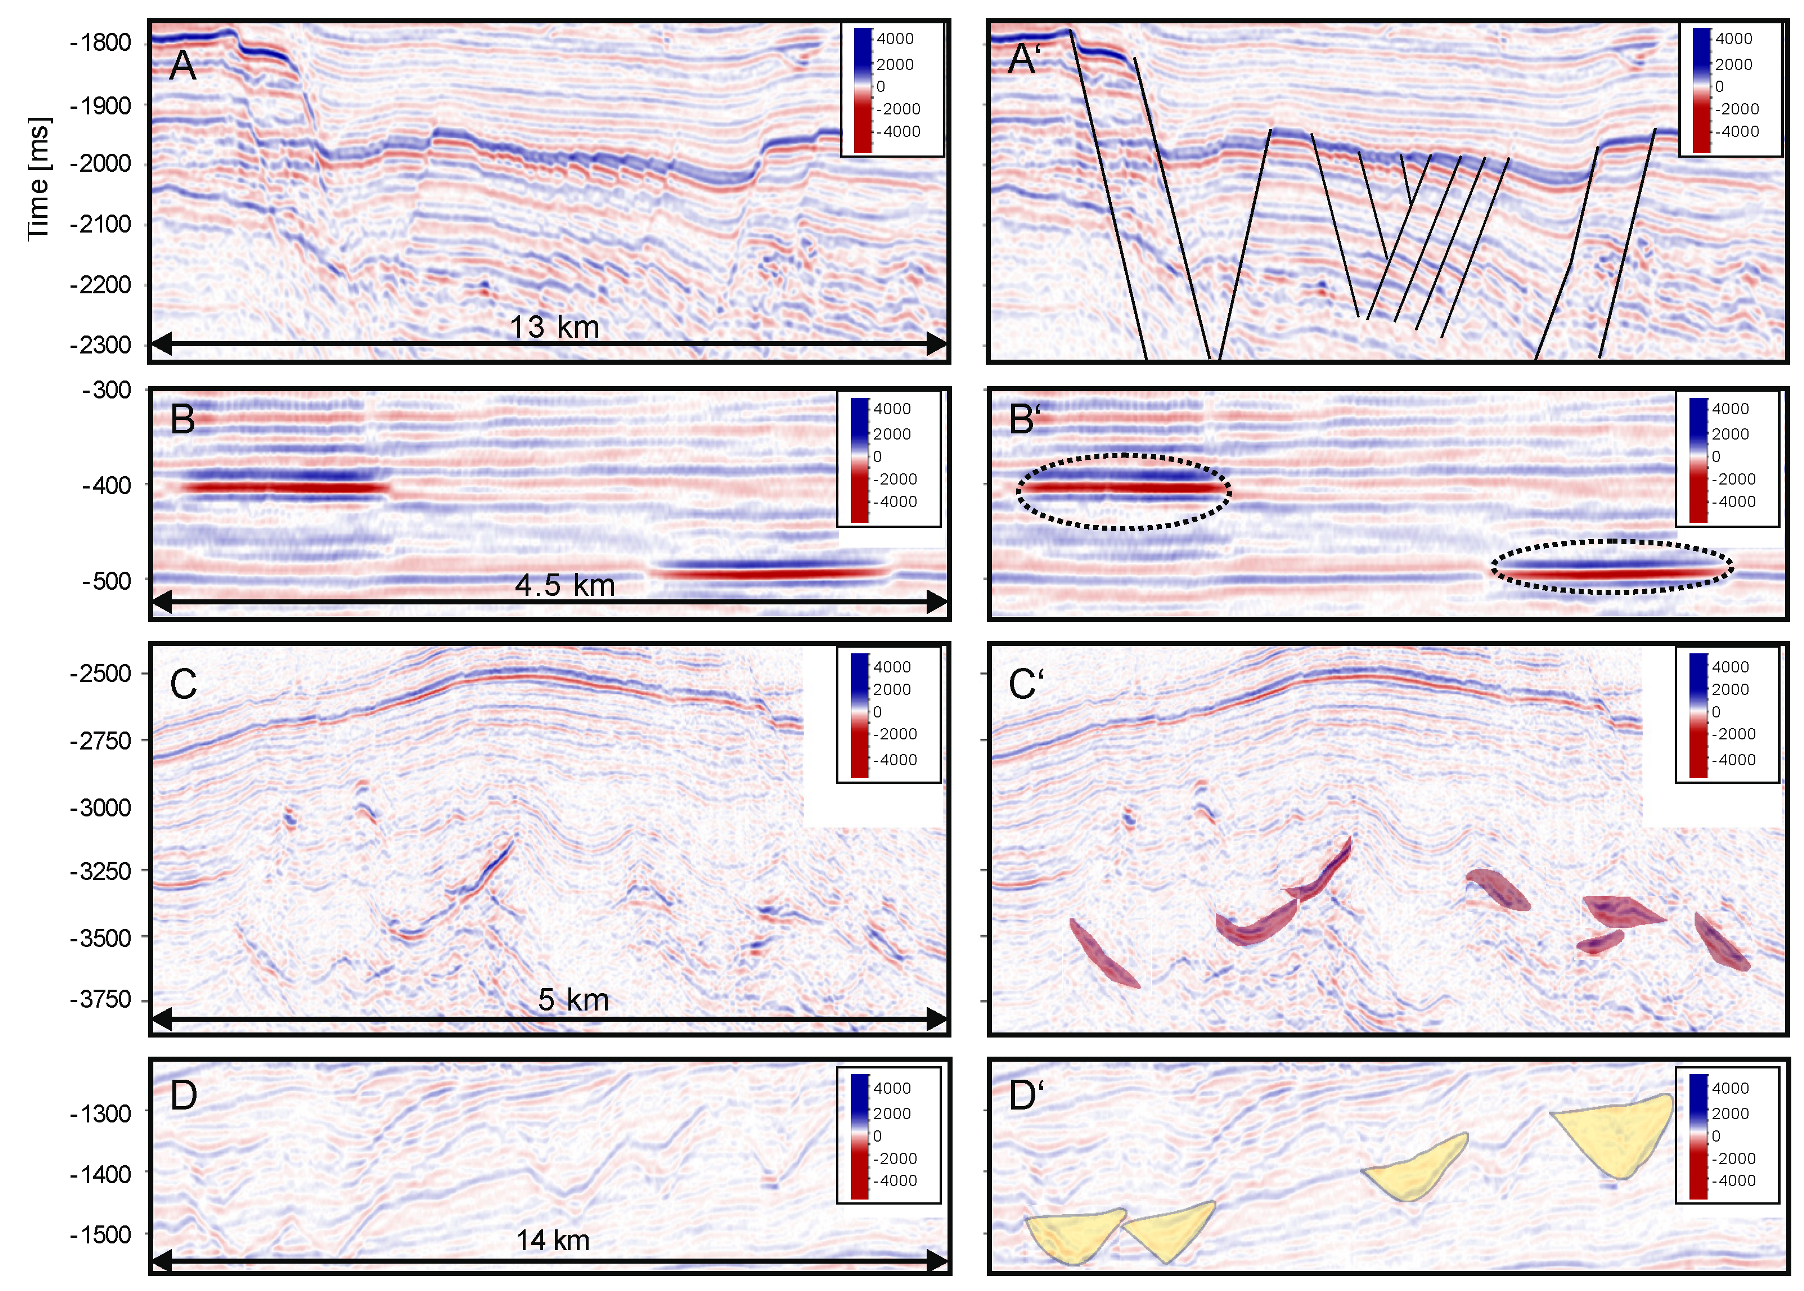
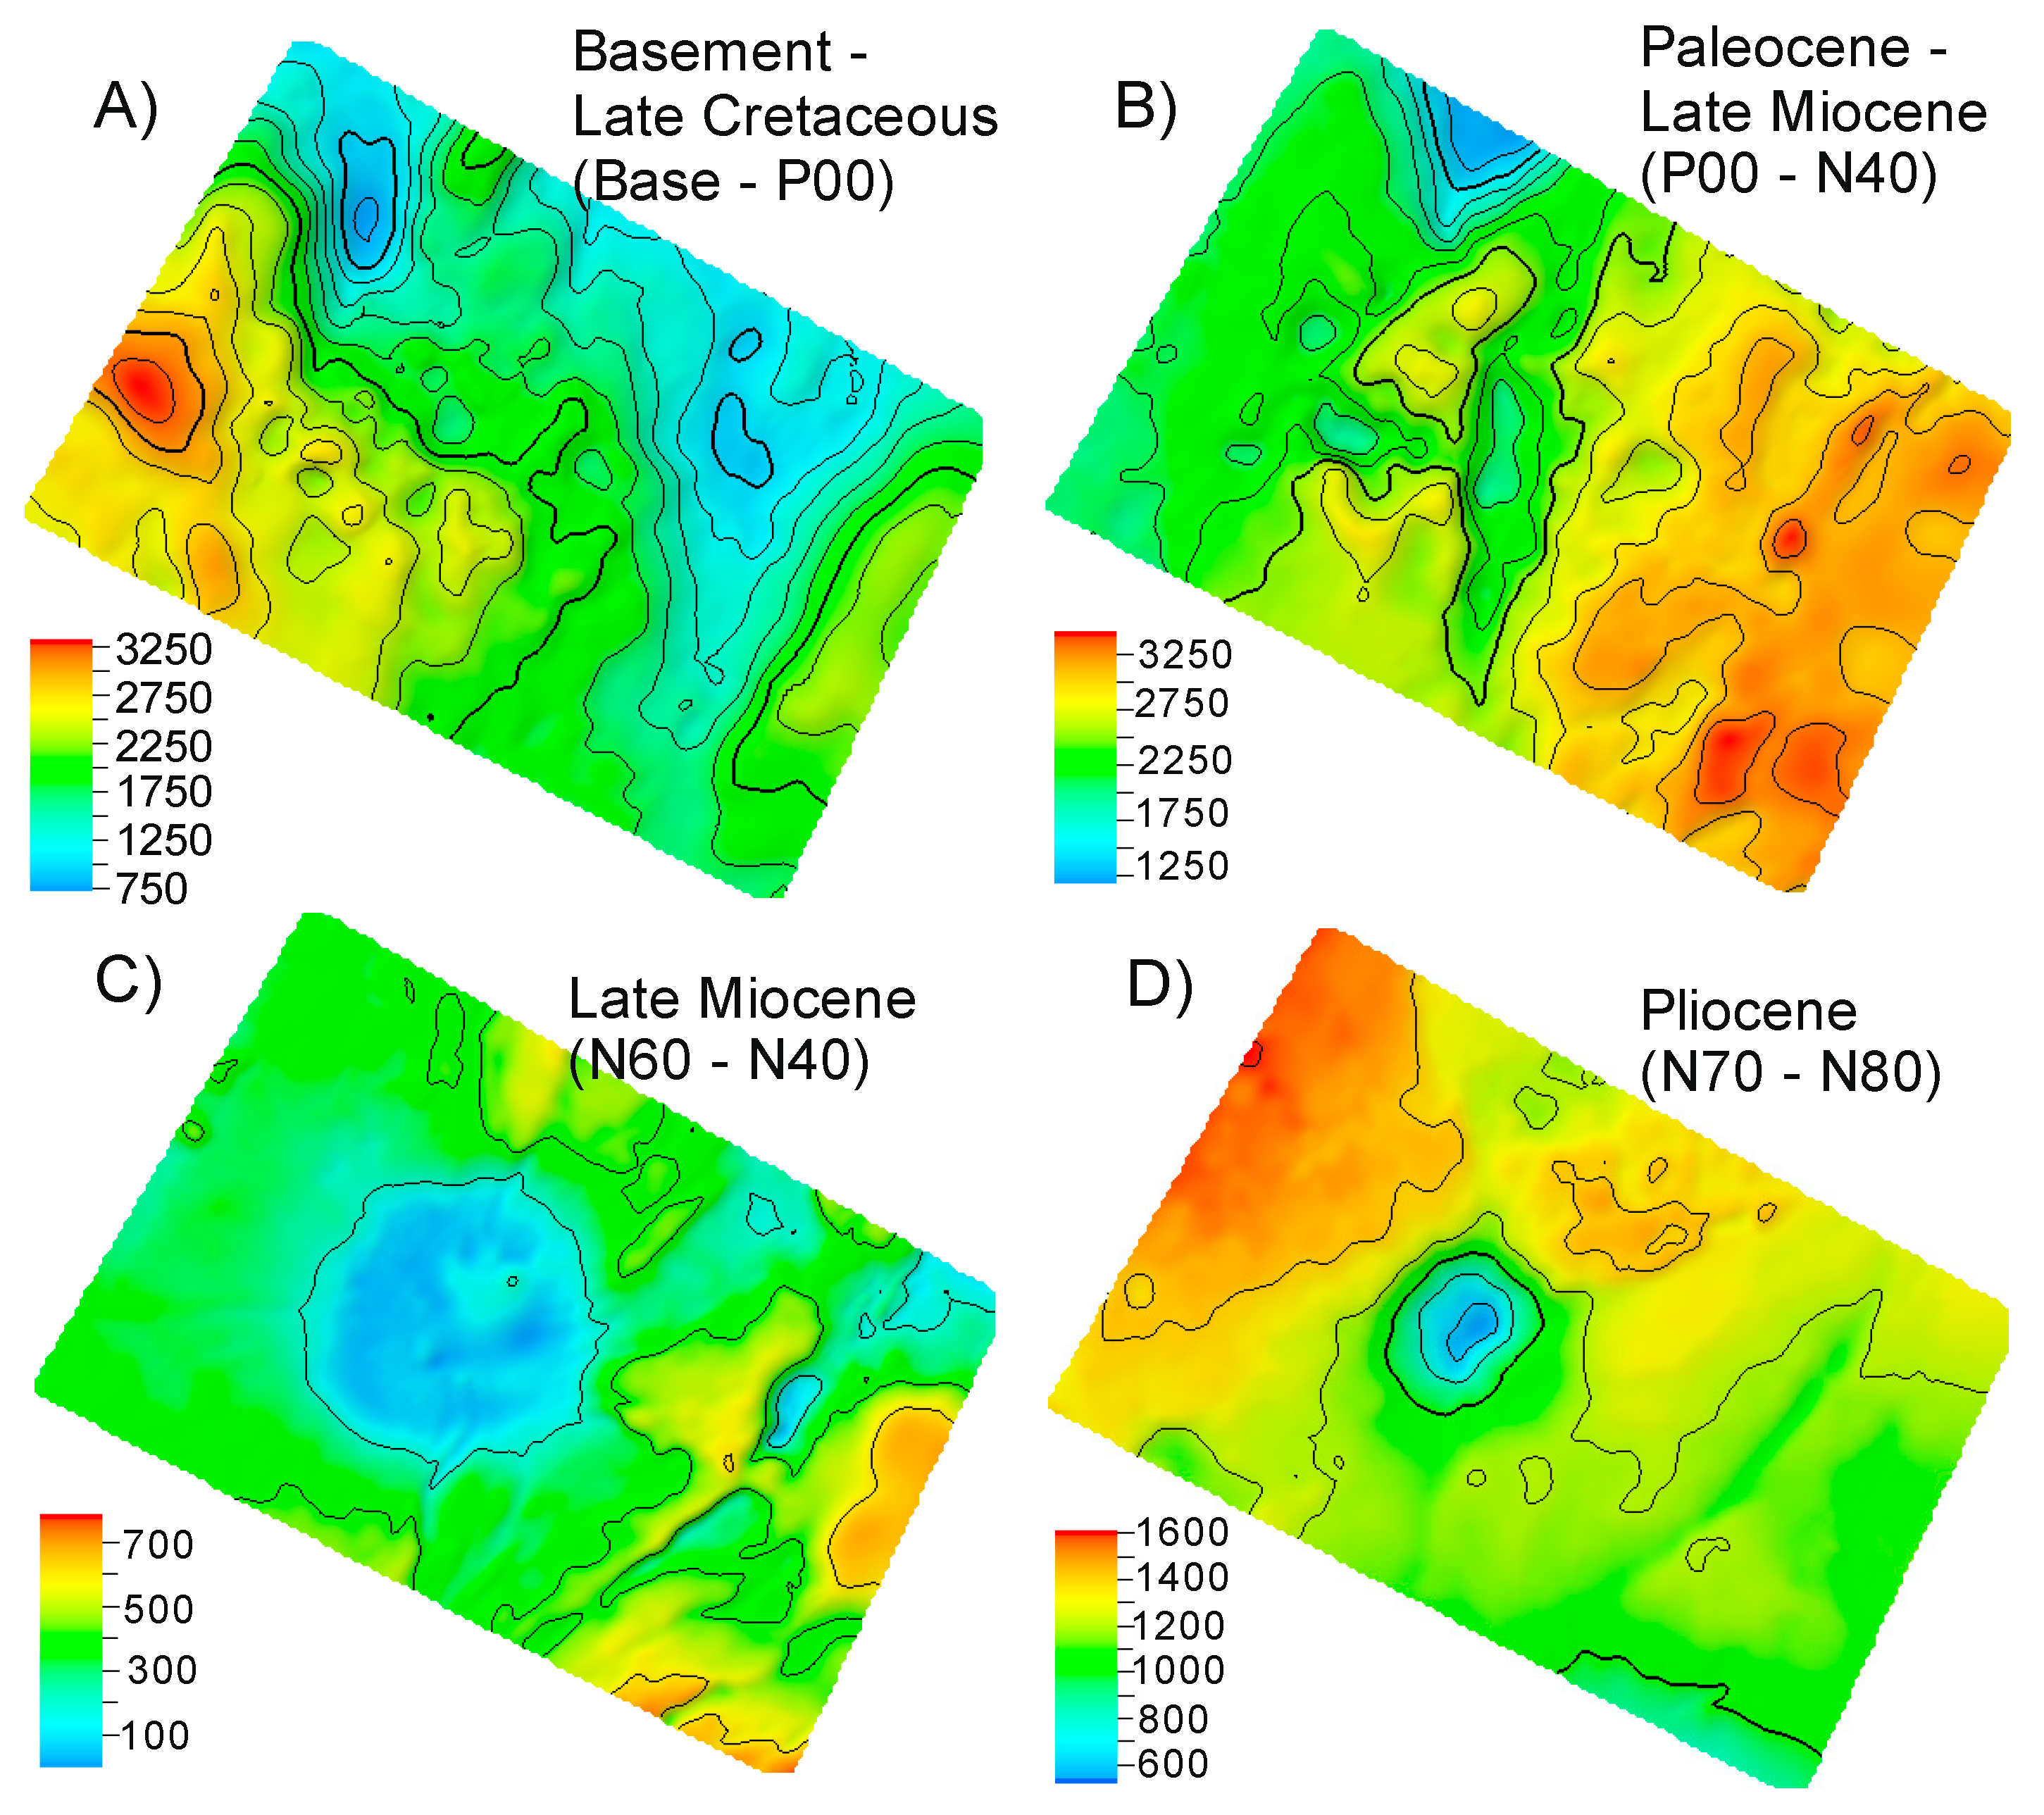
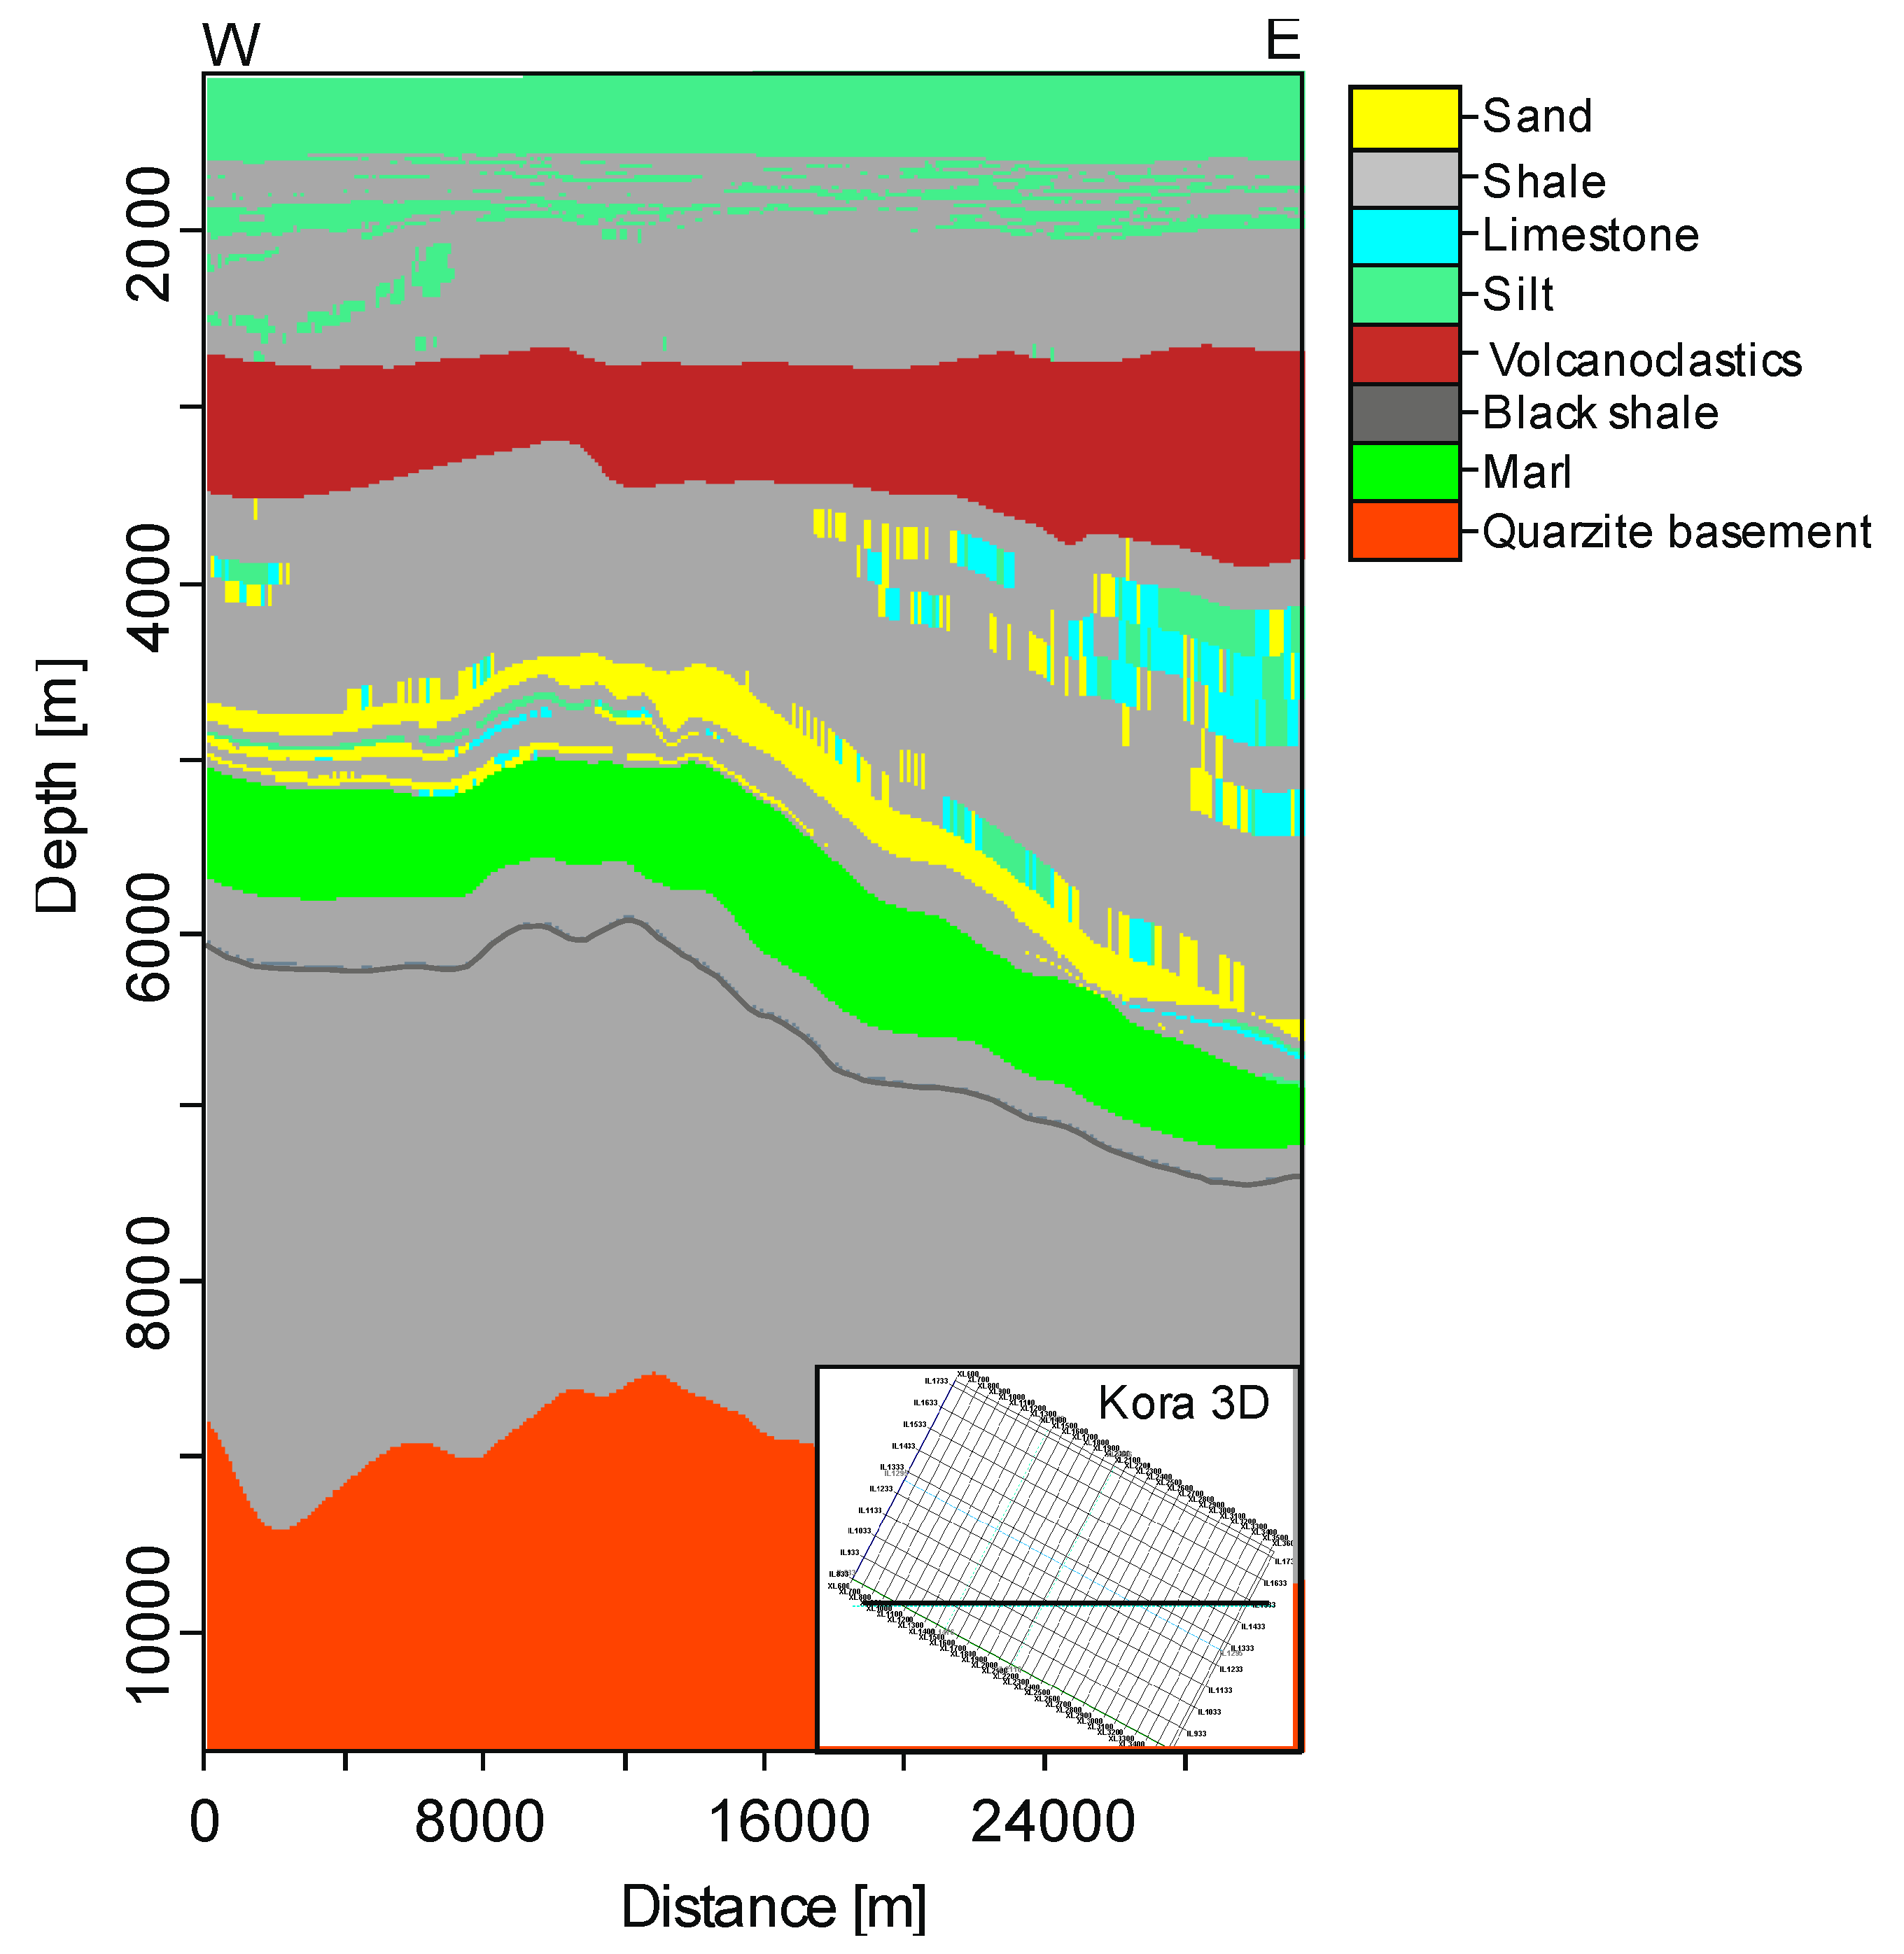
4.1. Seismic Interpretation in Kora 3D

Eighteen pre-, syn- and post- volcanic sequences were identified and mapped around the buried Kora volcano-sedimentary edifice in the offshore northern Taranaki Basin. These interpreted horizons were used as an input data for the 3D model. Out of eighteen interpreted horizons, thirteen represent key stratigraphic unit boundaries and six are interpreted within the Pliocene to recent progradational system of the Giant Foresets Formation (Figure 3). Interpreted seismic horizons above Cretaceous and older basement (acoustic basement), are the Late Cretaceous (horizons K80 and K90), Cretaceous-Paleogene (horizons P00–P50), Paleocene-Eocene (horizon P10), Eocene (horizon P30), Eocene-Oligocene (horizon P50), Early Miocene (horizon N10), Middle to Late Miocene (horizon N40), Base Pliocene (horizon N60), Pliocene (horizons N70–N80), Top Giant Foresets (Pliocene) and the modern seafloor (Figure 2 and Figure 3). Interpretation of the tops of the seismo-stratigraphic units and the naming of geologic units are based on Bull et al. [50] and Strogen and King, [48]. The seismic data show no evidence of major erosional unconformities in the study region.
Seismic interpretation and attribute analysis revealed several features around the Kora volcano interpreted as (A) faults; (B) gas accumulations; (C) sills; (D) channels (Figure 7). Fault interpretation from two-way travel time 2-D sections and coherency/semblance (edge detect attribute) time slices resulted in the sub-division of the faults into three groups: (i) major faults, which penetrate the complete sedimentary sequence rooting in the Late-Cretaceous basement. Their main trend is NNE-SSW (Figure 1C); (ii) secondary faults of primarily Eocene age (Figure 7A); (iii) radial faults around the volcanic body (Figure 1B). These radial faults surrounding the volcanic edifice are the result of cooling and collapse episodes that are typical for volcanic bodies [13,51]. Some of them are connected to the faults of the Northern Graben SE of the volcano (Figure 1C) and have a higher offset.
Several seismic high amplitude zones were identified in the seismic data. High amplitudes located in the Giant Foresets Formation and in the shallow section directly above the volcanic edifice are interpreted to be related to gas-charged sediments (Figure 7B). These are likely associated with biogenic gas generation or volcanic gases [13]. In the Paleocene and Eocene intervals, strong reflections occur in the vicinity of the Kora volcano-sedimentary edifice. These reflectors are interpreted as sill intrusions (“saucer sills”) (Figure 7C) and were also described by Bischof et al. [12] and Infante-Paez and Marfurt [13]. They differ in amplitude strength from shallower arcuate reflections that represent incised channels (Figure 7D).

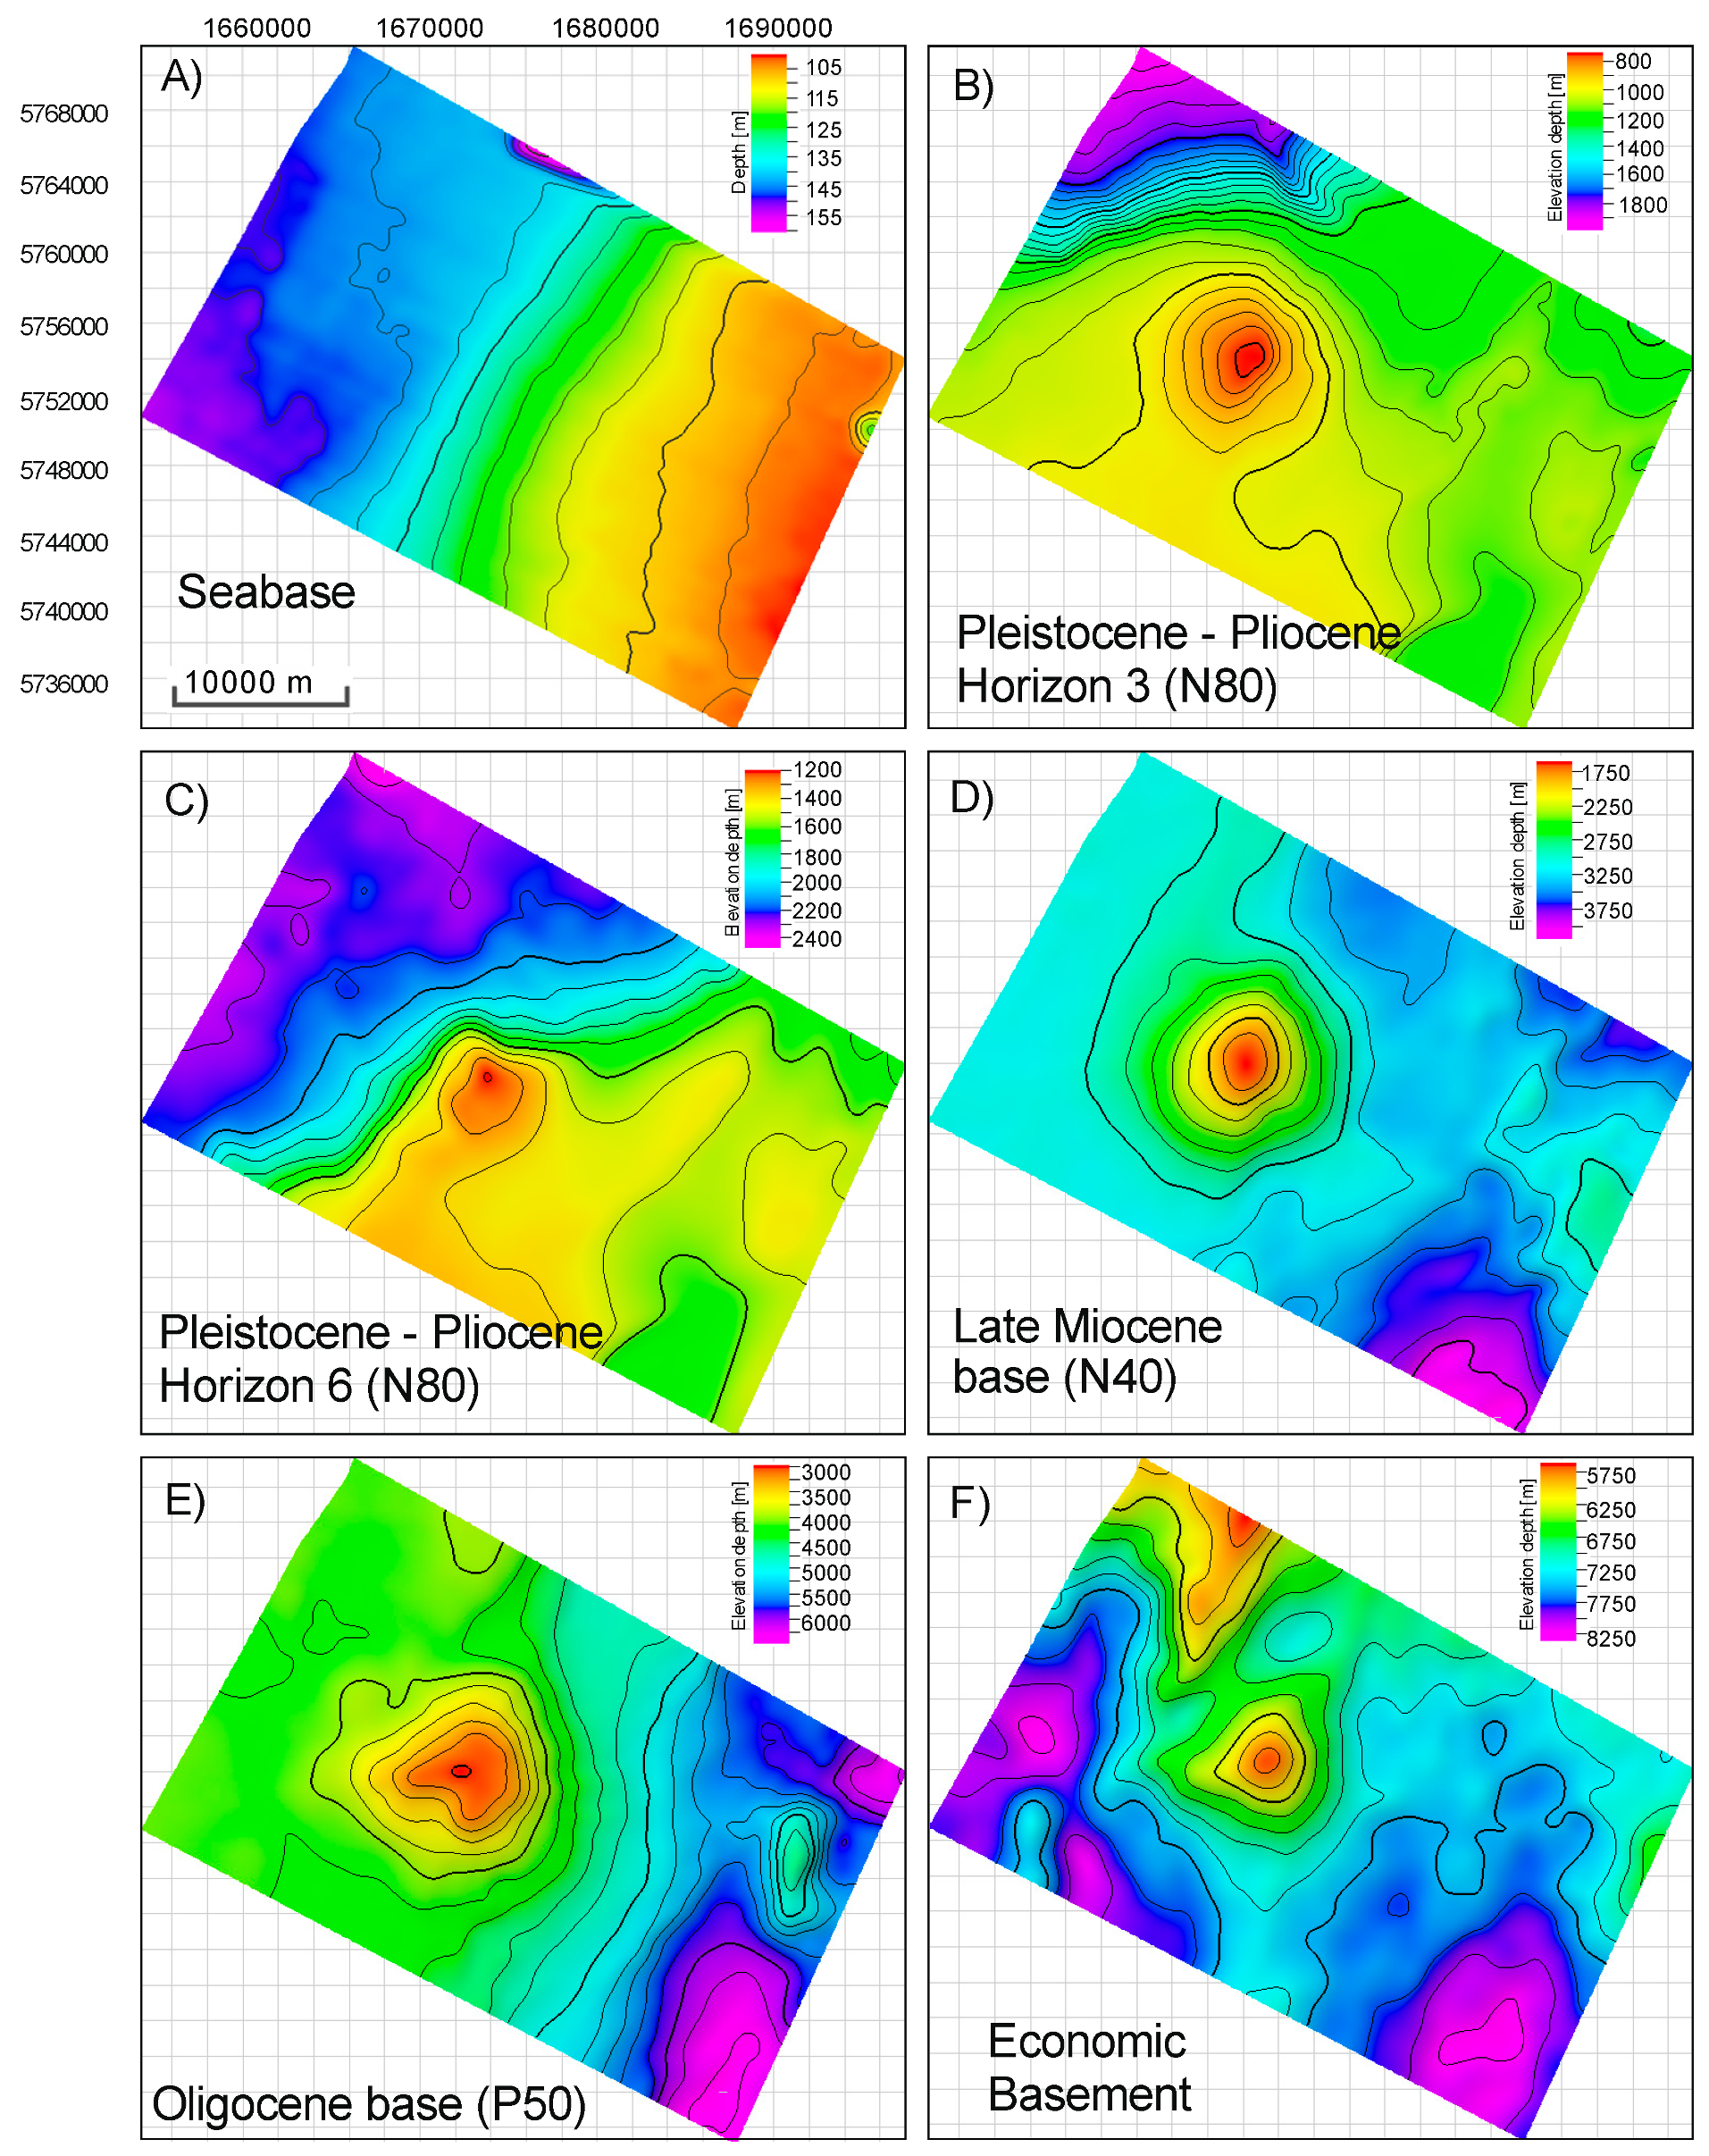
4.2. Seismic Horizons

The modern seafloor geometry is relatively smooth, with the slope gently deepening southeast and water depth increasing from 105 to 170 m (Figure 8A).
The horizons representing the Giant Foresets Formation are significant for the understanding of the regional geology, variation in sedimentation rate and burial history. Pliocene horizons (N80 and N70) follow continuous positive reflectors. The reflection trend indicates that the sedimentary system prograded from southeast to northwest (Figure 7B,C). The seismic units between the reflectors are characterized by large sigmoidal clinoforms with channel systems on the foresets.
The base Pliocene (N60) reflection is less continuous and in places displaced by normal faults and graben structures. These structures are typical for the region and can be attributed to the Late Miocene extension phase when the Northern Graben evolved.
Reflector N40 indicates the Middle to Late Miocene boundary (Figure 8D). The unit between N40 and N60 representing the Miocene strata shows a partially continuous reflection pattern that becomes weaker toward the southwest of the seismic cube. As in the unit above, the reflectors are strongly affected by normal faulting, indicating the deepening of the Northern Graben southeast of the Kora volcano.
The Early Miocene (N10) reflector represents the top of the pre-magmatic activity sequence [12]. The unit below the reflector N10 is of continuous thickness of about 100 m. The reflector pattern is subparallel throughout the area. The unit shows less structural deformation in comparison to the units above, but several large faults are crossing the Kora volcano in the north and northwest.
Horizons P50 (Eocene-Oligocene), P30 (Middle Eocene) and P10 (Paleocene-Eocene) were mapped based on the well tops from well Ariki-1. P50 reflector has a strong continuous positive response throughout the study area and shows a strong doming of strata underneath the Miocene volcano sedimentary edifice (Figure 3) that is still present in the depth-converted surface (Figure 8E). The units between these horizons are consistently subparallel and deformed by the major faults of the Northern Graben.
The Waipawa Formation was mapped between horizons P00 and P10. The approximate top Waipawa reflection (P10) corresponds to a negative reflection around well Ariki-1. Although there is no evidence from seismic data that the Waipawa Formation is present underneath the Kora volcano, the fact that it is related to a regional paleooceanographic event suggests a wide distribution in the northern Taranaki Basin [39,40]. The Top Cretaceous reflector P00 is also indicated in the Ariki-1 well (Figure 3) as a SEG normal soft kick. This reflector is difficult to interpret throughout the 3D seismic, due to poor data quality below the Kora volcanics. In the central part of the dataset the Cretaceous horizon was interpolated, as it is crucial for the subsequent modeling to have a continuous surface.
Late Cretaceous unit tops K90 and K80 are represented by positive reflectors. Similar to the top Cretaceous (P00), the signal is partially lost in the deeper parts of the survey and underneath the volcanics. K90 was interpreted in Ariki-1 well; it has a SEG normal soft response. The continuous interpretation of the reflectors was difficult and, as for the Paleocene the top and bottom horizons (P10 and P00), had to be extrapolated underneath the volcanics.
The top acoustic basement is defined at well Ariki-1 as a low to medium amplitude positive reflection. The seismic to well tie from Ariki-1 to the Kora 3D seismic reflection survey correlates the basement along the same reflection loop, and the reflector becomes stronger in the faulted sequence and on basement highs (Figure 8F). The acoustic basement is difficult to detect beneath the volcanic centers.

4.3. Thickness Variations

The Late Cretaceous syn-rift sequence discordantly overlays the faulted basement and fills the syn-rift structures. The thickness of this unit is dependent on the original basement topography and the characteristics and distribution the faults. The largest thicknesses are 3315 m east of Kora volcano and gradually decreases to the west where it reaches its minimum of about 740 m (Figure 9A).
The Paleocene to late Miocene (P00–N40) post-rift units show less thickness variation in comparison to the Late Cretaceous. In the south-eastern edge of the study area, it shows a maximum thickness of 3950 m thinning to the north-western part (2700 m; Figure 9B).
A prominent change in sediment thickness can be observed related to Late Miocene foreland basin evolution, where the sediment distribution was dramatically affected by volcano topography. The unit is thinning from about 400 to 0 m at the volcano center (Figure 9C).
The progradational sequence evolved in the area during Pliocene time (N70–N80) and reaches its maximum thickness of 1560 m in the SSE, but it is only 880 m thick in the SSE (Figure 9D).

5. Results and Discussion

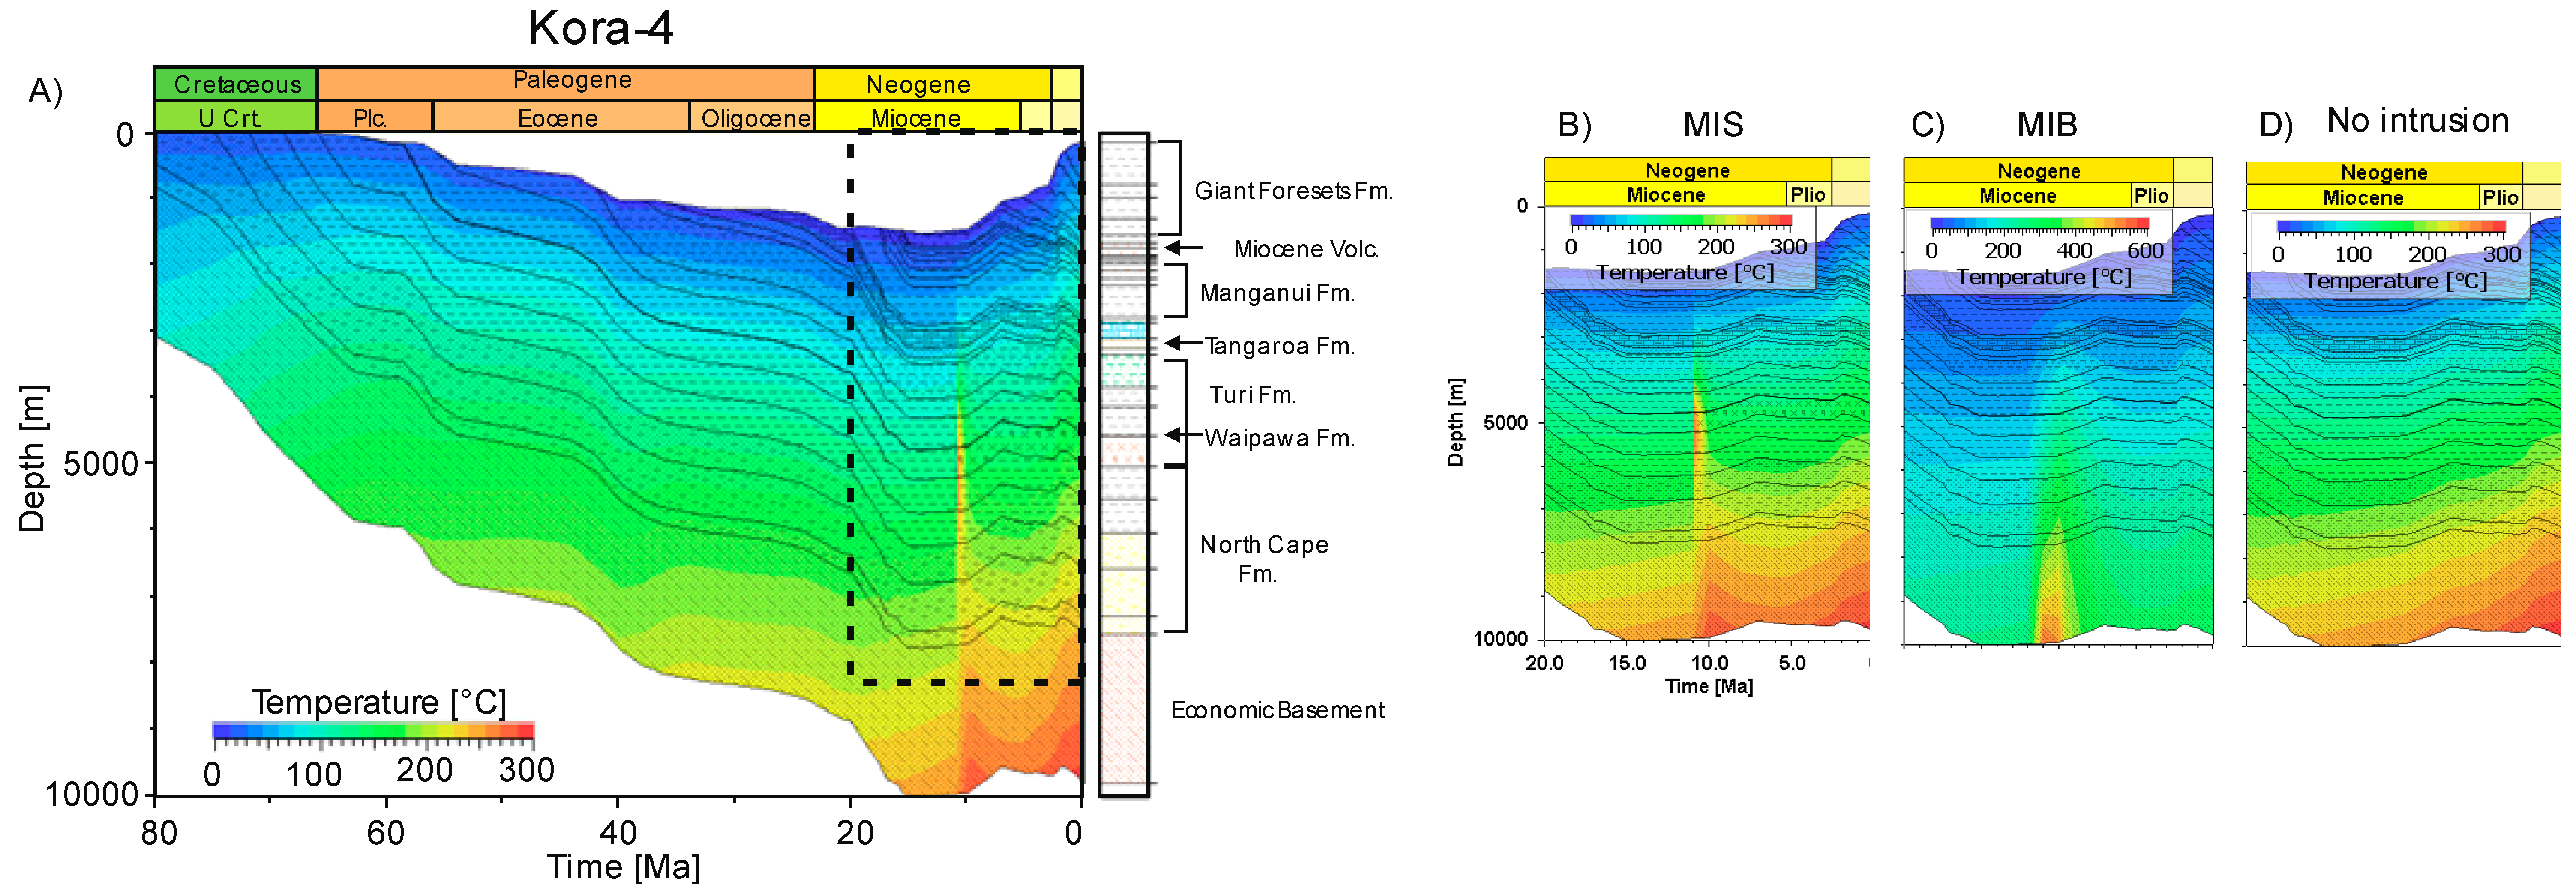
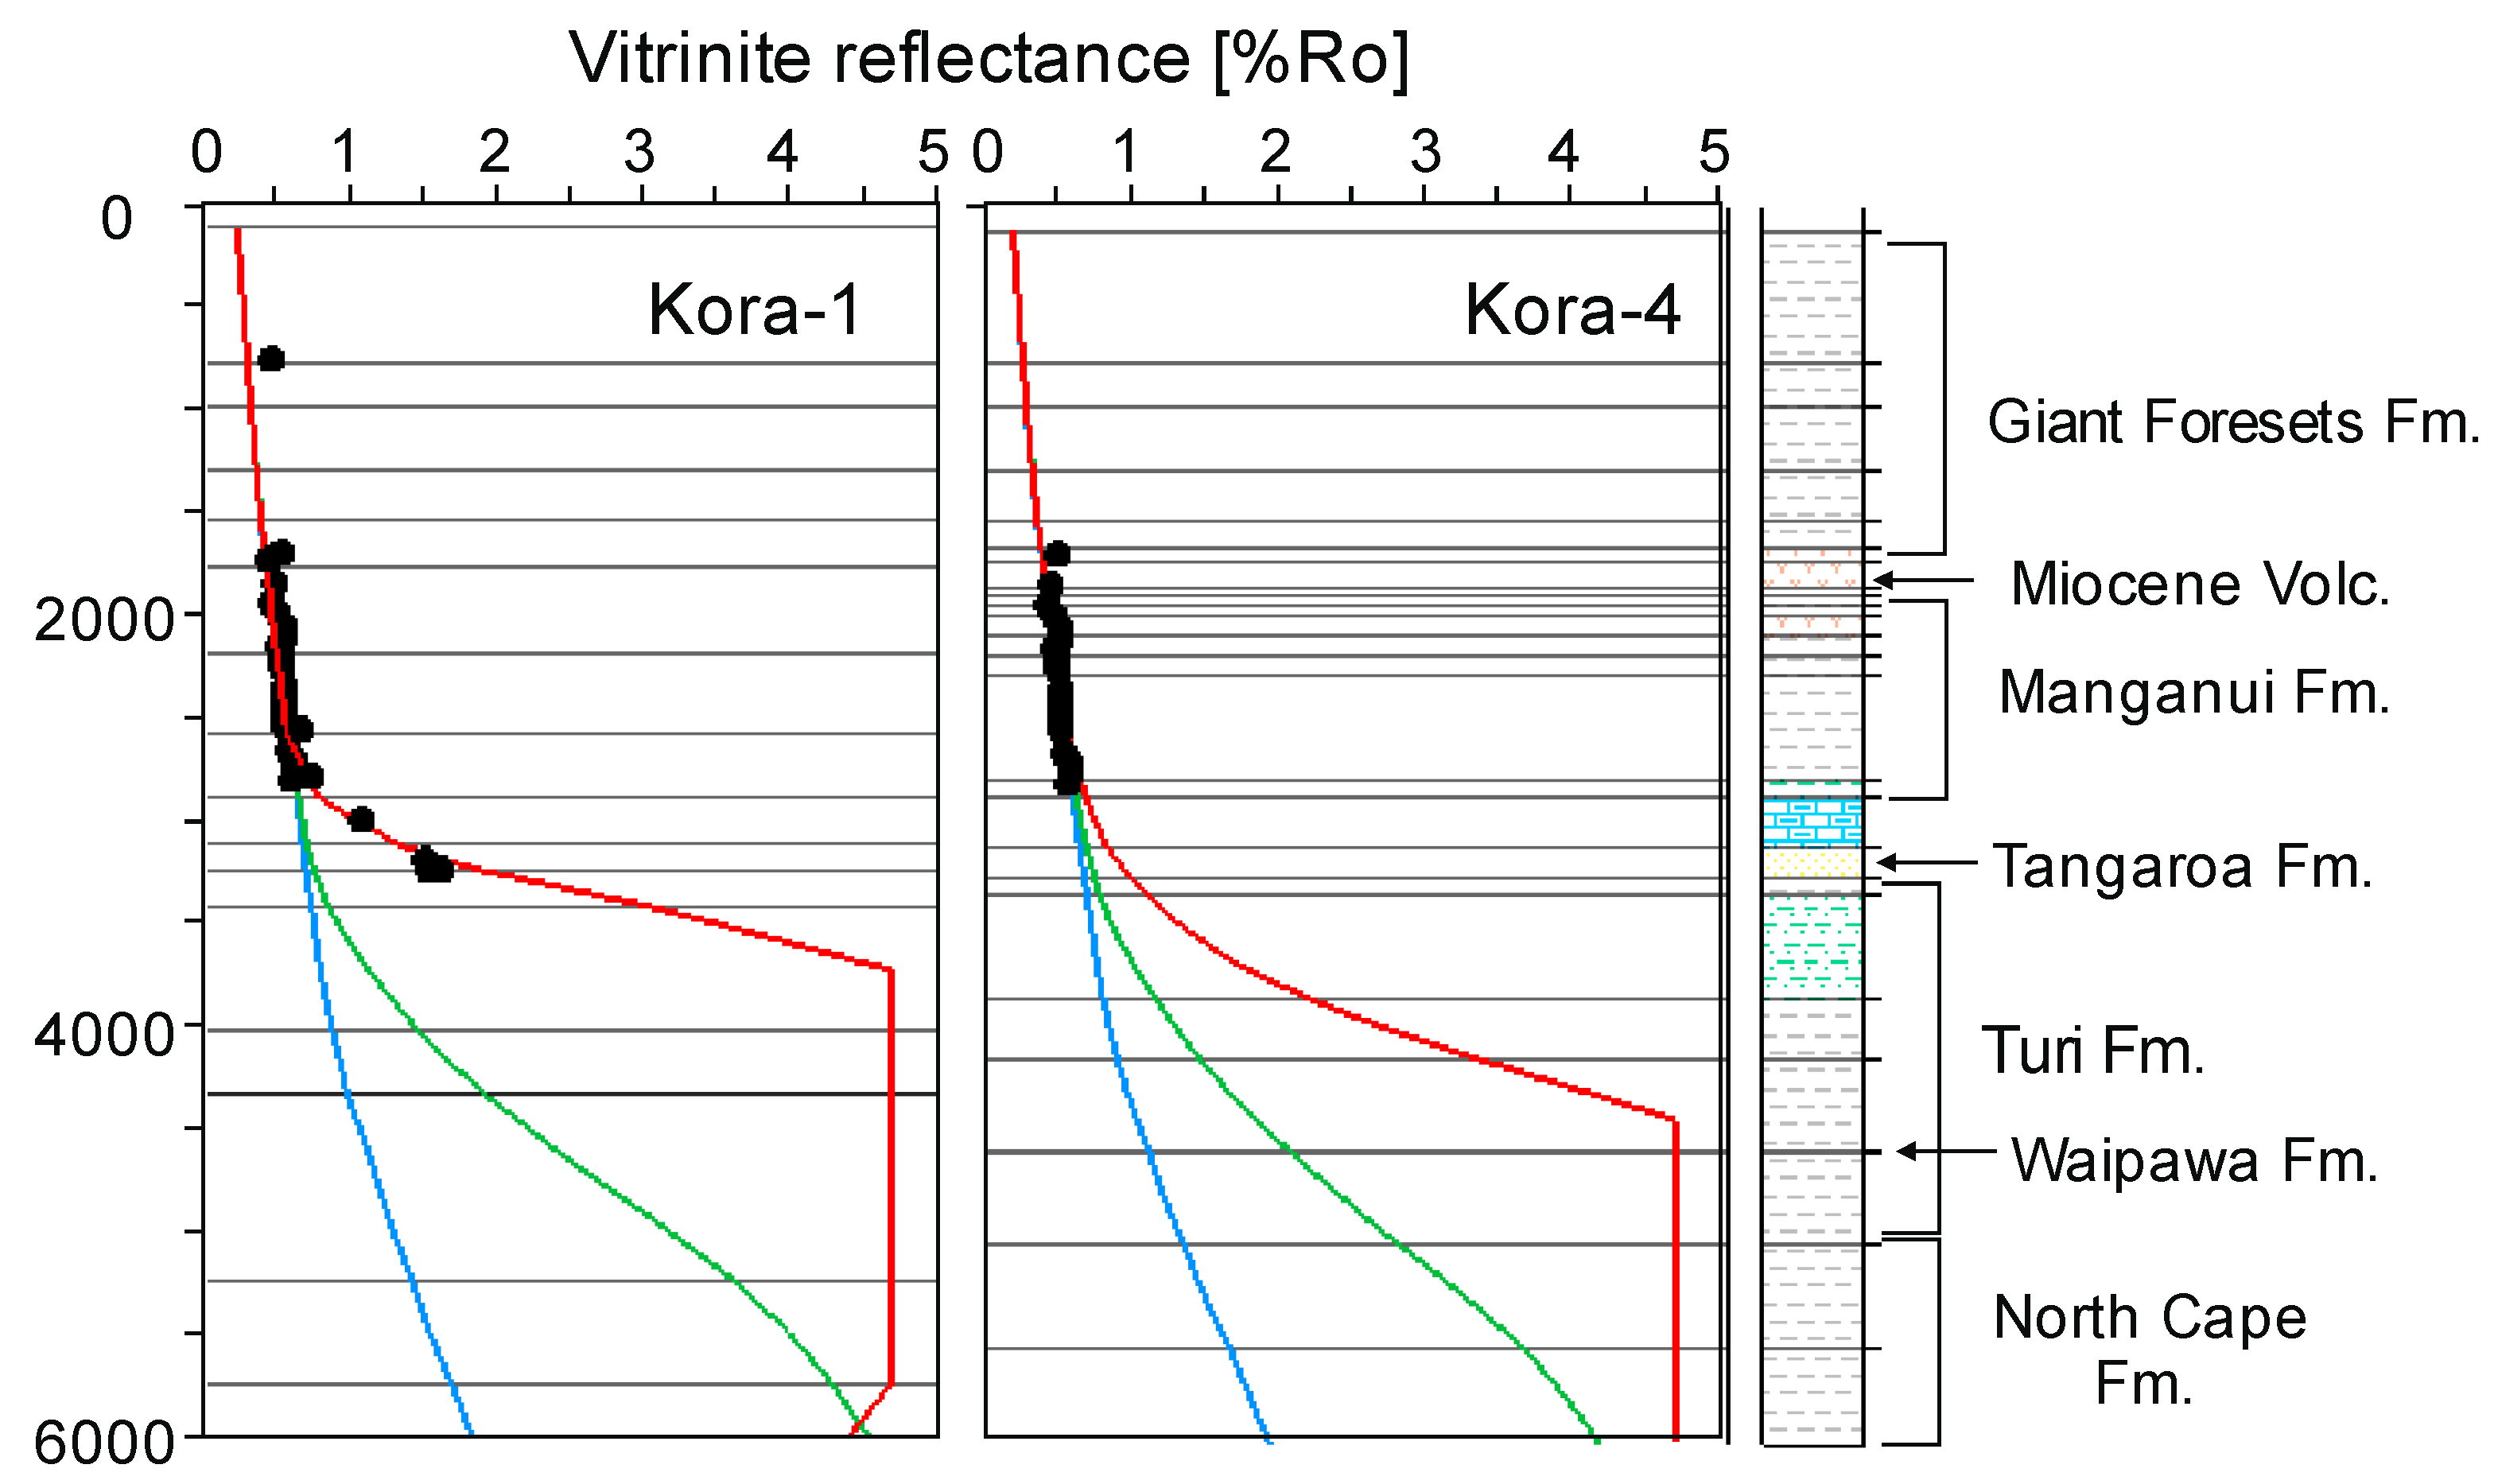
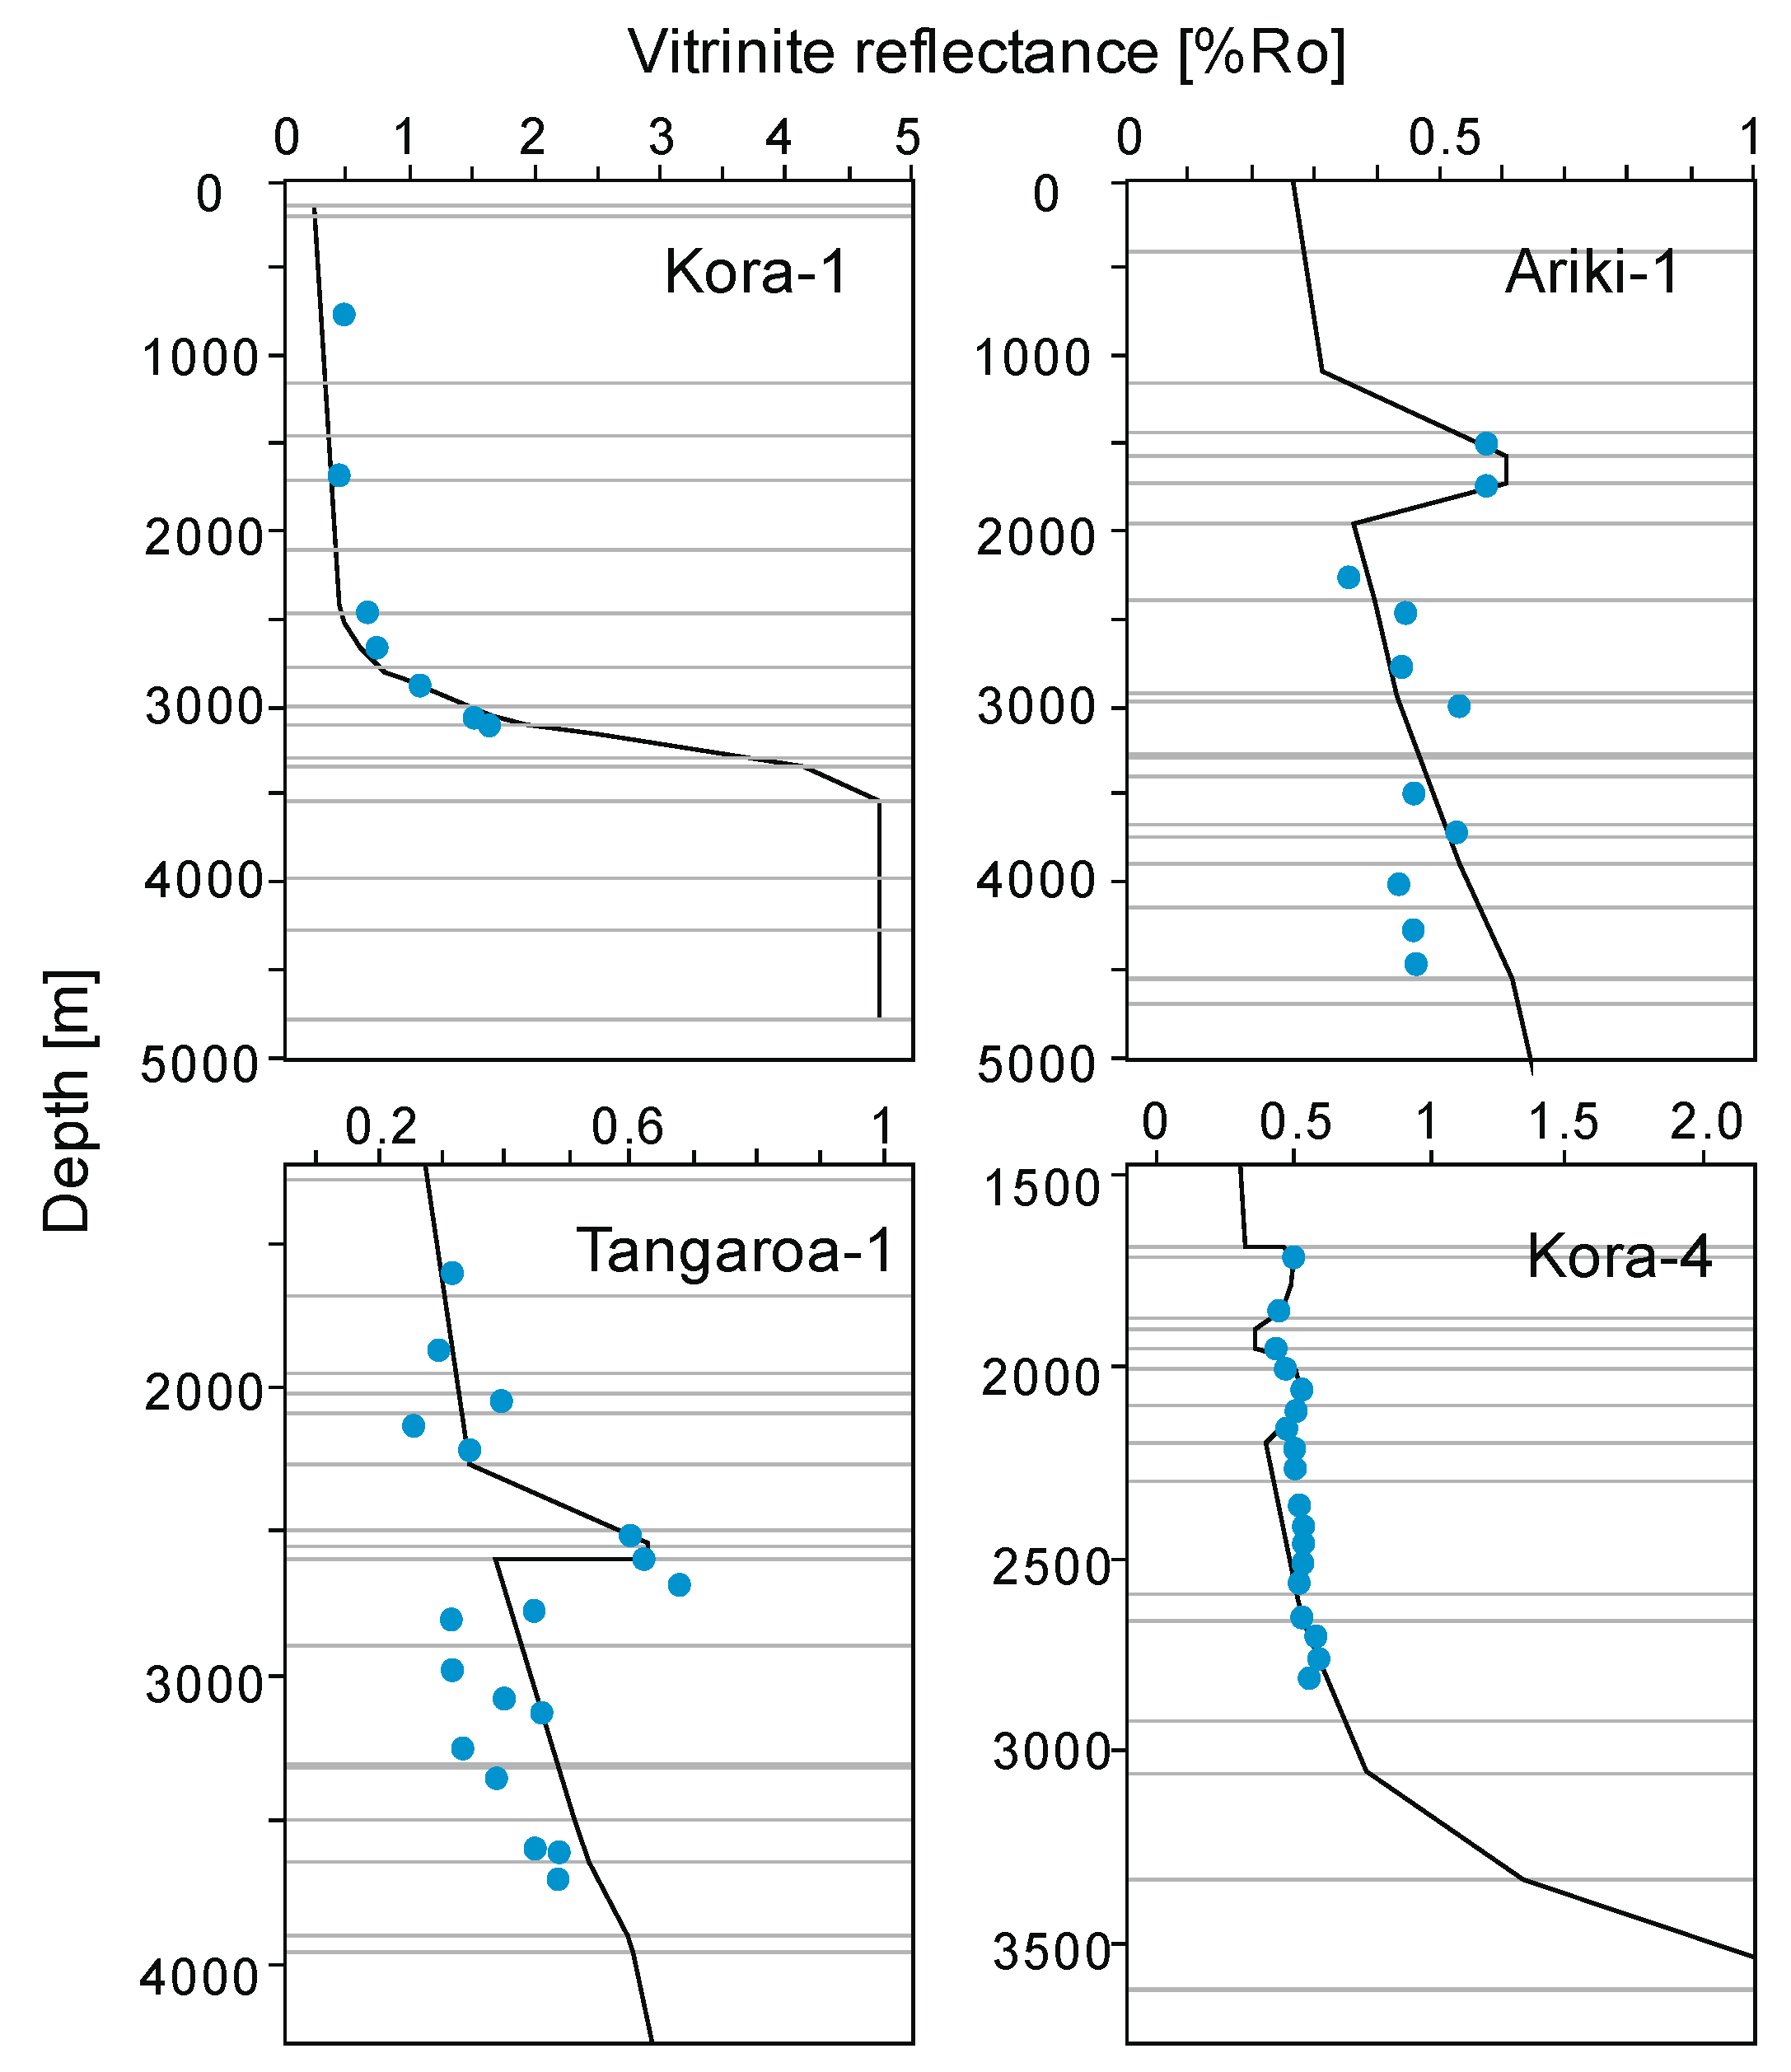
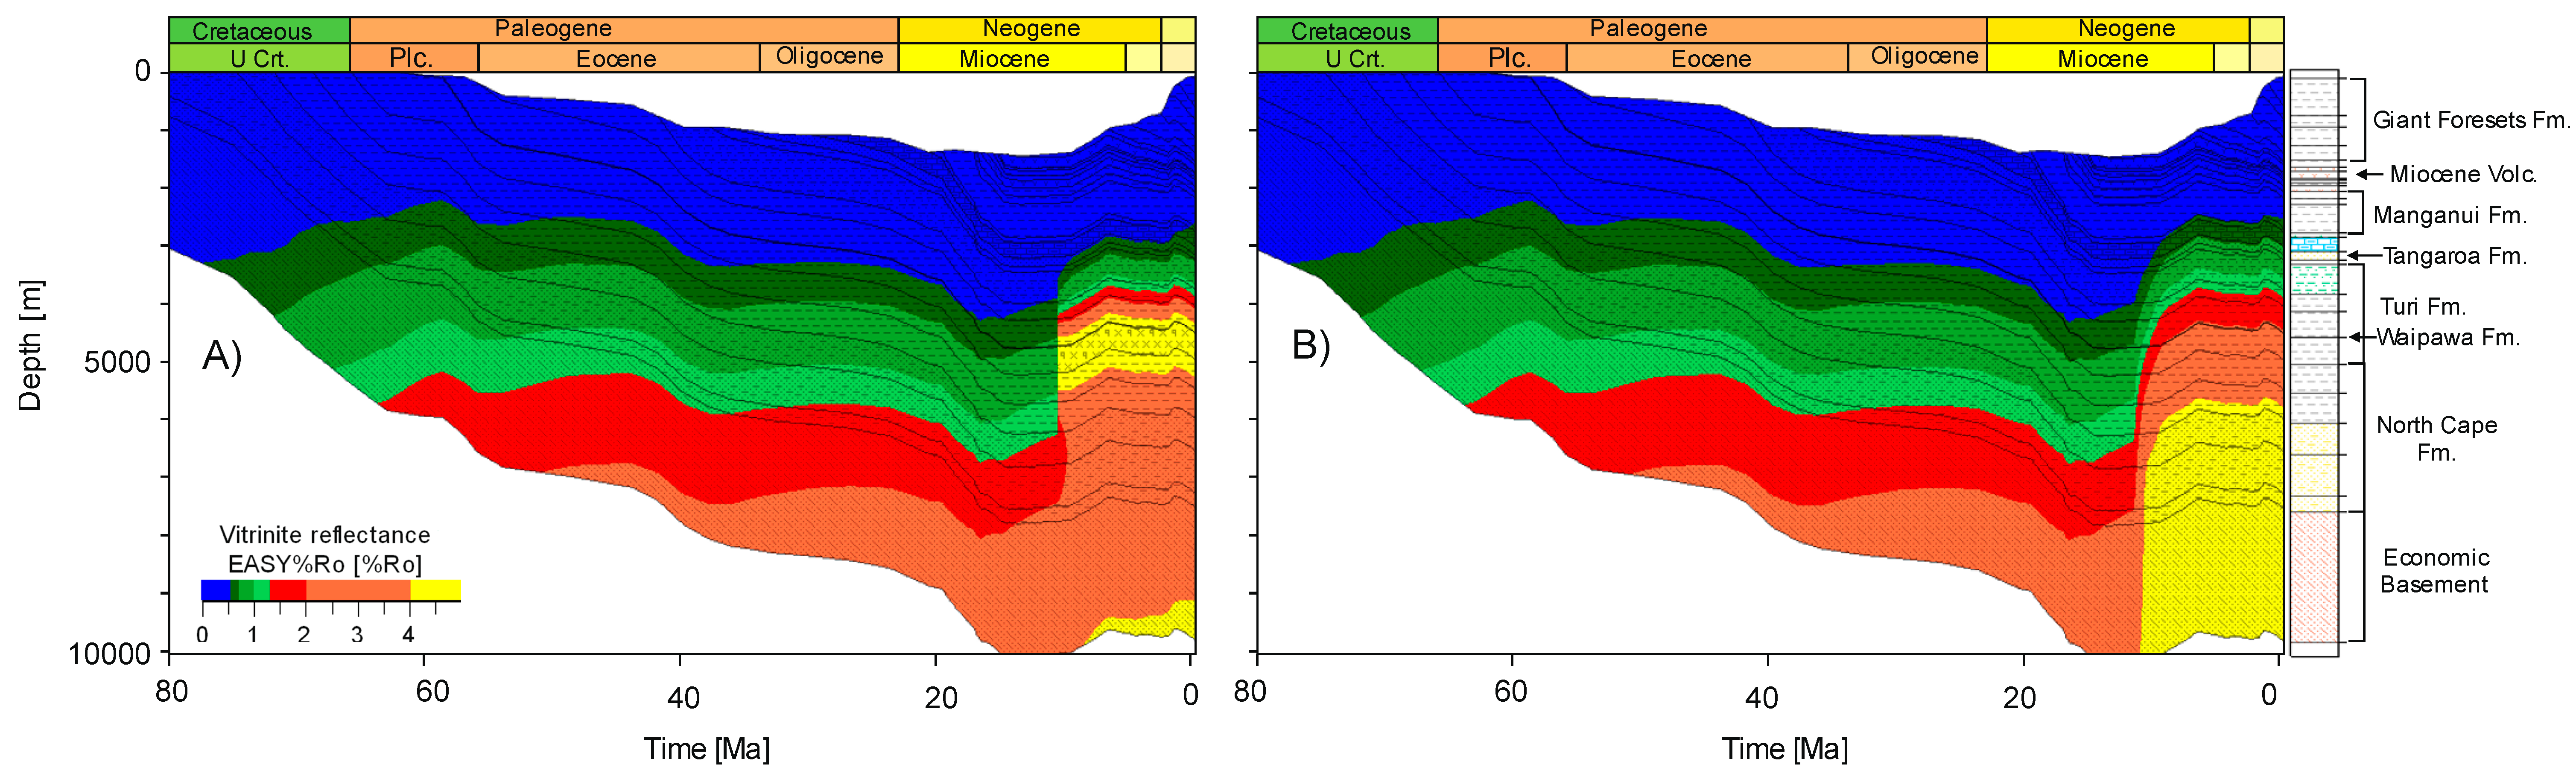
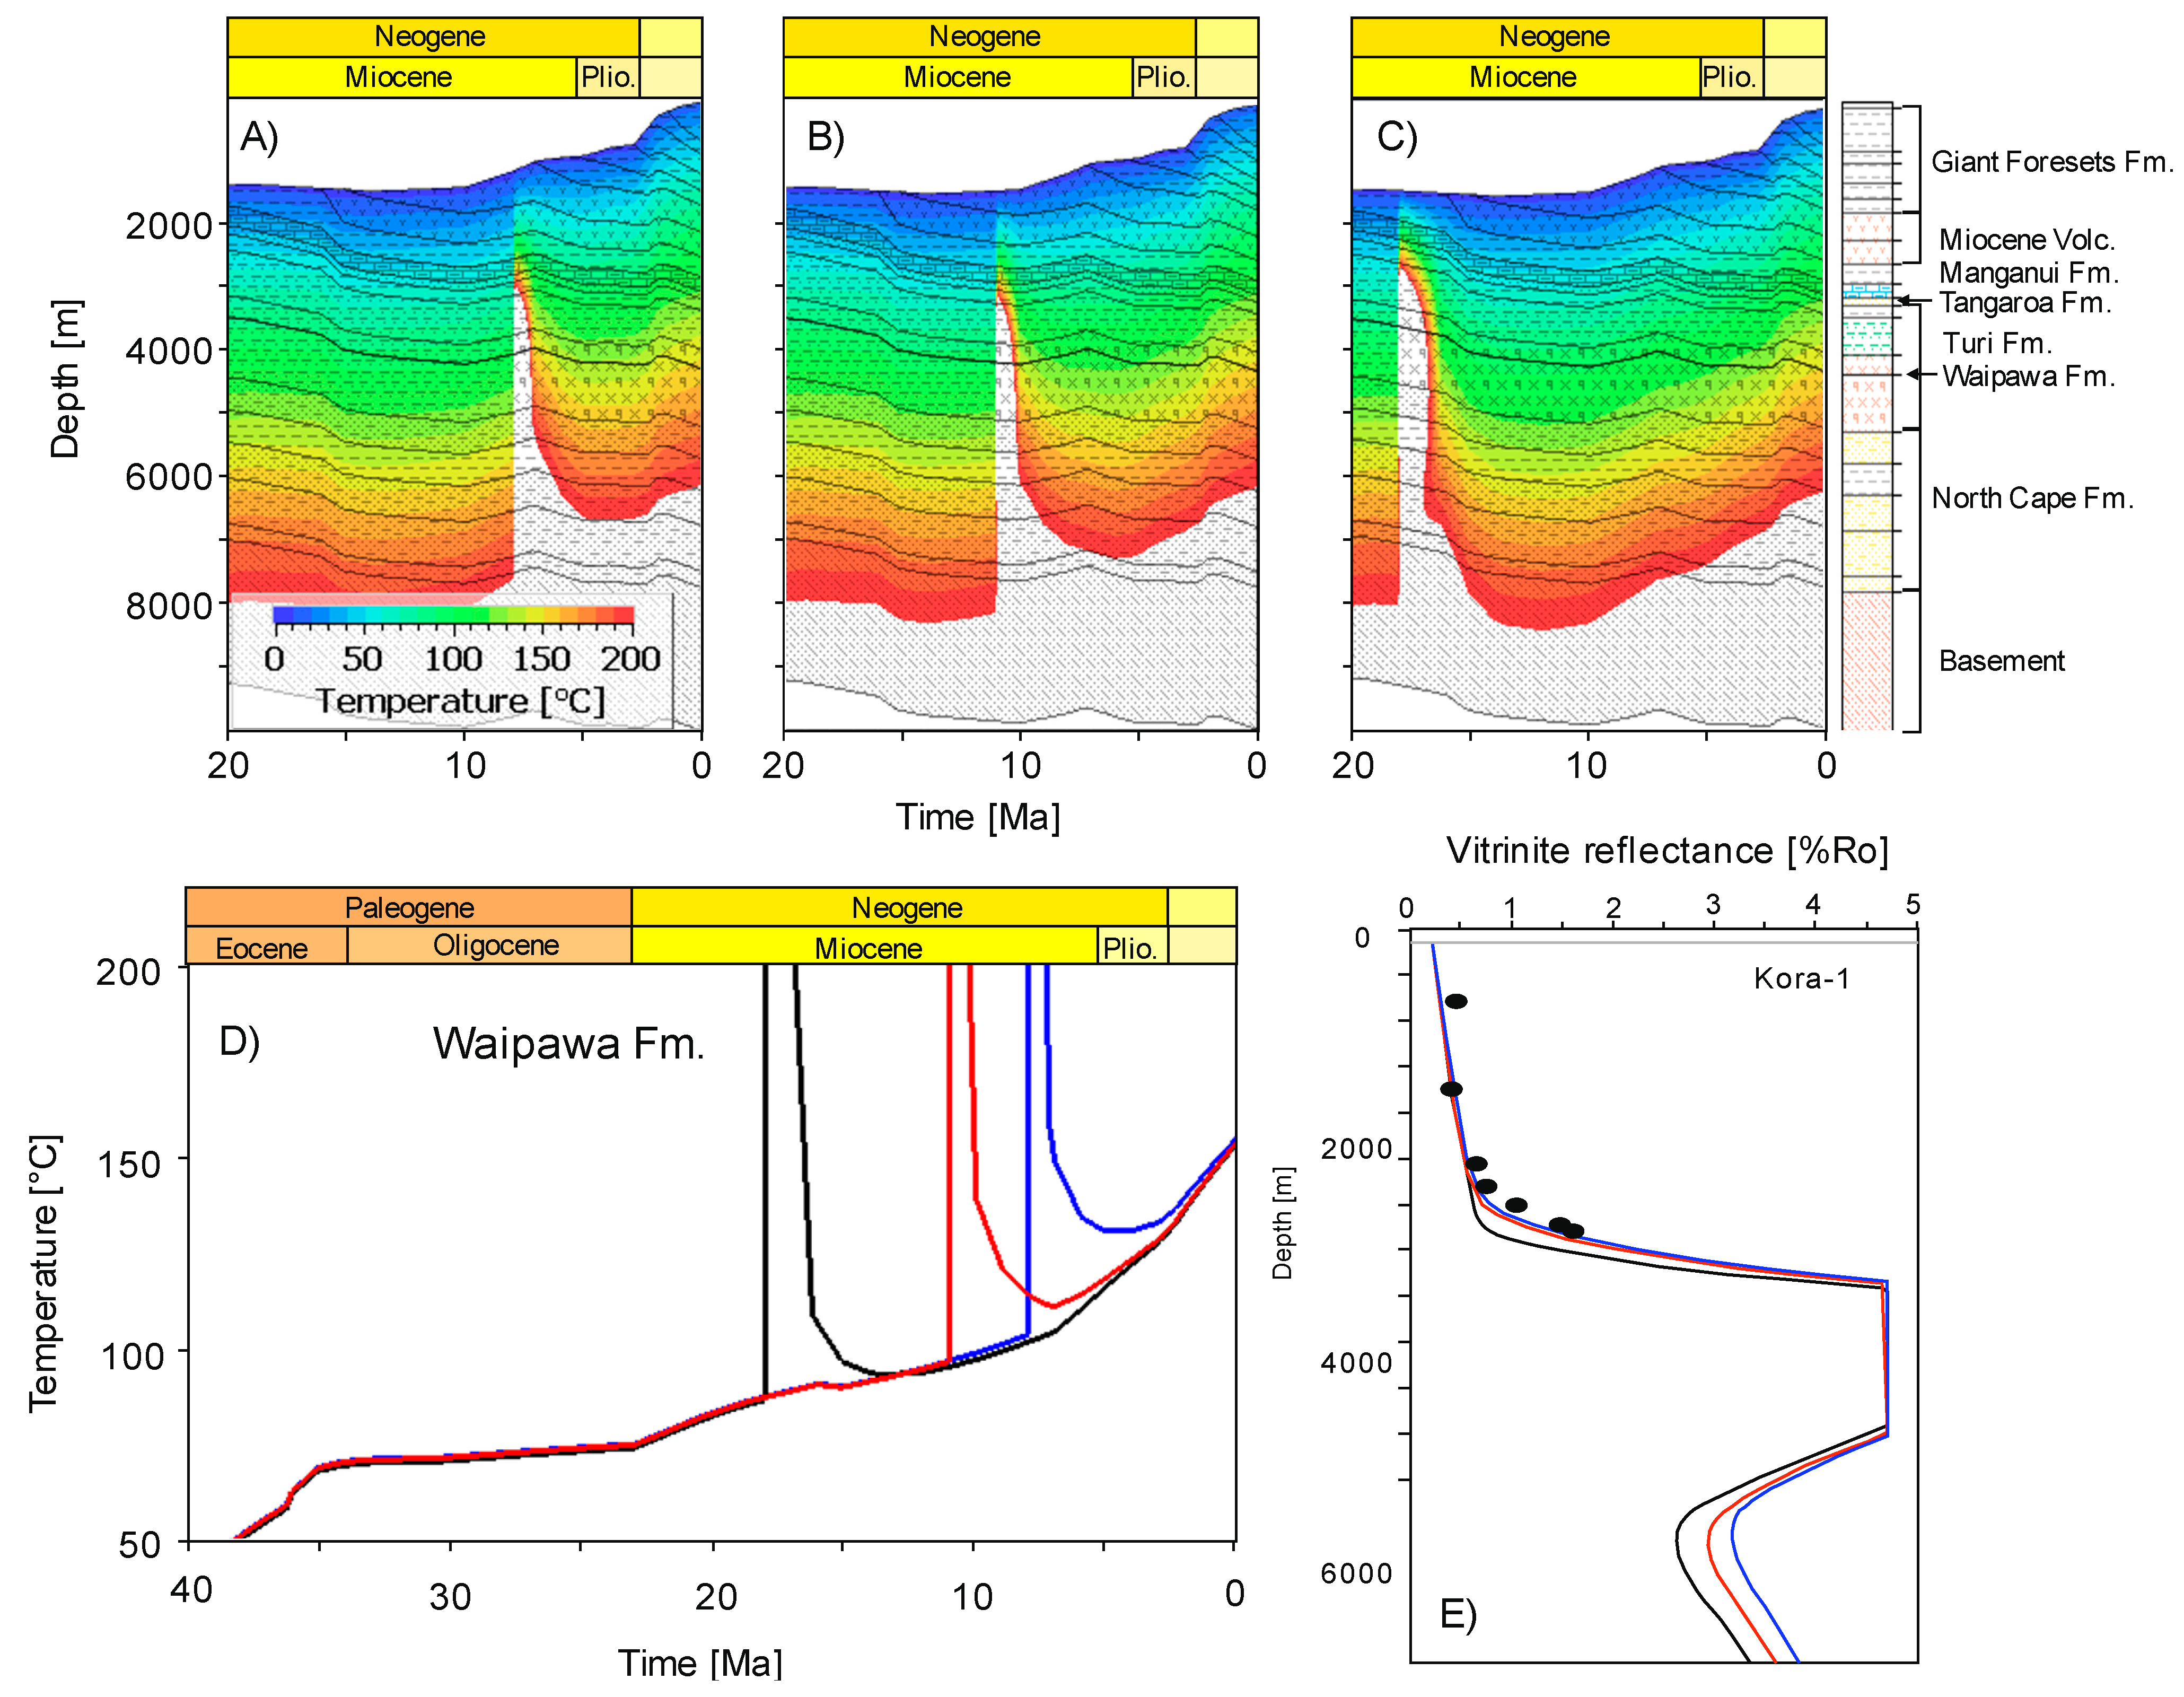
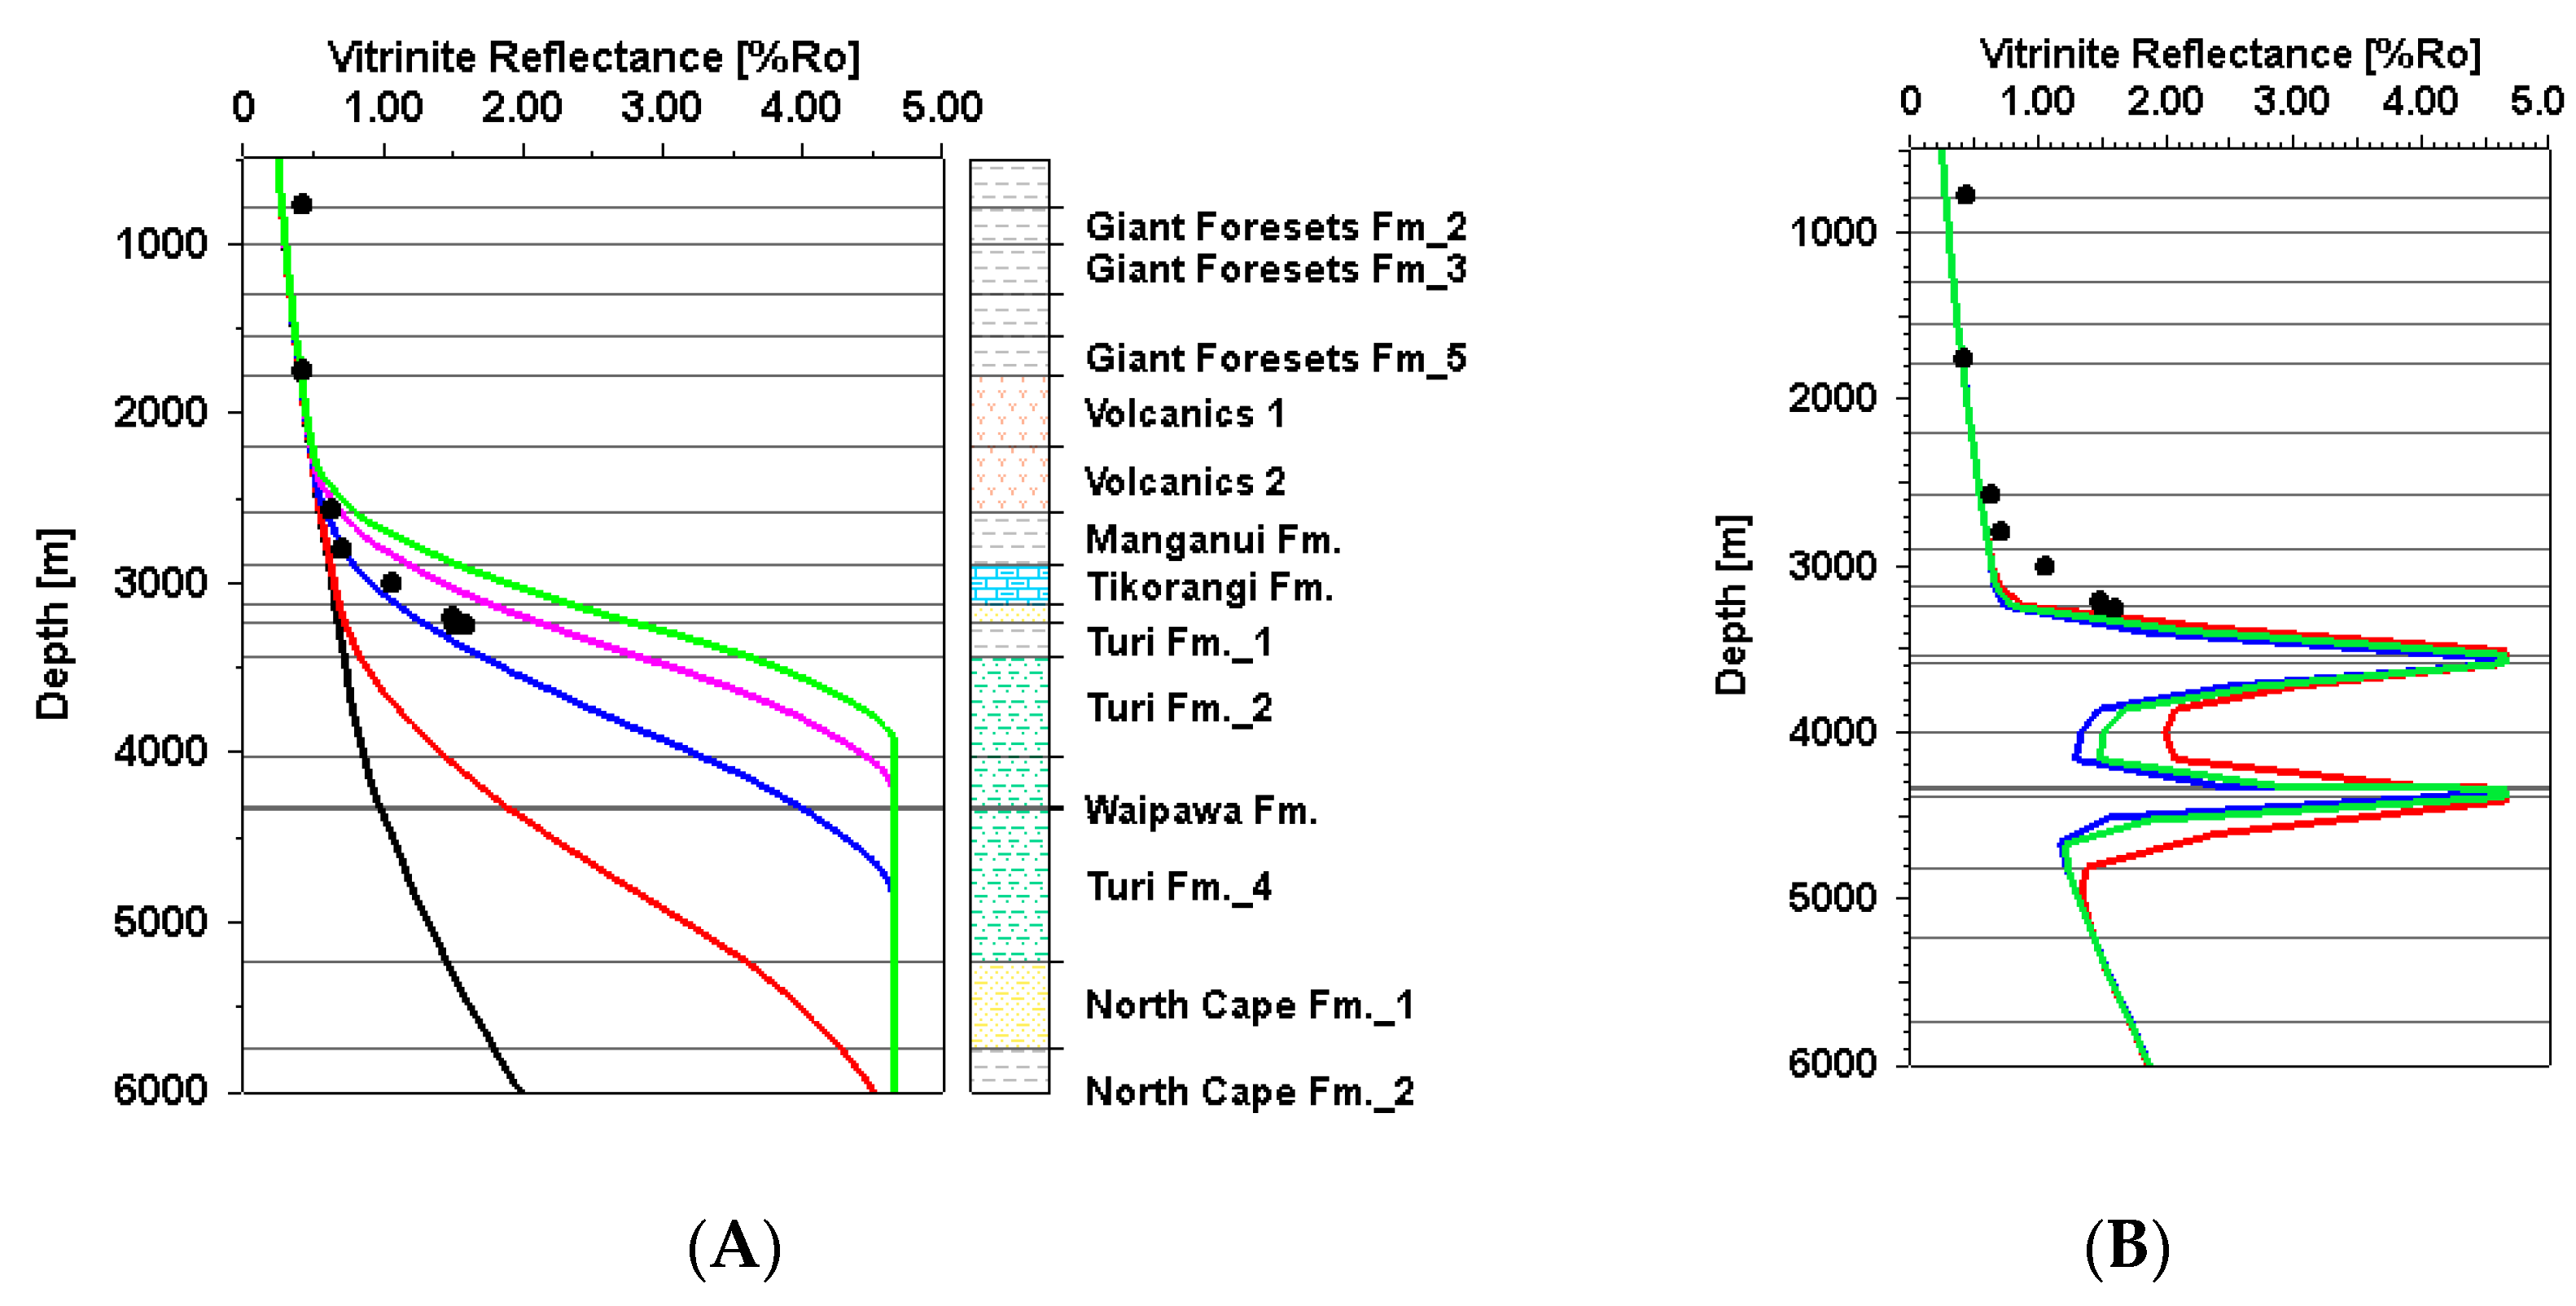
5.1. 1D Modeling Results

Simulation results from 1D models provide information on the timing of oil and gas generation. Kora-1, Kora-4, Ariki-1 and Tangaroa-1 wells are good candidates for assessing the amount of heat produced by volcanos in the northern Taranaki Basin. 1D models provide detailed information about litho-stratigraphy and rock properties in the region. Tangaroa-1 is located northeast of the Kora volcano and was also drilled in the volcaniclastics; together with Ariki-1 well it was chosen for comparison with the Kora wells. These wells intersect volcanoclastics and minor volcanic or intrusive rocks of Miocene age. Vitrinite data were used as reported in well reports [33,34,35,36,43] and were used for heat flow calibration.
The burial history reconstruction for Kora-4 well is shown on Figure 9A. About 4 km of subsidence occurred during Late Cretaceous‒Paleocene rifting. Subsidence continued until the late Miocene, when the eastern margin of northern Taranaki Basin was inverted during development of the convergent plate boundary. Sedimentation rates markedly slowed from the late Eocene onwards due to sediment starvation of the basin and maximum transgression during the Oligocene and an increase in water depth to about 1400 m [48,52]. Sedimentation rates increased during the Miocene, and in particular after late Miocene inversion, when the shelf propagated across the Kora area and the Giant Foresets Formation was deposited. The highest sedimentation rates are documented for the last 5 Ma (Pleistocene-Pliocene) for all modeled wells, filling most of the previously created accommodation space. At the same time, the deepest burial was reached.
In Figure 10E, burial histories for the Tangaroa Formation are compared for the four wells. Evolution during the Paleogene is similar for all wells and low sedimentation rates prevail. Starting in the lower Miocene, the pattern becomes more complex and differences between the wells are more prominent. During the Plio-Pleistocene periods, Ariki-1 and Tangaroa-1 wells experienced even more burial than the two Kora wells.
The temperature overlay on the burial plot for Kora-4 well illustrates the thermal history of the stratigraphic column. Aside from the magmatic heat event at 11 Ma, there is a temperature increase during the last 5 Ma which is associated with the rapid subsidence of the basin due to high sedimentation rates during formation of the Giant Foresets propagation system during the Pliocene.
The modeled sub-volcanic intrusion emplacement as a consequence of the main volcanic activity leads to the temperature spike affecting both deeper and shallow layers. In the intrusion scenario-1, volcanic activity was modeled as subvolcanic intrusion into the Paleocene and Late Cretaceous, between layers P00 and K90 (Figure 10B). The second scenario of intrusion emplacement represents a deep seated intrusion below the modeled section, where the basal heat flow was increased at 11 Ma from 53 mW/m2 to 200 mW/m2. The thermal effect of a deep-seated intrusion is more gradual with depth than of a local intrusion in scenario 1 (Figure 10C).
Both scenarios modeling intrusion emplacement provide a better fit to the calibration data than the scenario without considering magmatic activity. Without such local heat sources, vitrinite reflectance data in Kora-1 cannot be reproduced (Figure 11 and Figure 12). In Kora-1 well a significant increase in vitrinite reflectance values occurs below 3000 m depth. For Kora-4 the deepest sample measured for vitrinite reflectance is at 2700 m depth. Below this depth, a pronounced increase of organic matter maturity is expected, as seen in Kora-1 (Figure 11), but data are lacking.
The more pronounced increases in vitrinite reflectance in Tangaroa-1 and Ariki-1 may also be due to local or hydrothermal heating. A recent example for such a system has been reported from ODP (Ocean Drilling Project) Site 859, where the mid-ocean ridge is subducted below forearc sediments leading to very high overall heat flows, strong local thermal effects [53] as well as maturation of organic matter [54].
The temperature overlay on the burial plot for Kora-4 well (Figure 10A) illustrates the thermal history of the stratigraphic column using scenario 1. Sub-volcanic intrusion led to an increase of temperature in surrounding sediments including the Paleocene sediments of the Waipawa Formation. Compared to a scenario without any igneous heating event (blue line in Figure 11), this leads to a predicted heating of the Waipawa Formation to about 250 °C, compared to about 140 °C in the model without magmatic activity.
The model results demonstrate that magmatism has had profound effects on the thermal history of the Kora lithological column intersected by the well. Figure 13 shows a maturity overlay onto the burial history plot. The blue, green, red and yellow areas represent thermally immature, oil window, gas window, and over-mature zones, respectively. The oil and gas windows are influenced by the kinetic parameters and heat flow used. The striking feature in the maturity zone overlay is the sharp increase in maturity at the time of magmatic intrusion (Figure 13). Figure 13A shows a change of the maturity in the scenario where several magmatic intrusions were placed in Paleocene and Cretaceous sediments. Prior to magmatic intrusion, the vitrinite reflectance values for the Waipawa Formation reached 0.73 %Ro. This parameter rapidly increases when organic matter gets heated by an intrusion located in the direct proximity to the organic rich sediment layer. By the time magmatic activity ceased, the organic matter of the Waipawa Formation became overmature (4.66 %Ro). The scenario with magmatic activity modeled in the basement indicates a smoother transition in maturity compared to the magmatic intrusion in the sediments scenario. Figure 12 B illustrates that the change of maturity for the Waipawa Formation starts at 13 Ma and gradually increases from 0.73 %Ro to 0.85 %Ro at 11.5 Ma, reaching its maximum of 2.2 %Ro after 11 Ma. Both scenarios indicate the location of the magmatic intrusion relative to the organic rich layer is the key parameter controlling the source rock maturation. The changes in temperature, and thus the geothermal gradient, allow rocks to pass through the liquid-and gas-generating maturity zones. Both scenarios of intrusion emplacement and deep seated intrusion show that the Paleocene Waipawa Formation becomes overmature in the vicinity of the intrusion.

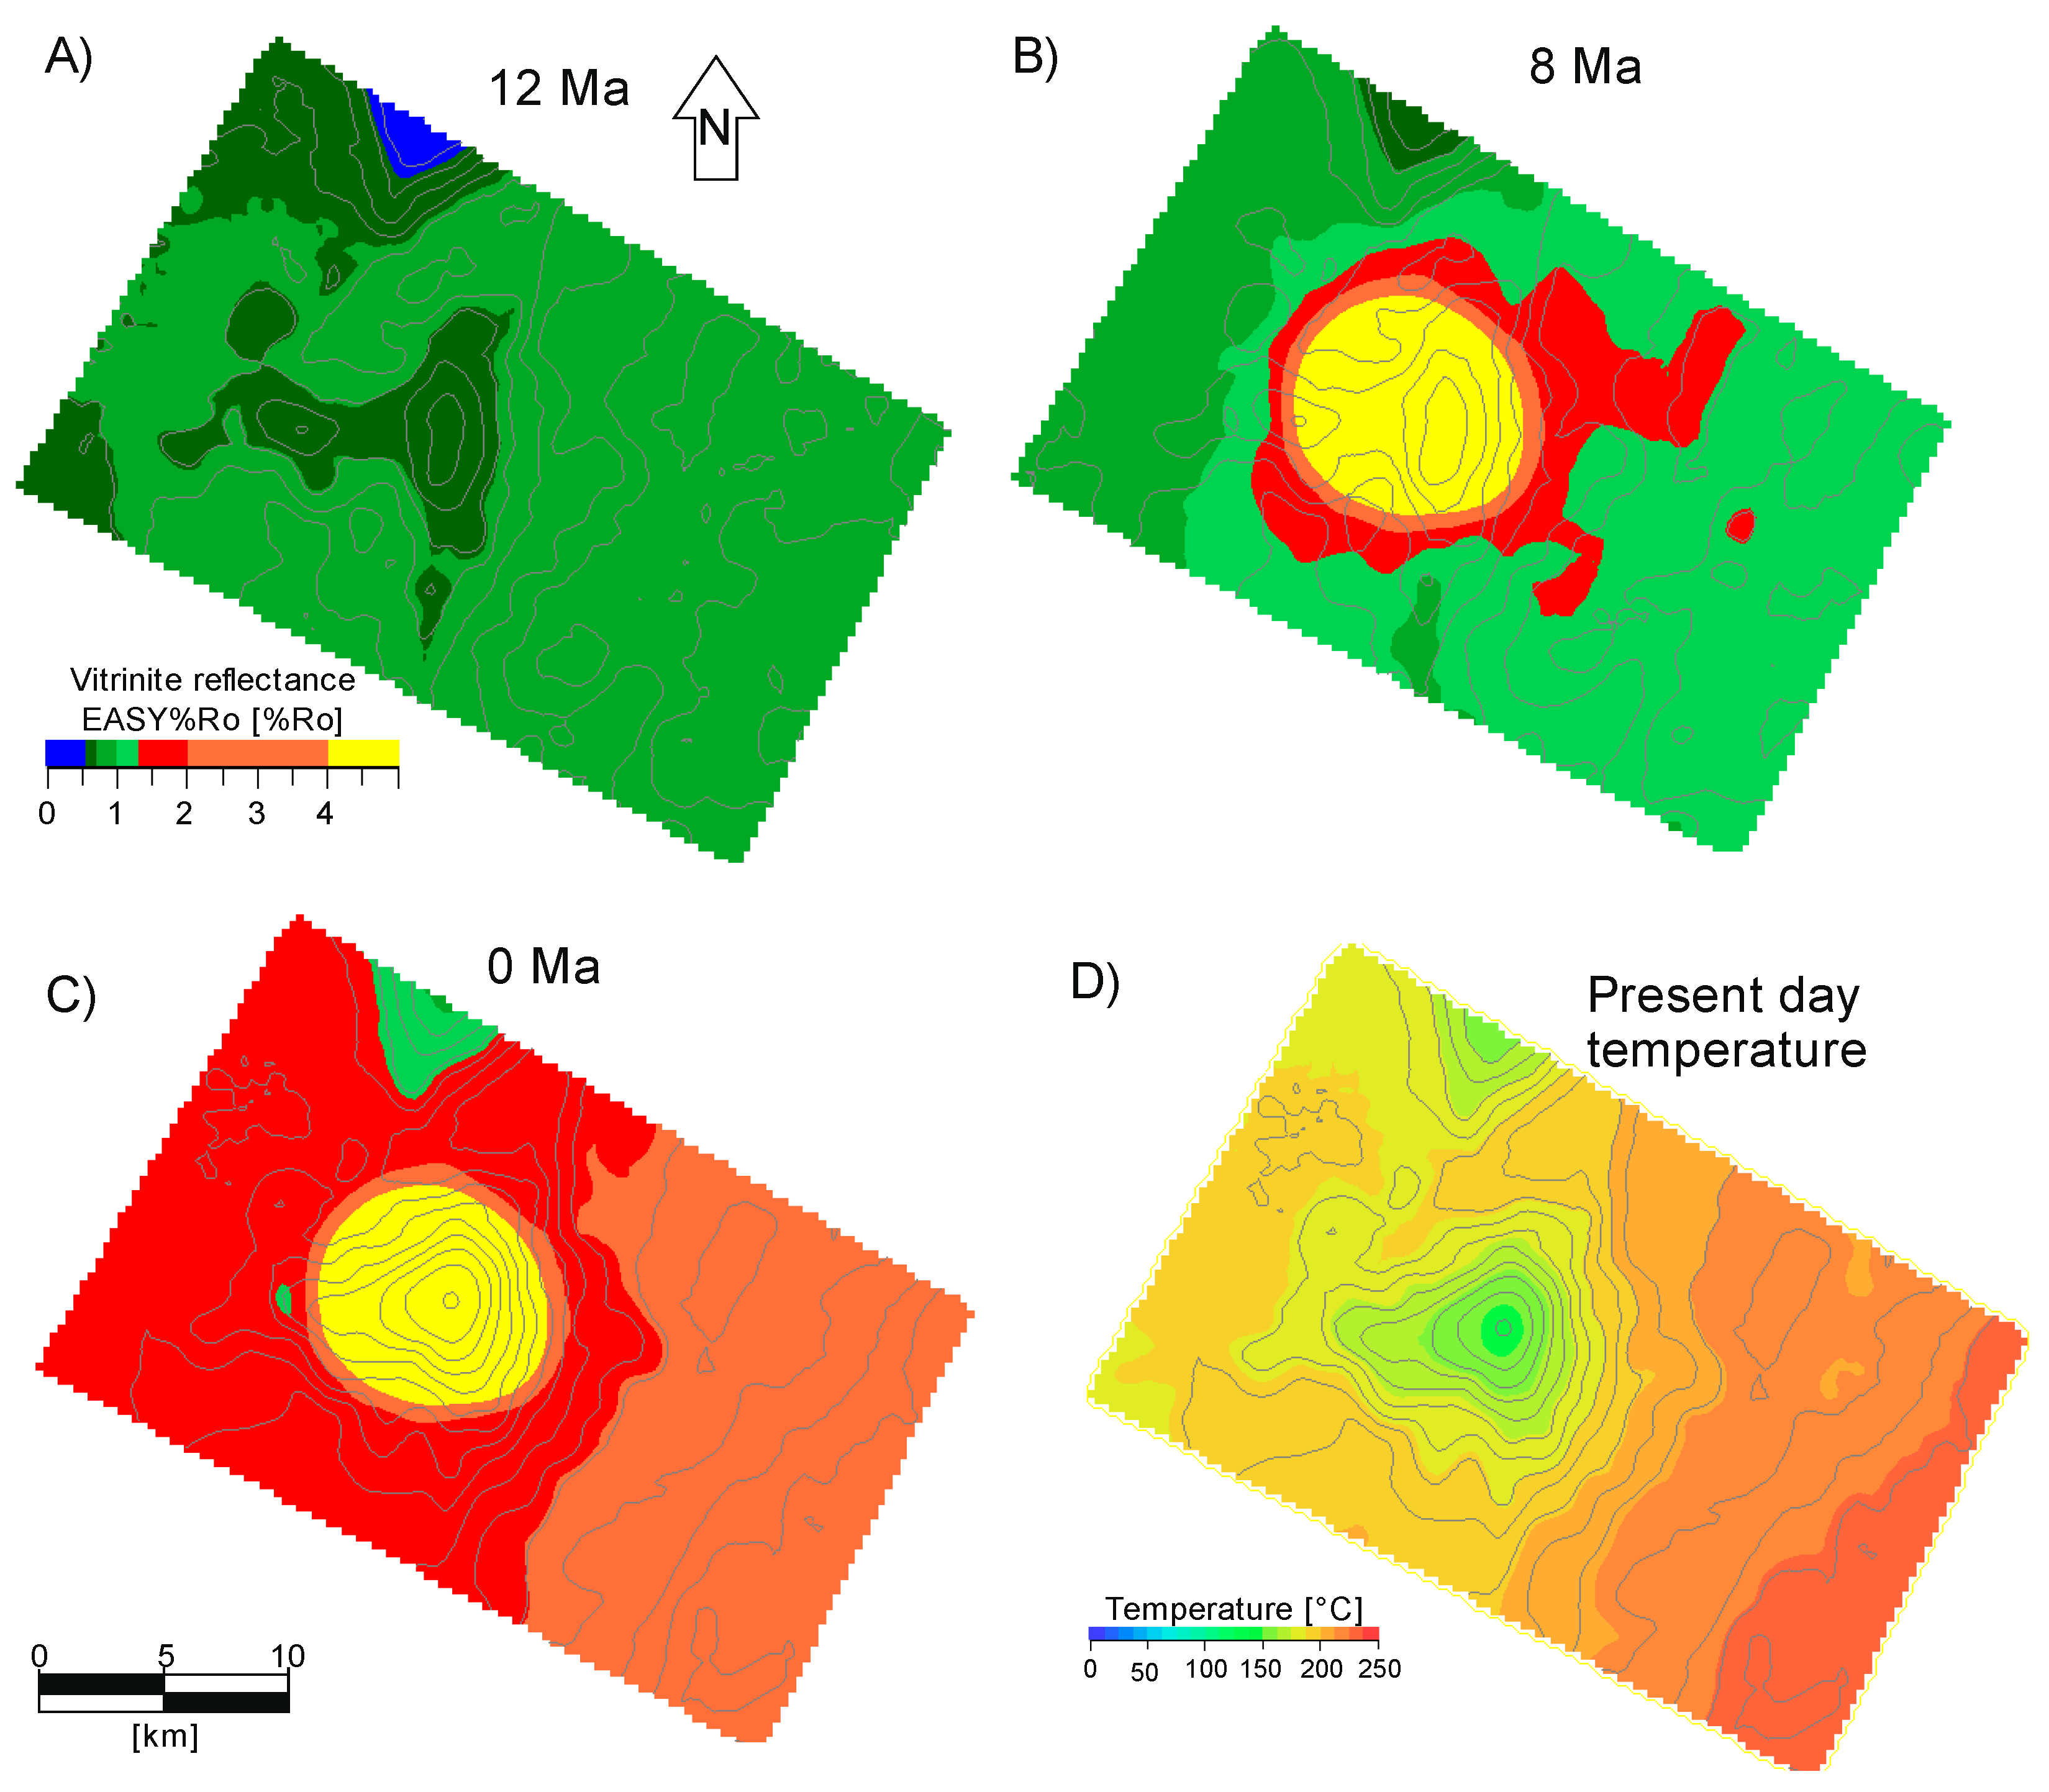
5.2. 3D Modeling Results

The 3D model integrating the geometries of the stratigraphic layers and facies distribution allows to study the lateral effects of sub-volcanic intrusions on the surrounding sediments. Facies modeling in Petrel software was carried out based on well log interpretation (gamma ray, spontaneous potential, and resistivity) and well cuttings descriptions. The lateral and vertical changes in lithology were considered. Facies distribution in Ariki-1 and its corresponding correlation with interpreted units is illustrated in Figure 3. The seabed to N80 interval is dominated by poorly consolidated silts. The N80 to N70 interval is defined by interbedded mudstones and siltstones, where the uppermost part is dominated by siltstones and the lower part of the interval by mudstones. A volcano-sedimentary interval, as interpreted for Kora-1 well from the gamma ray log and cuttings description, is identified for the well at the depth between 1800 m and 2480 m. The underlying interval penetrated by Kora-4 well includes Miocene mudstones with intercalated sandstone of varying thickness and Oligocene limestone. The sediments of the lowermost units are represented by a deep marine succession of marlstones, shales, and sandstones of the Tangaroa Fm. The Waipawa Formation is modeled as a uniform organic rich black shale layer of 10 m thickness. A transect through the study area showing facies distribution as implemented in the model is shown in Figure 14. Calibration followed the same principles as described for 1D. Three scenarios of intrusion timing were tested, at 18, 11, and 8 Ma, either with very high basal heat flows of 200 mW/m2 during initial intrusion time or with replacement of sedimentary lithologies by hot andesite.
Figure 15A–C shows the differences in modeled thermal regimes within the study area at the location of Kora-1 well. All the models show a gradual increase of the temperature with time for the different layers and then an abrupt increase during magmatic activity. Temperatures drop rapidly shortly after igneous emplacement and then increase again significantly in the last 3–4 Ma before the present. The latter effect is related to the rapid subsidence associated with increased sedimentation rates during deposition of the Giant Foresets Formation. The temperature spike related to the intrusion (placed in the Paleocene and Late Cretaceous sediments) is the result of a short-lived event: a duration of magmatic activity of 1 Ma was assumed based on studies of magmatic activity by Baumgartner et al. [55]. It takes about 2–3 Ma until temperatures have re-equilibrated, which is strongly dependent on thermal conductivities of the sedimentary and magmatic rocks. Figure 15D shows the three different temperature scenarios for the Waipawa Formation with modeled ages of magmatic intrusion in the sediments. The re-equilibration of the temperature after intrusion takes longer (up to 5 Ma) in the scenarios with younger emplacement age due to an added insulation effect of the thicker overburden. The present-day temperatures (Figure 16D) still show a variation across the buried Kora volcanic edifice. This is mainly due to the difference in lithologies and doming of the stratigraphic layer related to magmatic intrusion. The volcanic and volcanoclastic lithologies have a higher thermal conductivity, which results in a chimney effect (similar to salt domes) reducing the thermal insulation and hence the temperature at the Waipawa Formation. This observation is consistent with 1D modeling results.
In Figure 16A–C, modeled thermal maturity of the Waipawa Formation is shown for an intrusion timing of 11 Ma into Cretaceous to Paleogene rocks and three time steps: 12 Ma, 8 Ma, and present-day as well as present-day temperature distribution (Figure 16 D). Maturity close to the volcanic center is clearly determined by Miocene volcanic activity, whereas maturity at distances greater than 1–2 km is determined by late (Plio-Pleistocene) burial, reflecting present-day temperatures.
The Waipawa Formation has been drilled in the Ariki-1 well, where it is represented by a 12 m thick layer of organic rich marine shale. The hydrocarbon potential of the source rock was evaluated based on the geochemical analysis of source rock samples in that well [37]. Rock-Eval measurements of Waipawa Formation samples in Ariki-1 have yielded TOC values of 11.5 %, a hydrogen index (HI) of 351 mg/gTOC and Tmax of 421°C [41]. In order to model hydrocarbon generation in the Kora area, custom kinetics for the Waipawa Formation measured on Ariki-1 samples were used [41]. Geochemical analysis and the Kora discovery indicate that Waipawa Formation in the northern Taranaki Basin is oil-prone [41].
The model results demonstrate that both the high sedimentation rates during the last 5 Ma and Miocene magmatic activity have a profound effect on the thermal history of the lithological column around Kora volcano. Hydrocarbon generation was accelerated by the local temperature increase in direct proximity to any sills and dikes. The thermal impact of the igneous intrusion extends laterally more than 5 kilometers from the intrusion center, but maturation effects at distances greater than about 1 to 2 km are overlapped by later deep burial and related temperature increase (Figure 16). The model with magmatic intrusion in sediments shows that in areas that were not affected by volcanic activity, vitrinite reflectance values are in the range between 0.5 and 1.2 %Ro. The source rock directly affected by the volcanic intrusion became overmature, as indicated by the yellow color on the map (>4 %Ro). This effect rapidly decreases from the center of intrusion with vitrinite reflectance values changing from 3.8 to 2.0 %Ro within about 1000 m from intrusion (Figure 16B) and not visible at more than 2000 m distance. Close to volcanic activity the temperatures at the level of the Waipawa Formation is predicted to have increased during the intrusion emplacement from about 120 °C to 260 °C and returned to the pre-emplacement level within approximately 2 Ma. The thermal effect of magmatic intrusion in the basement with a local increase in basal heat flow has significantly less impact on the thermal maturation of the source rock in comparison to magmatic intrusion in the Paleocene –Cretaceous sediments.
Modeling results suggest that the Waipawa Formation was primarily immature around the Kora volcano before the volcanic activity started. Expulsion/generation of hydrocarbons for three modeled scenarios of Kora-1 and Kora-4 wells is shown in Figure 17. For Kora-4 well, the scenarios with deep seated intrusion in the basement and magmatic intrusion in sediments show the same results, with a rapid increase in maturation at 11 Ma associated with high temperature. In the base case scenario for Kora-1 and Kora-4 wells (Figure 17), just 50% of kerogen conversion in Waipawa source rock takes place for Kora-4 and less than 5% in Kora-1 at 11 Ma. Modeling results of different age of volcanic activity suggest that hydrocarbons locally generated by the magmatic activity would have been expelled from the Waipawa Formation prior to the deposition of a proper seal rock. Absence of seal and/or insufficient overburden would likely have resulted in a loss of most of the hydrocarbons generated. However, the Waipawa Formation that was not affected by the volcanic activity still retained generative potential. Hydrocarbons have likely been expelled from the source rock during the later burial associated with deposition of the Giant Foresets Formation in the deeper area of the Taranaki Basin and migrated to the Kora structure.

5.3. Sensitivity Analysis

The following paragraphs are meant to provide an idea on how the sedimentary system in the Taranaki Basin reacts to changes of basal heat flow due to a deep seated intrusion and on changes in magmatic intrusion thickness placed in the sedimentary column. Testing the sensitivity of the model to heat flow changes and proximity to the organic rich layer helps to quantify the effects of these parameters on temperature and maturity of the surrounding sediments.
Heat flow in volcanically active regions in the direct proximity to the volcano reach up to 500 mW/m2. The heat flow values increase near a volcano [56]. We modeled five scenarios with a basal heat flow of 100, 200, 300, 400 and 500 mW/m2. The other parameters were not changed. The resulting difference in temperature and maturity are shown in Figure 18A. The Kora 1 data fit best to a high basal heat flow of 300 mW/m2, while at greater distance from the volcanic center lower heat flows are expected.
Recent studies indicate that the thickness and proximity of magmatic intrusion to organic matter rich layers are major factors responsible for the maturation and petroleum generation [16,57]. To test the sensitivity of the thickness and distribution of the magmatic intrusion we assumed two magmatic sills both with andesitic magma. We used three scenarios changing the thickness of these sills from 25 to 50 and 75 m each, that clearly show the intrusion thickness has an enormous influence on temperature and maturity of surrounding sediments, in particular between the two intrusions (Figure 18B).

6. Conclusions

We present the results of a seismo-stratigraphic interpretation and 1D and 3D basin modeling, that is used for exploring the effect of magmatic events on the thermal history and petroleum generation around the Kora volcano. The modeling study represents the first investigation of potential interaction of the Waipawa Formation and magmatic intrusion in 3D in the northern Taranaki Basin, New Zealand. The thermal history of the study area was constrained using vitrinite reflectance data from four wells, with two of them intersecting the flank of the Kora structure, and two located within 15 km from it, as well as knowledge of the tectonic settings. Distinct scenarios of the intrusion emplacement and its timing provide information on the timing of hydrocarbon expulsion and illustrate the interaction of hydrocarbon generation and widespread magmatic activity during the Late Miocene time.
The modeling results show that the Waipawa Formation was thermally immature before the magmatic activity started in the late Miocene. Modeled magmatic intrusion in the Paleocene and Late Cretaceous sediments (P00 and K90) at 11 Ma caused rapid heating of the surrounding sediments and maturation of the regional source rock (Waipawa Formation). Depending on the proximity of the source rock to the intrusion, the Waipawa Formation became overmature or was in the gas window directly after the magmatic activity ceased. The scenario with magmatic intrusion placed in the basement (basal heat flow increase) shows similar results. A sensitivity study involving variations of the intrusion age (18 Ma, 11 Ma and 8 Ma) indicates that Waipawa Formation would experience higher temperatures if magmatic activity occurs at 8 Ma due to the coupling of two events strongly influencing the thermal history: magmatic activity, and rapid subsidence related due to deposition of Giant Foresets Formation. The same magmatic event modeled at 11 and 18 Ma has less effect on the thermal regime at the level of source rock because the system cooled down more rapidly.
3D modeling results show that the lateral effect of magmatic activity has a local effect on the maturation of the source rock. The thermal aureole caused by volcanic activity at the level of the source rock gradually decreases from its center influencing the area in a radius of 5 km, with a strong impact being restricted to 1–2 km.
The modeling results suggest that most of the hydrocarbons expelled from the Waipawa Formation due to local magmatic heat escaping to the surface, because at the time of expulsion there was no well-developed seal rock that could prevent hydrocarbon leakage (Figure 19).

Author Contributions

Conceptualization, A.K., R.L and K.K.; methodology, A.K., S.B., K.K. and H.S.; software, A.K., S.B. and K.K.; validation, A.K., K.K., and S.B.; formal analysis, A.K., R.L. and K.K.; investigation, A.K.; resources, A.K., K.K., H.S.; data curation, A.K., R.L., K.K., H.S and S.B.; writing—original draft preparation, A.K.; writing—review and editing, K.K., R.L., H.S. and R.L.; visualization, A.K.; supervision, R.L. and K.K.; project administration, A.K., R.L. and K.K. All authors confirmed they have contributed to the intellectual content of this paper and have met the following four requirements: (a) significant contributions to the conception and design, acquisition of data, or analysis and interpretation of data, (b) drafting or revising the article for intellectual content, (c) final approval of the published article, and (d) agreement to be accountable for all aspects of the article, which ensures that questions related to the accuracy or integrity of any part of the article are appropriately investigated and resolved.

Funding

RWTH Aachen University, Germany and the New Zealand Ministry of Business, Innovation and Employment through the GNS Science-led research program on New Zealand petroleum source rocks, fluids, and plumbing systems (contract C05X1507) supported this project.

Acknowledgments

The first author would like to thank the scientists from GNS Science, New Zealand, for their support, particularly Richard Sykes, Rob Funnell, Paul Viskovic and Dominic Strogen. We thank Carlos Andres Sanchez Torres, Anett Engbrodt, Adeline Parent, Christian Vogt, Teodoro Cassola and other colleagues from Schlumberger (Aachen) for their generous technical support and fruitful discussions on domain and software-related topics during research with PetroMod and Petrel. Seismic data and well data were derived from the New Zealand Petroleum & Minerals exploration database. Schlumberger is greatly acknowledged for providing the Petrel 2016 and Petromod 2016 software for this study. Additional financial support for this project was provided by the New Zealand Ministry of Business, Innovation and Employment through the GNS Science-led research program on New Zealand petroleum source rocks, fluids, and plumbing systems (contract C05X1507). We thank two anonymous reviewers for their thorough comments which helped to improve the manuscript.

Conflicts of Interest

The authors declare no conflict of interest.

References

  1. Hantschel, T.; Kauerauf, A.I. Fundamentals of Basin and Petroleum Systems Modeling; Springer: Dordrecht, The Netherlands; New York, NY, USA, 2009; 476p, ISBN 978-3-540-72317-2. [Google Scholar]
  2. Senger, K.; Millet, J.; Planke, S.; Ogata, K.; Eide, C.H.; Festøy, M.; Galland, O.; Jerram, D.A. Effects of igneous intrusions on the petroleum system: A review. First Break 2017, 35, 47–56. [Google Scholar]
  3. Feng, Z. Volcanic rocks as prolific gas reservoir: A case study from the Qingshen gas field in the Songliao Basin, NE China. Mar. Pet. Geol. 2008, 25, 416–432. [Google Scholar] [CrossRef]
  4. Liu, J.; Wang, P.; Zhang, Y.; Bian, W.; Huang, Y.; Tang, H.; Che, X. Volcanic Rock-Hosted Natural Hydrocarbon Resources: A Review. In Updates in Volcanology—New Advances in Understanding Volcanic Systems; Nemeth, K., Ed.; InTech: London, UK, 2012; pp. 151–179. ISBN 978-953-51-0915-0. [Google Scholar]
  5. Mørk, A.; Bjorøy, M. Mesozoic Source Rocks on Svalbard. In Petroleum Geology of the North European Margin; Spencer, A.M., Ed.; Springer: Dordrecht, The Netherlands, 1984; pp. 371–382. ISBN 978-94-010-8982-1. [Google Scholar]
  6. Rohrman, M. Prospectivity of volcanic basins: Trap delineation and acreage de-risking. AAPG Bull. 2007, 91, 915–939. [Google Scholar] [CrossRef]
  7. Aarnes, I.; Svensen, H.; Connolly, J.A.D.; Podladchikov, Y.Y. How contact metamorphism can trigger global climate changes: Modeling gas generation around igneous sills in sedimentary basins. Geochim. Cosmochim. Acta 2010, 74, 7179–7195. [Google Scholar] [CrossRef] [Green Version]
  8. Galushkin, Y.I. Thermal effects of igneous intrusions on maturity of organic matter: A possible mechanism of intrusion. Org. Geochem. 1997, 26, 645–658. [Google Scholar] [CrossRef]
  9. Lampe, C.; Kornpihl, K.; Sciamanna, S.; Zapata, T.; Zamora, G.; Varadé, R. Petroleum systems modeling in tectonically complex areas—A 2D migration study from the Neuquen Basin, Argentina. J. Geochem. Explor. 2006, 89, 201–204. [Google Scholar] [CrossRef]
  10. Lee, G.H.; Kwon, Y.I.; Yoon, C.S.; Kim, H.J.; Yoo, H.S. Igneous complexes in the eastern Northern South Yellow Sea Basin and their implications for hydrocarbon systems. Mar. Pet. Geol. 2006, 23, 631–645. [Google Scholar] [CrossRef]
  11. Jones, S.F.; Wielens, H.; Williamson, M.C.; Zentilli, M. Impact of magmatism on petroleum systems in the Sverdrup Basin, Canadian Arctic Islands, Nunavut: A numerical modeling study. J. Pet. Geol. 2007, 30, 237–256. [Google Scholar] [CrossRef]
  12. Bischoff, A.P.; Nicol, A.; Beggs, M. Stratigraphy of architectural elements in a buried volcanic system and implications for hydrocarbon exploration. Interpretation 2017, 5, 141–159. [Google Scholar] [CrossRef]
  13. Infante-Paez, L.; Marfurt, K.J. Seismic expression and geomorphology of igneous bodies: A Taranaki Basin, New Zealand, case study. Interpretation 2017, 5, 121–140. [Google Scholar] [CrossRef]
  14. Morley, C.K. 3-D seismic imaging of the plumbing system of the Kora Volcano, Taranaki Basin, New Zealand: The influence of syn-rift structure on shallow igneous intrusion architecture. Geosphere 2018, 14, 2533–2584. [Google Scholar] [CrossRef]
  15. Stagpoole, V.; Funnell, R. Arc magmatism and hydrocarbon generation in the northern Taranaki Basin, New Zealand. Pet. Geosci. 2001, 7, 255–267. [Google Scholar] [CrossRef]
  16. Aarnes, I.; Svensen, H.; Polteau, S.; Planke, S. Contact metamorphic devolatilization of shales in the Karoo Basin, South Africa, and the effects of multiple sill intrusions. Chem. Geol. 2011, 281, 181–194. [Google Scholar] [CrossRef]
  17. Fjeldskaar, W.; Helset, H.M.; Johansen, H.; Grunnaleite, I.; Horstad, I. Thermal modeling of magmatic intrusions in the Gjallar Ridge, Norwegian Sea: Implications for vitrinite reflectance and hydrocarbon maturation. Basin Res. 2008, 20, 143–159. [Google Scholar] [CrossRef]
  18. Sydnes, M.; Fjeldskaar, W.; Løtveit, I.F.; Grunnaleite, I.; Cardozo, N. The importance of sill thickness and timing of sill emplacement on hydrocarbon maturation. Mar. Pet. Geol. 2018, 89, 500–514. [Google Scholar] [CrossRef] [Green Version]
  19. Escalona, A.; Fjeldskaar, W.; Grunnaleite, I. Basin modeling across the emergent Lesser Antilles island arc, SE Caribbean and impact on petroleum systems. First Break 2011, 29, 41–51. [Google Scholar] [CrossRef]
  20. King, P.R.; Thrasher, G.P. Cretaceous-Cenozoic Geology and Petroleum Systems of the Taranaki Basin: Institute of Geological and Nuclear Sciences Limited, Monograph 13; GNS Science: Lower Hutt, New Zealand, 1996; ISBN 978-0-478-19754-9. [Google Scholar]
  21. Giba, M.; Nicol, A.; Walsh, J.J. Evolution of faulting and volcanism in a back-arc basin and its implications for subduction processes: Taranaki Basin Evolution. Tectonics 2010, 29, 1–8. [Google Scholar] [CrossRef]
  22. Giba, M.; Walsh, J.J.; Nicol, A.; Mouslopoulou, V.; Seebeck, H. Investigation of the spatio-temporal relationship between normal faulting and arc volcanism on million-year time scales. J. Geol. Soc. 2013, 170, 951–962. [Google Scholar] [CrossRef]
  23. Strogen, D.P.; Seebeck, H.; Nicol, A.; King, P.R. Two-phase Cretaceous–Paleocene rifting in the Taranaki Basin region, New Zealand; implications for Gondwana break-up. J. Geol. Soc. 2017, 174, 929–946. [Google Scholar] [CrossRef]
  24. Reilly, C.; Nicol, A.; Walsh, J.J.; Seebeck, H. Evolution of faulting and plate boundary deformation in the Southern Taranaki Basin, New Zealand. Tectonophysics 2015, 651–652, 1–18. [Google Scholar] [CrossRef]
  25. King, P.R.; Thrasher, G.P. Post-Eocene Development of the Taranaki Basin, New Zealand: Convergent Overprint of a Passive Margin. In Geology and Geophysics of Continental Margins; Watkins, J.S., Zhiqiang, F., McMillen, K.J., Eds.; American Association of Petroleum Geologists: Tulsa, OK, USA, 1992; Volume 53, pp. 93–118. ISBN 978-1-62981-107-9. [Google Scholar]
  26. Stagpoole, V.; Nicol, A. Regional structure and kinematic history of a large subduction back thrust: Taranaki Fault, New Zealand. J. Geophys. Res. 2008, 113, 1–19. [Google Scholar] [CrossRef]
  27. Holt, W.E.; Stern, T.A. Subduction, platform subsidence, and foreland thrust loading: The late Tertiary development of Taranaki Basin, New Zealand. Tectonics 1994, 13, 1068–1092. [Google Scholar] [CrossRef]
  28. Bergamn, S.C.; Talbot, J.P.; Thompson, P.R. The Kora Miocene submarine Andesite stratovolcano hydrocarbon reservoir, Northern Taranaki Basin, New Zealand. In Proceedings of the New Zealand Oil Exploration Conference, Wellington, New Zealand, 15–18 September 1991; pp. 178–206. [Google Scholar]
  29. Seebeck, H.; Nicol, A.; Villamor, P.; Ristau, J.; Pettinga, J. Structure and kinematics of the Taupo Rift, New Zealand: Taupo Rift. Tectonics 2014, 33, 1178–1199. [Google Scholar] [CrossRef]
  30. Bull, S.; Nicol, A.; Strogen, D.; Kroeger, K.F.; Seebeck, H.S. Tectonic controls on Miocene sedimentation in the Southern Taranaki Basin and implications for New Zealand plate boundary deformation. Basin Res. 2019, 31, 253–273. [Google Scholar] [CrossRef]
  31. Reed, J.D. Exploration geochemistry of the Taranaki Basin with emphasis on Kora. In Proceedings of the Oil Exploration Conference, Wellington, New Zealand, 15–18 September 1991; Ministry of Commerce: Wellington, New Zealand, 1992; pp. 364–372. [Google Scholar]
  32. Gresko, M.D.; Jordan, D.W.; Thompson, P.R. A Sequence Stratigraphic Study of the Tangaroa Sandstone, Taranaki Basin, New Zealand. AAPG Bull. 1990, 74. [Google Scholar] [CrossRef]
  33. Arco Petroleum NZ Inc. Kora-4 Final Well Report; Petroleum Report Series PR 1443; Ministry of Economic Development New Zealand: Wellington, New Zealand, 1985; Unpublished Petroleum Report. [Google Scholar]
  34. Arco Petroleum NZ Inc. Kora-1 Kora-1A. Final Well Report; Petroleum Report Series PR 1374; Ministry of Economic Development New Zealand: Wellington, New Zealand, 1988; Unpublished Petroleum Report. [Google Scholar]
  35. Arco Petroleum NZ Inc. Kora-2 Final Well Report; Petroleum Report Series PR 1441; Ministry of Economic Development New Zealand: Wellington, New Zealand, 1988; Unpublished Petroleum Report. [Google Scholar]
  36. Arco Petroleum NZ Inc. Kora-3 Final Well Report; Petroleum Report Series PR 1441; Ministry of Economic Development New Zealand: Wellington, New Zealand, 1988; Unpublished Petroleum Report. [Google Scholar]
  37. Killops, S.D.; Woolhouse, A.D. A Geochemical Appraisal of Oil Generation in the Taranaki Basin, New Zealand. AAPG Bull. 1994, 78, 1560–1585. [Google Scholar]
  38. Murray, A.P.; Summons, R.E.; Boreham, C.J.; Dowling, L.M. Biomarker and n-alkane isotope profiles for Tertiary oils: relationship to source rock depositional setting. Org. Geochem. 1994, 22, 521–542. [Google Scholar] [CrossRef]
  39. Naeher, S.; Hollis, C.J.; Clowes, C.D.; Ventura, G.T.; Shepherd, C.L.; Crouch, E.M.; Morgans, H.E.G.; Bland, K.J.; Strogen, D.P.; Sykes, R. Depositional and organofacies influences on the petroleum potential of an unusual marine source rock: Waipawa Formation (Paleocene) in southern East Coast Basin, New Zealand. Mar. Pet. Geol. 2019, 104, 468–488. [Google Scholar] [CrossRef]
  40. Hollis, C.J.; Tayler, M.J.S.; Andrew, B.; Taylor, K.W.; Lurcock, P.; Bijl, P.K.; Kulhanek, D.K.; Crouch, E.M.; Nelson, C.S.; Pancost, R.D.; et al. Organic-rich sedimentation in the South Pacific Ocean associated with Late Paleocene climatic cooling. Earth Sci. Rev. 2014, 134, 81–97. [Google Scholar] [CrossRef]
  41. Johasen, P.E. Phase Kinetics for Two Source Rock Samples from Outcrop Black’s Quarry and Well Ariki-1, Kjeller, Norway, 2005; 27, Unpublished Petroleum Report.
  42. Schiøler, P.; Rogers, K.; Sykes, R.; Hollis, C.J.; Ilg, B.; Meadows, D.; Roncaglia, L.; Uruski, C. Palynofacies, organic geochemistry and depositional environment of the Tartan Formation (Late Paleocene), a potential source rock in the Great South Basin, New Zealand. Mar. Pet. Geol. 2010, 27, 351–369. [Google Scholar] [CrossRef]
  43. Sell BP Todd Oil Service Ltd. Completion Report Ariki-1 Well; PPL 38048; Ministry of Economic Development New Zealand: Wellington, New Zealand, 1984. [Google Scholar]
  44. Funnell, R.; Chapman, D.; Allis, R.; Armstrong, P. Thermal state of the Taranaki Basin, New Zealand. J. Geophys. Res. Solid Earth 1996, 101, 25197–25215. [Google Scholar] [CrossRef]
  45. OMV New Zealand Ltd. Final Seismic Interpretation Report for PEP 38485 (Kora); Ministry of Economic Development New Zealand: Wellington, New Zealand, 2011; Unpublished Petroleum Report. [Google Scholar]
  46. Kroeger, K.F.; Funnell, R.H.; Nicol, A.; Fohrmann, M.; Bland, K.J.; King, P.R. 3D crustal-scale heat-flow regimes at a developing active margin (Taranaki Basin, New Zealand). Tectonophysics 2013, 591, 175–193. [Google Scholar] [CrossRef]
  47. Kroeger, K.F.; Funnell, R.H. Warm Eocene climate enhanced petroleum generation from Cretaceous source rocks: A potential climate feedback mechanism? Petroleum generation climate feedback. Geophys. Res. Lett. 2012, 39, 1–6. [Google Scholar] [CrossRef]
  48. Strogen, D.P. Updated Paleogeographic Maps for the Taranaki Basin and Surrounds; GNS Science: Lower Hutt, New Zealand, 2011; p. 83. [Google Scholar]
  49. Wygrala, B.P. Integrated Study of an Oil Field in the Southern Po Basin, Northern Italy; University of Cologne: Cologne, Germany, 1989. [Google Scholar]
  50. Bull, S.; Hill, M.; Strogen, D.P.; Arnot, M.J.; Seebeck, H.; Kroeger, K.F.; Zhu, H. Seismic Reflection Interpretation, Static Modeling and Velocity Modeling of the Southern Taranaki Basin (4D Taranaki Project); GNS Science: Lower Hutt, New Zealand, 2016. [Google Scholar]
  51. Koide, H.; Bhattacharji, S. Formation of fractures around magmatic intrusions and their role in ore localization. Econ. Geol. 1975, 70, 781–799. [Google Scholar] [CrossRef]
  52. Strogen, D.; King, P.R. A New Zealandia-Wide Seismic Horizon Naming Scheme; GNS Science: Lower Hutt, New Zealand, 2014; p. 20. [Google Scholar]
  53. Lewis, S.D.; Behrmann, J.H.; Musgrave, R.J.; Cande, S.C. (Eds.) Proceedings of the Ocean Drilling Program, Scientific Results; D.W. Friesen & Sons Ltd.: Altona, MB, Canada, 1995; Volume 141, pp. 279–286. [Google Scholar]
  54. Littke, R.; Disko, U.; Rullkotter, J. Characterization of Organic Matter in Deep-Sea Sediments on the Chile Continental Margin with Special Emphasis on Maturation in an Area of High Geothermal Heat Flow. In Proceedings of the Ocean Drilling Program, Scientific Results; Lewis, S.D., Behrmann, J.H., Musgrave, R.J., Cande, S.C., Eds.; D.W. Friesen & Sons Ltd.: Altona, MB, Canada, 1995; Volume 141, pp. 119–132. [Google Scholar]
  55. Baumgartner, R.; Fontbote, L.; Spikings, R.; Ovtcharova, M.; Schaltegger, U.; Schneider, J.; Page, L.; Gutjahr, M. Bracketing the Age of Magmatic-Hydrothermal Activity at the Cerro de Pasco Epithermal Polymetallic Deposit, Central Peru: A U-Pb and 40Ar/39Ar Study. Econ. Geol. 2009, 104, 479–504. [Google Scholar] [CrossRef]
  56. Tanaka, A.; Yamano, M.; Yano, Y.; Sasada, M. Geothermal gradient and heat flow data in and around Japan (I): Appraisal of heat flow from geothermal gradient data. Earth Planets Space 2004, 56, 1191–1194. [Google Scholar] [CrossRef] [Green Version]
  57. Monreal, F.R.; Villar, H.J.; Baudino, R.; Delpino, D.; Zencich, S. Modeling an atypical petroleum system: A case study of hydrocarbon generation, migration and accumulation related to igneous intrusions in the Neuquen Basin, Argentina. Mar. Pet. Geol. 2009, 26, 590–605. [Google Scholar] [CrossRef]
Figure 1. (A) Location map of the study area (marked in black box in the center of the northern Taranaki Basin). (B) Time slice at 1984 ms through the variance seismic attribute showing Kora volcano edifice, several Northern Graben faults, and the location of the wells used in this study. (C) Map of the northern Taranaki Basin illustrating the volcanic complexes and location of the Kora volcano (modified after Giba et al. [22] and Bischoff et al. [12]).
Geosciences 09 00288 g001
Figure 2. Cretaceous–Cenozoic stratigraphic framework for the northern Taranaki Basin and interpreted horizons from this study. Principal source rock in the area (Waipawa Formation) is marked with a star (modified after King and Trasher, [20]; Stagpoole and Funnel, [15]). Not to scale. The interpreted horizons above Cretaceous and older basement (Base), are the Late Cretaceous (horizons K80 and K90), Cretaceous-Paleogene (horizons P00–P50), Paleocene-Eocene (horizon P10), Eocene (horizon P30), Eocene-Oligocene (horizon P50), Early Miocene (horizon N10), Middle to Late Miocene (horizon N40), Base Pliocene (horizon N60), Pliocene (horizons N70–N80), Top Giant Forests (Pliocene) and the modern seafloor.
Geosciences 09 00288 g002
Figure 3. Composite seismic line and interpretation of submarine Kora volcano (see Figure 1 for location). Gamma ray log with interpreted facies. Syn-volcanic sediments (N60–N10) have a wedge shape, whereas pre-volcanic sediments (P50–K80) are rather uniform in their thickness. GR = gamma ray log; TVD = true vertical depth. For location, see Figure 1. The ages of interpreted horizons ae indicated in Figure 2. The colors of the interpreted horizons on section B–B’ correspond to Zealandia-wide horizon name scheme.
Geosciences 09 00288 g003
Figure 4. Workflow for 3D models setup and petroleum system modeling.
Geosciences 09 00288 g004
Figure 5. Input data for basal heat flow (black line) and temperature evolution for Waipawa layer (blue line), taking magmatic intrusion at 11 Ma into account.
Geosciences 09 00288 g005
Figure 6. NW-SE sections from Kora 3D with projected Kora-1 and Kora-4 wells. (A) Inline 1205 with Kora-1 well projected on it from 300 m; (B) Inline 1127 directly intersecting Kora-4 well.
Geosciences 09 00288 g006
Figure 7. Seismic section illustrating the seismic anomalies captured within the 3D data set. All the seismic sections are in time. See (A) Normal faulting; (B) Bright spots; (C) Volcanic intrusions; (D) Channels in the different sections.
Geosciences 09 00288 g007
Figure 8. Selected depth maps for the interpreted horizons: (A) Seabase; (B) Pleistocene-Pliocene progradational system (Horizon 3); (C) Pleistocene-Pliocene progradational system (Horizon 6); (D) Late Miocene; (E) Oligocene base; (F) Economic basement.
Geosciences 09 00288 g008
Figure 9. Isopach maps showing the thickness of key intervals that represent the major sedimentary and tectonic stages in the northern Taranaki Basin. (A) Basement-P00: syn-rift stratigraphic unit; (B) P00–N40: post-rift stratigraphic unit; (C) N60–N40: foreland basin stratigraphic unit; (D) N70–N80: progradational system. Contour line increment 200 m.
Geosciences 09 00288 g009
Figure 10. (A) Burial history with temperature overlay for Kora-4 well with intrusion emplacement at 11 Ma in Paleocene and Late Cretaceous layers. (B) Temperature changes in the surrounding sediments affected by intrusion emplacement. (C) Temperature changes for the time span 0 to 15 Ma for the scenario with deep seated intrusion placed at 11 Ma. (D) Temperature changes for the time span 0 to 15 Ma for the scenario without intrusion. MIS=magmatic intrusion in sediments; MIB = magmatic intrusion in basement.
Geosciences 09 00288 g010
Figure 11. Vitrinite reflectance curves for three scenarios for Kora-1 and Kora-4 wells. Blue curve represents the base case scenario without intrusion; Red curve-magmatic intrusion in sediments at 11 Ma; green curve—scenario with magmatic intrusion in basement (200 mW/m2) at 11 Ma.
Geosciences 09 00288 g011
Figure 12. Vitrinite reflectance calibration for scenarios with intrusion emplacement. Only Kora-1 well has the best calibration with intrusion modeling. Kora-4, Tangaroa-1, Ariki-1 vitrinite reflectance data show a minor increase in the Miocene Volcanics unit and below it. The best calibration for these data is obtained by increasing the layer temperature to 100–150 °C. This might be indicative of hydrothermal fluid circulation.
Geosciences 09 00288 g012
Figure 13. Maturity overlay on the burial history for Kora-4. The model shows thermally immature rocks in blue and over-mature rocks in yellow. The oil and gas windows are green and red, respectively. (A) magmatic emplacement in sediments at 11 Ma; (B) magmatic intrusion in the basement at 11 Ma.
Geosciences 09 00288 g013
Figure 14. E-W transect through Kora 3D showing the distribution of the modeled facies.
Geosciences 09 00288 g014
Figure 15. Temperature overlay on the burial history plot for Kora-1 well for Miocene to present time. (A) magmatic intrusion in sediments at 8 Ma; (B) magmatic intrusion in sediments at 11 Ma; (C) magmatic intrusion in sediments at 18 Ma; (D) Blue line: magmatic intrusion in sediments at 8 Ma; red line: magmatic intrusion in sediments at 11 Ma; black line: magmatic intrusion in sediments at 18 Ma; (E) Maturity curves for three scenarios. Colors of the lines as in (D).
Geosciences 09 00288 g015
Figure 16. (A)–(C) Maturity change at the unit of Waipawa Formation before and after intrusion. (D)–Present day temperature at Waipawa Formation.
Geosciences 09 00288 g016
Figure 17. Transformation ratio plots for Kora-1 and Kora-4 illustrating three scenarios: magmatic intrusion, deep seated intrusion and base case scenario without intrusion.
Geosciences 09 00288 g017aGeosciences 09 00288 g017b
Figure 18. 1D models of Kora-1 well showing the sensitivity of the system to changes in (A) change of the basal heat flow during volcanic activity, and (B) sill intrusion thickness.
Geosciences 09 00288 g018
Figure 19. Petroleum system chart for the study area.
Geosciences 09 00288 g019
Table 1. Velocity ranges calculated from check-shot data used.
Stratigraphic UnitV Min/Max (m/s)
Seabed1500
N801786
Prograd 12250
Prograd 22300
Prograd 32592
Prograd 42600
Prograd 52700
N702900
N603050
N403500
Volcanic base4800
P503100
P303300
P103600
P003800
K904100
K804200
Economic basement4800
Table 2. Summary of lithostratigraphy intersected by Ariki-1 well in the northern Taranaki Basin. Thermal conductivity data adopted from Funnell et al. [44]. Lst = Limestone; Org = organic.
Formation NameAge [Ma]Depth [m]Thickness [m]Dominant LithologyThermal Conductivity
[W/(mK)] at 20 °C[W/(mK)] at 100 °C
Giant Foresets0150297Shale 60%; Siltst 35%; Limest(shaly)5%2.12.03
1.6447503Shale 60%; Siltst 35%; Limest(shaly) 5%2.12.03
2.5950385Shale 50%; Siltst (org lean) 50%32.7
31335815Shale 70%; Siltst (org lean) 30%3.22.84
Ariki 52150106Marl 40%; Shale50%; Silt (org. lean) 10%2.92.62
Mohakatino / Upper Manganui 82256134Shale 30%; Tuff 50%; Σ(Pyrite, Chlorite, Quartz, Olivine)=20%2.62.4
Mohakatino102390175Sandst 10%; Tuff 70%; Σ(Pyrite, Chlorite, Quartz, Olivine)=20%2.62.4
Moki Equivalent 132565351Silt 70%; Sandst30 %2.82.54
Lower Manganui172916431Shale (organic rich)2.82.54
Taimana Fm.22334738Marl2.72.47
Tikorangi233385226Lst 50%; Marl 50%2.72.47
Tangaroa31361111Sandst (arkose)2.42.47
31.536228Sandst 70%; Lst 30%2.42.25
32363094Sandst (arkose)2.42.25
Turi upper363724214Shale 60%; Marl 30%; Sandst 10%2.32.18
42393858Shale 70%; Lst 30%2.72.47
563996111Silt (organic lean)2.62.4
Waipawa58.7410712Shale (black)0.91.15
Turi lower61.24119200Silt (organic lean)2.62.4
North Cape664319319Silt 50%; Sandst 50%3.12.76
804638124Shale (sandy)3.22.84
Base11047622238Quartzite3.63.13
Table 3. Parameters of the source rock used as an input data for the model (from Johasen [41]).
AgeSource Rock UnitTOC (wt.%)HI (mgHC/g TOC)Depositional EnvironmentType
PaleoceneWaipawa Black Shale 9.8445Deep marineII/III
Table 4. Parameters of the igneous intrusion, used in Intrusion tool in Petromod for modeling magmatic activity.
LithologyAge [Ma]Intrusion Temperature [t°C]Magma Dencity [kg/m3]Magma Heat Capacity [kcal/kg/K]Crystallization Heat [MJ/m3]
Andesite (igneous)1195027500.7700

