1. Introduction
The Upper Jurassic (Oxfordian Age) Smackover Formation is a significant source for hydrocarbon production in the Gulf of Mexico region. The Little Cedar Creek and Brooklyn fields in southeast Conecuh County, Alabama, have been a major producer of oil and natural gas, containing more than 79 producing wells. As of October 2018, total production from the fields was 59.400 million cubic feet (MMCF) of natural gas and 42.748 million barrels (MMbbl) of oil [
1]. Exploration for Smackover Formation production in Alabama is primarily based on seismic profiles that target microbial buildups overlying paleo topographic highs of Paleozoic basement material [
2,
3,
4,
5].
The purpose of this study was to determine if abundances of selected elements could be correlated to the different depositional facies within the Smackover Formation in Little Cedar Creek and Brooklyn fields. Elemental concentration is commonly used in chemostratigraphy and can produce signatures that may be unique to the basin or a formation. These signatures can be used to better understand the stratigraphy and the petroleum reservoir characteristics with a specific focus on predicting porosity. In this study, high-resolution elemental scans of core were collected using X-ray fluorescence (XRF) to capture elemental distribution. Elemental logs were generated and compared to petrophysical logs for advanced well logging, chemostratigraphy, and reservoir characterization within Little Cedar Creek and Brooklyn fields.
2. Geologic Setting
The Gulf of Mexico began to develop during the Late Triassic as a result of the initiation of rifting within the North American Plate and detachment from the African Plate and South American Plate [
6]. This period of rifting continued until the Middle Jurassic and is recognized as the first of two distinct techno-stratigraphic periods in the Gulf of Mexico. During the first period of rifting, from the Late Triassic to the end of the Middle Jurassic, subsiding grabens and rift basins in the region controlled stratigraphic events. Thick sequences of non-marine clastic rocks and associated volcanic rocks characterized this period of rifting [
6]. A second period of rifting followed during Late Jurassic. After a period of prolonged subsidence in the central portion of the Gulf of Mexico, the basin was rimmed by stable shelves and ramps composed of shale and limestone facies. These sedimentary units defined the Upper Jurassic sequence [
3,
6].
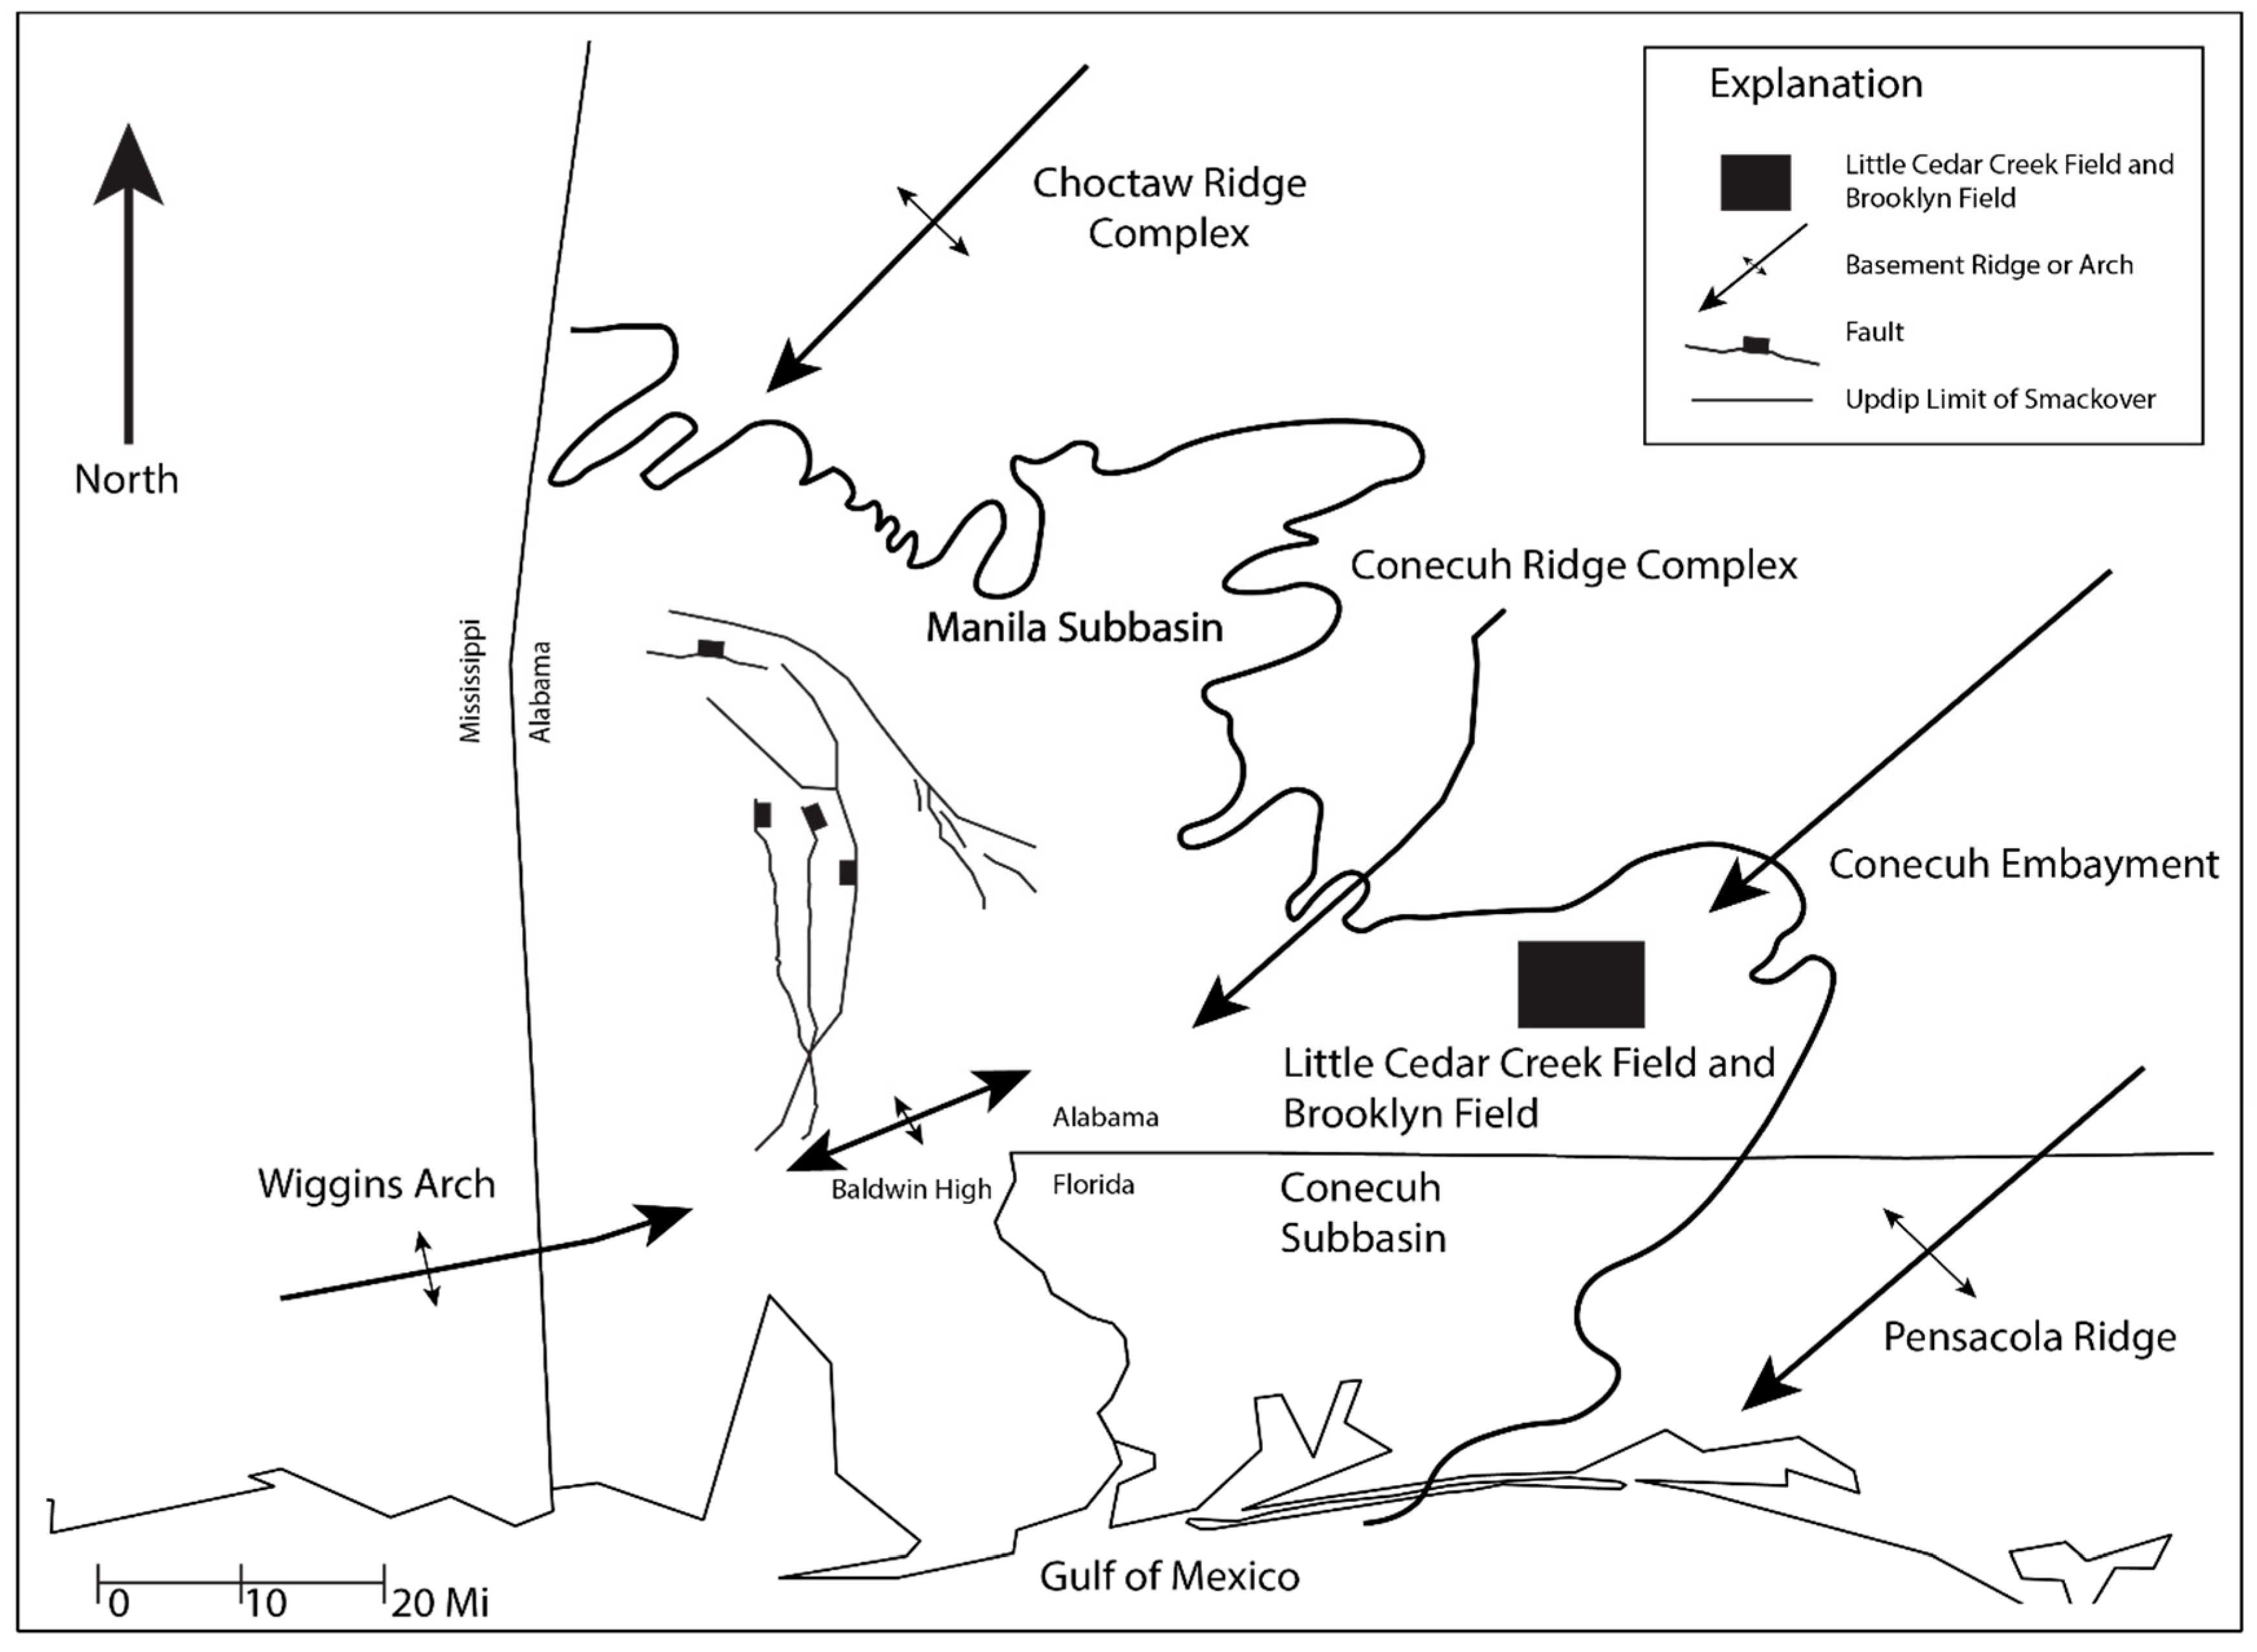
Southwest Alabama is located on the northern perimeter of the Gulf of Mexico basin (
Figure 1). Sedimentary units in this region result from deposition from the Jurassic Period to the present-day. Paleozoic rocks of the Appalachian system uncomformably underlie the Mesozoic and Cenozoic formations [
7,
8].
The tectonic framework of the region controlled the depositional setting of the Smackover Formation on a carbonate ramp that gradually dips south to southwest [
8,
12,
13,
14]. Deposition of the Smackover Formation in southwest Alabama was heavily influenced by local paleotopography, salt tectonics, and adjacent basins [
12,
13,
15].
2.1. Regional Stratigraphy
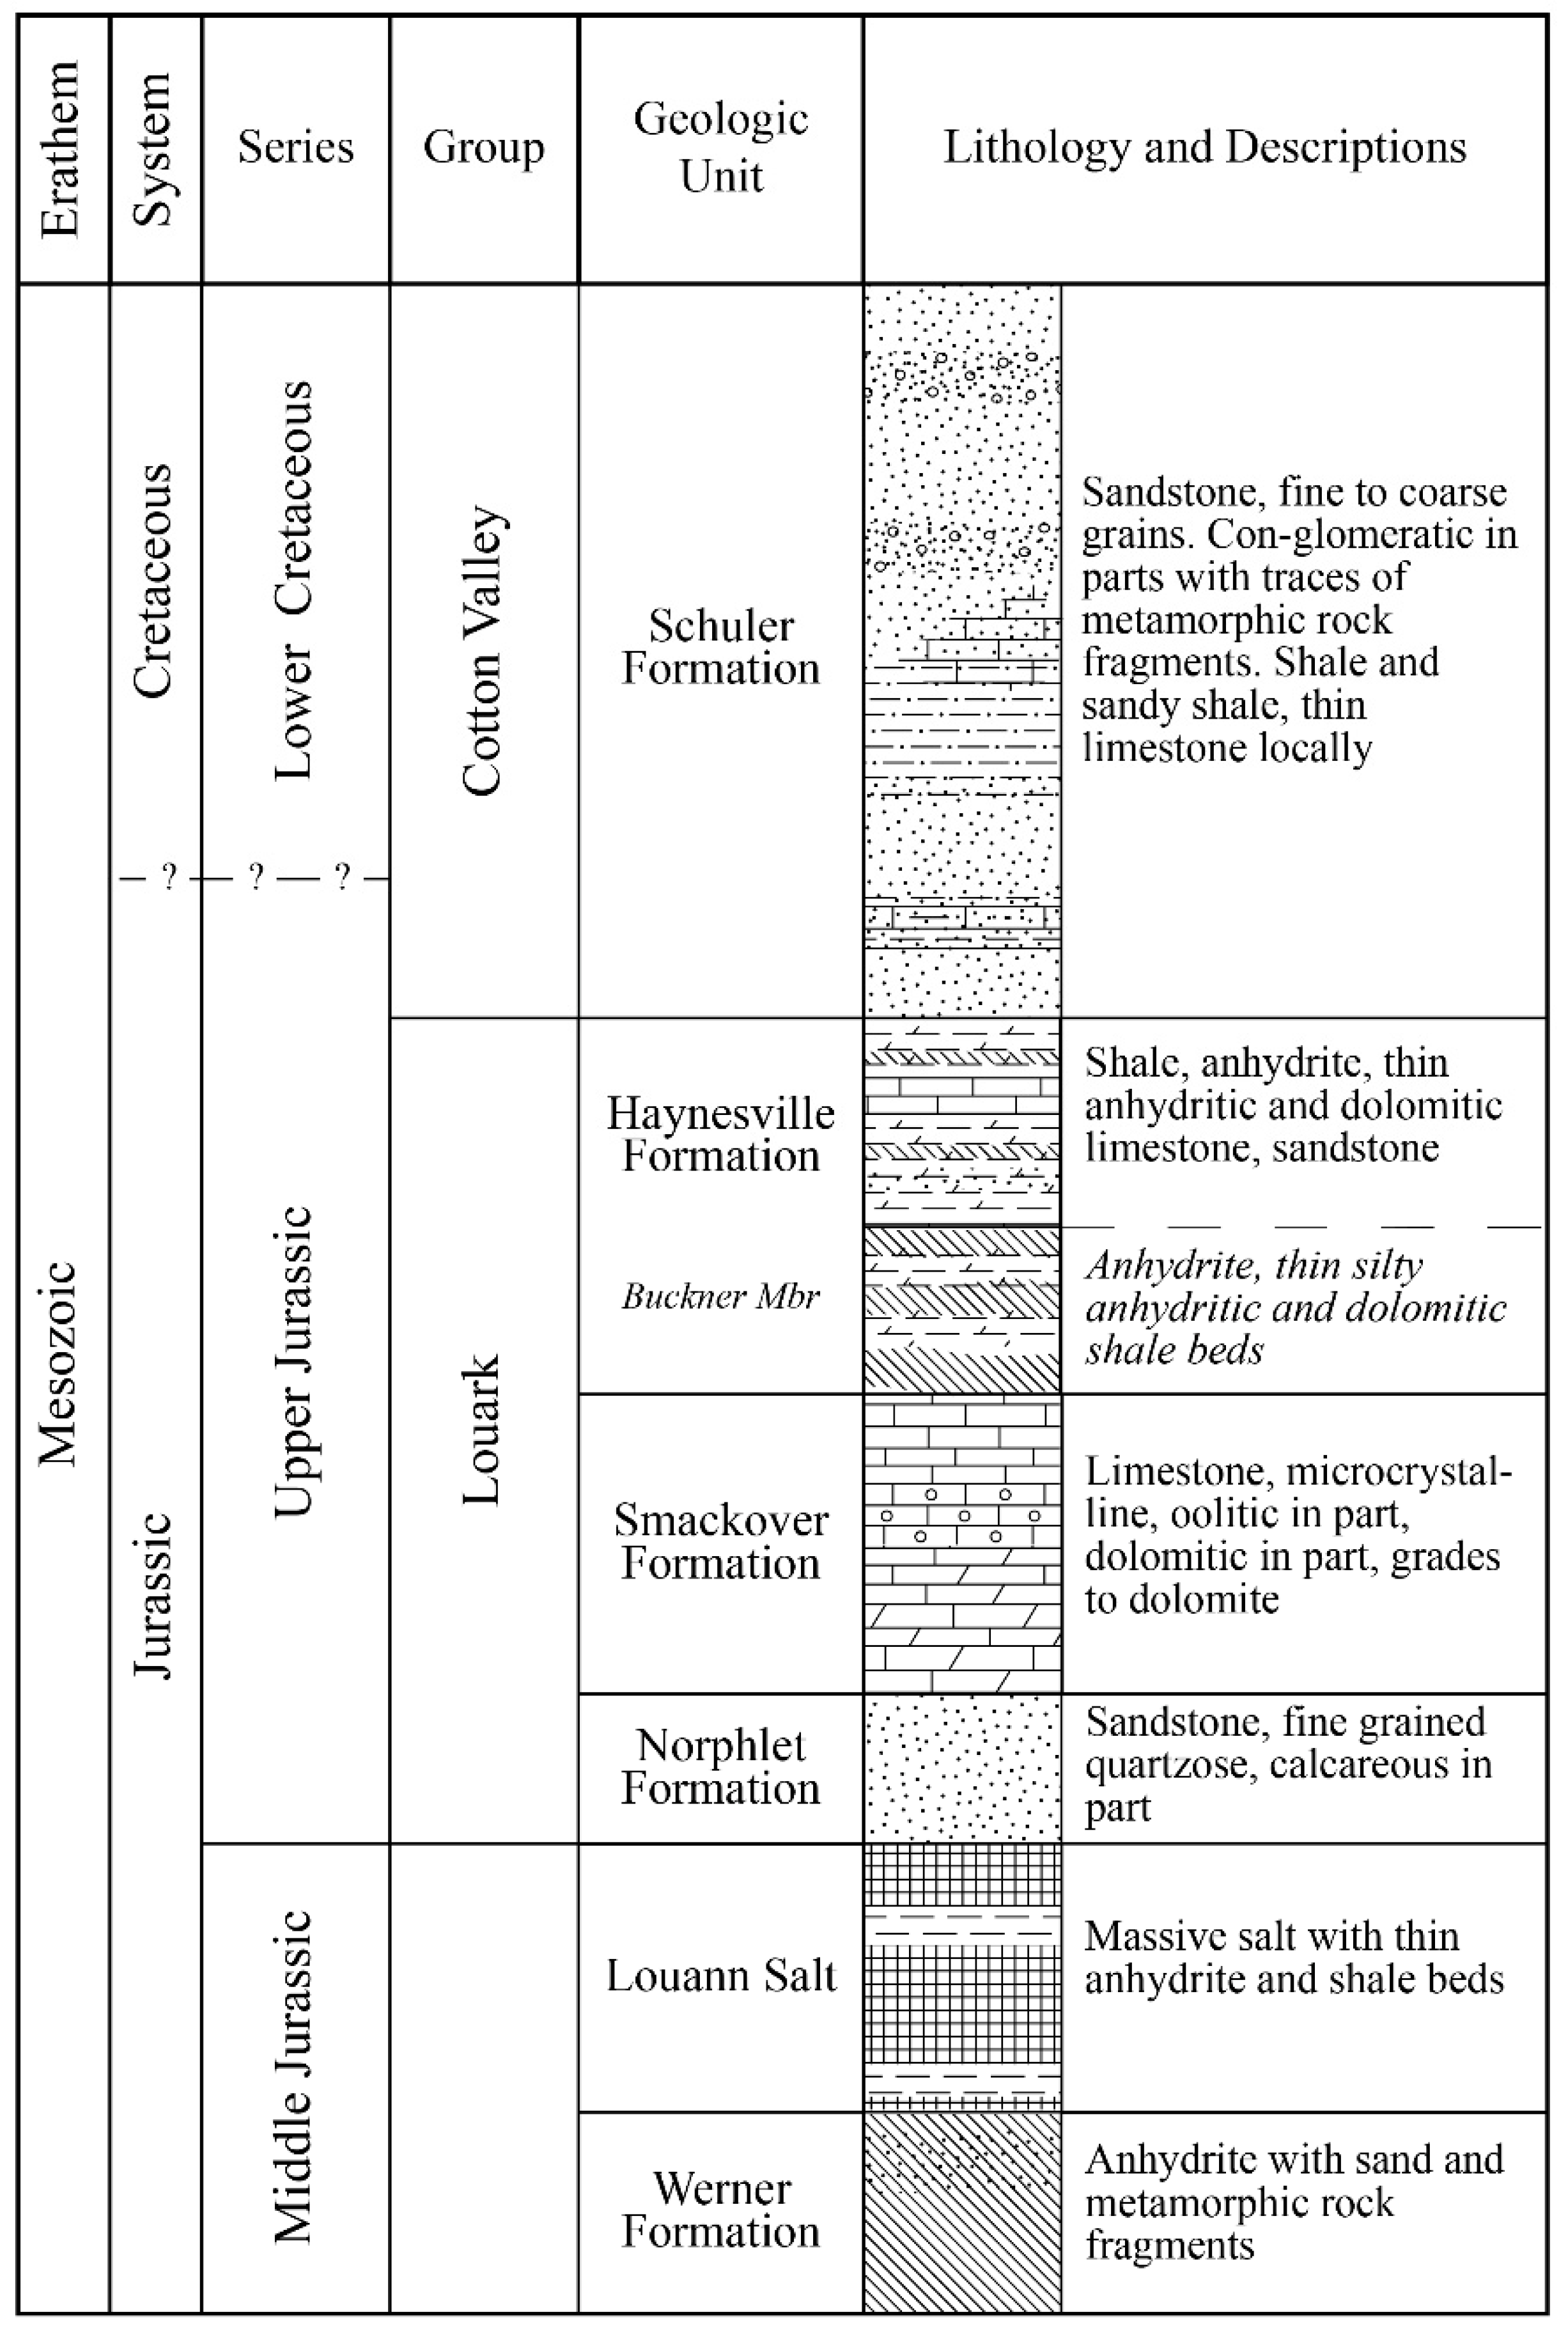
The Haynesville Formation, Smackover Formation, and the Norphlet Formation define the regional Upper Jurassic units (
Figure 2). The Upper Jurassic stratigraphic units within the region represent a conformable and transgressive sequence consisting of clastic, carbonate, and evaporate deposition [
6,
7,
16]. Each unit oversteps the preceding one and pinches landward. This is interpreted as coastal onlap due to a eustatic sea-level rise [
6]. Smaller regressive episodes have been identified within the overall transgressive cycle of the Upper Jurassic sequence [
6,
17].
2.1.1. Norphlet Formation
The Norphlet Formation is the lowest Jurassic formation in the study area and is composed mostly of sandstone and conglomeratic sandstone of varied lithologies that are influenced by the source of the detrital material, transporting agent, and depositional position within the basin [
6]. In southwest Alabama, the Norphlet Formation is composed of fine- to medium-grained, well-sorted mature sandstone. Grains are commonly well-rounded and coated with hematite. Based on the high-angle cross-bedding and the lack of detrital clay matrix, these sandstones have been interpreted as eolian sands. These eolian strata grade laterally updip in a northeast trend into a section of siltstone, arkosic sandstone, and conglomeratic sandstone. Within Little Cedar Creek and Brooklyn fields, the top of the Norphlet Formation consists of conglomeratic-brecciated sandstone composed of igneous and metamorphic pebbles that are interpreted to represent deposition in coalescing alluvial fans and fluvial systems [
18].
2.1.2. Smackover Formation
The Smackover Formation is an Upper Jurassic (Oxfordian Age) unit consisting of limestones and dolostones. The Smackover Formation uncomformably overlies the Norphlet Formation and is interpreted as the opening of the basin to widespread marine flooding [
12,
18,
19]. In southwest Alabama, approximate depth to the Smackover ranges between 5000 feet and 20,000 feet. Three general lithofacies are recognized for the Smackover Formation in the surrounding Gulf of Mexico area: the lower, upper, and clastic members [
20,
21].
The lower member is described as a thin intertidal to subtidal series of laminated carbonate mudstone and peloidal oncolitic wackestone and packstone [
12,
22]. The middle unit is a thick interval of subtidal to supratidal laminated carbonate mudstone with interbedded peloidal and skeletal wackestone and packstone. Indications of subtidal deposition are found throughout the laminated carbonate mudstone. The upper unit is described as a series of subtidal to intertidal oolitic grainstone and packstone that are interbedded with laminated carbonate mudstone. Throughout the upper Smackover, an algal boundstone is associated with local paleohighs, such as the Choctaw and Conecuh ridge complexes [
12,
23].
2.1.3. Haynesville Formation
The Haynesville Formation is a Kimmeridgian-age unit composed of evaporitic deposits and anhydritic shale and sandstone [
10]. The Haynesville Formation is divided into three separate units: lower, middle, and upper. The lower unit is defined as the Buckner Anhydrite Member, which conformably overlies the Smackover Formation [
12,
16]. The Buckner Anhydrite Member consists of massive anhydrite with intercalated dolomite beds. If the massive anhydrite is not present, the lower part of the Haynesville consists of anhydrite, shale, sandstone, thin anhydrite beds, and salt stringers. The middle unit is described as interbedded sandstones, shales, and anhydrites. The upper unit of the Haynesville Formation is composed of interbedded carbonate mudstone, dolomitic limestone, sandstone, shale, and anhydrite [
12,
16].
2.2. Local Stratigraphy
The upper Smackover within Little Cedar Creek and Brooklyn fields in southwest Alabama is characterized by seven distinct lithofacies. These lithofacies’ descriptions were based on petrographic analysis conducted by [
18,
19,
21] and are generalized in
Table 1. These lithofacies formed the basis for correlating the XRF data to the productive units.
3. Petroleum System
The Smackover Formation is one of the most productive oil and gas units in Alabama, eastern Mississippi, and the Florida panhandle [
19]. Smackover reservoirs are characterized by combination traps including salt anticlines and stratigraphic traps, faulted salt anticlines, and extensional fault traps that relate to the updip limit of the Louann Salt deposition [
12,
16]. Hydrocarbon accumulation within Little Cedar Creek and Brooklyn fields has been defined as a dual-reservoir, stratigraphic trap near the updip depositional limit of the Smackover [
2]. The two productive reservoir facies within the Smackover Formation in Little Cedar Creek and Brooklyn fields are characterized as a leached subtidal microbial (thrombolite) boundstone (lower reservoir) and a peloidal-oolitic shoal grainstone-packstone (upper reservoir) [
21,
24]. The dual-reservoir system of Little Cedar Creek and Brooklyn are vertically separated by a lime mudstone and are not in communication [
2,
22]. Porosities of the Smackover Formation present in the two fields range from 3 to 36 percent. Porosity values in the nearby producing fields of northern Escambia County range from 6 to 30 percent [
25]. By contrast, at locations further west, the porosity of grainstones at Black Creek field in Mississippi determined from core analysis is less than 1 percent. The porosity was filled by cementation [
26].
4. Materials and Methods
The Alabama Geological Survey and the Alabama Oil and Gas Board provided the materials used in this study. Materials consisted of rock core samples, rock core analyses, and petrophysical logs of the Smackover Formation.
4.1. Well Selection and Sample Preparation
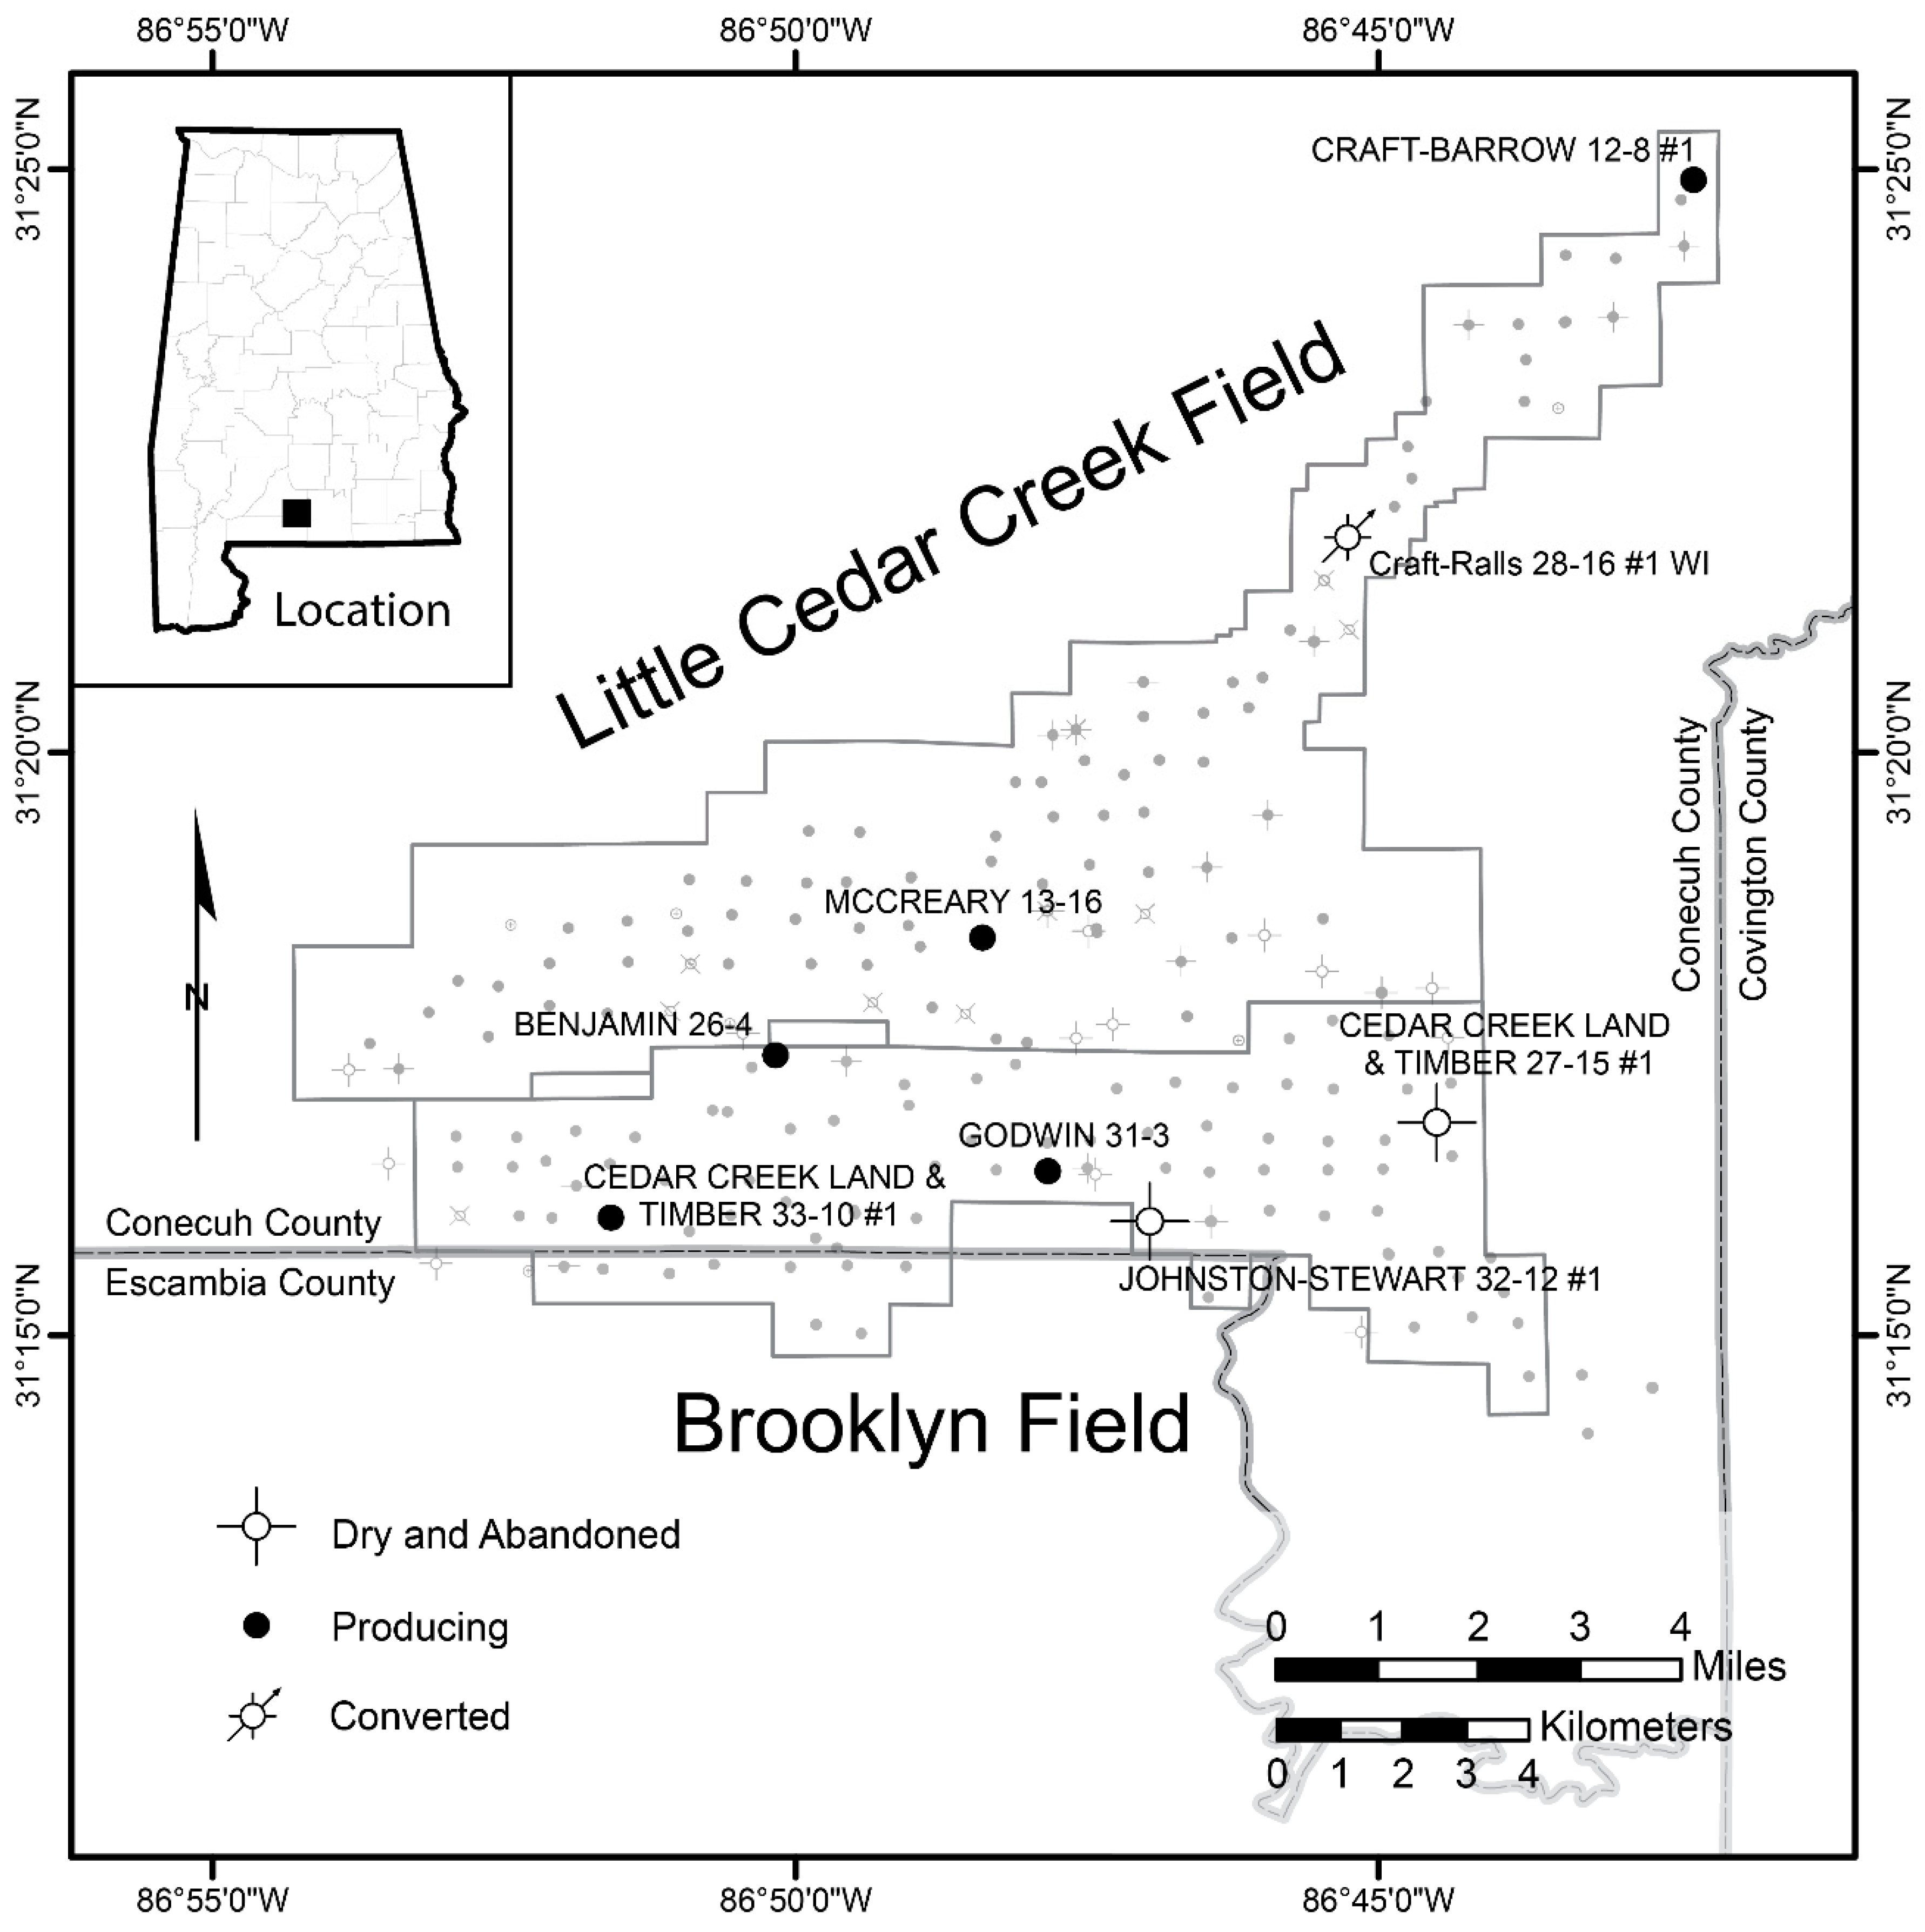
Using scout tickets and available well logs, eight wells were selected for scanning. Cores were scanned from these wells in six-inch intervals using a portable XRF device (
Table 2).
Figure 3 shows the location of the wells from which the core scans were conducted. Wells were selected based on their location and the availability of data from the Smackover Formation. The cores were one-third slabbed providing a flat surface for scanning. This allowed for a fast workflow and consistent instrument orientation. Cedar Creek Land and Timber 33-10 #1 and Johnson-Stewart 32-12 #1 were tested for core sample preparation. Using a clean, dry, 2-inch brush, the sample was cleaned for scanning. This method detected elements not normally associated with carbonate-dominated lithologies, such as barium. Barium, however, is a common component in drilling fluids. We modified our scan specimen preparation by cleaning the surface of each core slab with deionized water. Further testing showed no detectable barium, indicating that the dust on the core was drilling fluid related. The standard preparation for each core box was to mist each length of slabbed core with deionized water and wipe clean with a cloth, being careful not to damage the surface or edge of the core. Note that great care was given to core preparation so that random surface contamination was all but eliminated.
4.2. X-ray Fluorescence
X-ray fluorescence (XRF) is based on the theory that atoms will emit X-ray photons when charged by an outside energy source. The contact between high-energy X-rays and electrons from the inner electron shell will eject an electron from that shell. With a lower energy slot now available, an electron from a higher energy shell shifts to fill the vacancy. The surplus of energy is emitted (fluoresced) as a secondary photon of X-ray energy, typically from 0.1 to 5 keV for K shell X-rays for lighter elements (e.g., Z = 4–24; Be to Cr) and approximately 0.6–15 keV for L and M shell X-rays for heavier elements (e.g., Z = 25–95; Mn to Am). The loss of energy emits radiation from the inner electron shell, which are X-ray photons that classifies the elements. The concentration of the element is defined by the count rate of emitted X-rays per unit time.
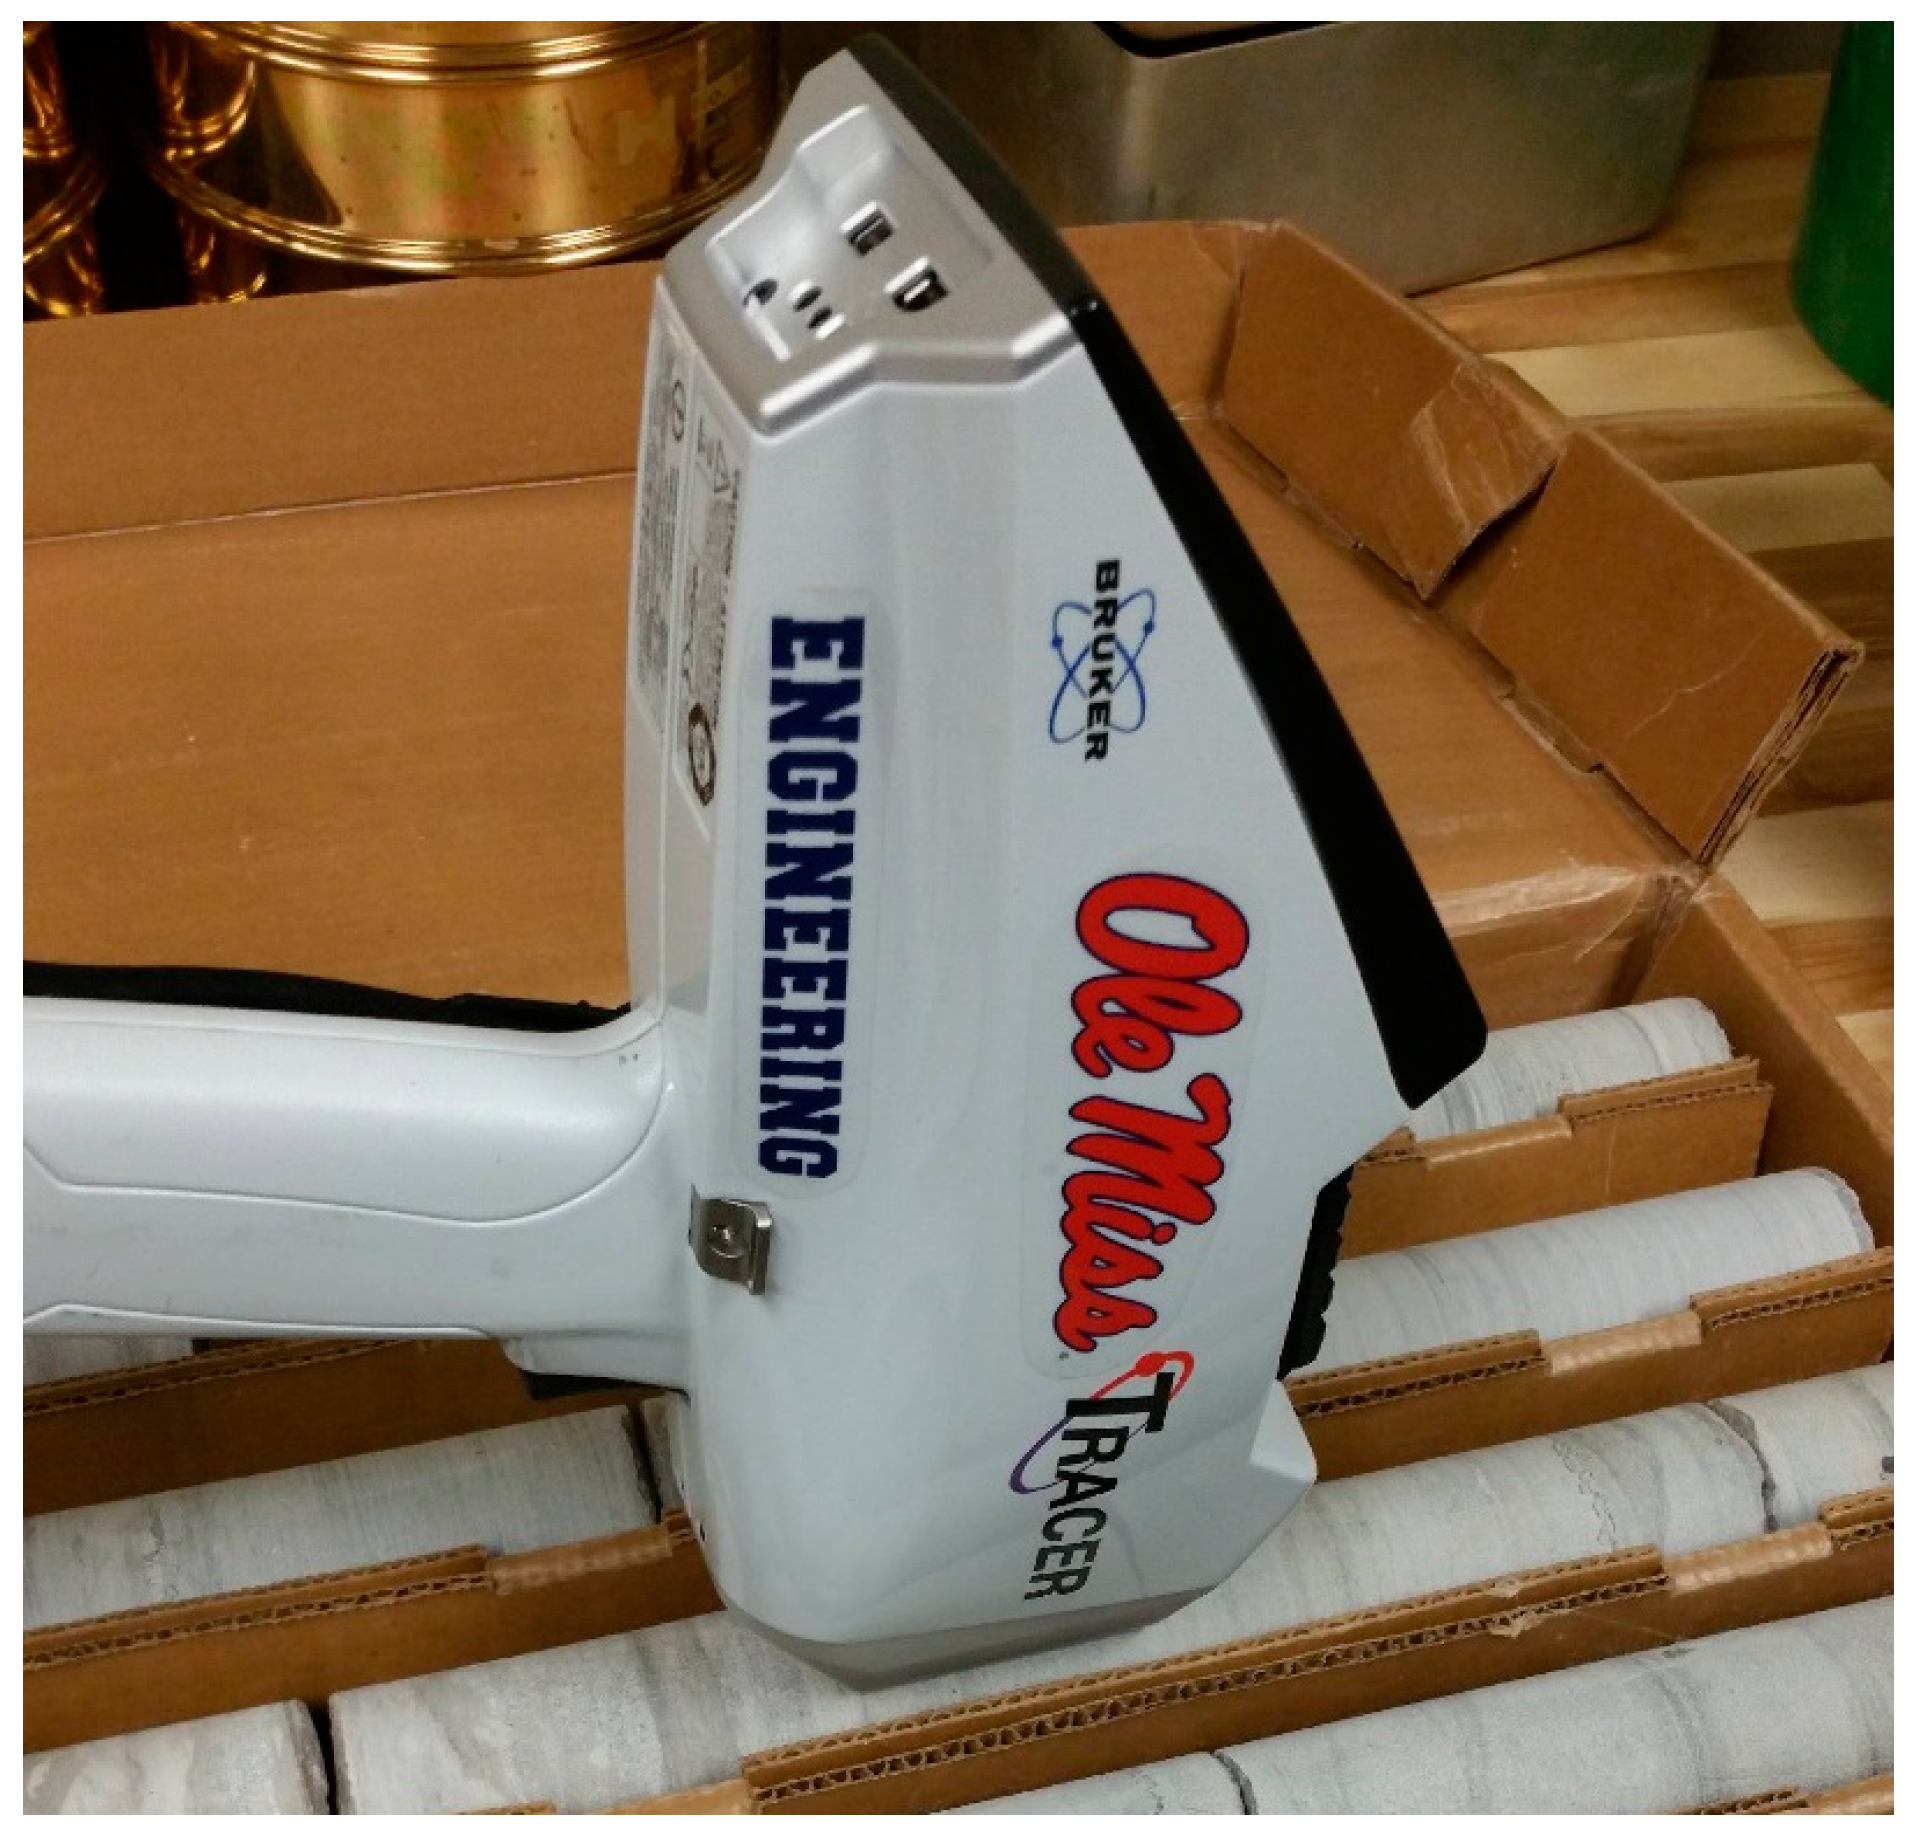
To employ the XRF method, we used the Bruker TRACER 5i (
Figure 4). It is a handheld portable non-destructive energy dispersive X-ray fluorescence (ED-XRF) spectrometer capable of collecting elemental concentrations from most sample surfaces. Data collected by the TRACER 5i are reported in counts per second (cps) then processed to parts per million (mg/kg) or weight percent (wt%) using a selected calibration. The TRACER 5i has many available calibrations, and user-created calibrations are possible if there are adequate standards. The calibration applied for this study was the mudrock calibration provided by Bruker [
27]. A reference sample was used to assure measurements were consistent with the calibration throughout the scanning effort. The rock core samples were scanned every six inches with no filter over the collimator. Resulting fluorescence spectra were processed and matched using the selected calibration. The major and minor elements are reported in units of the parts per million (
Table 3).
4.3. Chemostratigraphy
Chemostratigraphy is the geochemical classification and correlation of sedimentary strata by using major and trace element geochemistry. It is an especially valuable method when applied to sequences with poor biostratigraphic control [
28]. A fundamental aspect of chemostratigraphic data is its ability to improve lateral correlation of lithofacies. Chemostratigraphic zonation may be correlated to the facies identified in the Smackover Formation.
4.4. Porosity Data
In petroleum systems, porosity is one of the most important reservoir properties to characterize. In this study, we used core analyses performed by Weatherford Laboratories or Omni Laboratories. Plug samples were taken at approximate intervals between 0.3 and 1.1 feet along the core. These results include the basic rock properties of horizontal permeability, porosity (helium), pore volume saturation of oil and water, bulk saturation volume of oil and gas, and grain density. All data reports are provided by the Alabama Geological Survey State Oil and Gas Board Core Warehouse.
5. Results
Data from the XRF was tabulated by sample, depth, and elemental concentration. These tables are provided as
Supplemental Materials and show major and select trace elements along the selected subset of the full data collection (see
Tables S1–S8).
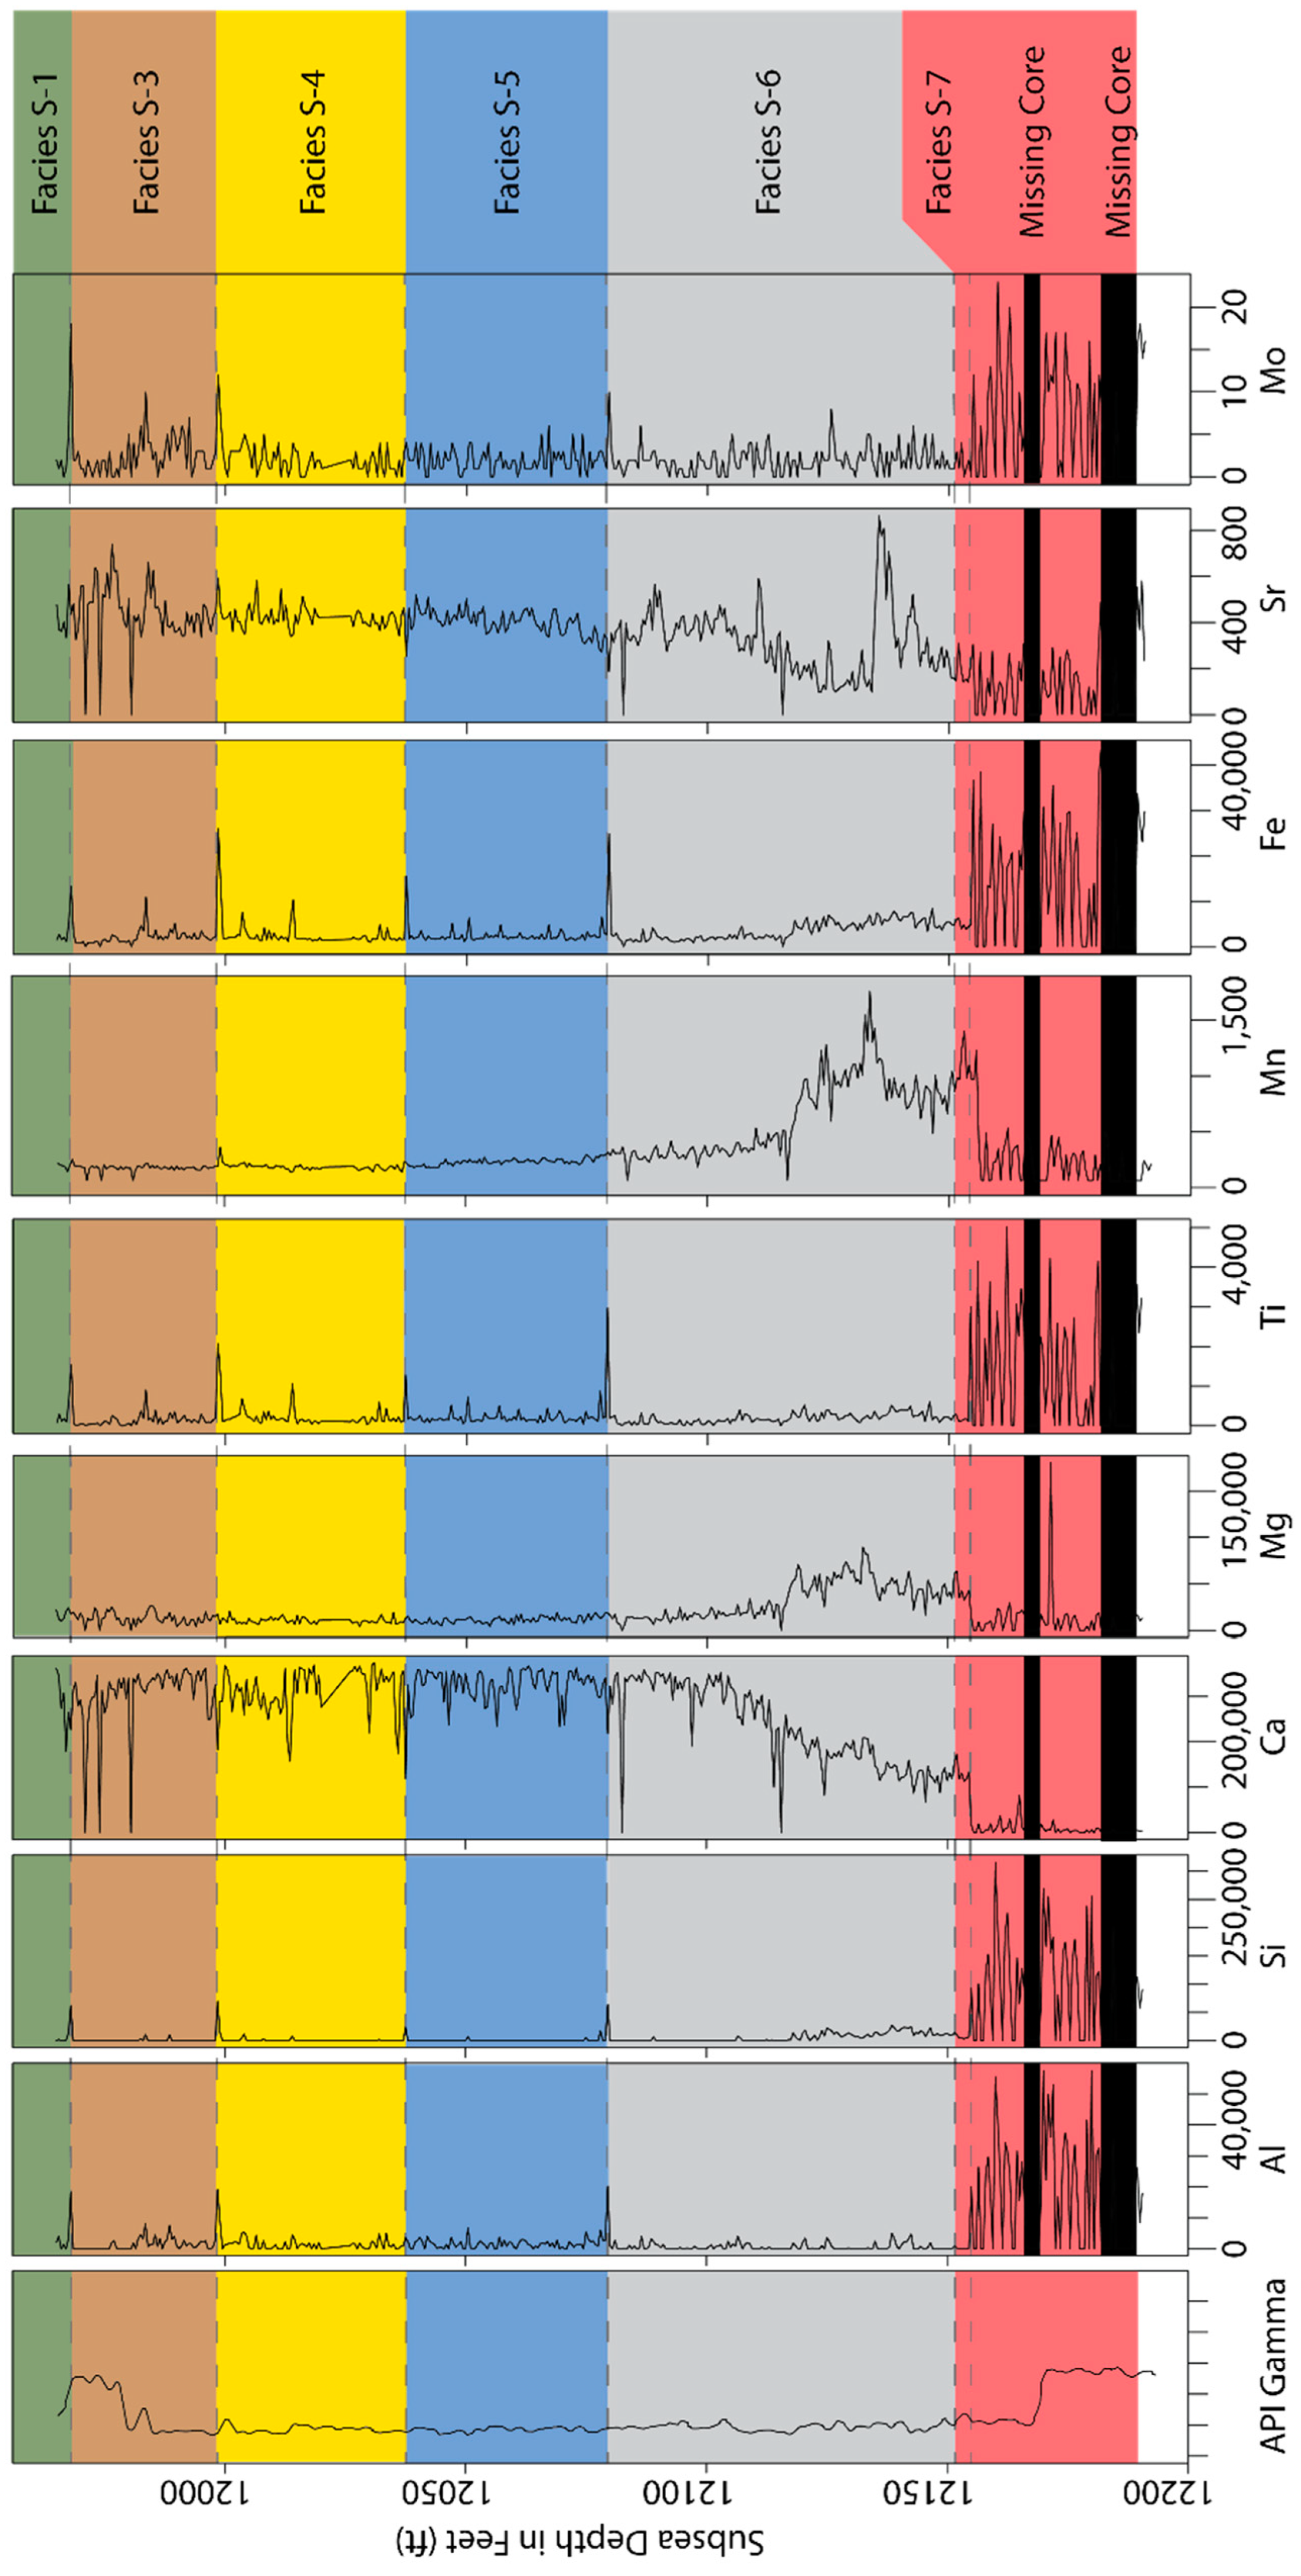
Figure 5 shows the log generated for major elements with lithofacies defined for Cedar Creek Land and Timber 33-10 #1 well. An example X-ray spectrum is provided in
Figure S1.
Multiple Regression Analysis
Using core porosity data and elemental data from the XRF analysis, multiple regression analyses were preformed to determine correlation between the variables. This was conducted on each of the eight wells in the investigation. Using the following relationship:
where
is the expected value of the dependent variable,
is equal to a constant term plus the sum of a series of independent variables. The dependent variable,
for the multiple regression was selected as core porosity and the
variables are the twelve elements selected for this study. The multiple regression analysis was conducted in three separate series for sensitivity analysis, in which individual samples of the elements were compared to porosity. For the first series of the F-test regression ANOVA, no restrictions were used and the entire sample population was used. The second series excluded outlier samples greater than four standard deviations from the sample mean (<±4σ). The final series further restricted outliers by excluding samples greater than two standard deviations (<±2σ). The summary of the ANOVA tables is provided in
Table 4.
6. Discussion
The results from the multiple regression indicate that the elements Al, Si, Ca, Ti, and Fe show the strongest correlation to porosity (
p-value < 0.05). The two elements most significant to accepting the alternative hypothesis of the F-test in regression of Equation (1) are Ca and Ti. Regardless of the sensitivity to sample exclusion in the ANOVA (
Table 4), both elements had very low
p-values and
F-values significantly larger than the critical F-value of 4.747 (α = 0.05). Al was the most affected by sample exclusion in the sensitivity analysis. As outliers of Al concentrations were removed from consideration, the significance to reject the null hypothesis was considerably reduced going from
p-value = 0.008 with no restrictions on the data population to a
p-value of 0.333 when excluding Al concentration greater than two standard deviations of the mean. The large variance of Al and its relationship to porosity may be related to the presence of clay minerals in the pore space, thereby reducing porosity.
Changes between lithofacies are visually well-correlated with elemental distribution logs produced from the XRF results (
Figure 5). Delineation of the lithofacies zones is not possible using only the gamma log data. Only the occurrence of mudstones in the transgressive facies S-7 and the top of facies S-3 shows any significant response in the gamma log data. Peaks in occurrence of Mo, Fe, Ti, Si, and Al occur at the tops of a majority of the different facies. These data may help in the delineation of the facies within the upper Smackover. No discernable visual differences were reported at these locations in the core. The gradational change from one lithofacies to the next can be difficult to see in the core. The relationship between these various elements and the facies in the upper Smackover can be separated into two categories: paleoenvironment and diagenetic modification. [
25,
26,
27,
28,
29].
6.1. Category 1: Paleoenvironment
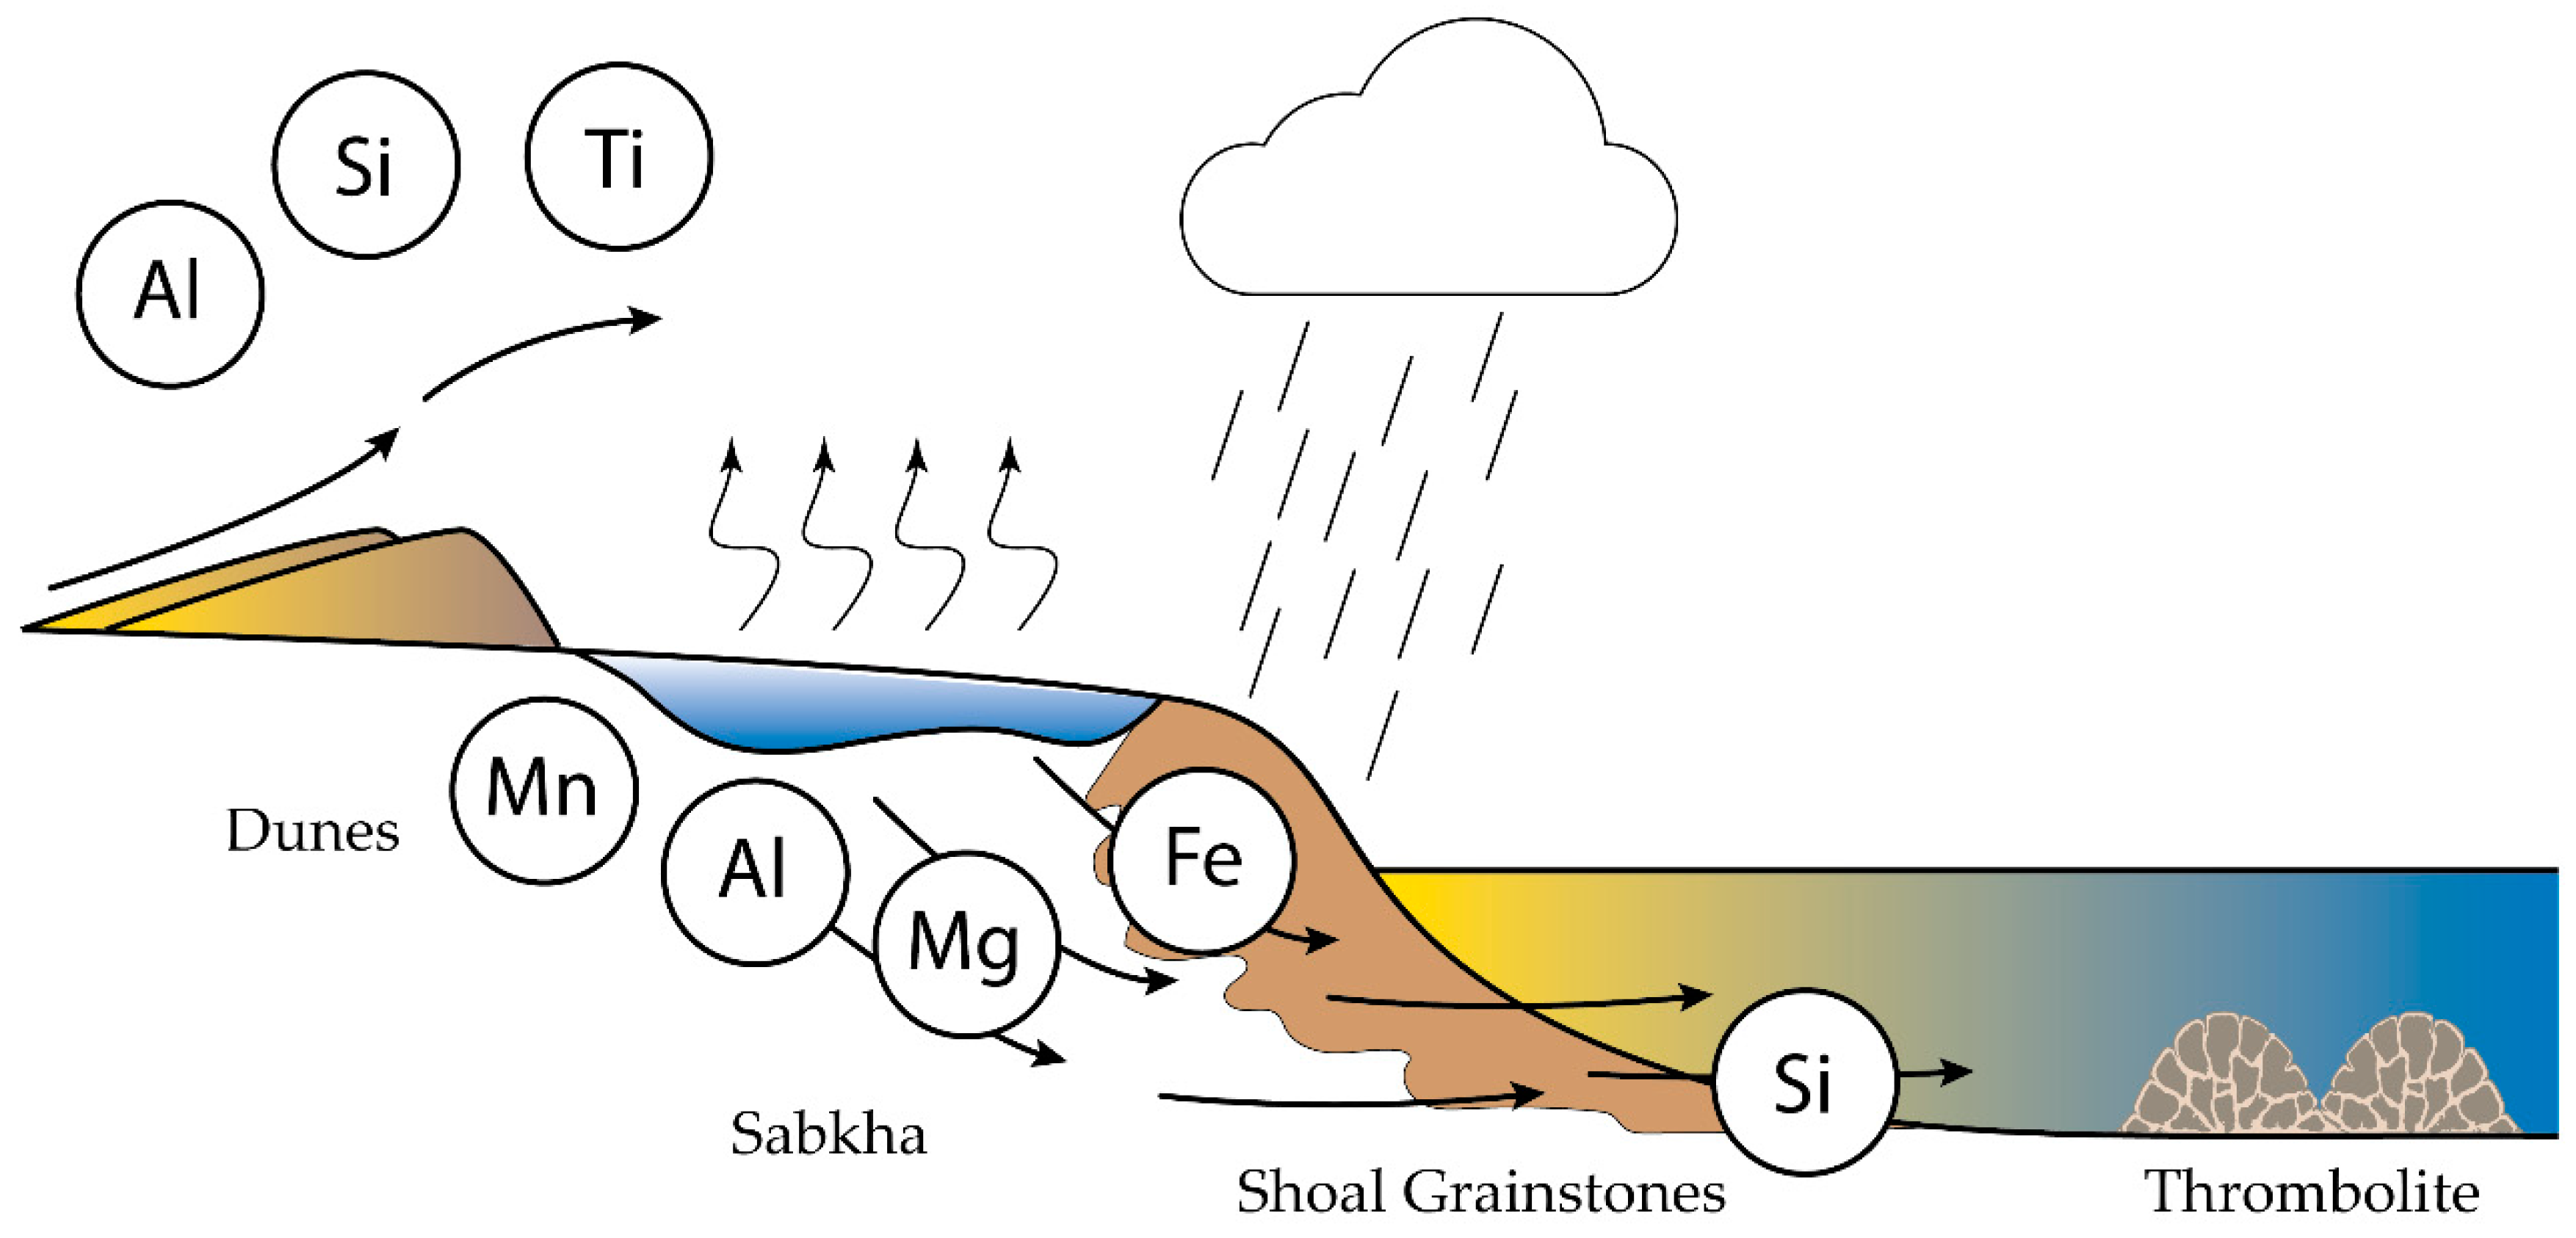
The first category distinguishes the paleoenvironment of the upper Smackover lithofacies. The depositional setting of the Smackover Formation was a carbonate ramp similar to the modern western Persian Gulf. The microbial buildups, shoal grainstones, and sabkha environments resemble the vertical facies of the Smackover Formation in Little Cedar Creek and Brooklyn fields. The elements Al, Fe, Si, and Ti all show high values from the XRF data at the transition from one facies to another. The transition from facies S-6 to S-5 has been interpreted as a transgression, while the transition from S-4 to S-3 has been interpreted as a regression. Deposition of both S-6 and S-3 occurred during periods of shallow water and a higher energy environment. The weathering of onshore igneous rock may be the source of dust size particles that were transported from onshore areas into the shallow water depositional systems. The combination of Al, Fe, Si may be related to the kaolinite and illite clay minerals that are weathering products of feldspar-rich rocks. Al is relatively unstable and is commonly found in authigenic clay minerals. It is worth noting that the mineralogy of the upper part of the Norphlet Formation commonly contains granite clasts and is commonly classified as arkosic sandstone. Titanium and silicon can relate to dust size particles [
30]. Thin clay stringers between lithofacies can be seen in the well cores. The elements Mn, Mg and Fe can have multiple mineralogical affinities. To identify the clay mineral constituents responsible for the elemental contributions, additional mineralogical data will be needed in future investigations.
Generally, enriched concentrations of Al, Si, Fe, Ti, Mg and Mo in sediments are attributed to terrigenous origins [
30,
31].
Figure 6 provides an illustration of paleoenvironment of the Smackover Formation and possible origins for the associated elements. The increased concentrations of Ti and Mo suggest that, at the time of the facies S-7 deposition, the area of Little Cedar Creek and Brooklyn fields was at greater proximity to terrestrial source materials than younger facies of the Smackover Formation. Si can exist in biogenic Si, so one cannot assume that it occurs in wind-blown quartz or other detrital minerals. Given the depositional framework of the Smackover Formation and enrichment of associated elements, terrestrial-derived sediments are likely the source of mudstone and wackstone found in facies S-7. Gravitational separation of heavy minerals is common and results in fractionation during transport [
30].
6.2. Category 2: Diagenetic Modifications
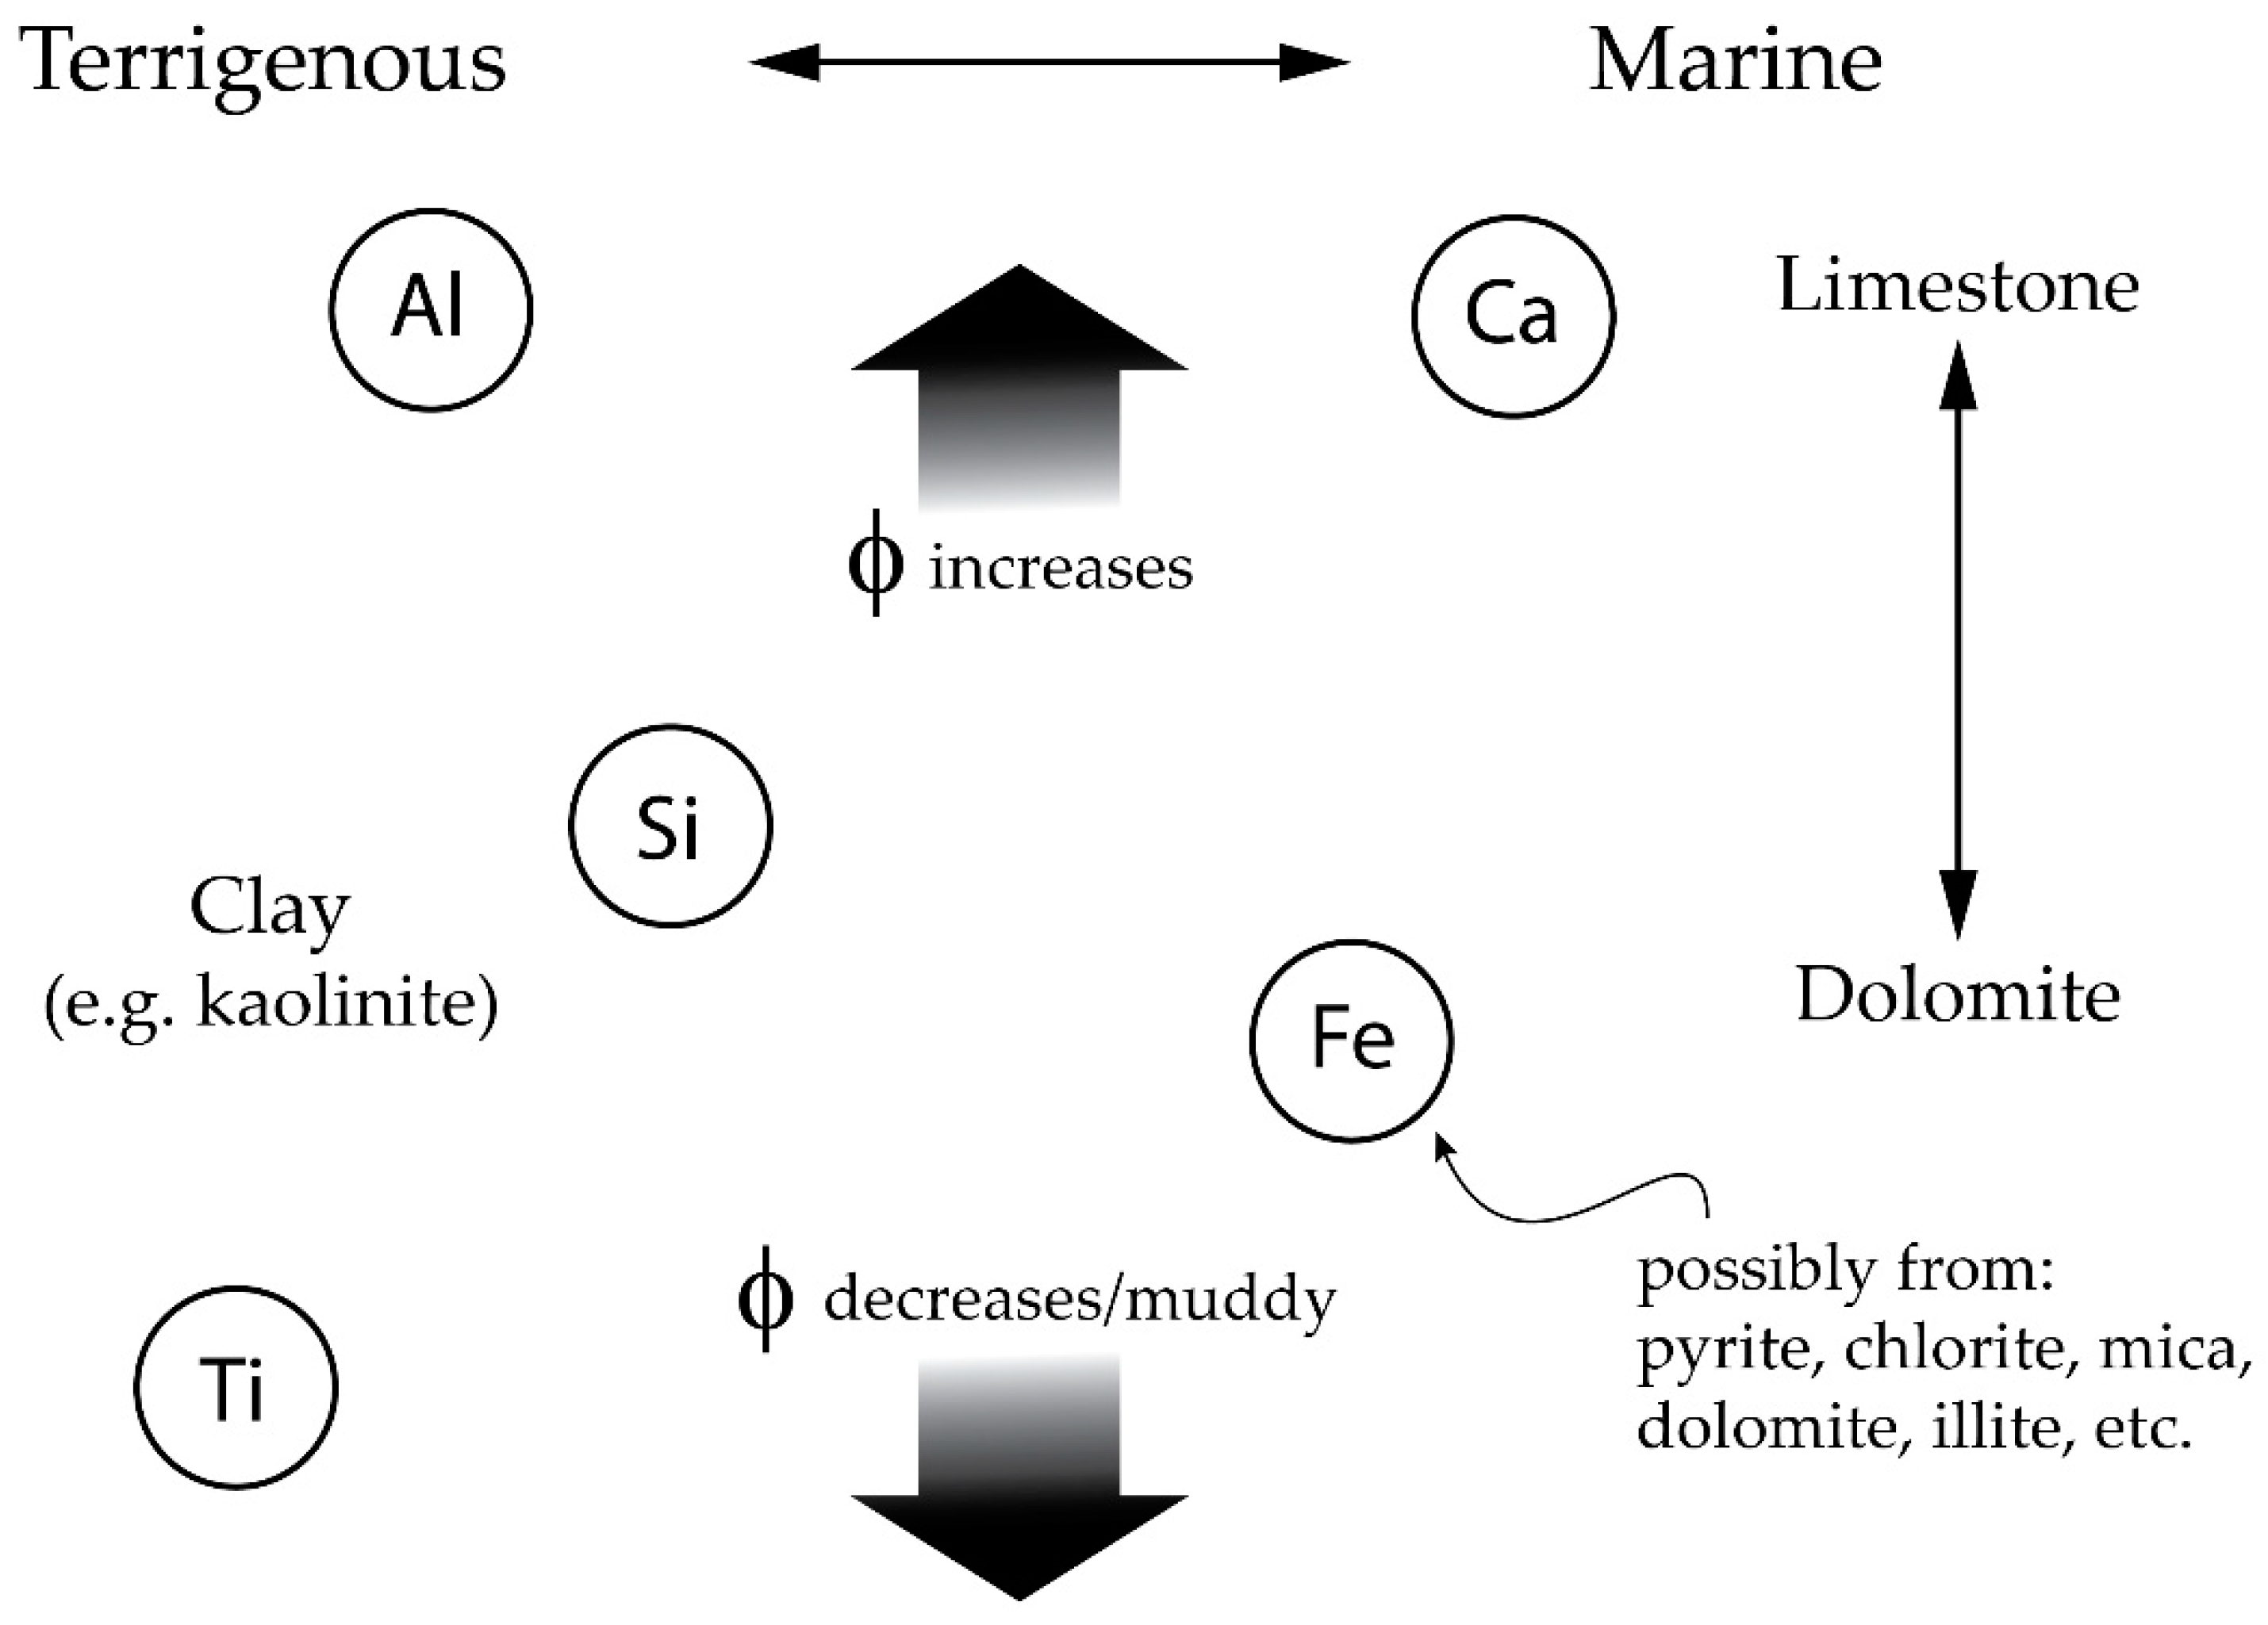
The second category is identifying the diagenetic effects of the upper and lower reservoirs that controlled porosity development.
Figure 7 shows a diagenetic framework in the context of porosity. The left side of the figure shows terrigenous origins for the elemental enrichments while the right side provides the marine and subaerial origins. Diagenetic modification within the Smackover Formation is primarily eogenetic dolomitization of the limestone and porosity reduction through cementation. Secondary porosity from dissolution occurred later, improved reservoir quality and potentially introduced other elements, including iron, magnesium and manganese, into the rock fabric.
Marine Phreatic Zone
Within the upper Smackover Formation, eogenetic diagenesis occurs in three separate zones. The marine phreatic zone is described as the first zone. Diagenetic alteration of ooids and other allochems within the upper reservoir, facies S-3, began soon after deposition. Deposition in relatively calm waters is conducive to extensive micritization. In the upper section of facies S-3, biogenic micritization is most noticeable where many ooids have been moderately to entirely micritized. Micritization generated micro-porosity within the ooids, making later diagenetic replacement or dissolution more prone [
29,
32].
Cementation that occurs within the marine phreatic zone is described as fibrous to bladed thin crust and is usually thicker in oolitic grainstones and thinner in oncolitic and peloidal grainstones. This relates to a surge of water circulation in higher energy ooid shoal environments, resulting in marine phreatic cements that generally define overall lithology of less than 5 percent [
29]. This suggests that sedimentation in the upper Smackover was abrupt and open to a marine phreatic environment for a short period of time.
7. Conclusions
The primary goal of this research was to determine if XRF data could provide information related to the different facies in the Brooklyn and Little Cedar Creek fields and potentially substitute for detailed log analysis. Porosity within the Upper Smackover in southwest Alabama originates from the depositional setting, and the degree of diagenetic alterations the lithology has experienced. Extensive dissolution and dolomitization are the contributing diagenetic factors that controlled porosity development. Using a multivariate regression, the various elements Al, Si, Ti, Fe, and Ca can be related to porosity, which is an important hydrocarbon production characteristic.
Generally, lithofacies boundaries are not visible on gamma ray logs. Various elements can describe the paleoenvironment of lithofacies in Little Cedar Creek and Brooklyn fields and the diagenetic controls that influenced them. Elemental contacts can distinguish between carbonate lithofacies based on increasing Al, Si, and Ti concentration peaks. Further research is needed to more completely explain the elemental peaks in XRF data that occur at or near the facies boundaries. Given the care in core preparation, these peaks are reliable values from the core matrix and not the result of contamination. Some of the elemental distributions may be related to deposition, while others may be related to post deposition diagenesis and later karst alteration.
Supplementary Materials
The following are available online at
https://www.mdpi.com/2076-3263/9/6/269/s1, Table S1: XRF elements for Johnson-Stewart 32-12 #1; Table S2: XRF elements for Mary Godwin 31-3; Table S3: XRF elements for Cedar Creek Land and Timber 33-10 #1; Table S4: XRF elements for Cedar Creek Land and Timber 27-15 #1; Table S5: XRF elements for Benjamin 26-4; Table S6: XRF elements for McCreary 13-16; Table S7: XRF elements for Craft-Ralls 28-16 #1 WI; Table S8: XRF elements for Craft-Barrow 12-8 #1.
Author Contributions
Conceptualization, L.D.Y. and G.E.; methodology, R.A.E. and L.D.Y.; validation, R.A.E. and L.D.Y.; formal analysis, R.A.E.; resources, G.E. and L.D.Y.; data curation, L.D.Y.; Writing—Original Draft preparation, L.D.Y.; Writing—Review and Editing, L.D.Y. and G.E.; visualization, R.A.E. and L.D.Y.; supervision, L.D.Y.; project administration, L.D.Y.; funding acquisition, G.E.
Funding
This research was partially funded by the Mississippi Mineral Resource Institute (MMRI).
Acknowledgments
We would like to thank Camilla Musgrove at the Alabama Oil and Gas Board and Marcella McIntyre with the Alabama Geological Survey, Tuscaloosa, Alabama and Lou Zachos from the University of Mississippi for his exceedingly valuable discussions of paleo-depositional environments and potential diagenetic modifications to the Smackover Formation. We also thank the anonymous reviewers. Our work was greatly improved by their thoughtful comments and suggestions.
Conflicts of Interest
The authors declare no conflict of interest.
References
- Geological Survey of Alabama, State Oil and Gas Board. An Overview of the Little Cedar Creek and Brooklyn Fields. 2012. Available online: http://www2.ogb.state.al.us/documents/misc_ogb/lcc_overview.pdf (accessed on 9 September 2018).
- Mancini, E.A.; Benson, D.J.; Hart, B.S.; Balch, R.S.; Parcell, W.C.; Panetta, B.J. Appleton field Case Study (Eastern Gulf Coastal Plain): Field Development Model for Upper Jurassic Microbial Reef Reservoirs Associated with Paleotopographic Basement Structures. AAPG Bull. 2000, 84, 1699–1717. [Google Scholar]
- Wade, W.J.; Sassen, R.; Chinn, E.W. Stratigraphy and source potential of the Smackover Formation in the northern Manila Embayment, southwest Alabama. Gulf Coast Assoc. Geol. Soc. Trans. 1987, 37, 277–286. [Google Scholar]
- Sassen, R.; Moore, C.H.; Meendsen, F.C. Distribution of hydrocarbon source potential in the Jurassic Smackover Formation. Org. Geochem. 1987, 11, 379–383. [Google Scholar] [CrossRef]
- Oehler, J.H. Carbonate Source Rocks in the Jurassic Smackover Trend of Mississippi, Alabama, and Florida; SG 18: Petroleum Geochemistry and Source Rock Potential of Carbonate Rocks; GeoScienceWorld: McLean, VA, USA, 1984; pp. 63–69. [Google Scholar]
- Salvador, A. Origin and Development of the Gulf of Mexico Basin; The Gulf of Mexico Basin; Geological Society of America: Boulder, CO, USA, 1991; pp. 389–444. [Google Scholar]
- Claypool, G.E.; Mancini, E.A. Geochemical Relationships of Petroleum in Mesozoic Reservoirs to Carbonate Source Rocks of Jurassic Smackover Formation, Southwestern Alabama. AAPG Bull. 1989, 73, 904–924. [Google Scholar]
- Mancini, E.A.; Tew, B.H.; Mink, R.M. Jurassic Sequence Stratigraphy in the Mississippi Interior Salt Basin of Alabama. Gulf Coast Assoc. Geol. Soc. Trans. 1990, 40, 521–529. [Google Scholar]
- Mink, R.M.; Bearden, B.L.; Mancini, E.A. Regional Jurassic Geologic Framework of Alabama Coastal Waters Area and Adjacent Federal Waters Area. Mar. Geol. 1989, 90, 39–50. [Google Scholar] [CrossRef]
- Crevello, P.D.; Harris, P.M. Depositional Models for Jurassic Reefal Buildups. In Proceedings Gulf Coast Section Society of Economic Paleontologists and Mineral; SEPM Society for Sedimentary Geology: Tulsa, Oklahoma, 1984; pp. 57–102. [Google Scholar]
- Kopaska-Merkel, D.C. Jurassic Reefs of the Smackover Formation in South Alabama; Geological Survey of Alabama: Tuscaloosa, Alabama, 1998. [Google Scholar]
- Baria, L.R.; Stoudt, D.L.; Harris, P.M.; Crevello, P.D. Upper Jurassic Reefs of Smackover Formation, United States Gulf Coast. AAPG Bull. 1982, 66, 1449–1482. [Google Scholar]
- Kopaska-Merkel, D.C.; Mann, S.D. Pore Facies of Smackover Carbonate Reservoirs in Southwest Alabama. Gulf Coast Assoc. Geol. Soc. Trans. 1991, 41, 374–382. [Google Scholar] [CrossRef]
- Heydari, E.; Moore, C.H. Zonation and geochemical patterns of burial calcite cements; upper Smackover Formation, Clarke County, Mississippi. J. Sediment. Res. 1993, 63, 44–60. [Google Scholar]
- Heydari, E.; Wade, W.J.; Anderson, L.C. Depositional environments, organic carbon accumulation, and solar-forcing cyclicity in Smackover Formation lime mudstones, northern Gulf Coast. AAPG Bull. 1997, 81, 760–774. [Google Scholar]
- Badon, C.L. Petrology and Reservoir Potential of the Upper Member of the Smackover Formation, Clarke County, Mississippi. Gulf Coast Assoc. Geol. Soc. Trans. 1974, 24, 163–174. [Google Scholar]
- Mancini, E.A.; Benson, D.J. Regional Stratigraphy of Upper Jurassic Smackover Carbonates of Southwest Alabama. Gulf Coast Assoc. Geol. Soc. Trans. 1980, 30, 151–165. [Google Scholar]
- Heydari, E.; Baria, L.R. Reservoir Characteristics of the Smackover Formation at the Little Cedar Creek Field, Conecuh County, Alabama; Gulf Coast Association of Geological Societies (GCAGS) Annual Convention: Lafayette, LA, USA, 2006. [Google Scholar]
- Heydari, E. The role of burial diagenesis in hydrocarbon destruction and H2S accumulation, Upper Jurassic Smackover Formation, Black Creek Field, Mississippi. AAPG Bull. 1997, 81, 26–45. [Google Scholar]
- Heydari, E.; Baria, L.R. Sequence Stratigraphy of the Smackover Formation in the North-Central U.S. Gulf Coast; Gulf Coast Association of Geological Societies (GCAGS) Annual Convention: Lafayette, LA, USA, 2006. [Google Scholar]
- Ridgway, J.G. Upper Jurassicc (Oxfordian) Smackover Facies Characterization at Little Cedar Creek Field, Conecuh County, Alabama; Master of Science, University of Alabama: Tuscaloosa, Alabama, 2010. [Google Scholar]
- Hart, B.S.; Balch, R.S. Approaches to defining reservoir physical properties from 3-D seismic attributes with limited well control: An example from the Jurassic Smackover Formation, Alabama. Geophysics 2000, 65, 368–376. [Google Scholar] [CrossRef]
- Saller, A.H.; Moore, B.R. Dolomitization in the Smackover Formation, Escambia County, Alabama. Gulf Coast Assoc. Geol. Soc. Trans. 1986, 36, 275–282. [Google Scholar]
- Prather, B.E. Origin of dolostone reservoir rocks, Smackover Formation (Oxfordian), northeastern Gulf Coast, USA. AAPG Bull. 1992, 76, 139–163. [Google Scholar]
- Benson, D.J.; Mancini, E.A. Porosity development and reservoir characteristics of the Smackover Formation in southwest Alabama. In Proceedings of the Third Annual GCSSEPM Foundation Research Conference; Reprint from the Geological Survey of Alabama: Tuscaloosa, Alabama, 1984; p. 17. [Google Scholar]
- Melas, F.F.; Friedman, G.M. Petrophysical Characteristics of the Jurassic Smackover Formation, Jay Field, Conecuh Embayment, Alabama and Florida. AAPG Bull. 1992, 76, 81–100. [Google Scholar]
- Rowe, H.; Hughes, N.; Robinson, K. The quantification and application of handheld energy-dispersive X-ray fluorescence (ED-XRF) in mudrock chemostratigraphy and geochemistry. Chem. Geol. 2012, 324, 122–131. [Google Scholar] [CrossRef]
- Pearce, T.J.; Besly, B.M.; Wray, D.S.; Wright, D.K. Chemostratigraphy: A Method to Improve Interwell Correlation in Barren Sequences—A Case Study Using Onshore Duckmantian/Stephanian Sequences (West Midlands, UK). Sediment. Geol. 1999, 124, 197–220. [Google Scholar] [CrossRef]
- Benson, D.J. Diagenetic Controls on Reservoir Development and Quality, Smackover Formation of Southwest Alabama. AAPG Bull. 1985, 69, 1417. [Google Scholar]
- Arz, H.W.; Pätzold, J.; Wefer, G. Correlated millennial-scale changes in surface hydrography and terrigenous sediment yield inferred from last-glacial marine deposits off northeastern Brazil. Quat. Res. 1998, 50, 157–166. [Google Scholar] [CrossRef]
- Jansen, J.H.F.; Van der Gaast, S.J.; Koster, B.; Vaars, A.J. CORTEX, a shipboard XRF1306 scanner for element analyses in split sediment cores. Mar. Geology 1998, 151, 143–153. [Google Scholar] [CrossRef]
- Heydari, E.; Moore, C.H. Paleoceanographic and paleoclimatic controls on ooid mineralogy of the Smackover Formation, Mississippi salt basin; implications for Late Jurassic seawater composition. J. Sediment. Res. 1994, 64, 101–114. [Google Scholar]
© 2019 by the authors. Licensee MDPI, Basel, Switzerland. This article is an open access article distributed under the terms and conditions of the Creative Commons Attribution (CC BY) license (http://creativecommons.org/licenses/by/4.0/).


