Article

Impact of Deforestation on Streamflow in the Amur River Basin

by
Galina V. Sokolova
1,2,*,
Andrei L. Verkhoturov
1,3 and
Sergei P. Korolev
3
1
Mining Institute, Far Eastern Branch of the Russian Academy of Sciences, Khabarovsk 680000, Russia
2
Institute of the Water and Ecology Problems, Far Eastern Branch of the Russian Academy of Sciences, Khabarovsk 680000, Russia
3
Computing Center, Far Eastern Branch of the Russian Academy of Sciences, Khabarovsk 680000, Russia
*
Author to whom correspondence should be addressed.
Geosciences 2019, 9(6), 262; https://doi.org/10.3390/geosciences9060262
Submission received: 30 April 2019 / Revised: 8 June 2019 / Accepted: 12 June 2019 / Published: 14 June 2019
(This article belongs to the Special Issue Remote Sensing used in Environmental Hydrology)

Abstract

:
In the basin of the Amur River in the Russian Far East, the influence of watershed areas covered by forests on the river basin has a complex nature, and no strict functional dependency has been established yet between these two factors. A study of the Amur River watershed in the current conditions, between 2000 and 2016 (climate, forest coverage, fires, and felling), has been conducted using the ground and satellite observations. The purpose of the study was to identify their influence on the river behaviour (flow, flooding, and levels of water). The study of hydrological regime of rivers was conducted in conjunction with the analysis of the dynamics of forest and burns areas over the synchronised periods of time. A special attention was given to the changing nature of the species composition of the forests (coniferous and deciduous forests separately) from 2000 to 2016, and climatic parameters over thirty years (atmospheric temperature, dew point, precipitation). New facts have been obtained, which provide an explanation of the reasons for predominant prolonged trends in the dynamics of the summer streamflow. In the view of the general tendency toward increased forest coverage combining all species of forest stand, the trend in the dynamics of the coniferous species areas is negative. Therefore, a conclusion can be made, that one of the major factors in the increase of the river flood flow (alongside the atmospheric precipitation), is deforestation of primary coniferous forests on the watershed areas, in contrast with the deciduous forests, where the trend is positive. Practicability of such conclusions can be justified, as different types of forests have different root systems, which mellow the ground and facilitate partial loss of the atmospheric precipitation and its transformation into the groundwater flow. Besides, coniferous forests attract more frequent and intensive fires, more subjected to felling, have longer regeneration period, and also, use larger volumes of ground waters for growing and functioning. Consequently, with their disappearance, an increase in streamflow should be expected. No changes in surface temperature and humidity of the forest cover in the watersheds during 1980-2016 despite global warming. Therefore, annual variability of forested areas of watersheds is greatly influenced by fires and felling. There are reasons to assume, that because of the tendency for decreasing areas of coniferous forests, the conditions contributing to the increases in rivers’ flood flow and flood risks during monsoon and frontal cyclonic rainfalls will remain.

Graphical Abstract

1. Introduction

Forest study is a very important aspect in understanding its role in various systems of the global environment. Forest changes can affect many hydrological and biogeochemical processes [1]. Currently, there are many studies on the effect of deforestation on streamflow in watersheds [2,3,4,5,6,7,8,9]. Thus, the following results have been obtained from the long-term observations of fourteen pairs of moderate-size watersheds (around 250 acres), located in the north-west of the USA [6]. After the felling of a broadleaf forest, during the first five years, the amount of daily flow from the watershed surface increases on average by 2–3 mm, and after felling of a coniferous forest, this figure increases almost threefold. Similar connection between the daily flow of minor rivers and felling of the watershed broadleaf forest was revealed by multiannual observations on the territory of Sakhalin Island [10]. In the study [3], the following conclusions were made as a result of experiments conducted on a catchment area ranging from 1 to 2500 hectares. With the loss of coniferous forests by 10% of the total catchment area, the annual streamflow increases by 40 mm. When removing deciduous forests by 10% of the total catchment area, the annual streamflow increases by 25 mm. Changes in shrubs or grasses by 10% lead to a change in annual streamflow of 10 mm. Some studies have shown that changes in the soil cover significantly affect runoff, and felling leads to an increase in runoff [4,11,12,13]. It is also worth noting the results of studies [14] in which using hydrology model analysis, the water yield was found to increase because of the decrease in forest land.
The watershed of the Amur basin, with four physiographic zones of the middle latitudes represented, is characterised by predominantly forest zones with subzones of mixed coniferous-broad-leaved forests and the southern Taiga [15]. The first forest hydrology researches in the Amur River basin were carried out in the period from 1966 to 1986, in the study of water-conservation and water-regulation role of forests, when the forest coverage of some watersheds reached 90–100% [16,17,18,19]. Taking as examples several river watersheds of the Lower Amur, it was demonstrated that forests play a significant role in the moisture circulation process, which can function differently in different geographic and climatic conditions, and in different types of forest [20]. The conclusion drawn from the study was, that from the different natural components of a geographic environment, the most clearly traceable influence of forests is on the maximum flow formed by monsoon rainfalls. It has been calculated, that for the river basins of the Amur River region, the optimum figure of a river watershed forest coverage (including all wood types) should, on average, be no less than 62.5% for the water balance of the area to remain unchanged [20,21]. In that period, area developments in the basins of the Far-eastern rivers were based on the forest management field materials from the 1950–1960s, which were carried out from the taxation plots and averaged by the forestry area on a specific watershed.
Significant changes of the vegetation cover have happened in the last sixty years, which were influenced by various natural and manmade factors (forest fires, felling, etc.). This, unquestionably, requires conducting a complex forest hydrologic research in the region. Availability of the new types of data, acquired by remote sensing of the Earth, allows to apply effective methods for vegetation cover mapping [22,23,24], as well as for the study of hydrological processes. For example, in [25], hydrological processes in the Amur basin from 2000–2013 were studied influenced by climate change and human activity. This study showed that the streamflow, evapotranspiration, surface runoff, soil moisture and groundwater discharge changed to varying degrees in Amur River basin. In [26], it was found that in river there is an increase in streamflow, but there is still not enough knowledge and publications about the main hydroclimatic characteristics of the Amur River. The authors state that in order to confirm these conclusions, it is necessary to continue studies of intraseasonal and annual variability of the Amur streamflow under the influence of monsoon changes to increase of times of observations. According to climatic models, an increase in average annual air temperature and an increase in the length of the vegetation period in Russian regions will contribute to the increase in forest burns and the displacement of the middle taiga borders to the north and, consequently, the replacement of conifers with deciduous plantations [27]. It is assumed that in the Amur River basin in modern climatic conditions there will be an increase in the frequency of occurrence of high rain floods and an increase in the likelihood of anomalously low-water seasons, as well as their series [28].
Thus, the purpose of this research is to establish the impact and estimate of forest change (felling, burning) in watersheds on streamflow indicators of the Amur River basin. Particular attention is paid to the trend of annual variability of the areas of different type structure of forests, such as coniferous and broadleaf, on a separate watershed. For this purpose, it is necessary to solve the following tasks:
  • According to meteorological observations, to analyze the temperature and precipitation;
  • To analyze and evaluate streamflow indicators and water levels in the watersheds;
  • Using remote sensing to analyze and estimate the variability of coniferous and broadleaf forest areas on watersheds.
The following extreme and sharply contrasting summer hydrological phenomena that occurred in the Amur basin over the past 20 years (Table 1) served as prerequisites for this kind of research.
Catastrophic forest fires were recorded in 1998 in the Khabarovsk Krai and the Jewish Autonomous Oblast, on the northern bank of the Amur River basin [29], (records began in 1931) (Figure 1). The tropospheric layer that had formed over the vast areas of forest fires intensified because of massive heat and smoke discharge into the atmosphere, which prolonged the period of the high atmospheric pressure till the end of summer, causing cyclones to “avoid” the fire and smoke zone. As a result, the border areas—in the Chita Oblast (Shilka and Argun Rivers) and in the northern parts on China (Songhua River)—had heavy rainfalls, causing rivers to flood [30]. High rainfall floods from these two regions brought a massive Amur River flood with the height of 524 cm near Khabarovsk (Figure 2), when the water overflowed the banks to the height of around 2.5 m, flooding the upper floodplain [31].
In 2008 during anomalously dry summer months, when the trajectories of cyclones surrounded the Amur basin from the outside—an extremely long-lasting and low baseflow was reported, followed by Summer-Autumn low water level with the absolute low level of flood surge of 65 cm near Khabarovsk on the 11–12 August (Figure 2) [30]. That year river navigation experienced great losses, comparable with the damage from flooding. Floodplains and wetlands within the important agricultural area of the Middle Amur and—the resting point for migrating birds and nesting spot for cranes referenced in the Red List of Threatened Species—experienced significant droughts [32].
In 2013, strong monsoon frontal cyclonic rainfalls caused catastrophic flooding along the Middle and Lower Amur, with the height of 808 cm near Khabarovsk on 4 September [30]. Such distinct changes in flows along the Amur have not been recorded since 1896.
In 2018 there was a catastrophic flood (since the records began in 1936) on the Shilka River causing a major flood on the Middle and Lower Amur, with flooding of the middle floodplain near Khabarovsk, and the water overflowing the banks to the height of around two metres (Figure 2). At that time, Zeya and Bureya Dams contained the overflow water from releasing into the Amur River.
Atmospheric precipitation is the main factor in these hydrologic catastrophes and the seasonal fluctuation of the streamflow within the Amur Basin. However, changes in the forest covered areas of the Amur rivers system’ watershed also play a significant part. It is worth paying attention to the fact that to perform such an assessment is a very serious problem. Systematic forest hydrology research of the Amur River basin area was conducted only in the 1950–1960s with a step of 5–10 years. In this period of time, forests covered 70–85% of the area [17,18], and the coverage of some watersheds reached 90–100%. In this context, the research was based on the forest management field materials. Not all areas of the river basins had forest organisation works carried out, where the results could be linked with the regime of the rivers. Other types of surveying the condition of the forests did not exist in those times. Changes in the forest coverage of watersheds is one of the main (after precipitation) indicators of changing flow-forming factors, which are characteristic of natural-climatic and anthropogenic influence on river watersheds.

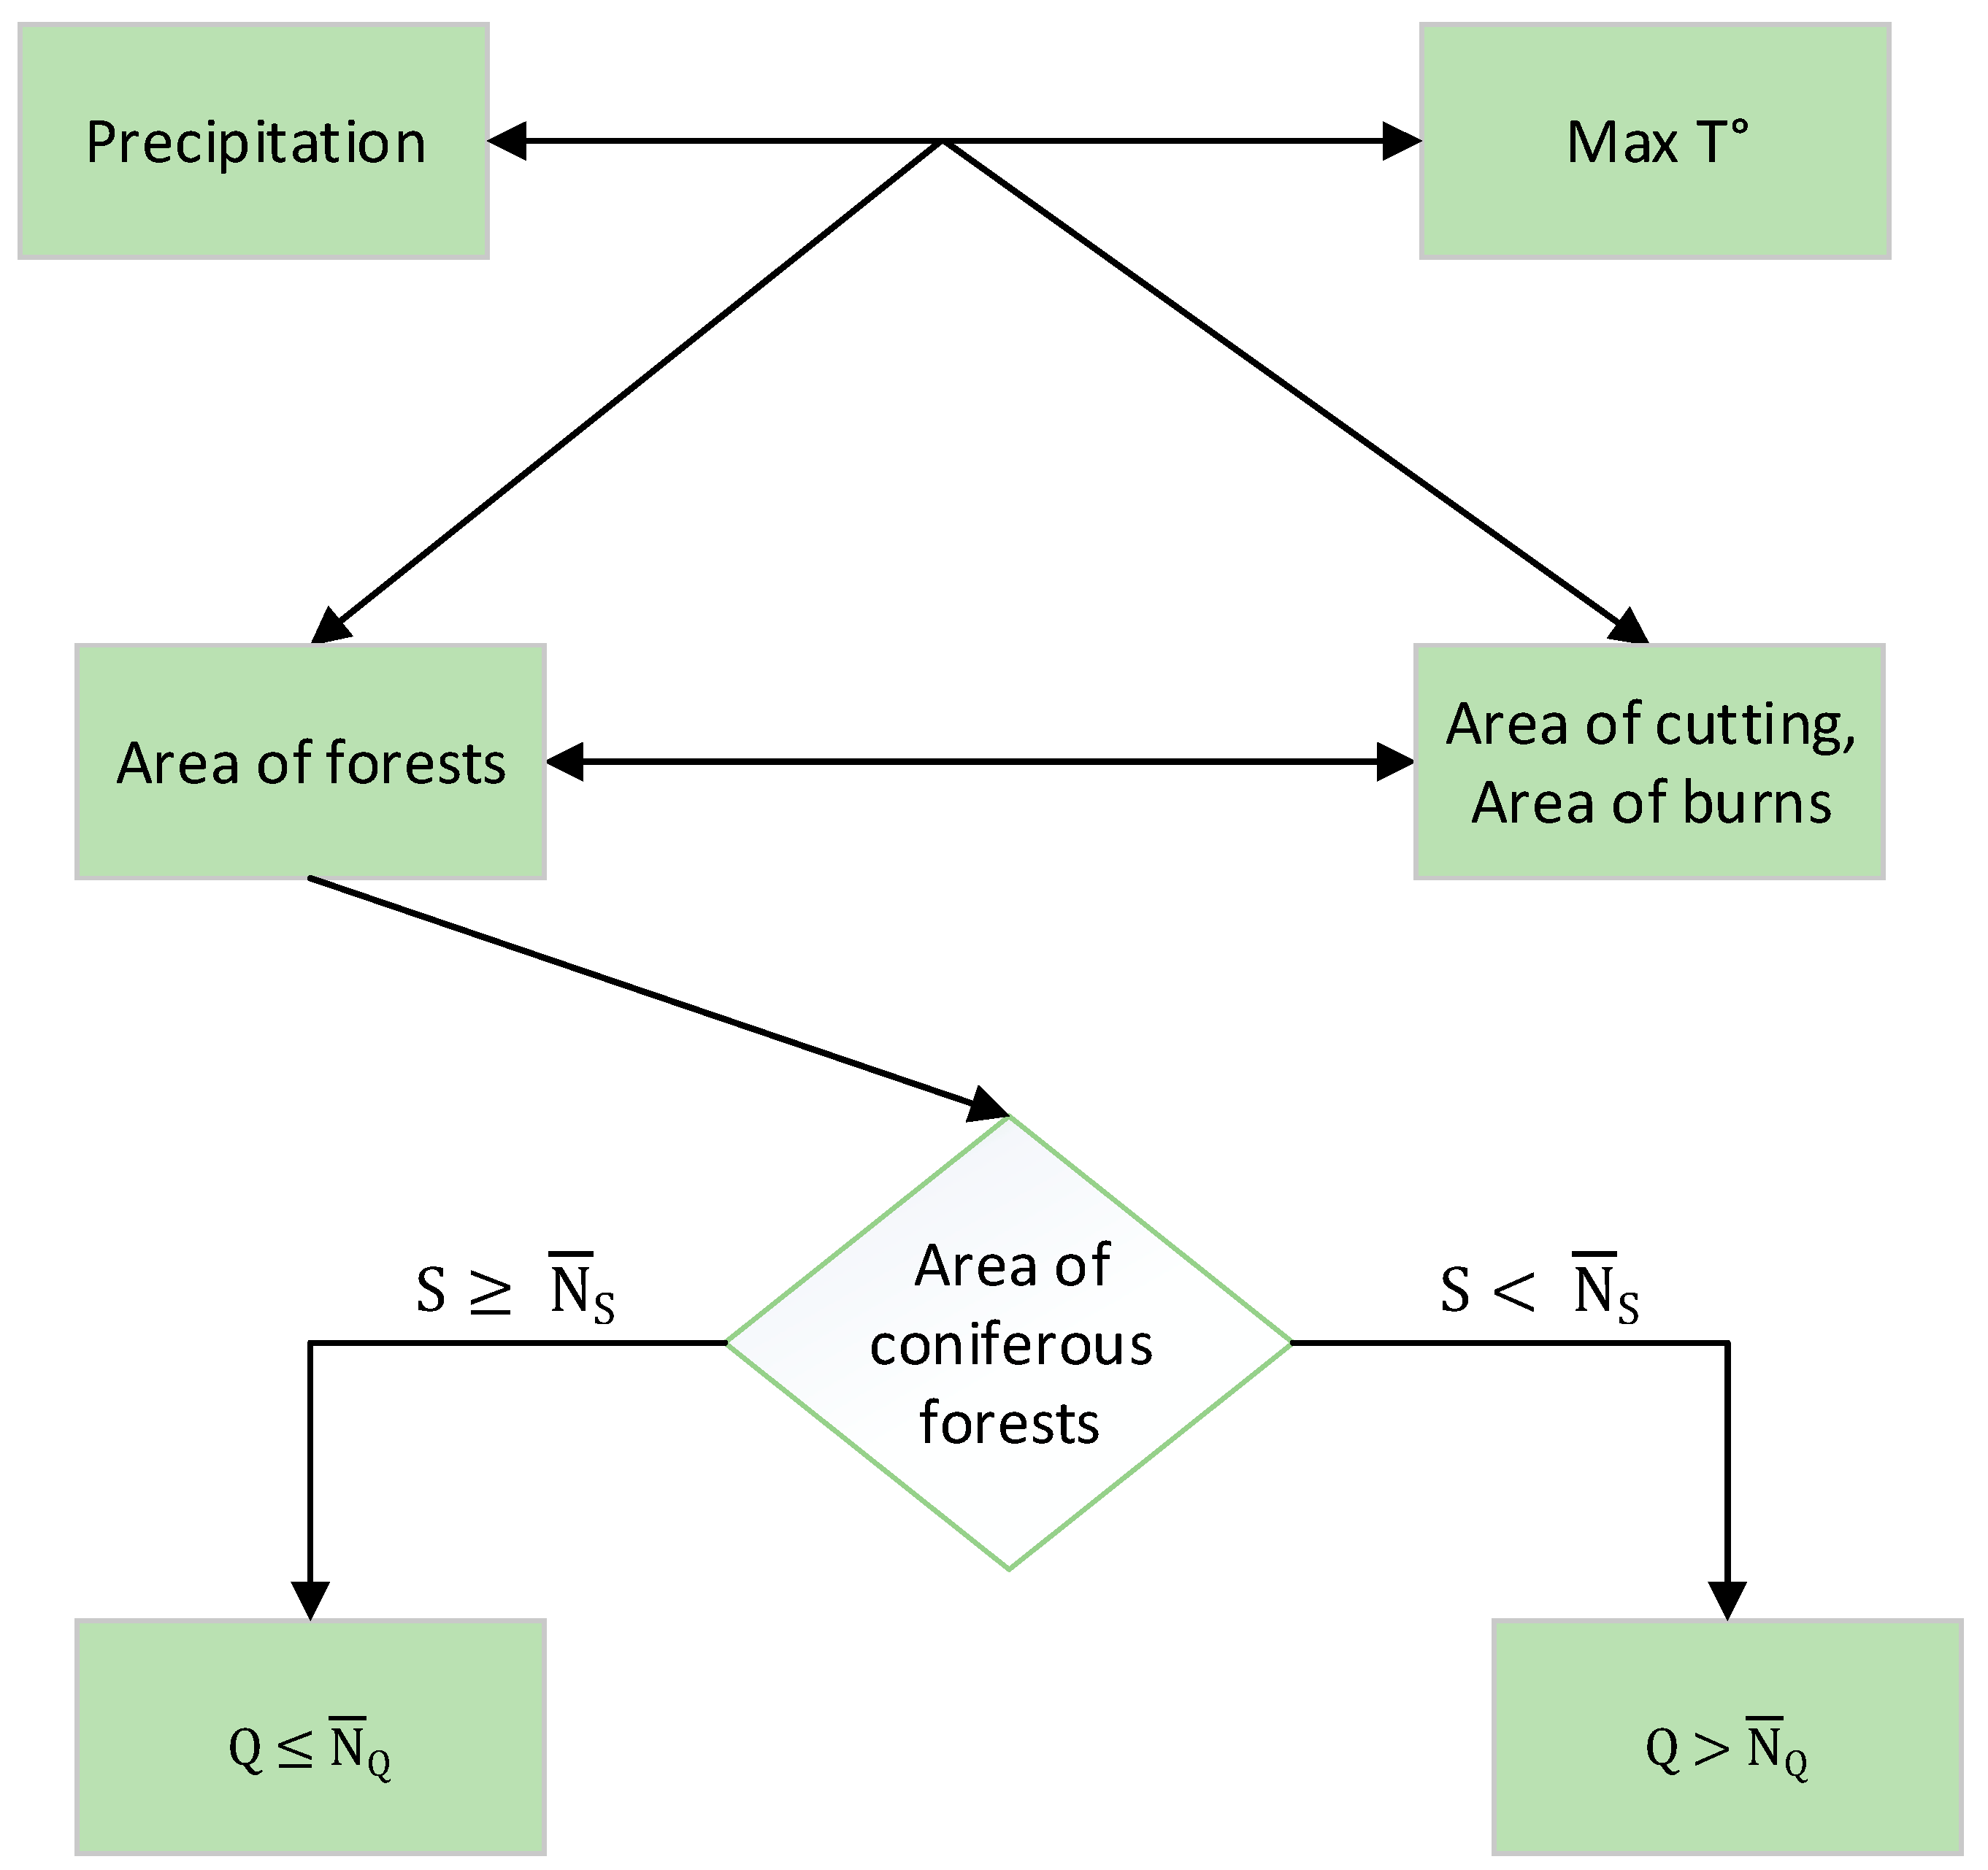
2. Materials and Methods
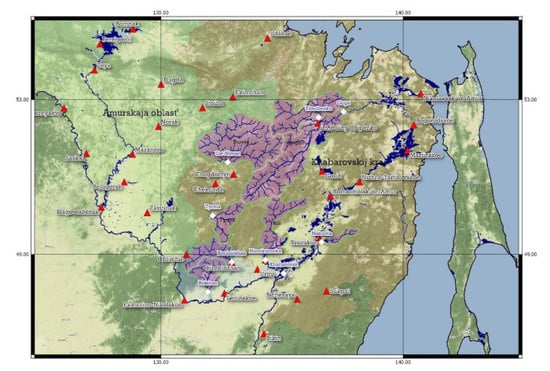
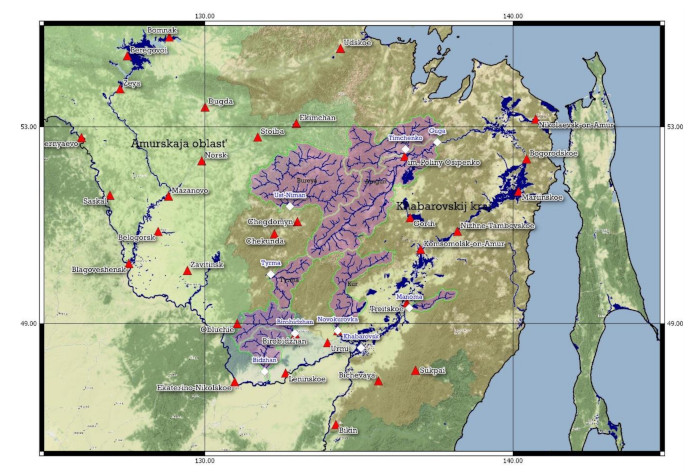
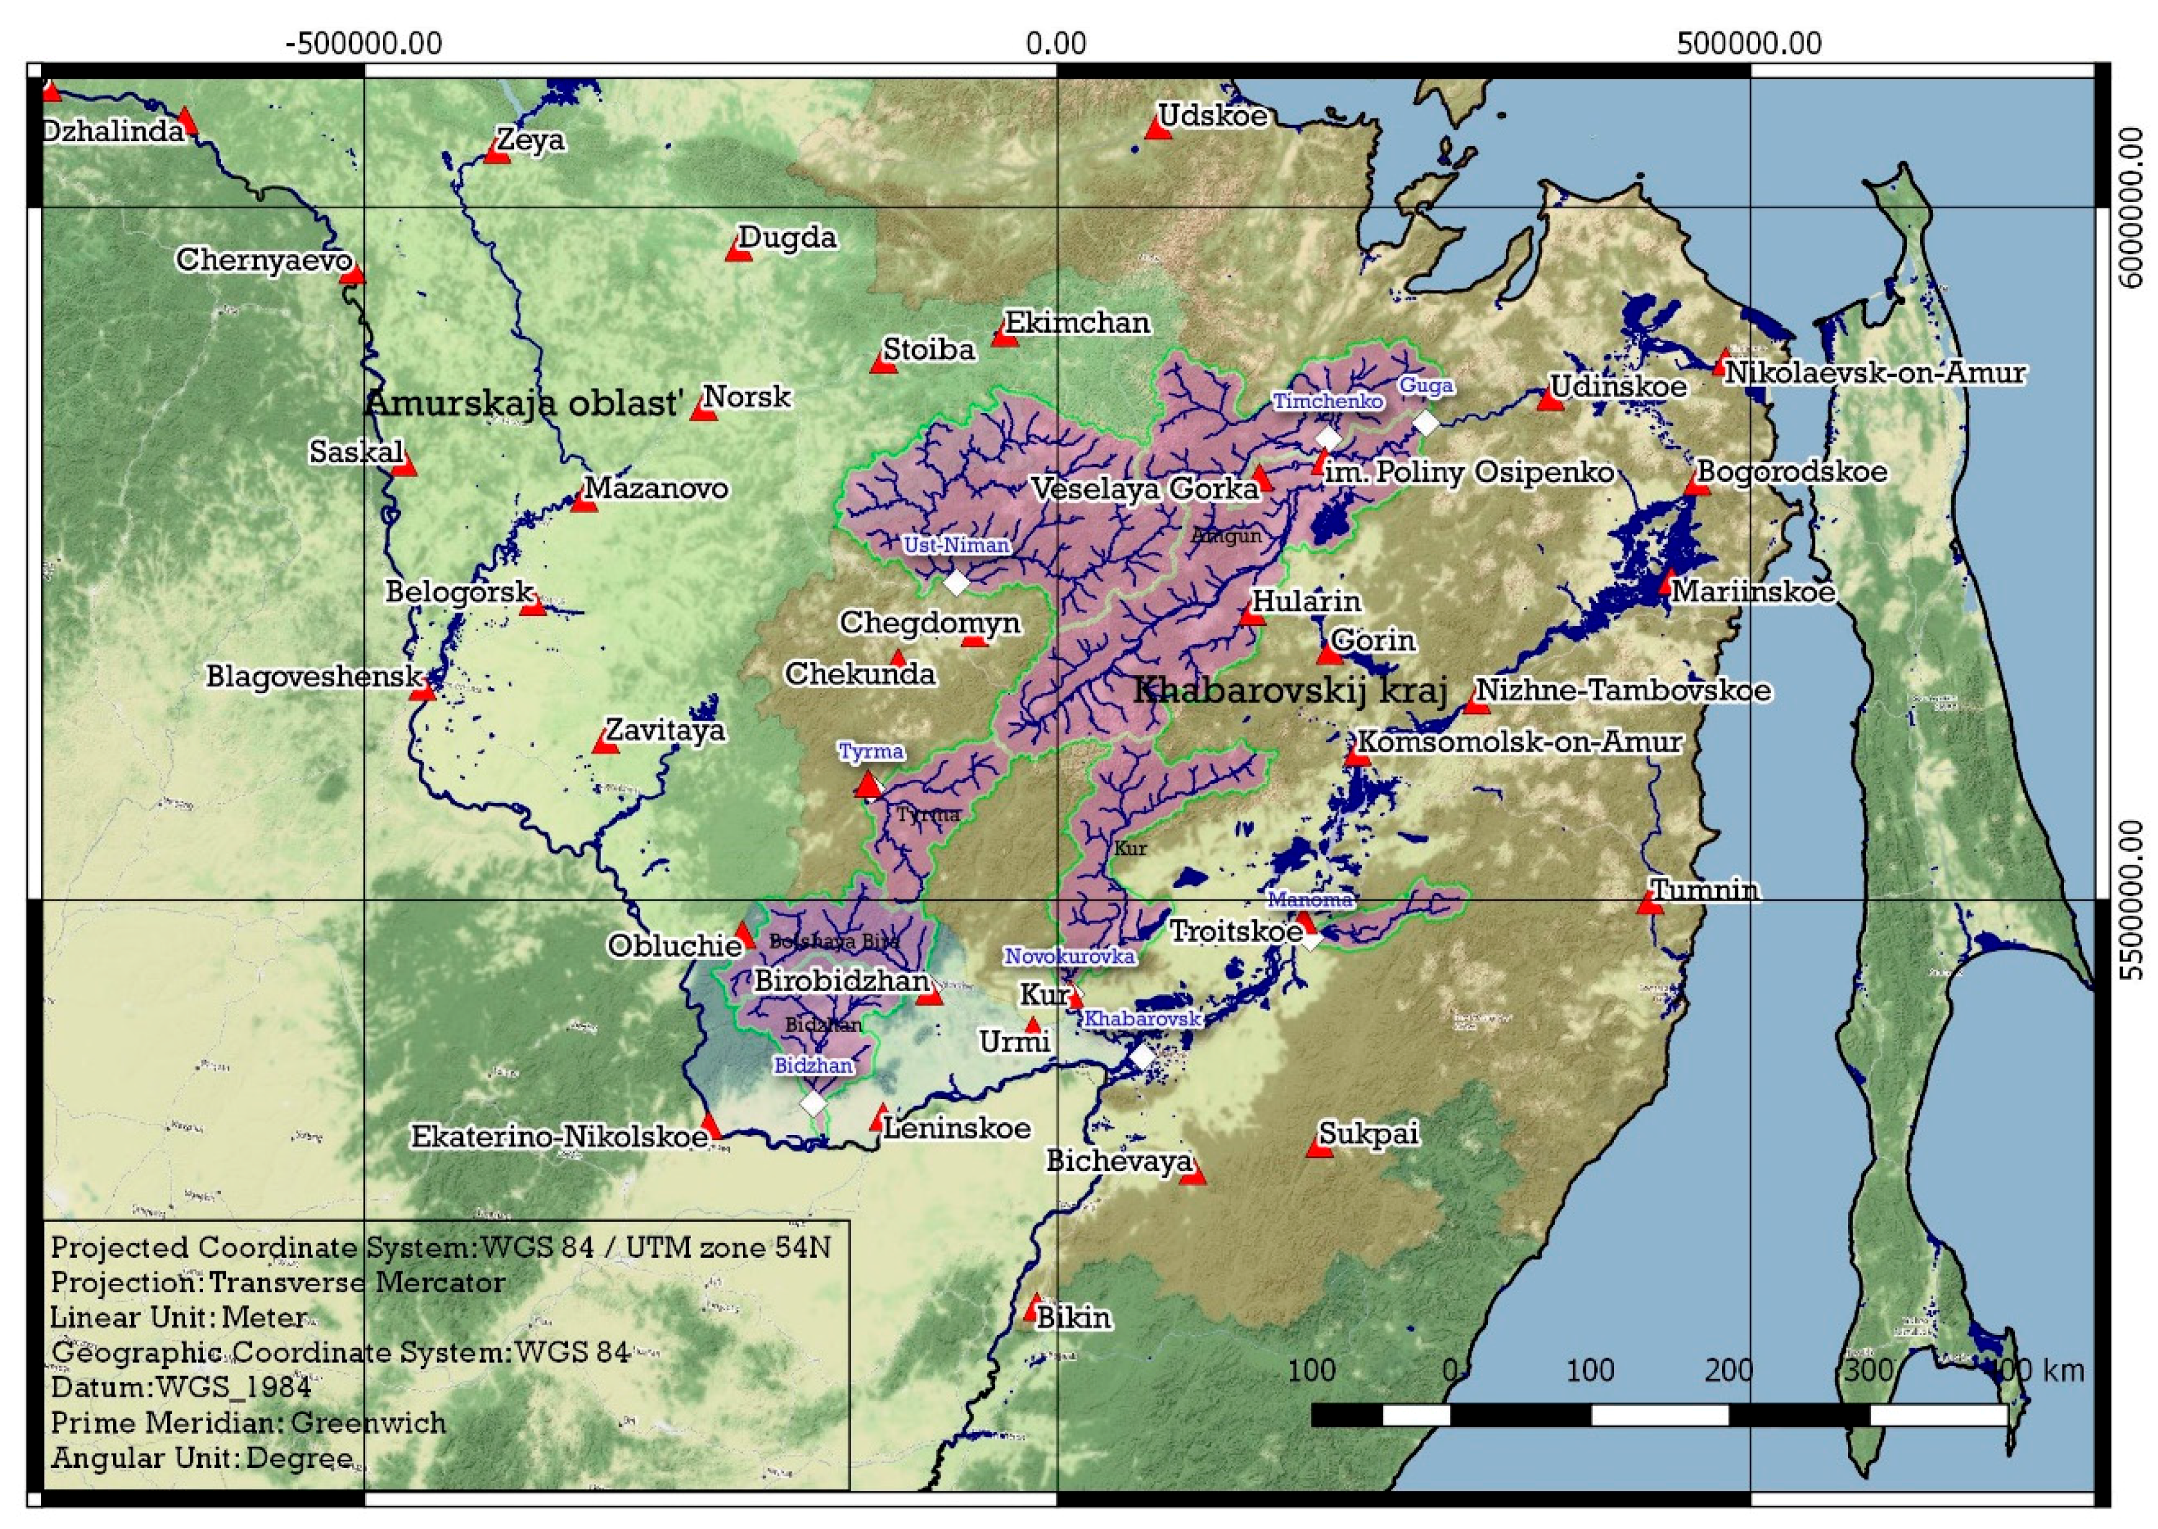
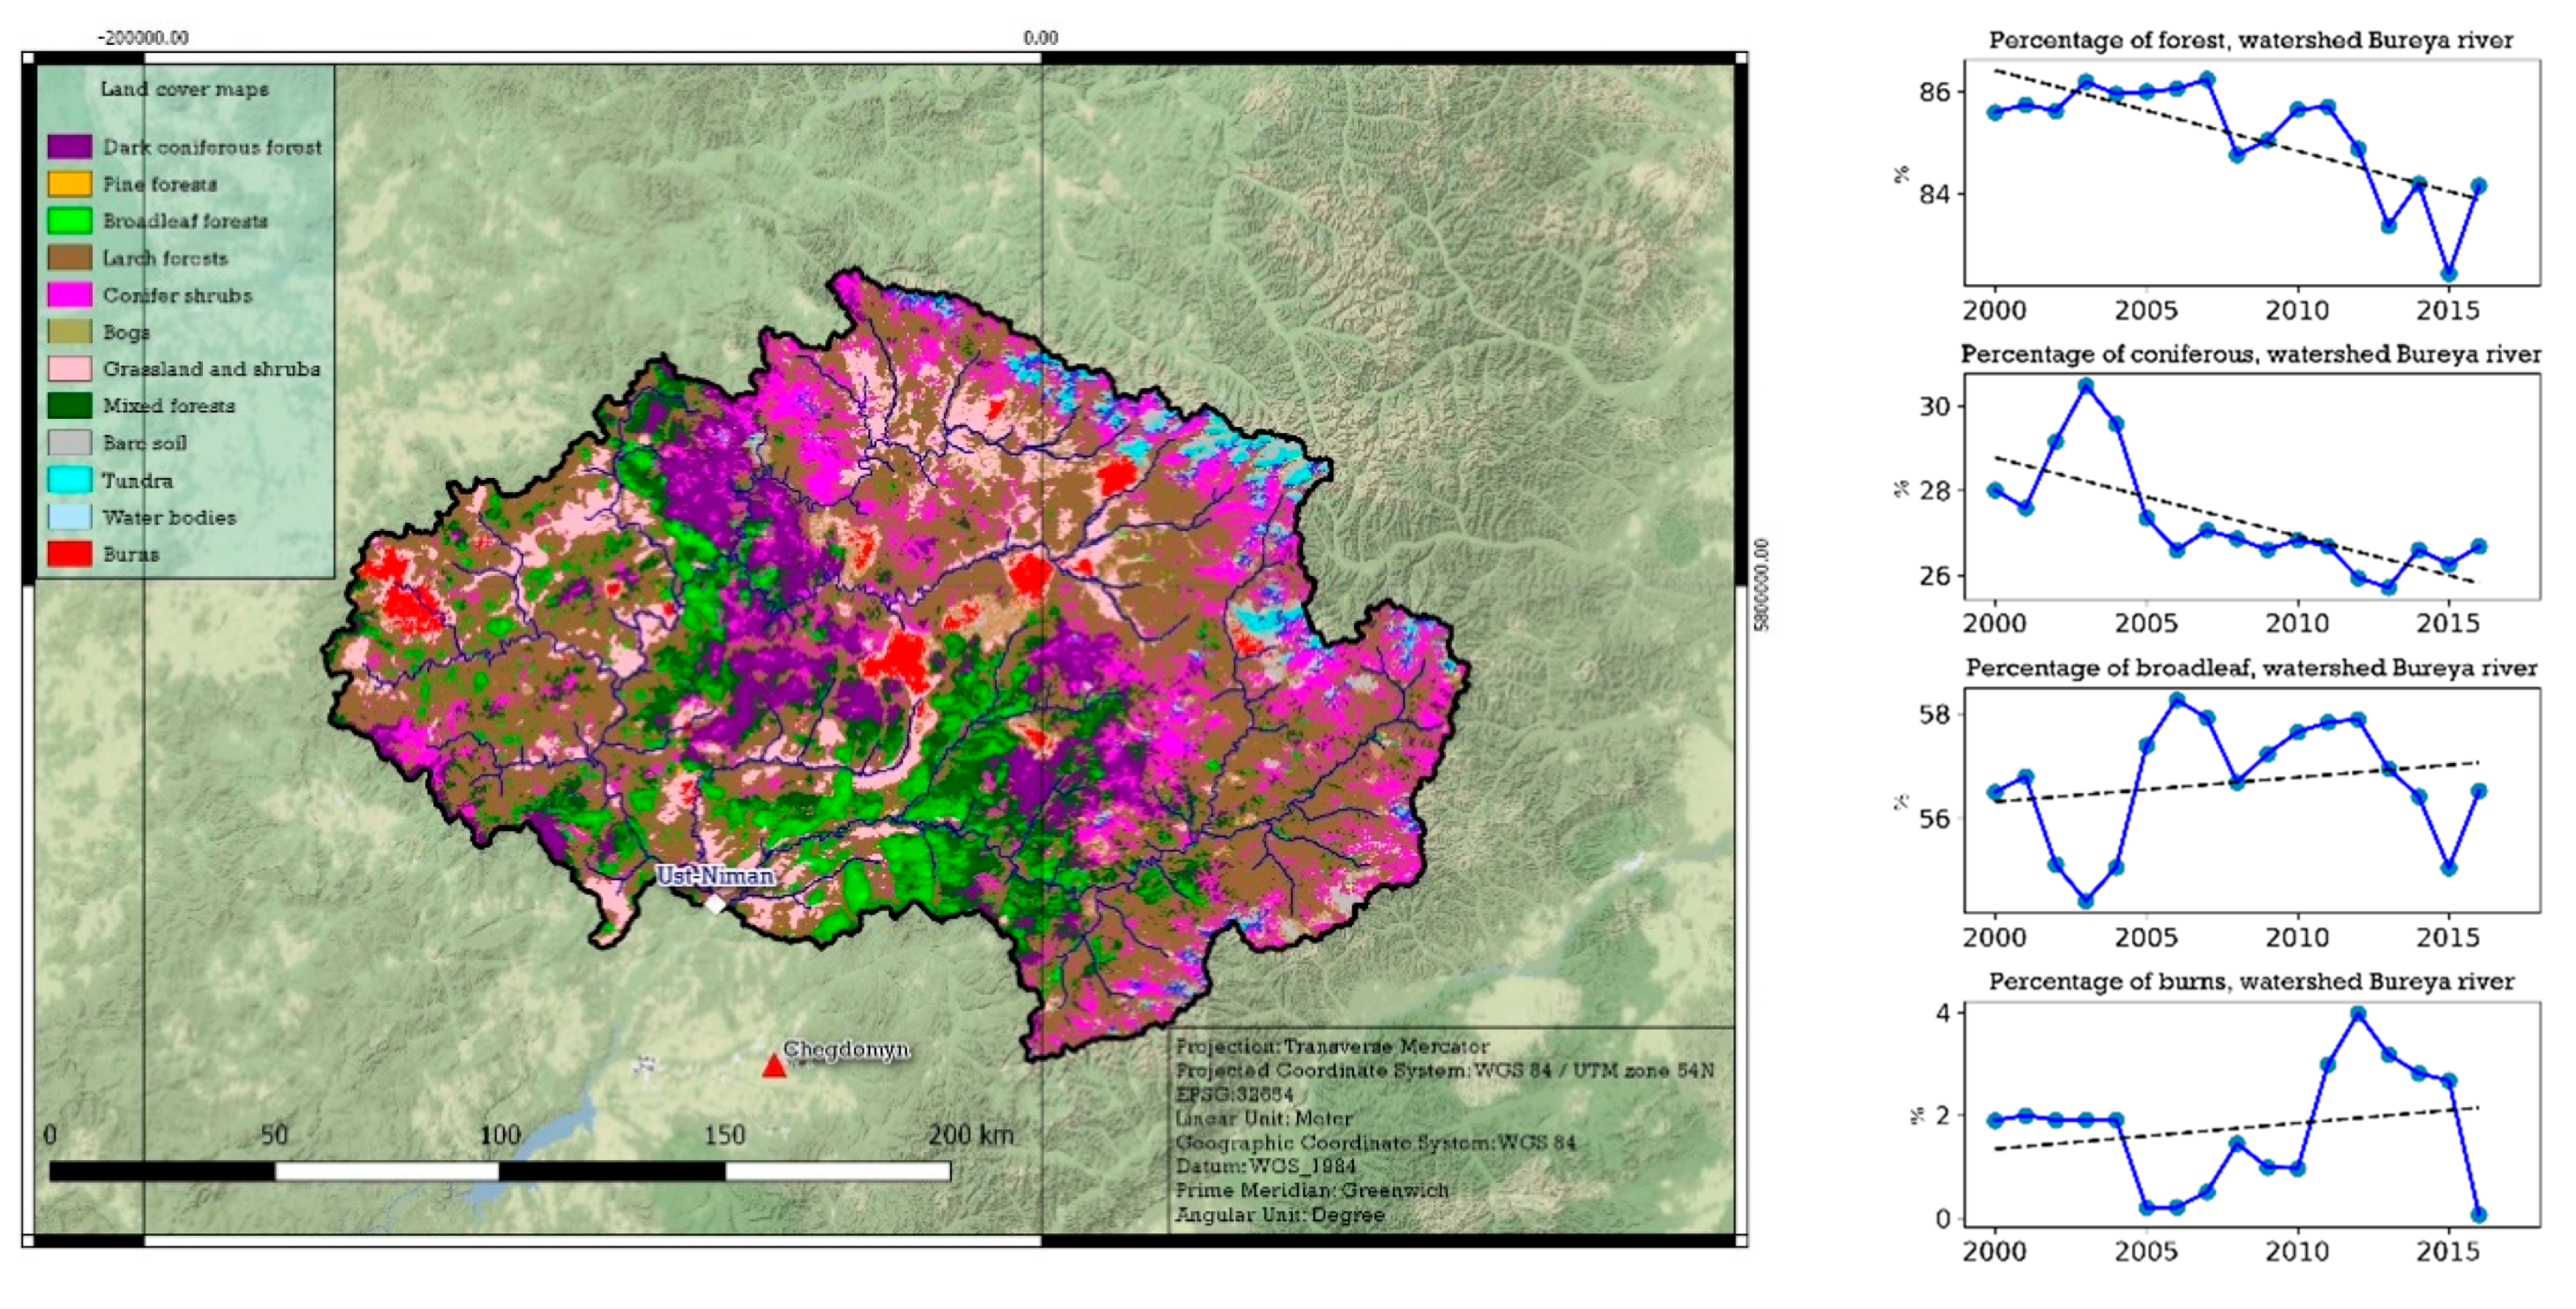
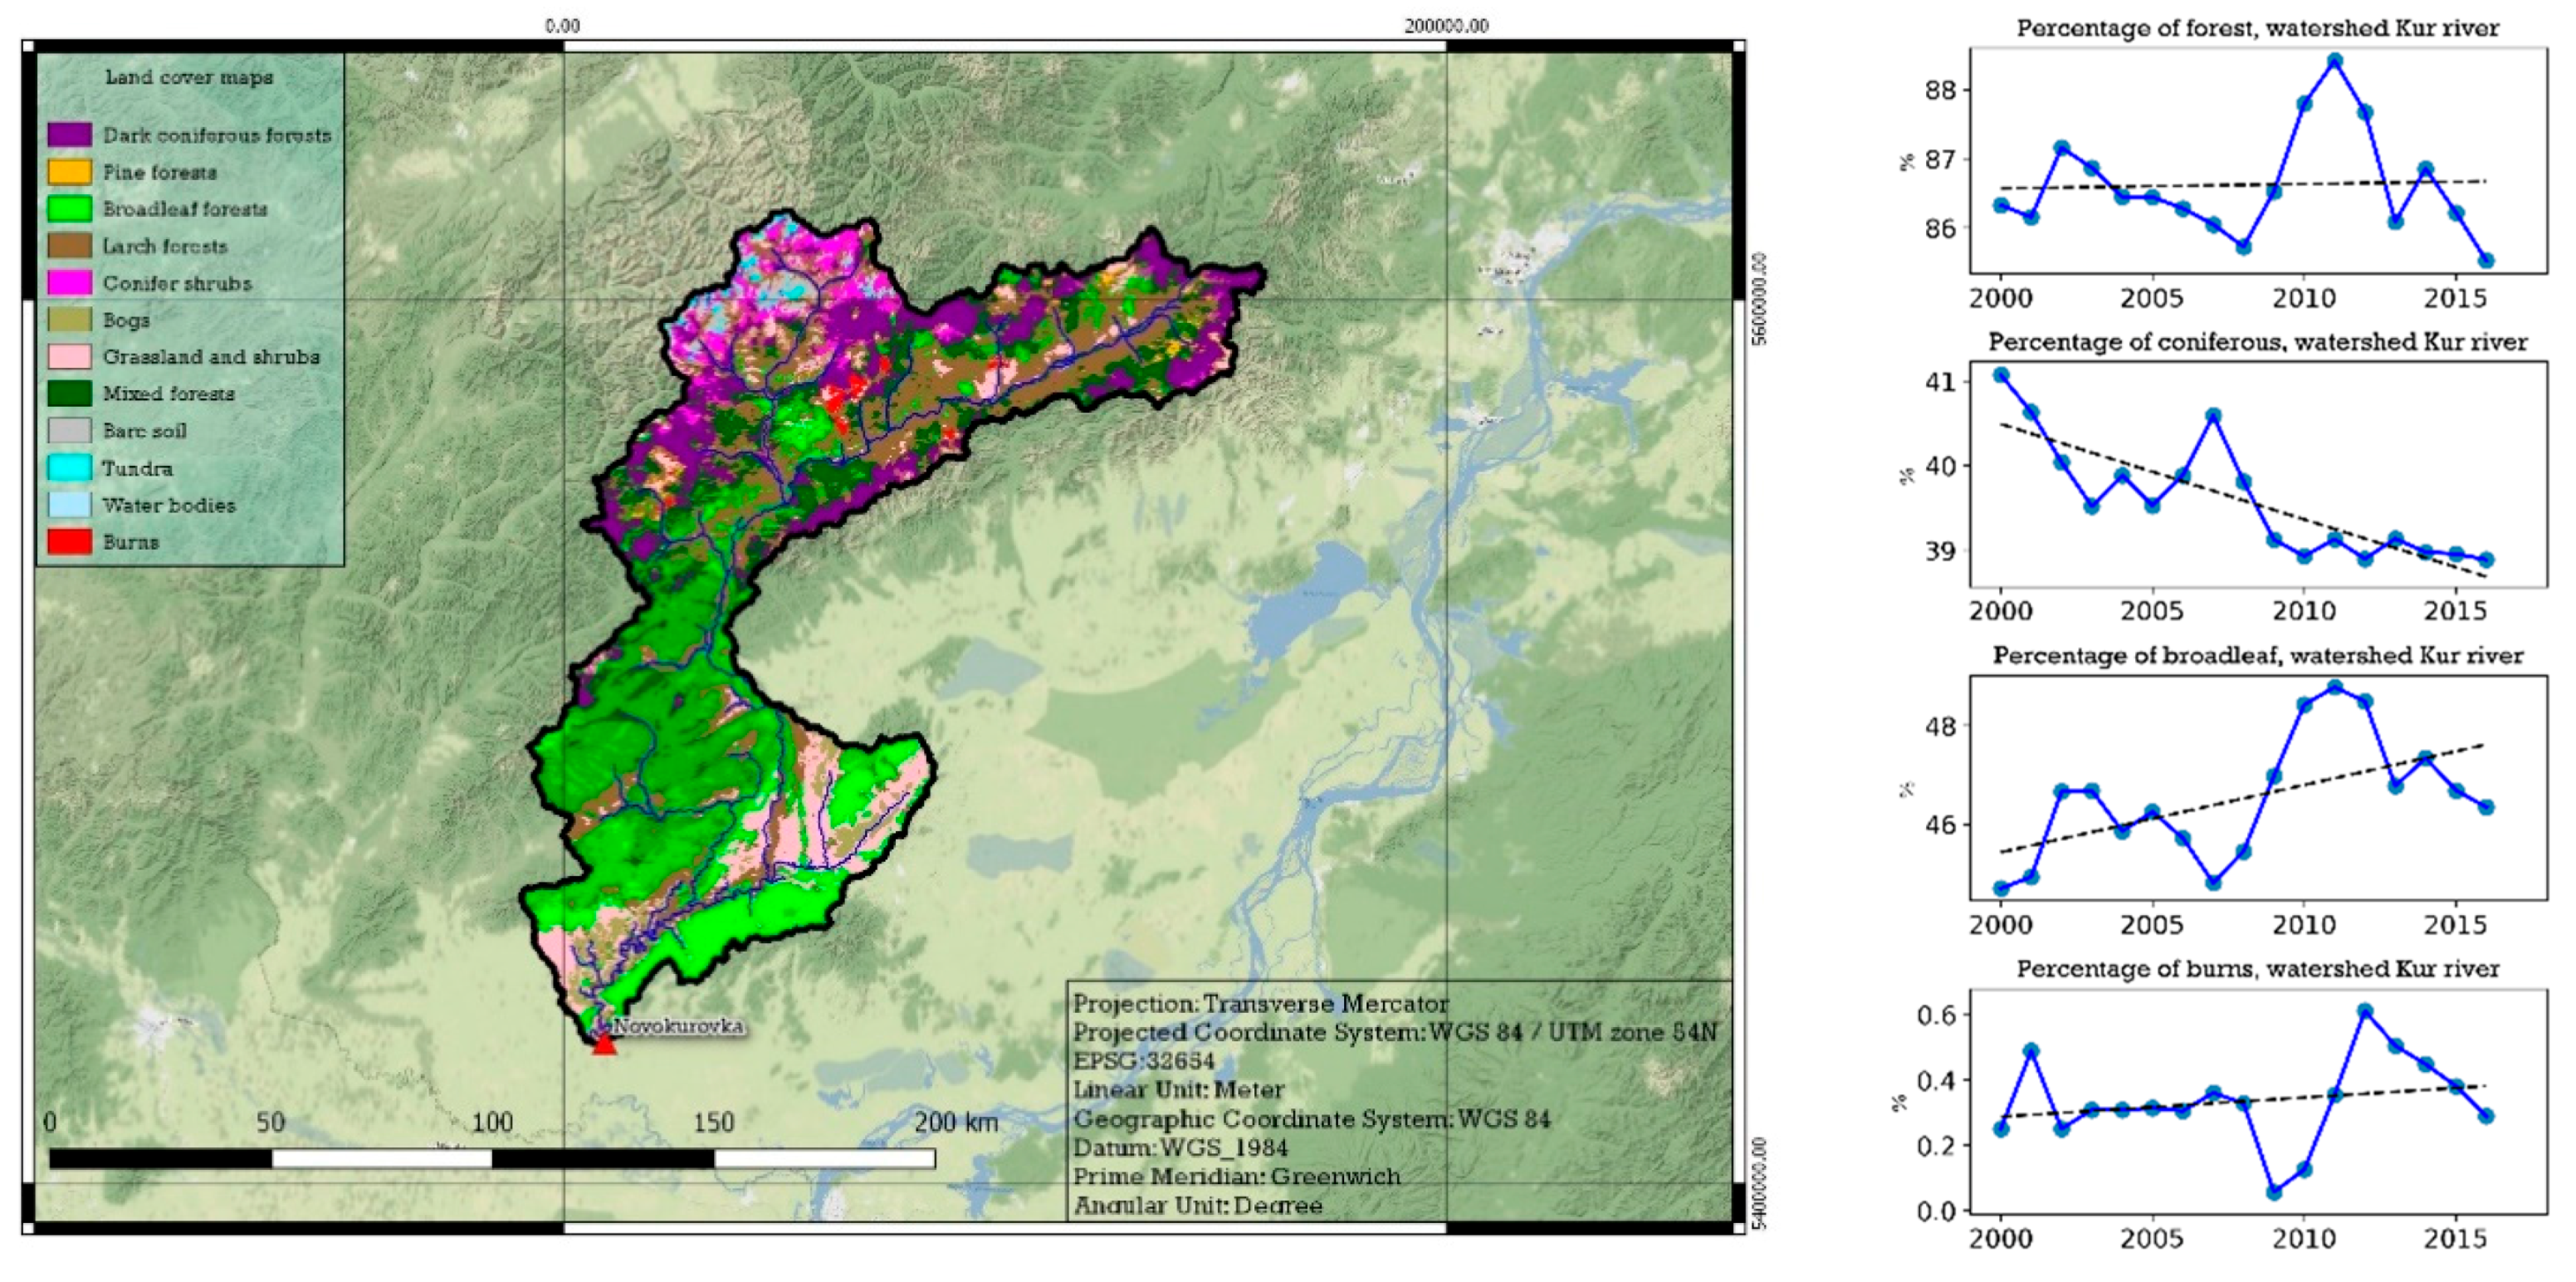
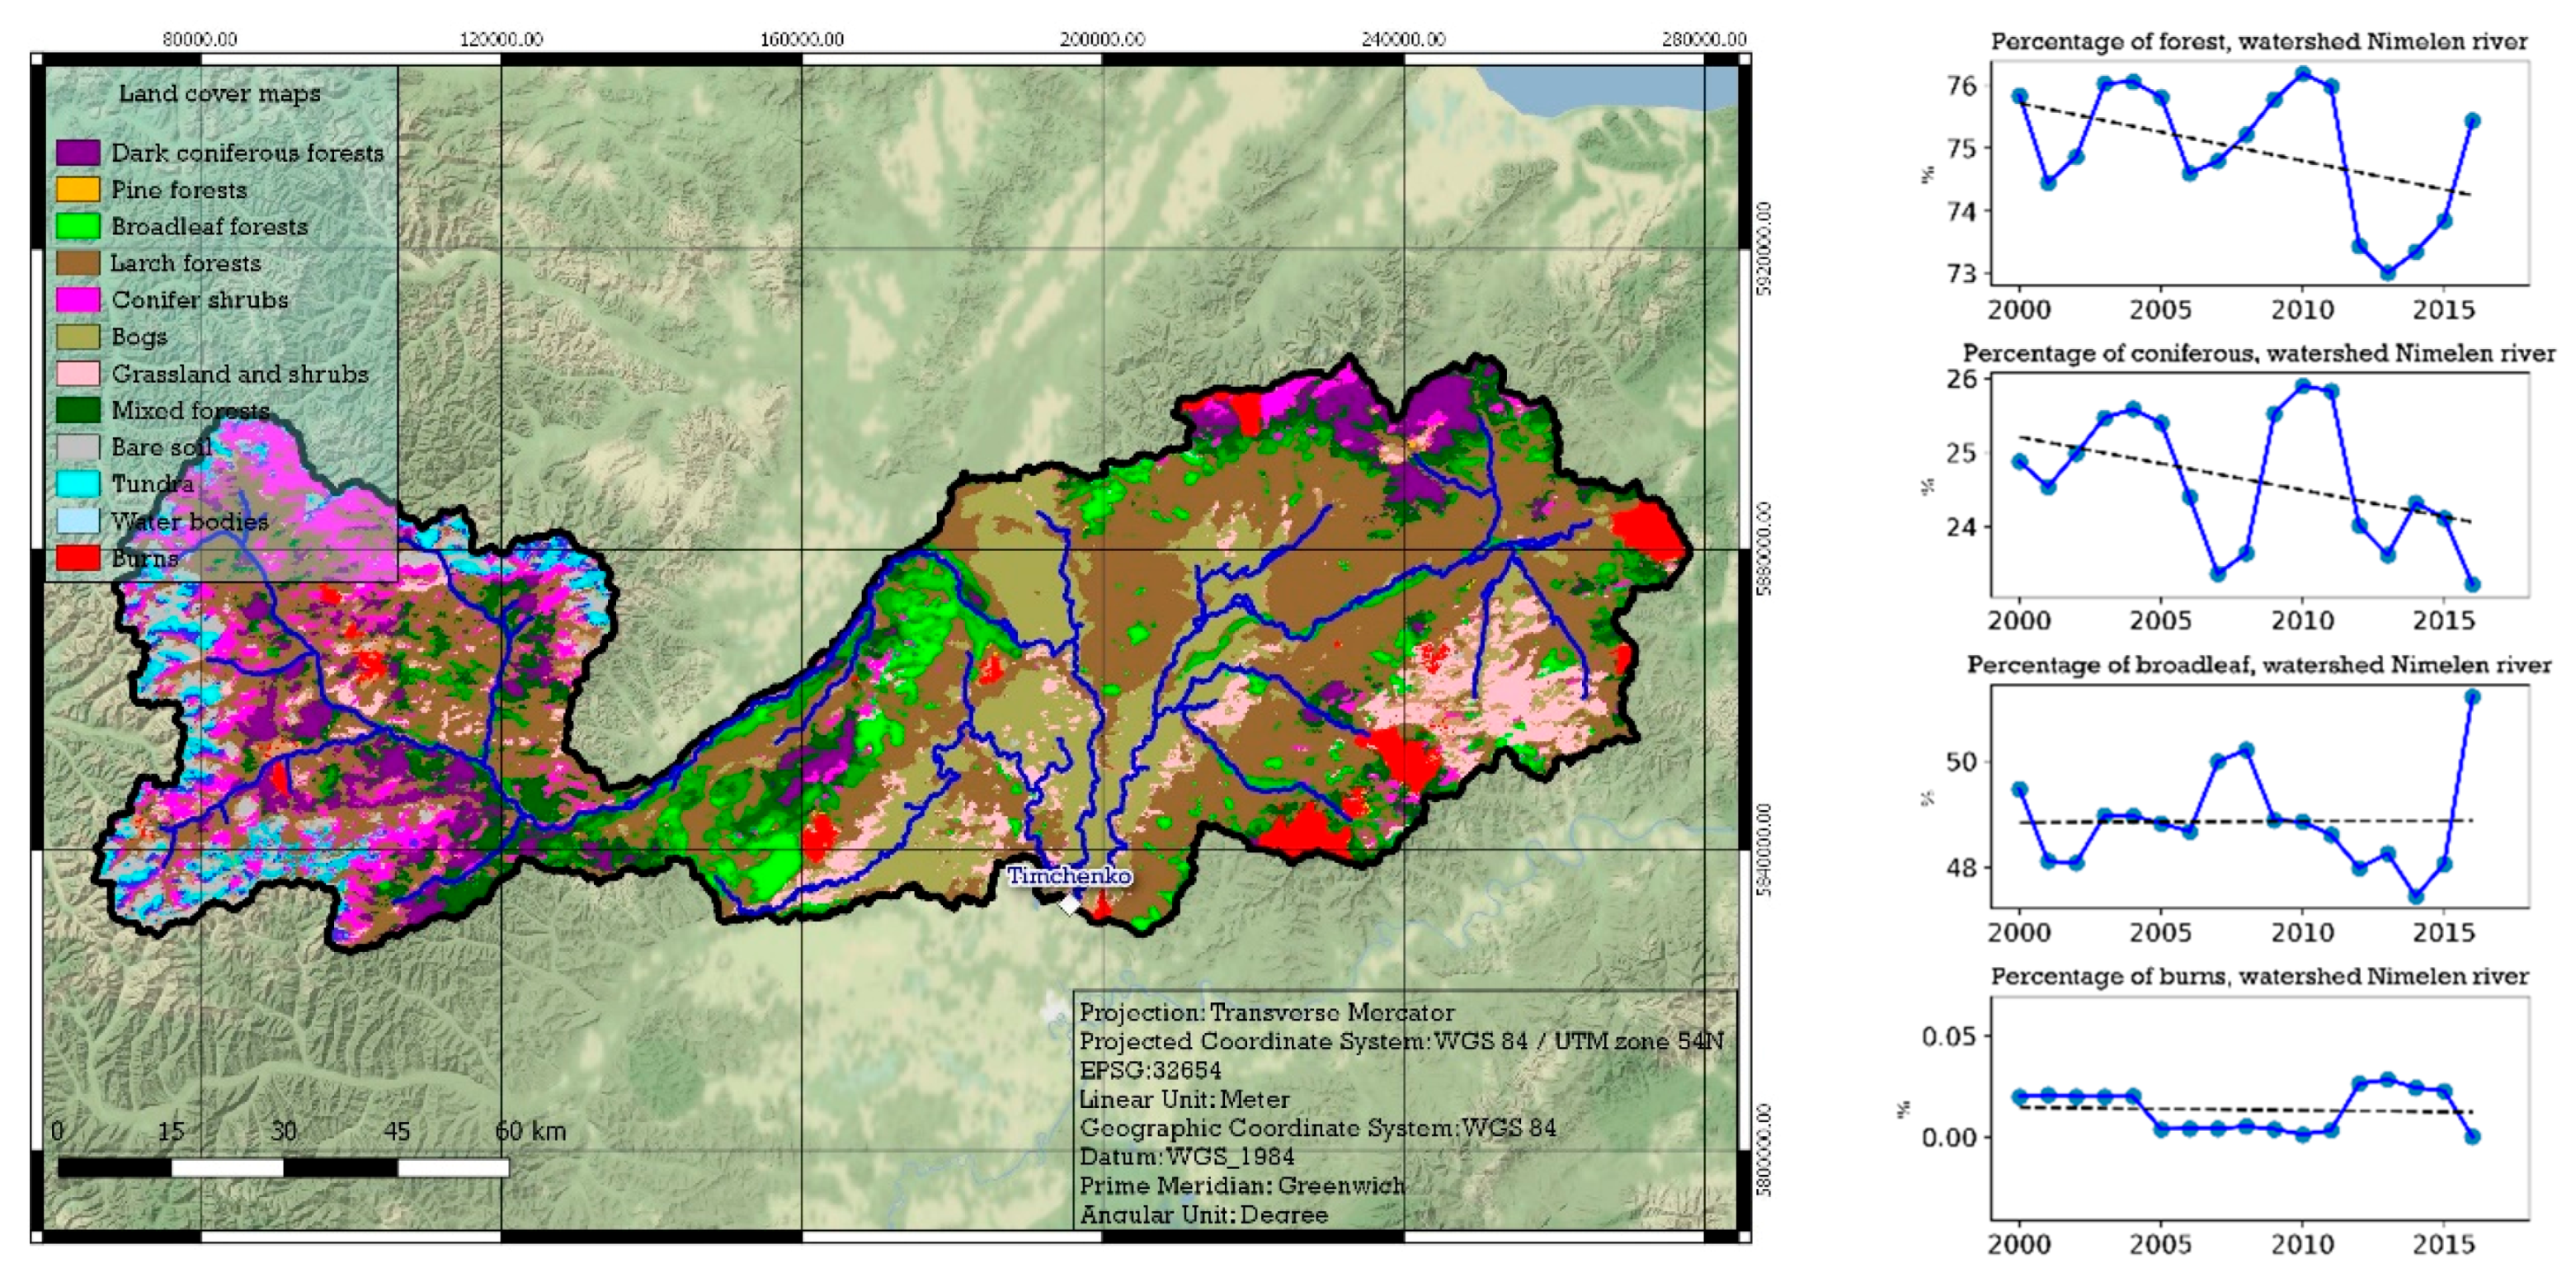
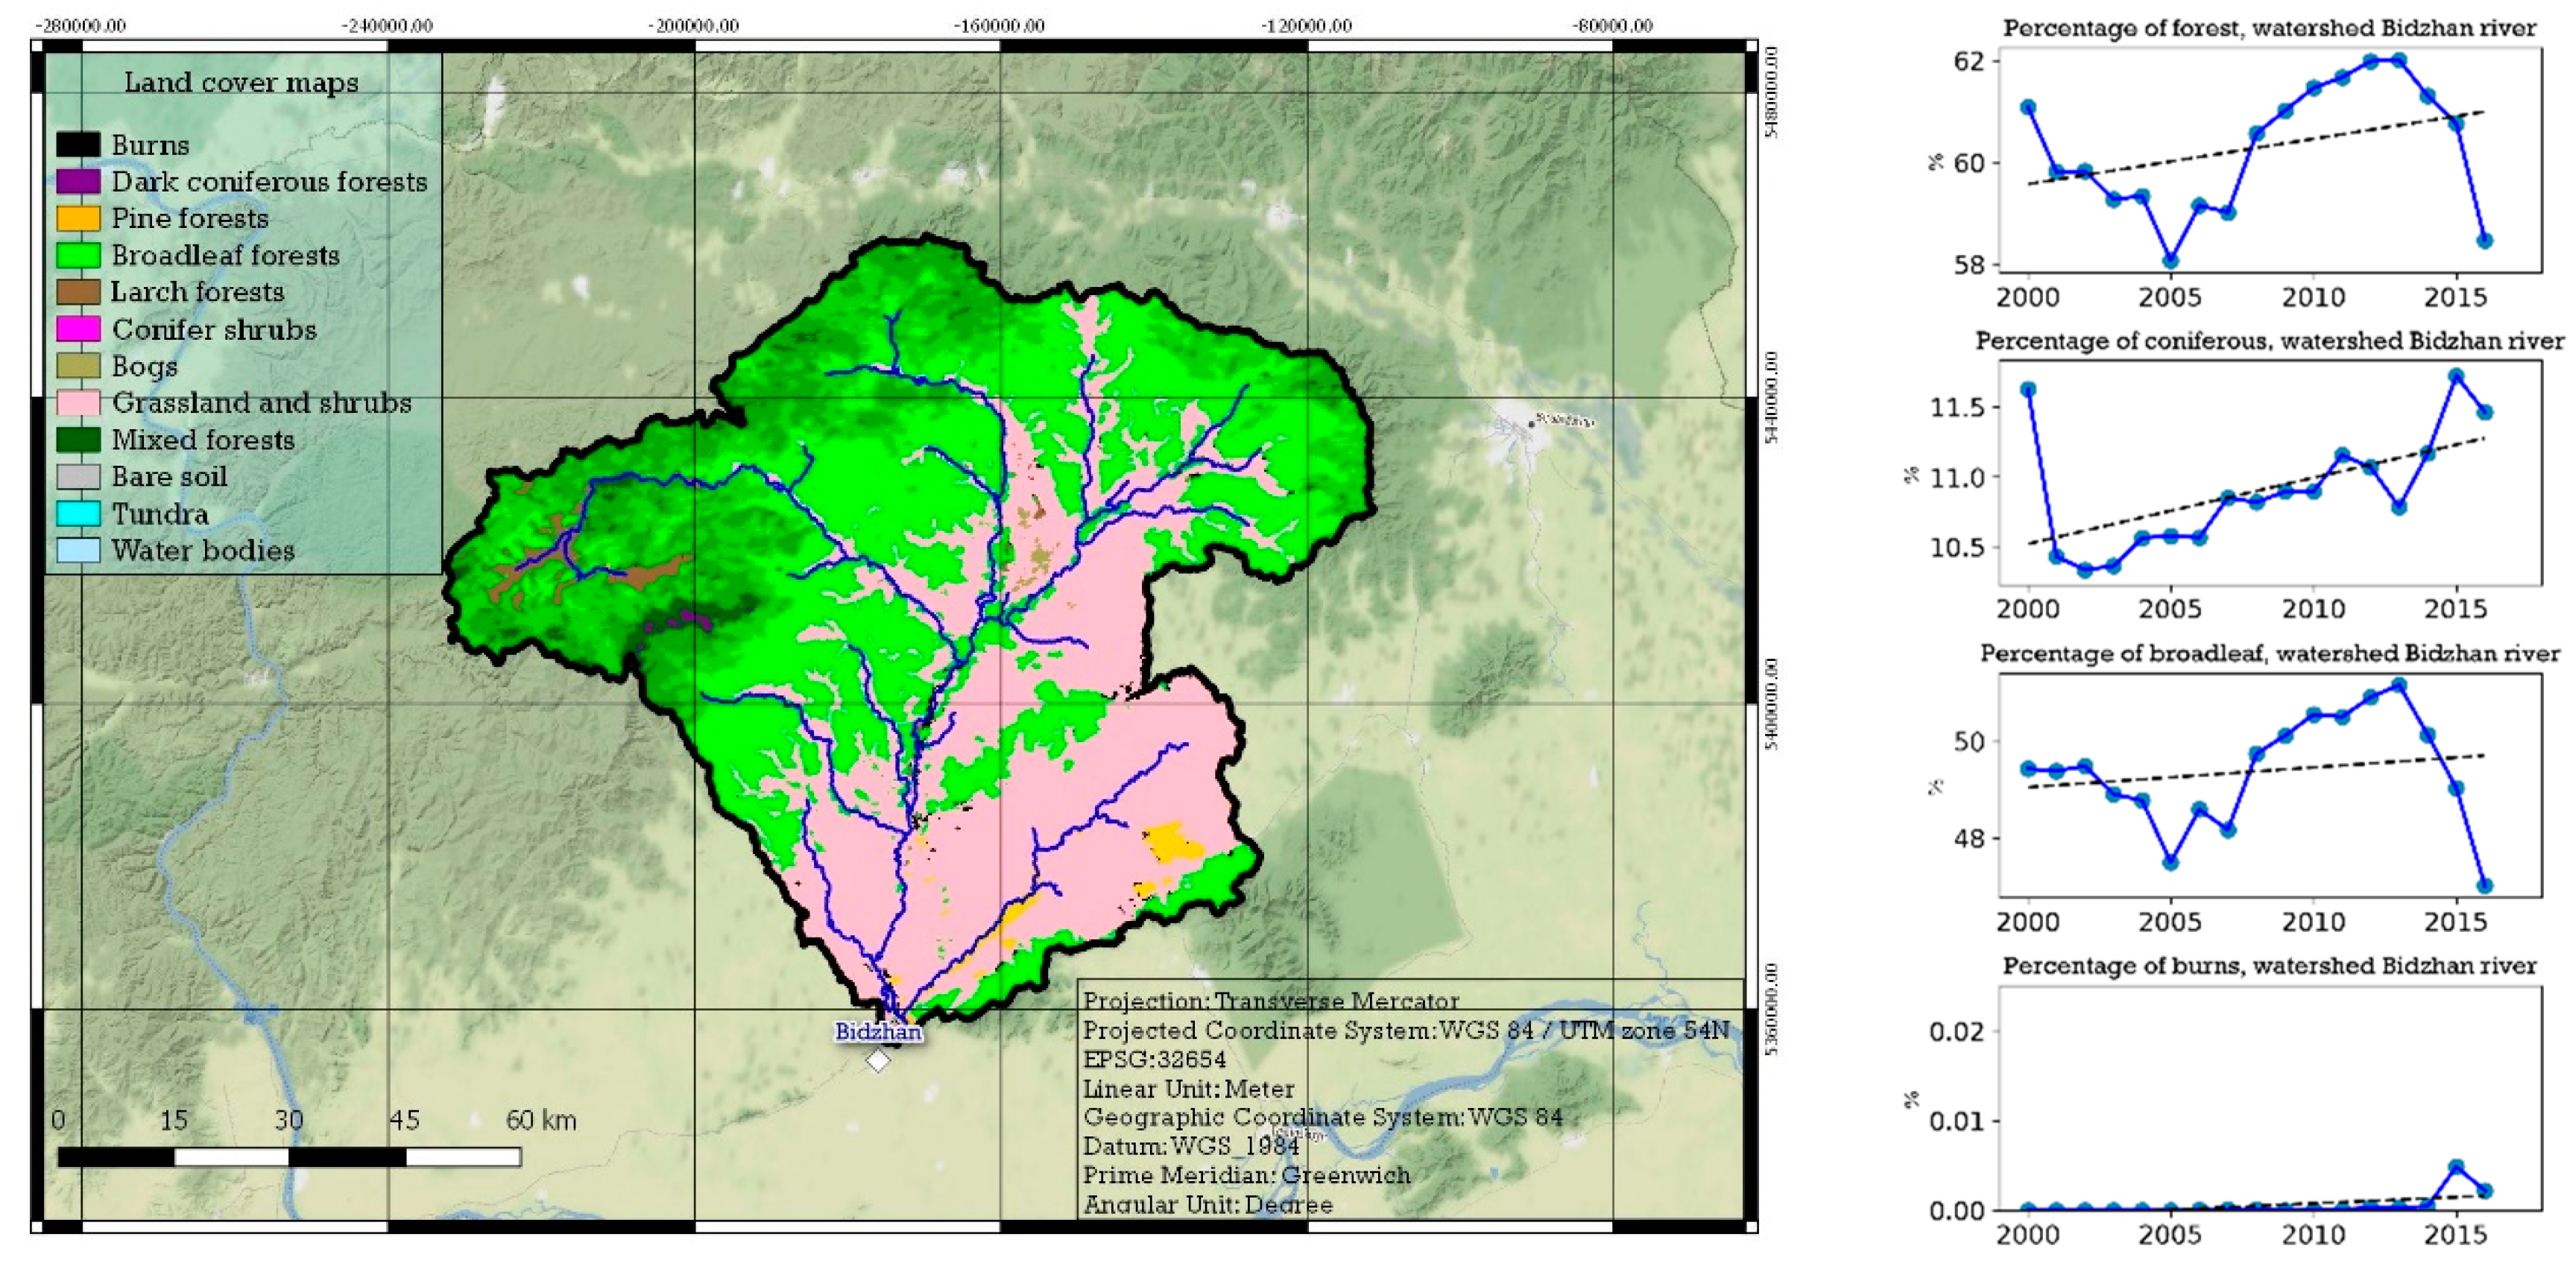
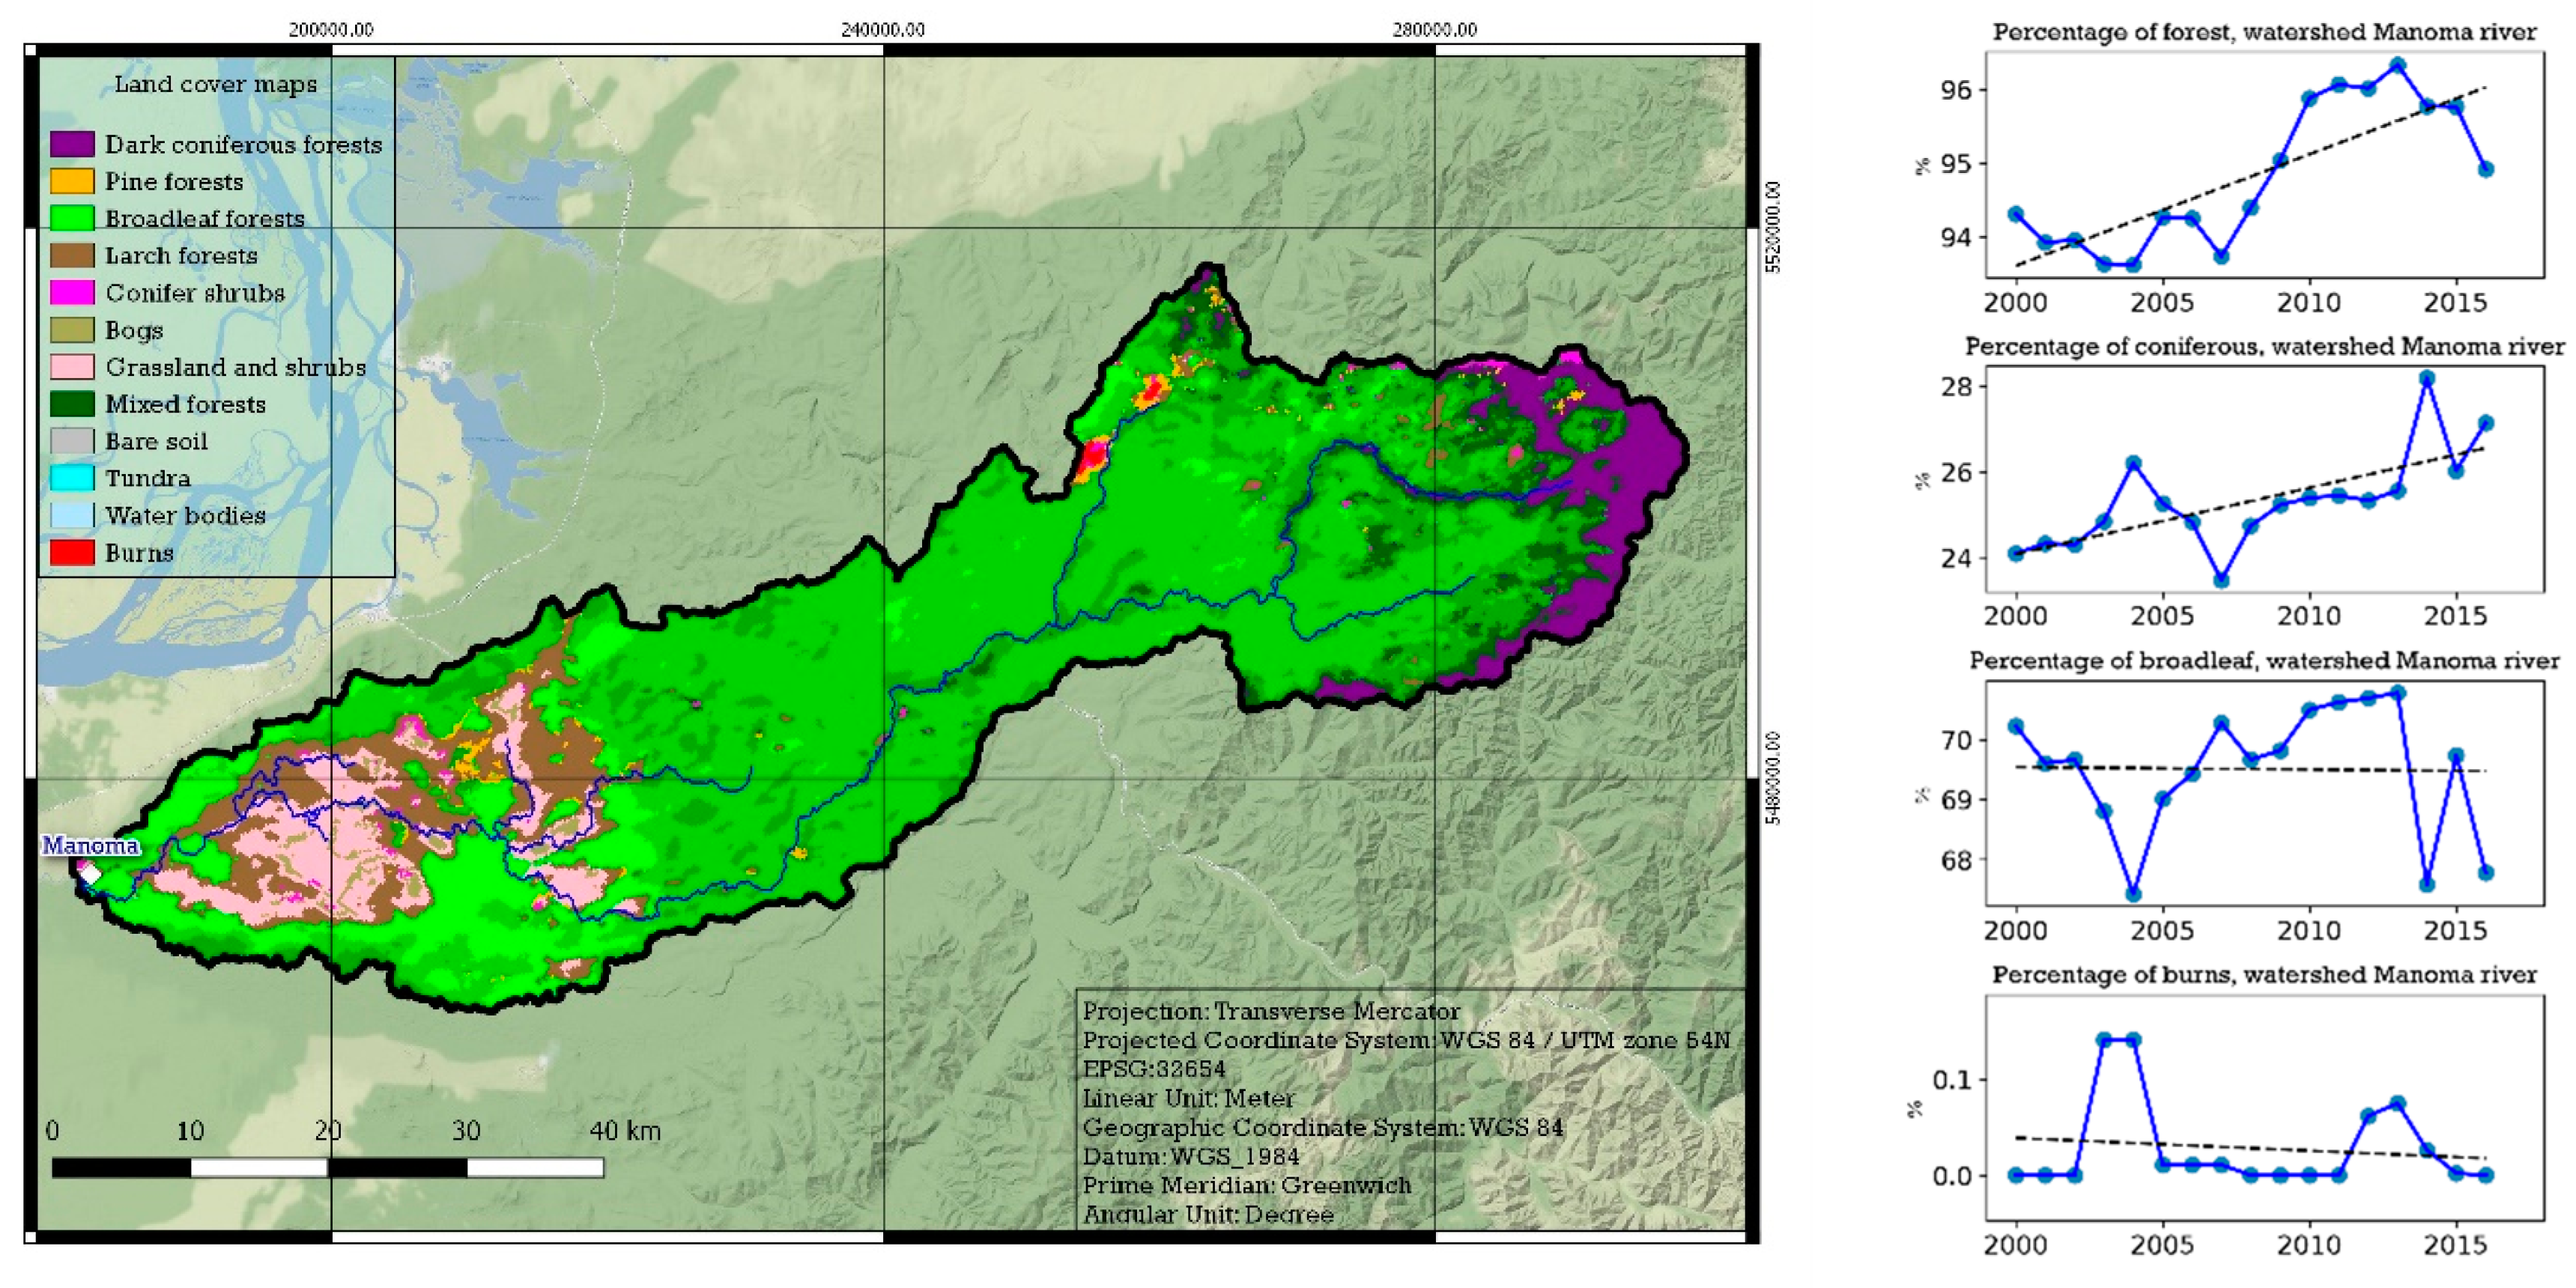
2.1. Study Area

The transboundary Amur River is among the world’s biggest river systems, with a basin area of more than 1,000,000 square kilometres. About 53% of the basin area is situated in Russia, 45% in China, and around 2% in Mongolia and North Korea. The longest waterway of the river system stretchs from the headstream of the Kherlen River, through the Dalai Lake, branch Mutnaya, Argun River into the Amur liman, totalling 5052 km. The Amur basin is situated in the climatically unstable region of the Northern hemisphere, where the Eurasia continent and the Pacific Ocean. This is an area with monsoon circulation, as well as a transitional zone between the temperate climate and tropics, which has the main influence on the hydrological regime of the Amur River with characteristic flooding. Over the past 20 years, the Amur River regime in the Far-eastern monsoon system is characterised by low levels of water in the summer, when the trajectories of shallow and short cyclones occur along the periphery of the Amur basin (1996, 2008) [33] (p. 143).
The geography of the basin has the shape of alternating mountain ridges and chains, oriented in the north-western direction, and intermountain hollows. Mountain relief occupies around 80% of the Amur basin area with the average elevation (above sea level) of 1000 m with some reaching 2000–2500 m above the sea level. High mountain ridges are covered with predominantly Larch Taiga forests, Pine forests with Pinus pumila on the hillsides, and mixed forests dominated by on foothills and lowlands. Coniferous forests with their resinous wood prone to more frequent and more intensive fires. With the thickness of the forest floor of 3–15 cm and low air humidity, between 7 and 20%, a forest fire would be persistent, with the frontal progression speed of 1.1–3 m/min. The forest floor burns down to the mineral level, and the surface root system of trees is severely burned at the same time. After such fires, Spruce forests completely dry out, and for Pine and Larch forests high levels of attrition have been observed (up to 30% of the growing stock, depending on the age and type of forest). Therefore, one of the highest levels of the forest fire statistics is in the Far East [29] (p. 223).
Eight river watersheds of the Middle and Lower Amur basin, where forests were exposed to fires and felling from the 1950s, were selected as objects of study [16,29]. They are: the Amgun, the Bidzhan, the Bureya (above the Bureya water reservoir), the Bira, the Kur, the Manoma, the Nimelen, and the Tyrma Rivers. Watershed areas, from headwaters to the locking gauging station, and meteorological stations are marked on the geographic map of the Amur Oblast, Khabarovski Krai and the Jewish Autonomous Oblast (Figure 3).

2.2. Hydrological Indicators

Series of continuous hydrological records have been analysed. The study of the dynamics of streamflow parameters focused on three forest covered watersheds: the Amgun and Bureya Rivers in the northern part of the Amur basin, and the Bira River with a smaller basin area and warmer climates in the southern latitudes. For the remaining five watersheds (Bidzhan, Kur, Manoma, Nimelen, and Tyrma Rivers), due to lack of streamflow data, figures for the maximum water levels at the locking stream gauge in the period of rainfall floods were analysed. Flow parameters for river models have been calculated for the period of rainfall floods from July to August each year, with the summer month June excluded from the calculations due to the observed snow-rainfall floods, i.e., with the snowmelt flow present (Table 2).

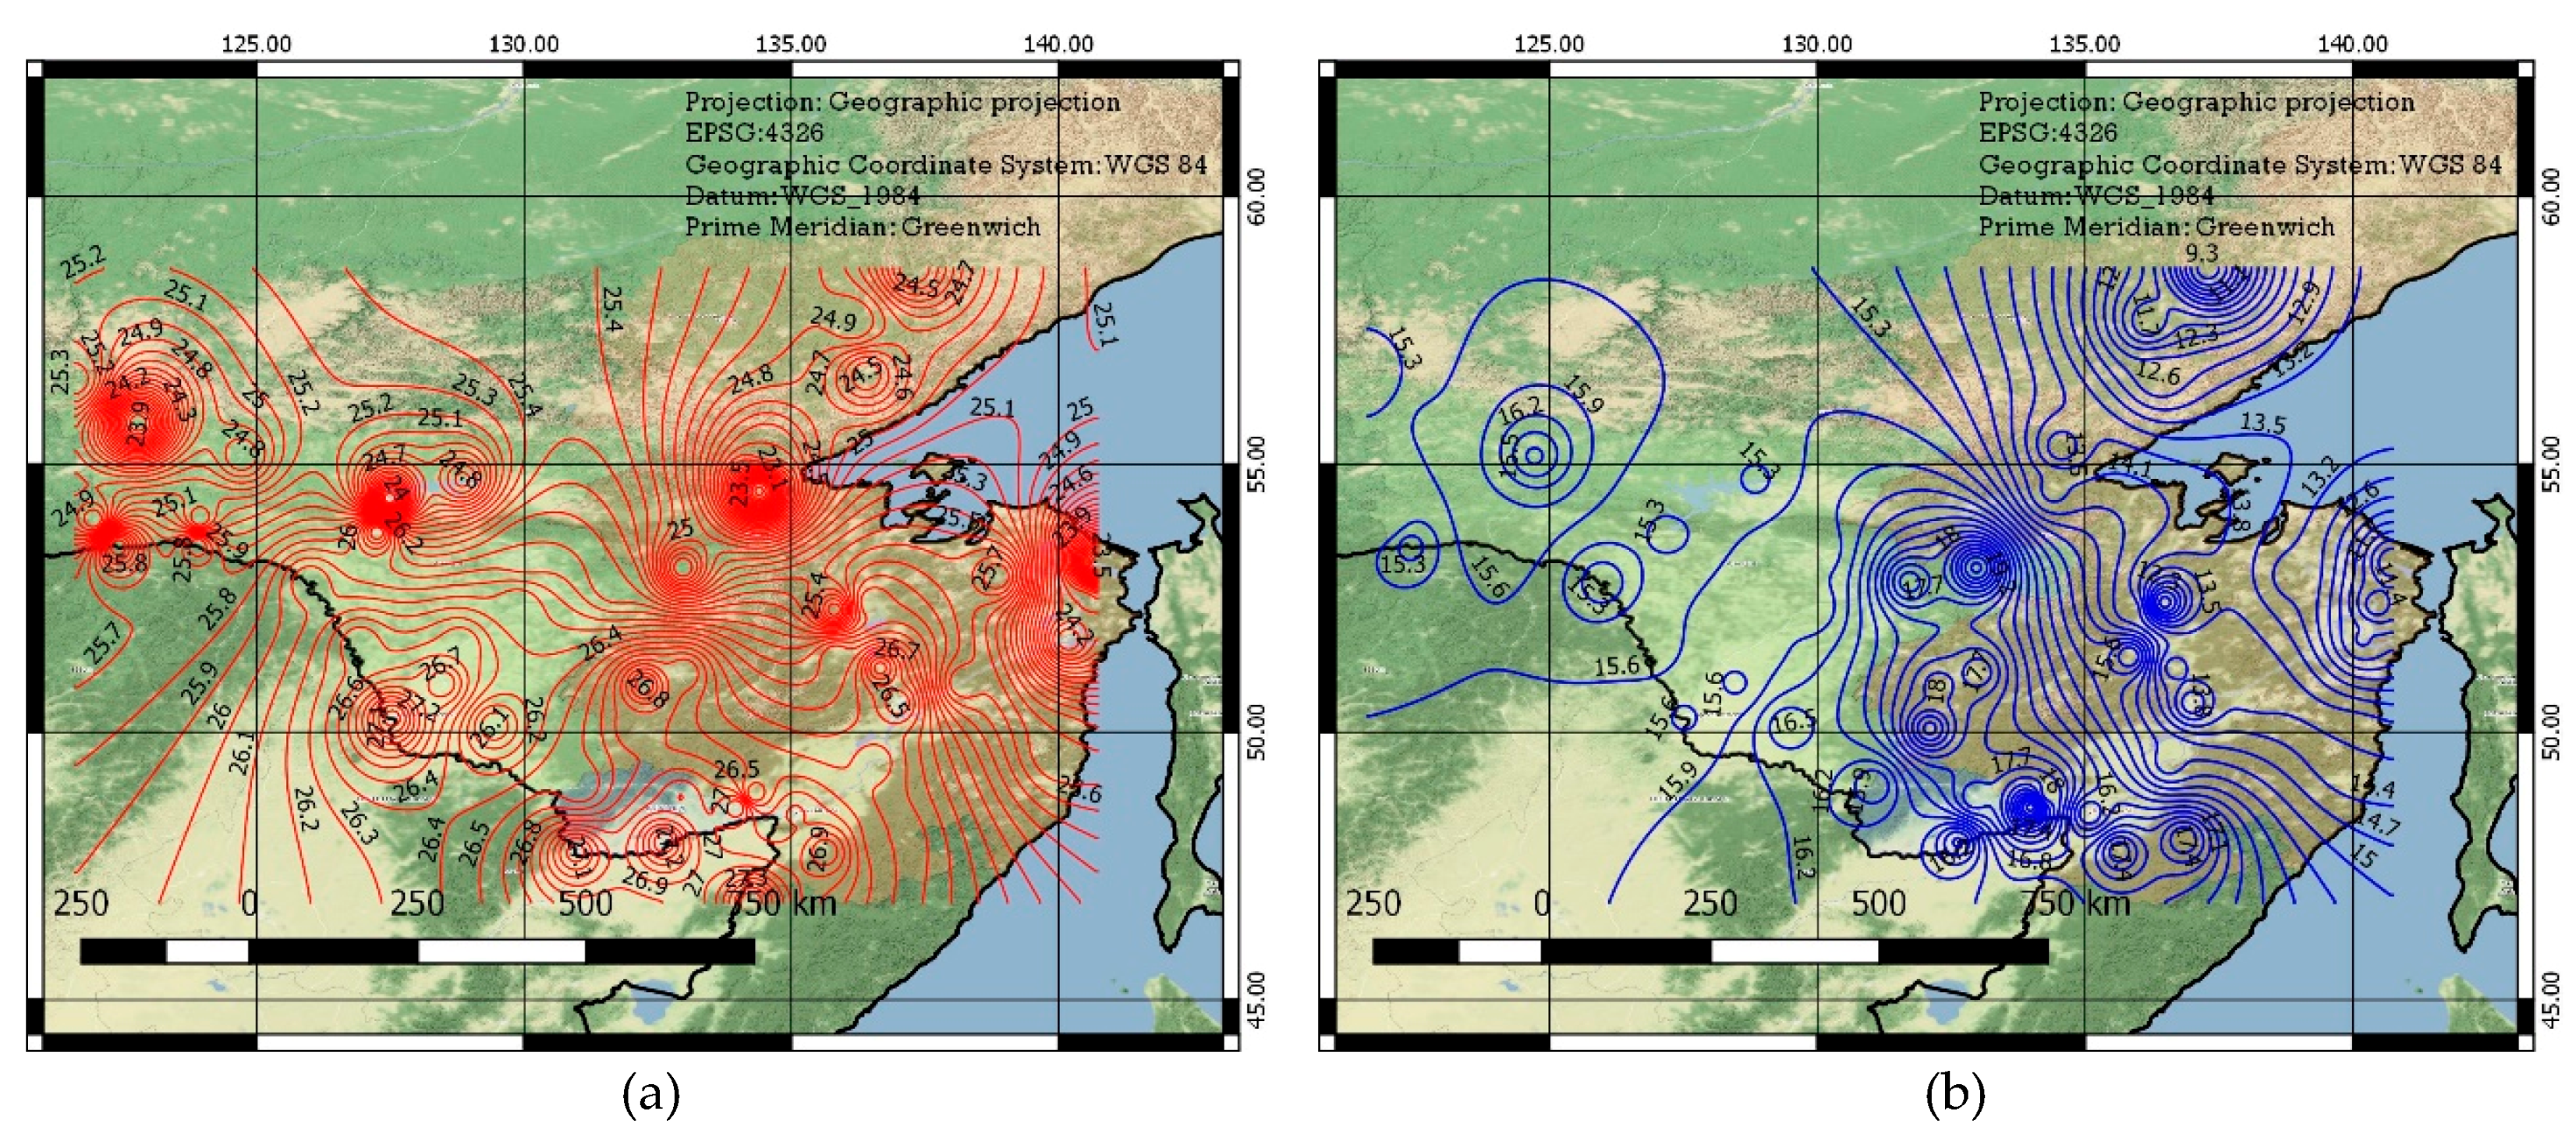
2.3. Climatic Indicators

Using the inverse distance weighted interpolation method, according to 50 weather stations for the period from 1980–2009, climatic maps of isolines of the distribution of maximum air temperature and the sum of rainy days were constructed. The calculation of indicators was carried out for the period of rain floods from July to August of each year, and June was excluded in connection with the observed annual rainfall, that is, with the participation of thawed flow. For the temperature, the maximum was selected from the two-month indices and averaged over all years was performed. The two-month air humidity was estimated by the amount of rainy days received by the Federal Forestry Agency to assess fire danger in the forests of Russia (3 mm/day or more) [29], then all years were averaged.

2.4. Precipitation

During the warm season, the main source of power for the river is precipitation, but before reaching the stream bed, they lose a certain part of their volume, passing through the forest canopy and forest soil of the watersheds of the Amur basin. Moreover, the main streamflow-forming areas of the Amur basin are covered with forest with a predominance of conifers, the soils of which differ from the soils of deciduous forests. Also, the area of contact between forest canopy and precipitation is different (their penetration under the canopy is reduced). Based on the consideration of these features in the watersheds of the Amur Basin, we assume the transformation of rainwater into river runoff according to the following scheme, provided that the same amount of rainy days (Figure 4).
In the first case, the summer precipitation is transformed into streamflow, which takes into account the natural climatic processes: the invariability (or increase) of coniferous forest areas; standard surface rainfall from the slopes in riverbed; standard moisture infiltration into forest soil. It is assumed that the processes here take place without the influence of the anthropogenic factor—economic activities on forest watersheds, the main of which are felling. In the second case, reduction of coniferous forest areas due to fires and felling is taken into account. At the same time, we assume that there is an increase in river flow in July–August due to less loss of rainwater. However, this will occur under the condition of a similar amount of rainy days. Coniferous forests, which have a resinous base, burn more intensively, regenerate more slowly, are more prone to felling as a valuable breed, and their reduction contributes to an increase in surface water from the slopes and a decrease in infiltration.

2.5. Estimation of Watersheds Forest Coverage

The Terra-MODIS [34] time-series dataset of 250 m resolution was used to obtain information about forest coverage and species composition in the studied watershed territory. The mapping method included pre-processing to reduce impact of interfere factors (clouds and their shadows, seasonal snow cover, hardware noise, etc.), followed by subsequent classification of various types of forests and other land cover classes using the Locally Adaptive Global Mapping Algorithm (LAGMA) [22]. The algorithm ensures classifier adaptivity to spatial changes of physical and geographical conditions, satisfying one of the requirements for methods of processing remote sensing data for large areas. The map legend includes 23 classes, 18 of them designate different vegetation types detected according to their natural forms, types of vegetative limbs and phenological dynamics. At present, this map is the most detailed spatial and thematic information resource about types of vegetation coverage of Russia, obtained using remote sensing data. The mapping process is automated, which ensures results repeatability and allows annual vegetation coverage mapping spanning whole country territory.
The remote sensing data processing and analysis approach to retrieve different vegetation types (forest, grassland, bogs) was as follows. The coniferous forest area is the sum of Dark coniferous forests area and Pine forests area, as well as the area of mixed forests with coniferous predominance. The broadleaf forests area included the area of mixed forests with predominance of hardwood. The forest area estimation was carried out for each group separately. The forest cover included all species of trees.

3. Results

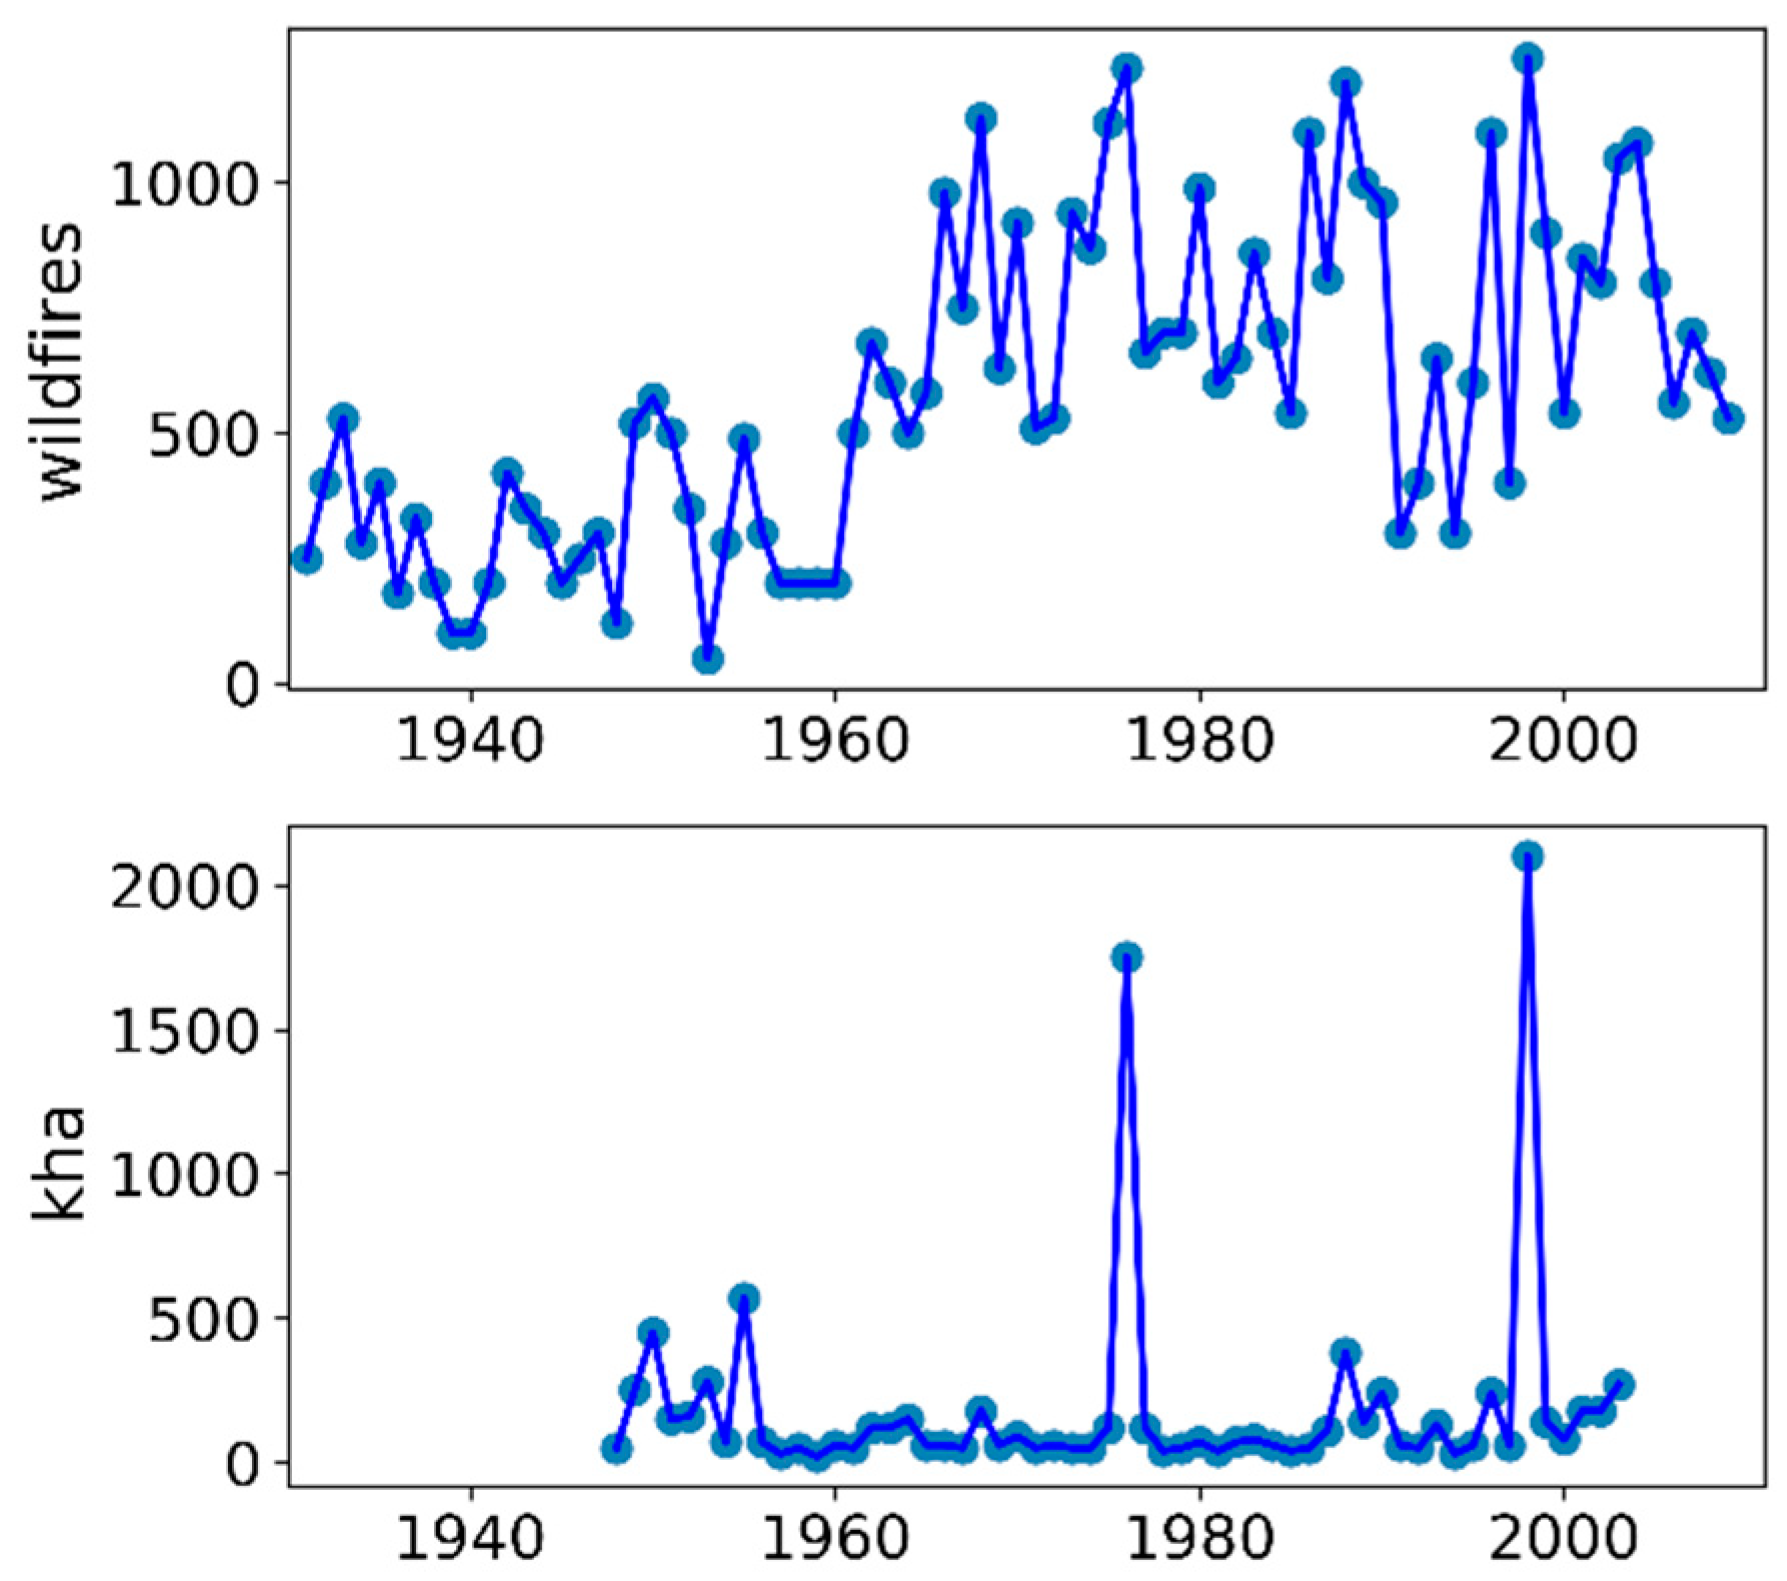
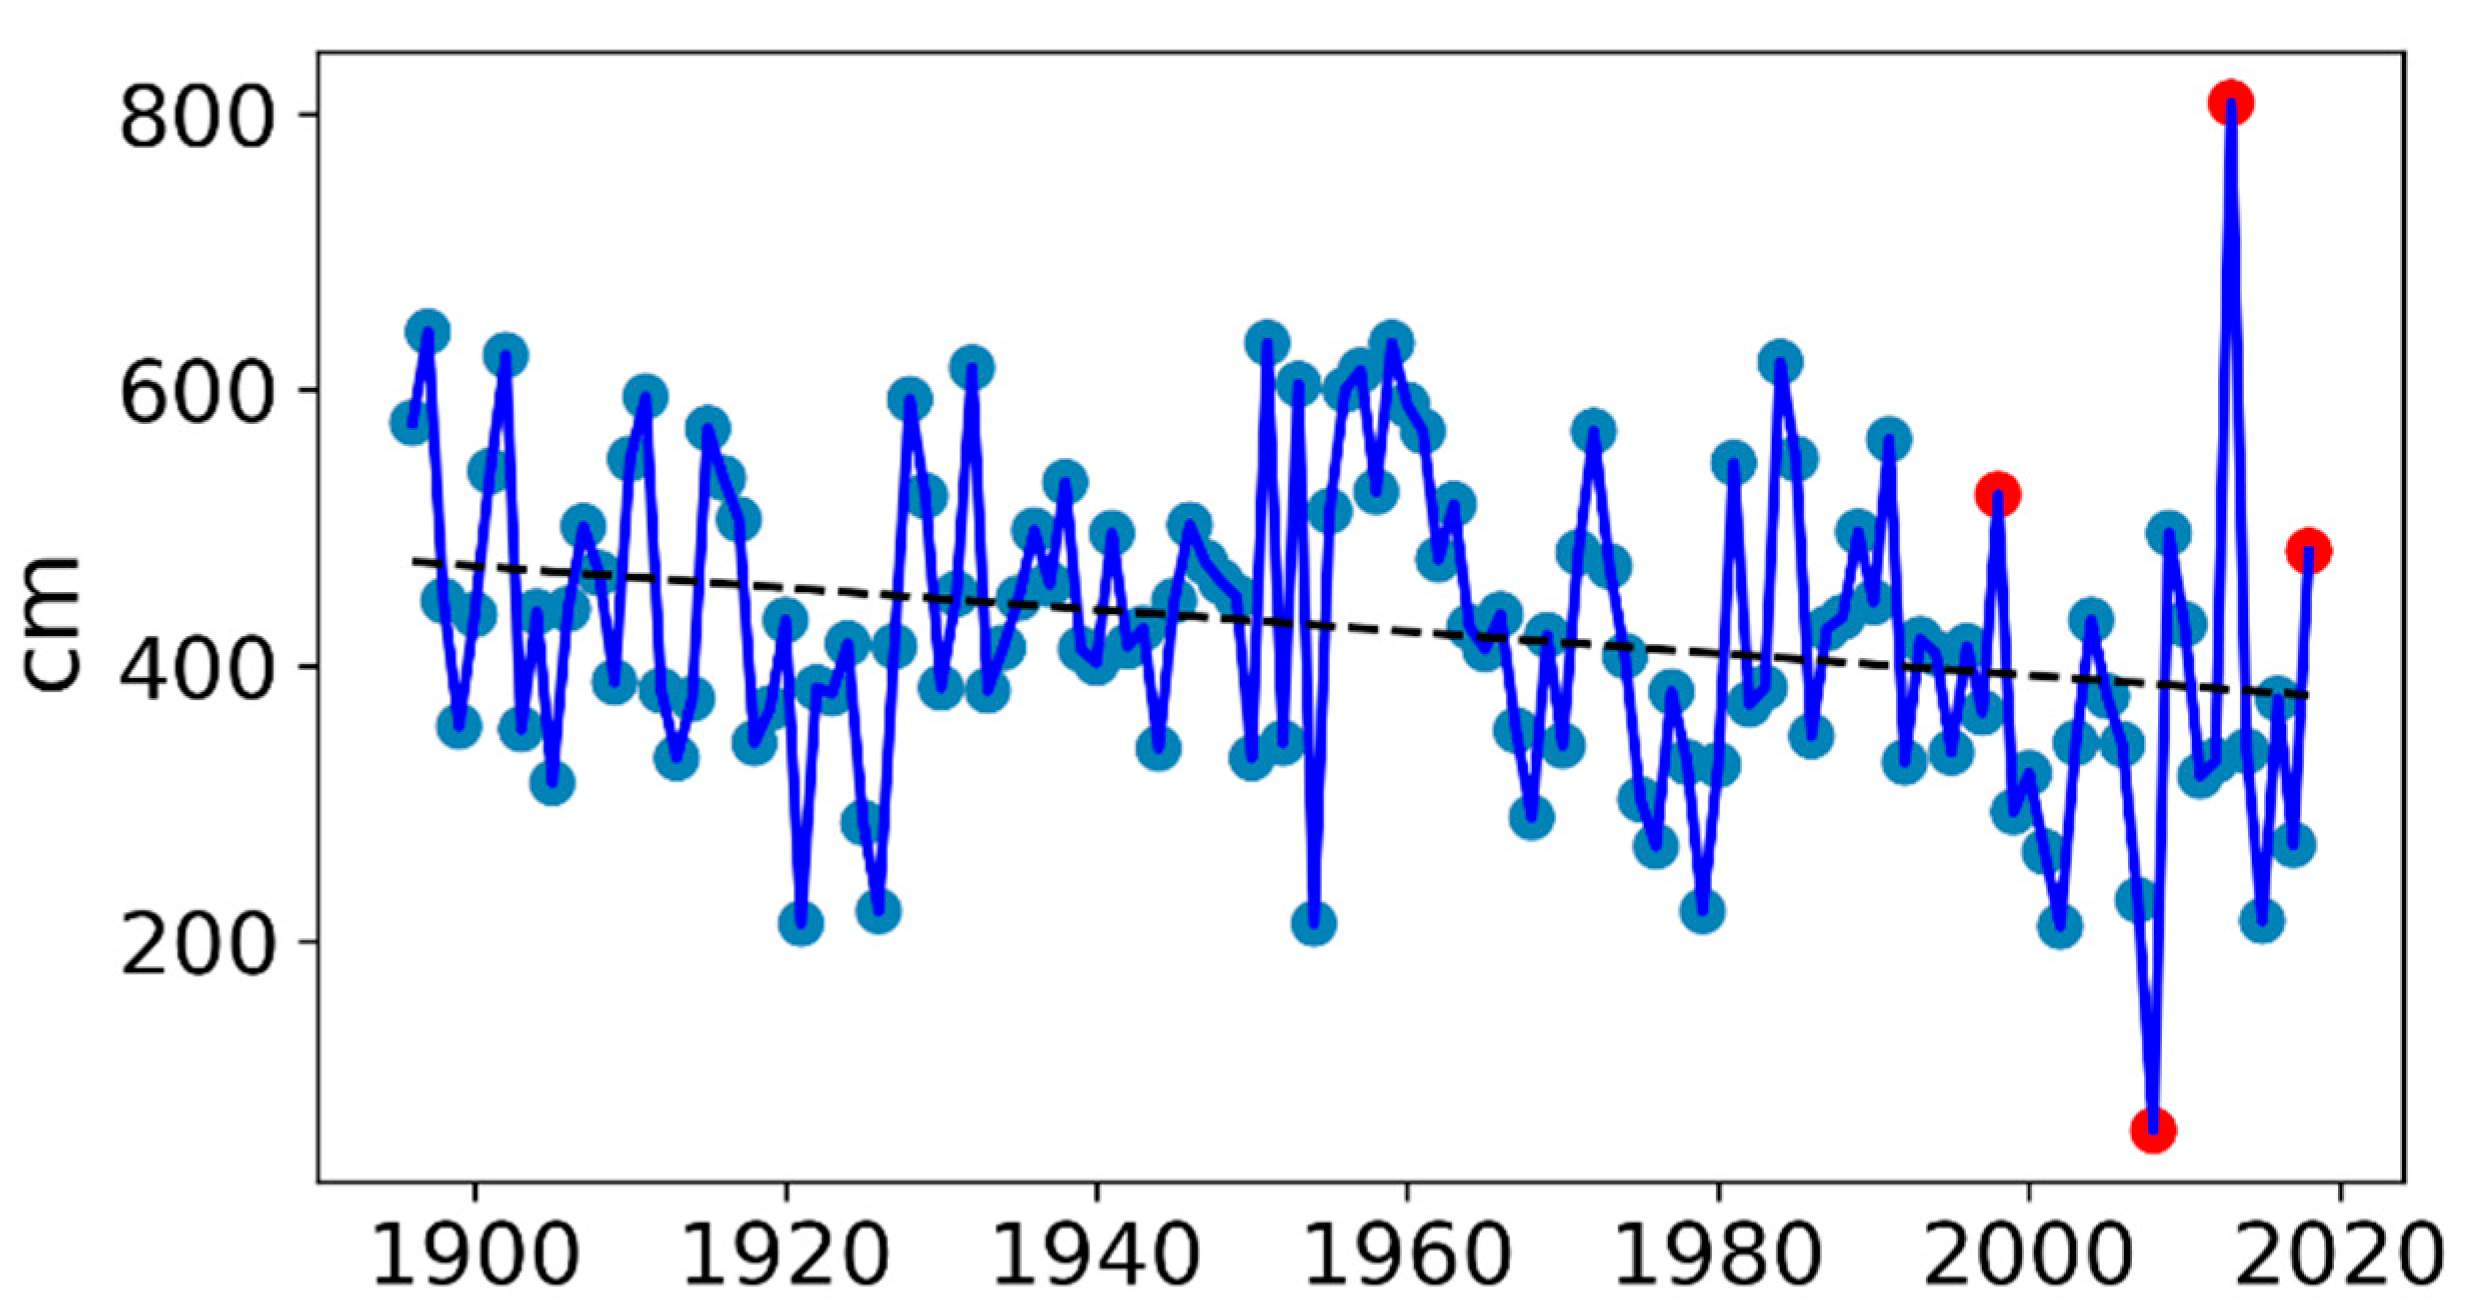
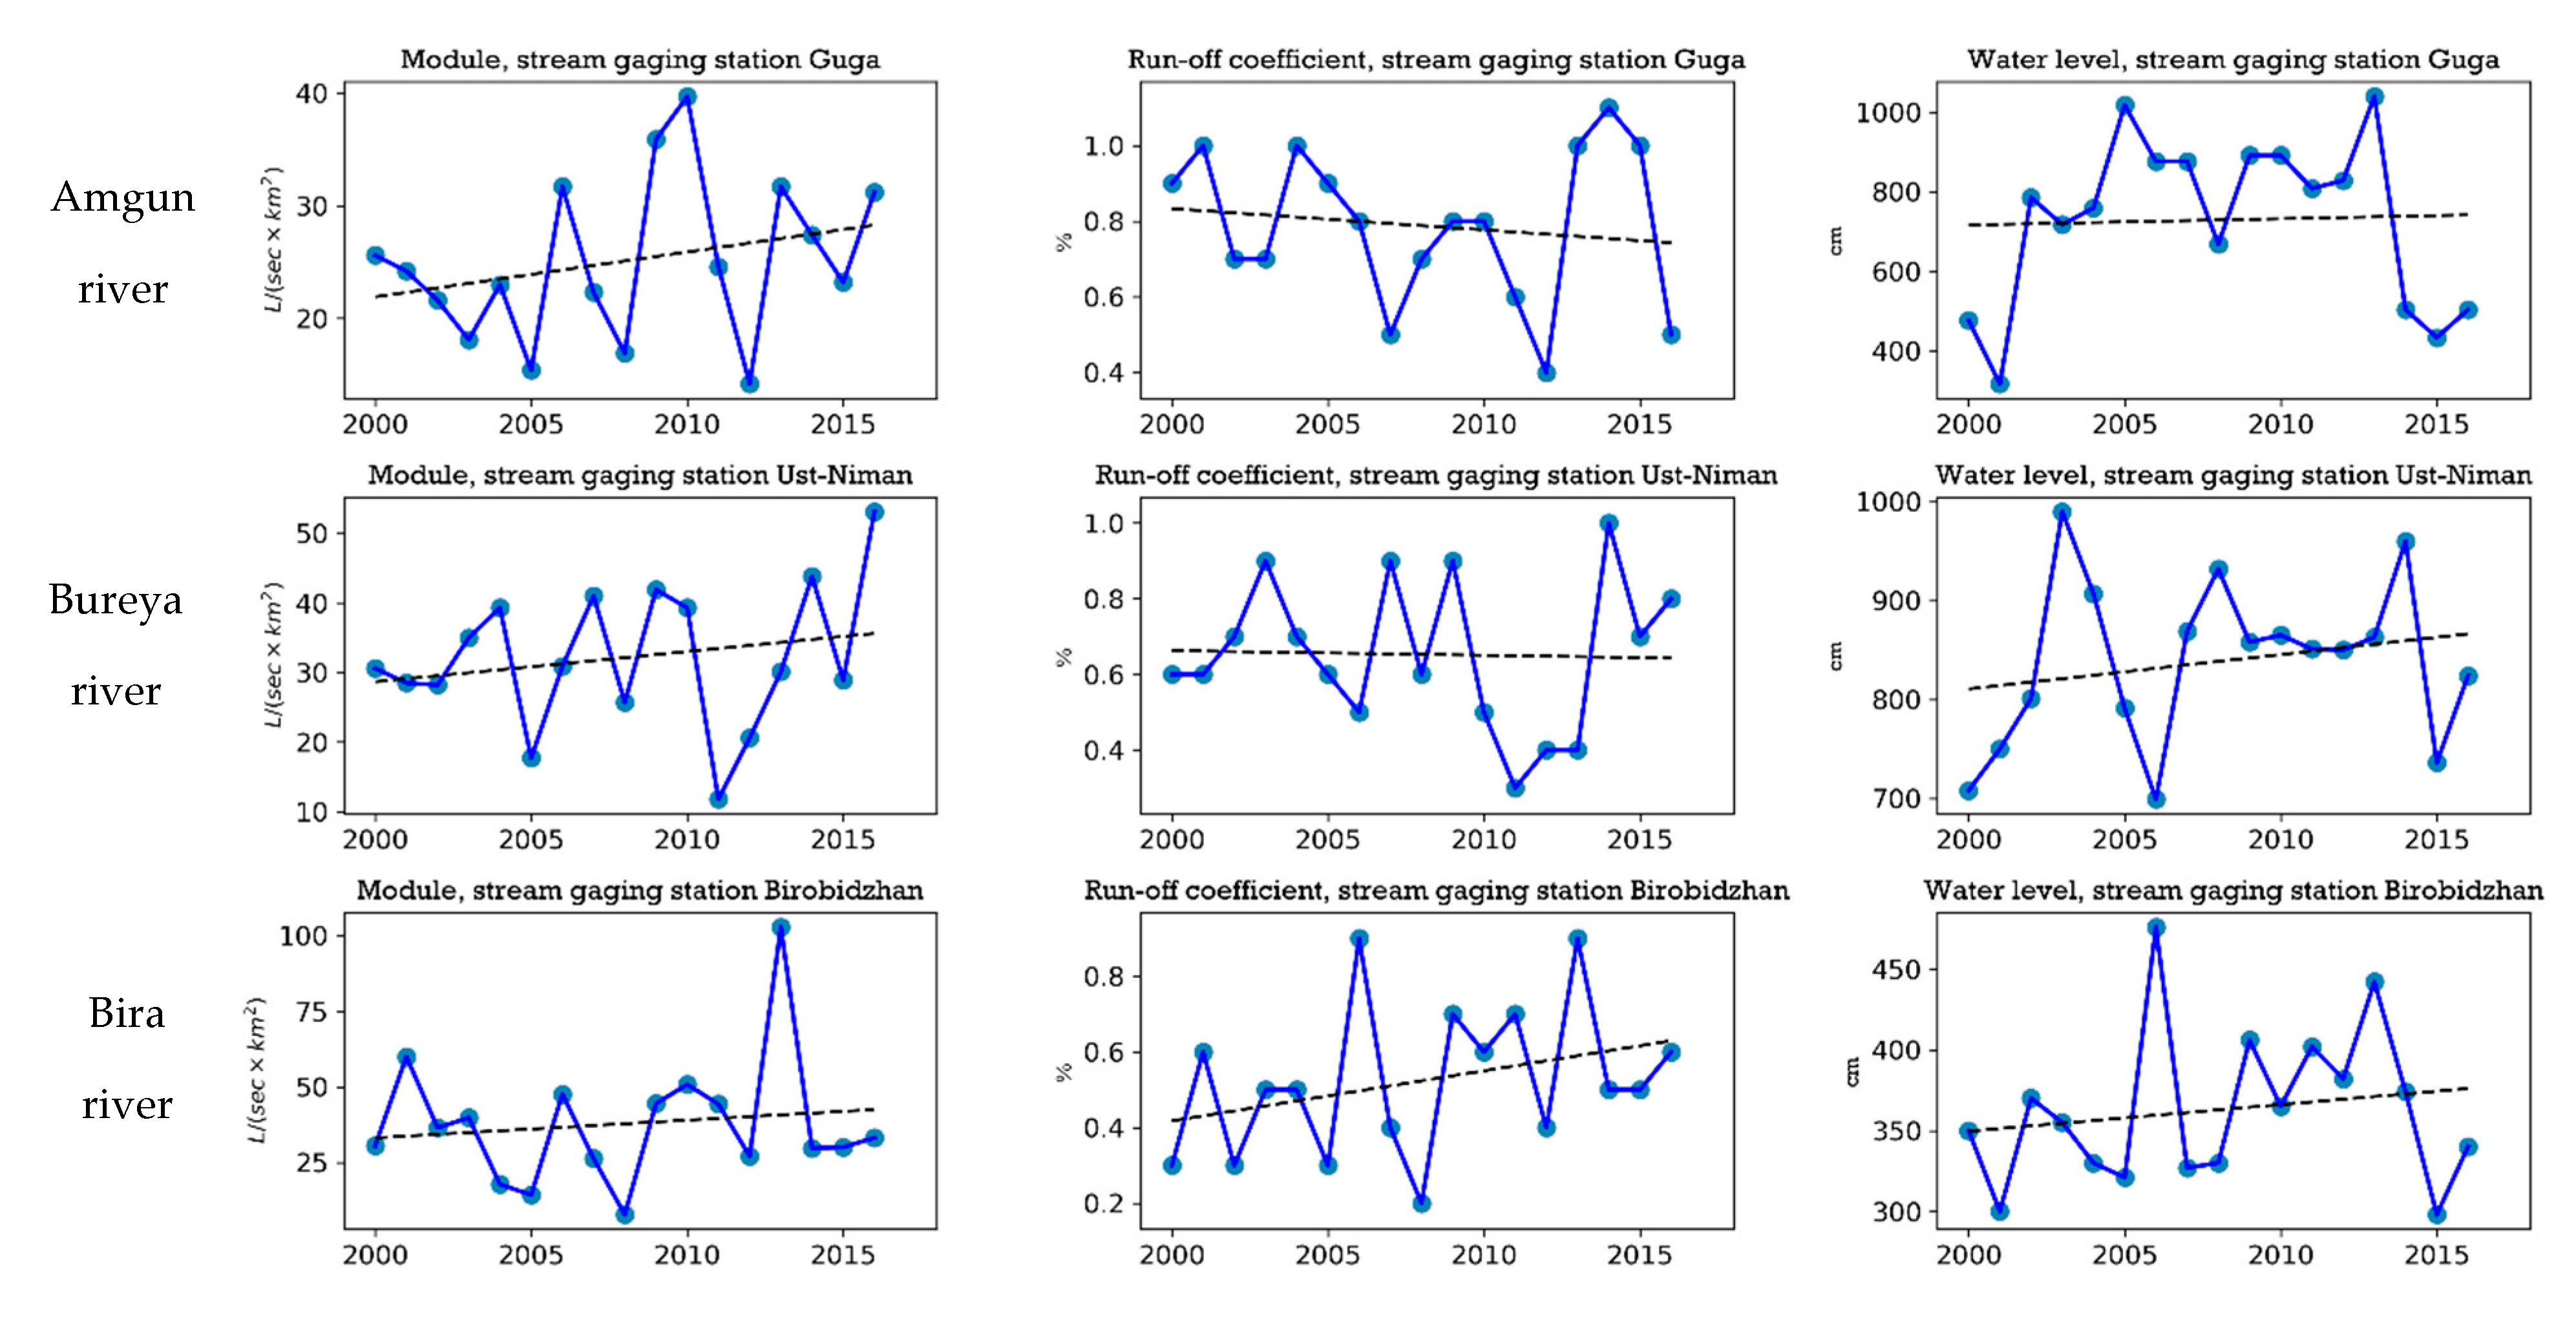
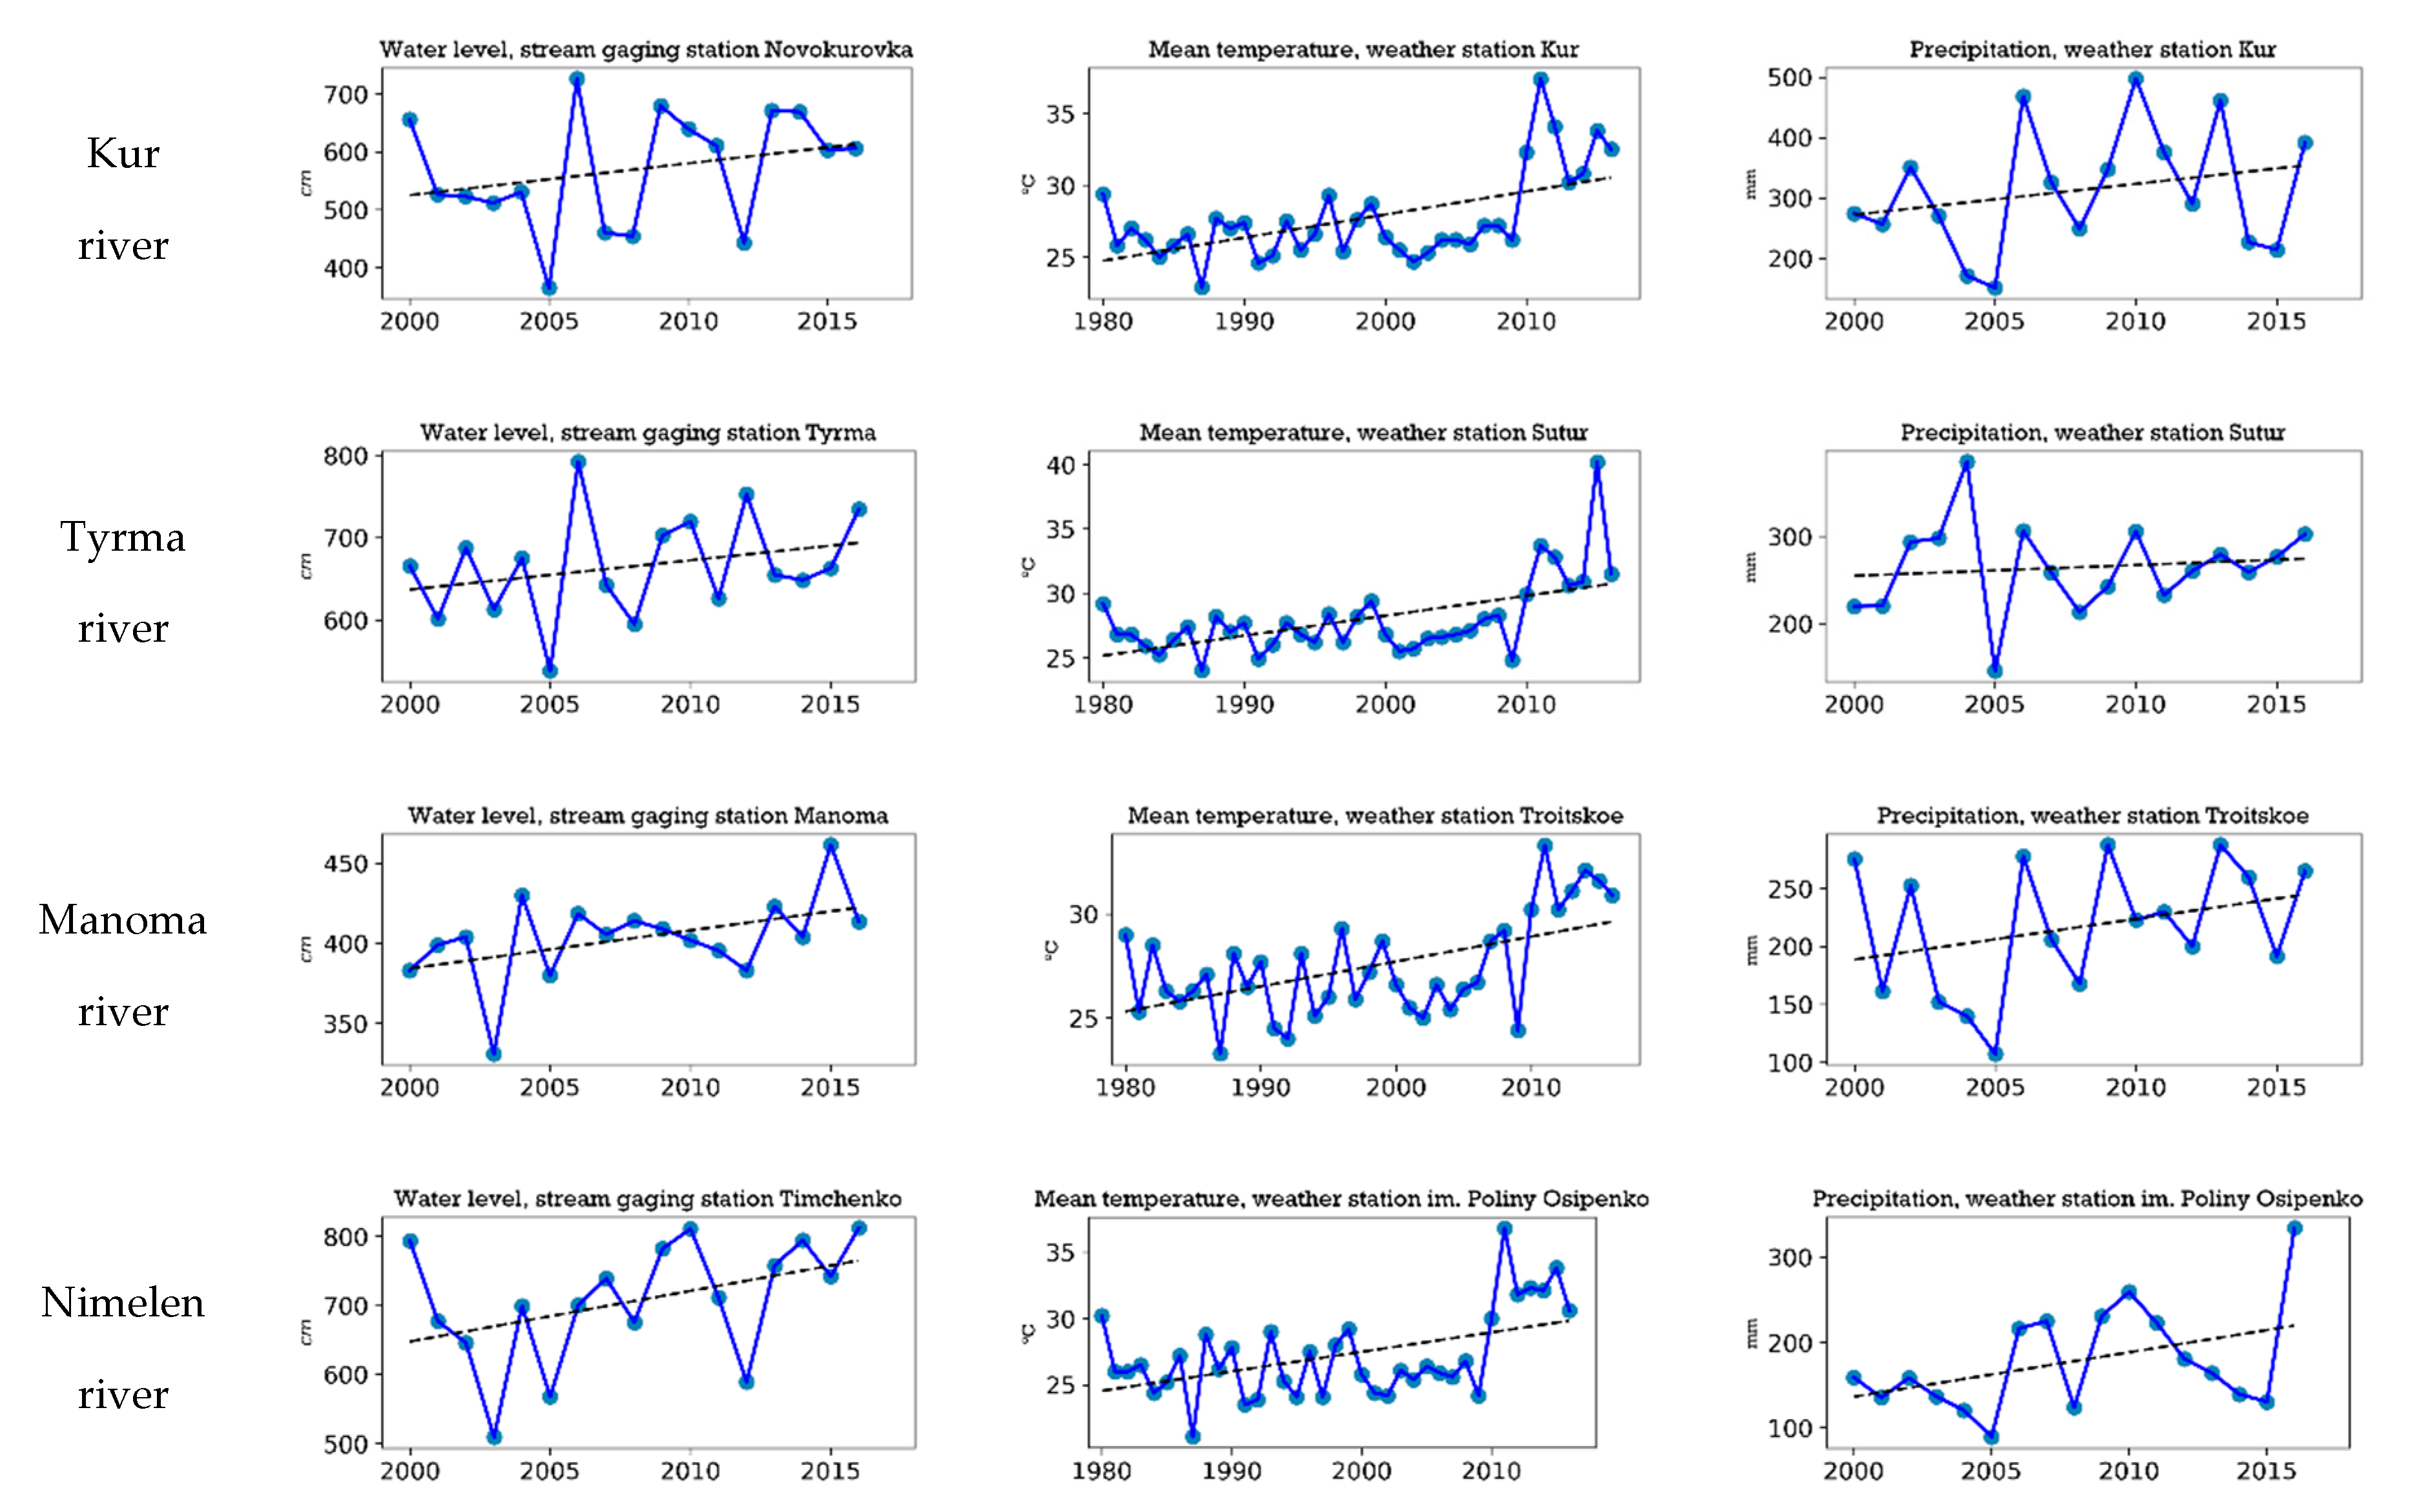
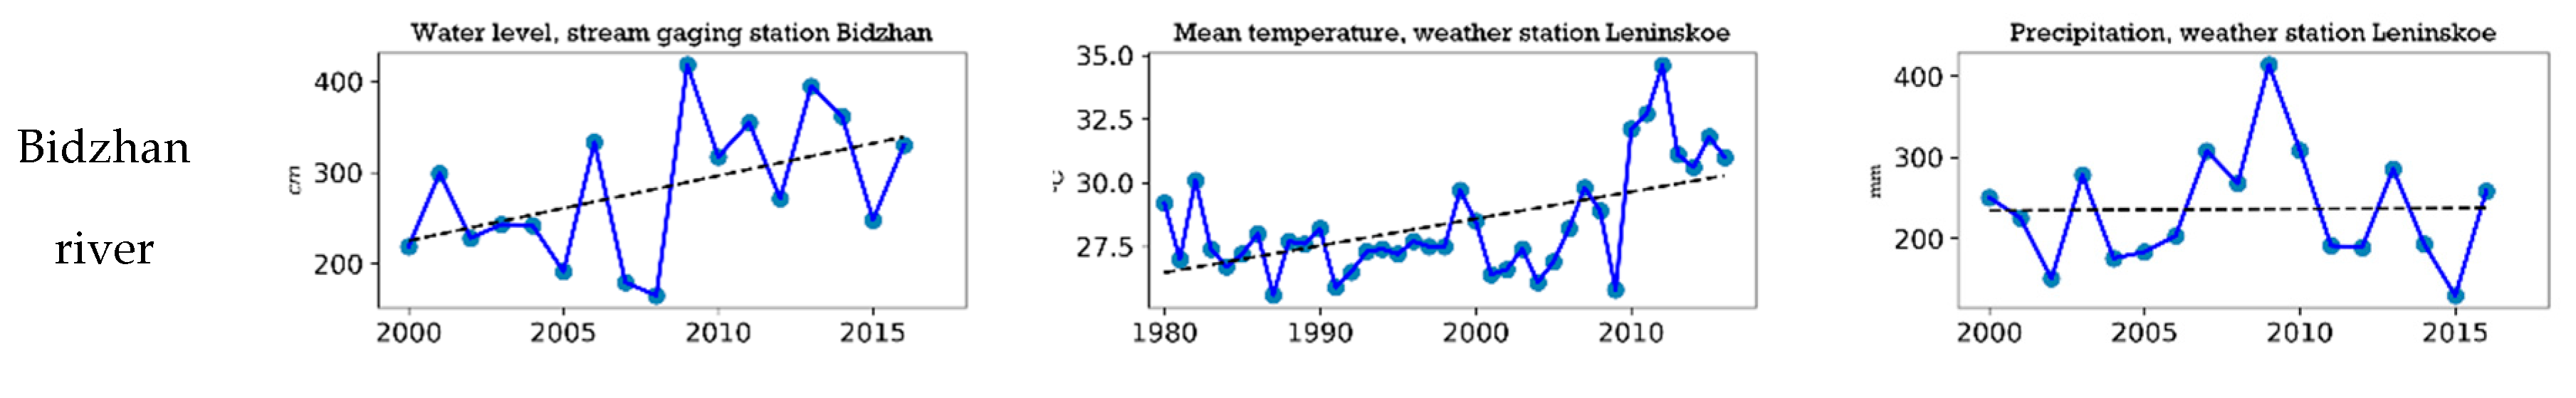
3.1. Increasing Indicators of Streamflow

Streamflow is the integrated variability indicator of natural-climatic and anthropogenic factors influencing watershed areas of rivers. These factors were studied in terms of their influence on the streamflow in the new conditions (changing climates, forest fires, felling). The two main ones have been selected: areas of mixed species forests and local climates. The temperature and humidity regime in all the watersheds under study for 2000–2016, with a predominantly positive trend fits well with the background distribution of meteorological indicators on the average multi-annual maps revealed during July–August 1980–2009 according to 50 stations (Figure 5).
However, despite the stable state of local and regional climates, a positive trend prevails in terms of streamflow and water levels in watersheds since 2000 (Figure 6). Considering that, precipitation is the main factor in the formation of the streamflow in the rainfall floods regime, an estimation has been made of how much of the rainwater is lost due to soil infiltration in the watershed and transformation into the groundwater flow. Thus, high coefficients of flood flow for the northern rivers—the Amgun and the Bureya (average for 2000–2016, are 0.8 and 0.7 accordingly)—indicate a small loss of rainwater flowing into the riverbeds. Low negative or almost zero trend values of these coefficients (Figure 6) indicate the poor soil permeability, which contributes to the flow of precipitation, up to 70–80% into riverbeds. Consequently, the remaining part of the rainwater is lost during the transformation into the groundwater flow. Thus, the zone where the rivers of the northern areas of the Amur basin flow continues to be characterised by stable (from 1960–1980s) excessive moisture [20].
For the southern Bira River the average long-term coefficient of streamflow decreases to 0.5 (Figure 6). However, in hydrology, this value is considered high, since in the steppe and semi-desert regions of Russia, the value of the coefficient drops even below 0.1. The positive trend of flood flow coefficients of the Bira River indicates an increase in the water capacity of the watershed soil in warmer climatic conditions by comparison with the Amgun and Bureya Rivers.
In the remaining five forest-covered river basins (Bidzhan, Kur, Nimelen, Manoma, Tyrma), a similar temporal distribution of meteorological and hydrological indicators prevails (Figure 7). Due to the lack of data on streamflow of these rivers, the highest water levels for July–August, which are the result of the maximum flow of water during the period of rain floods, were taken for analysis.

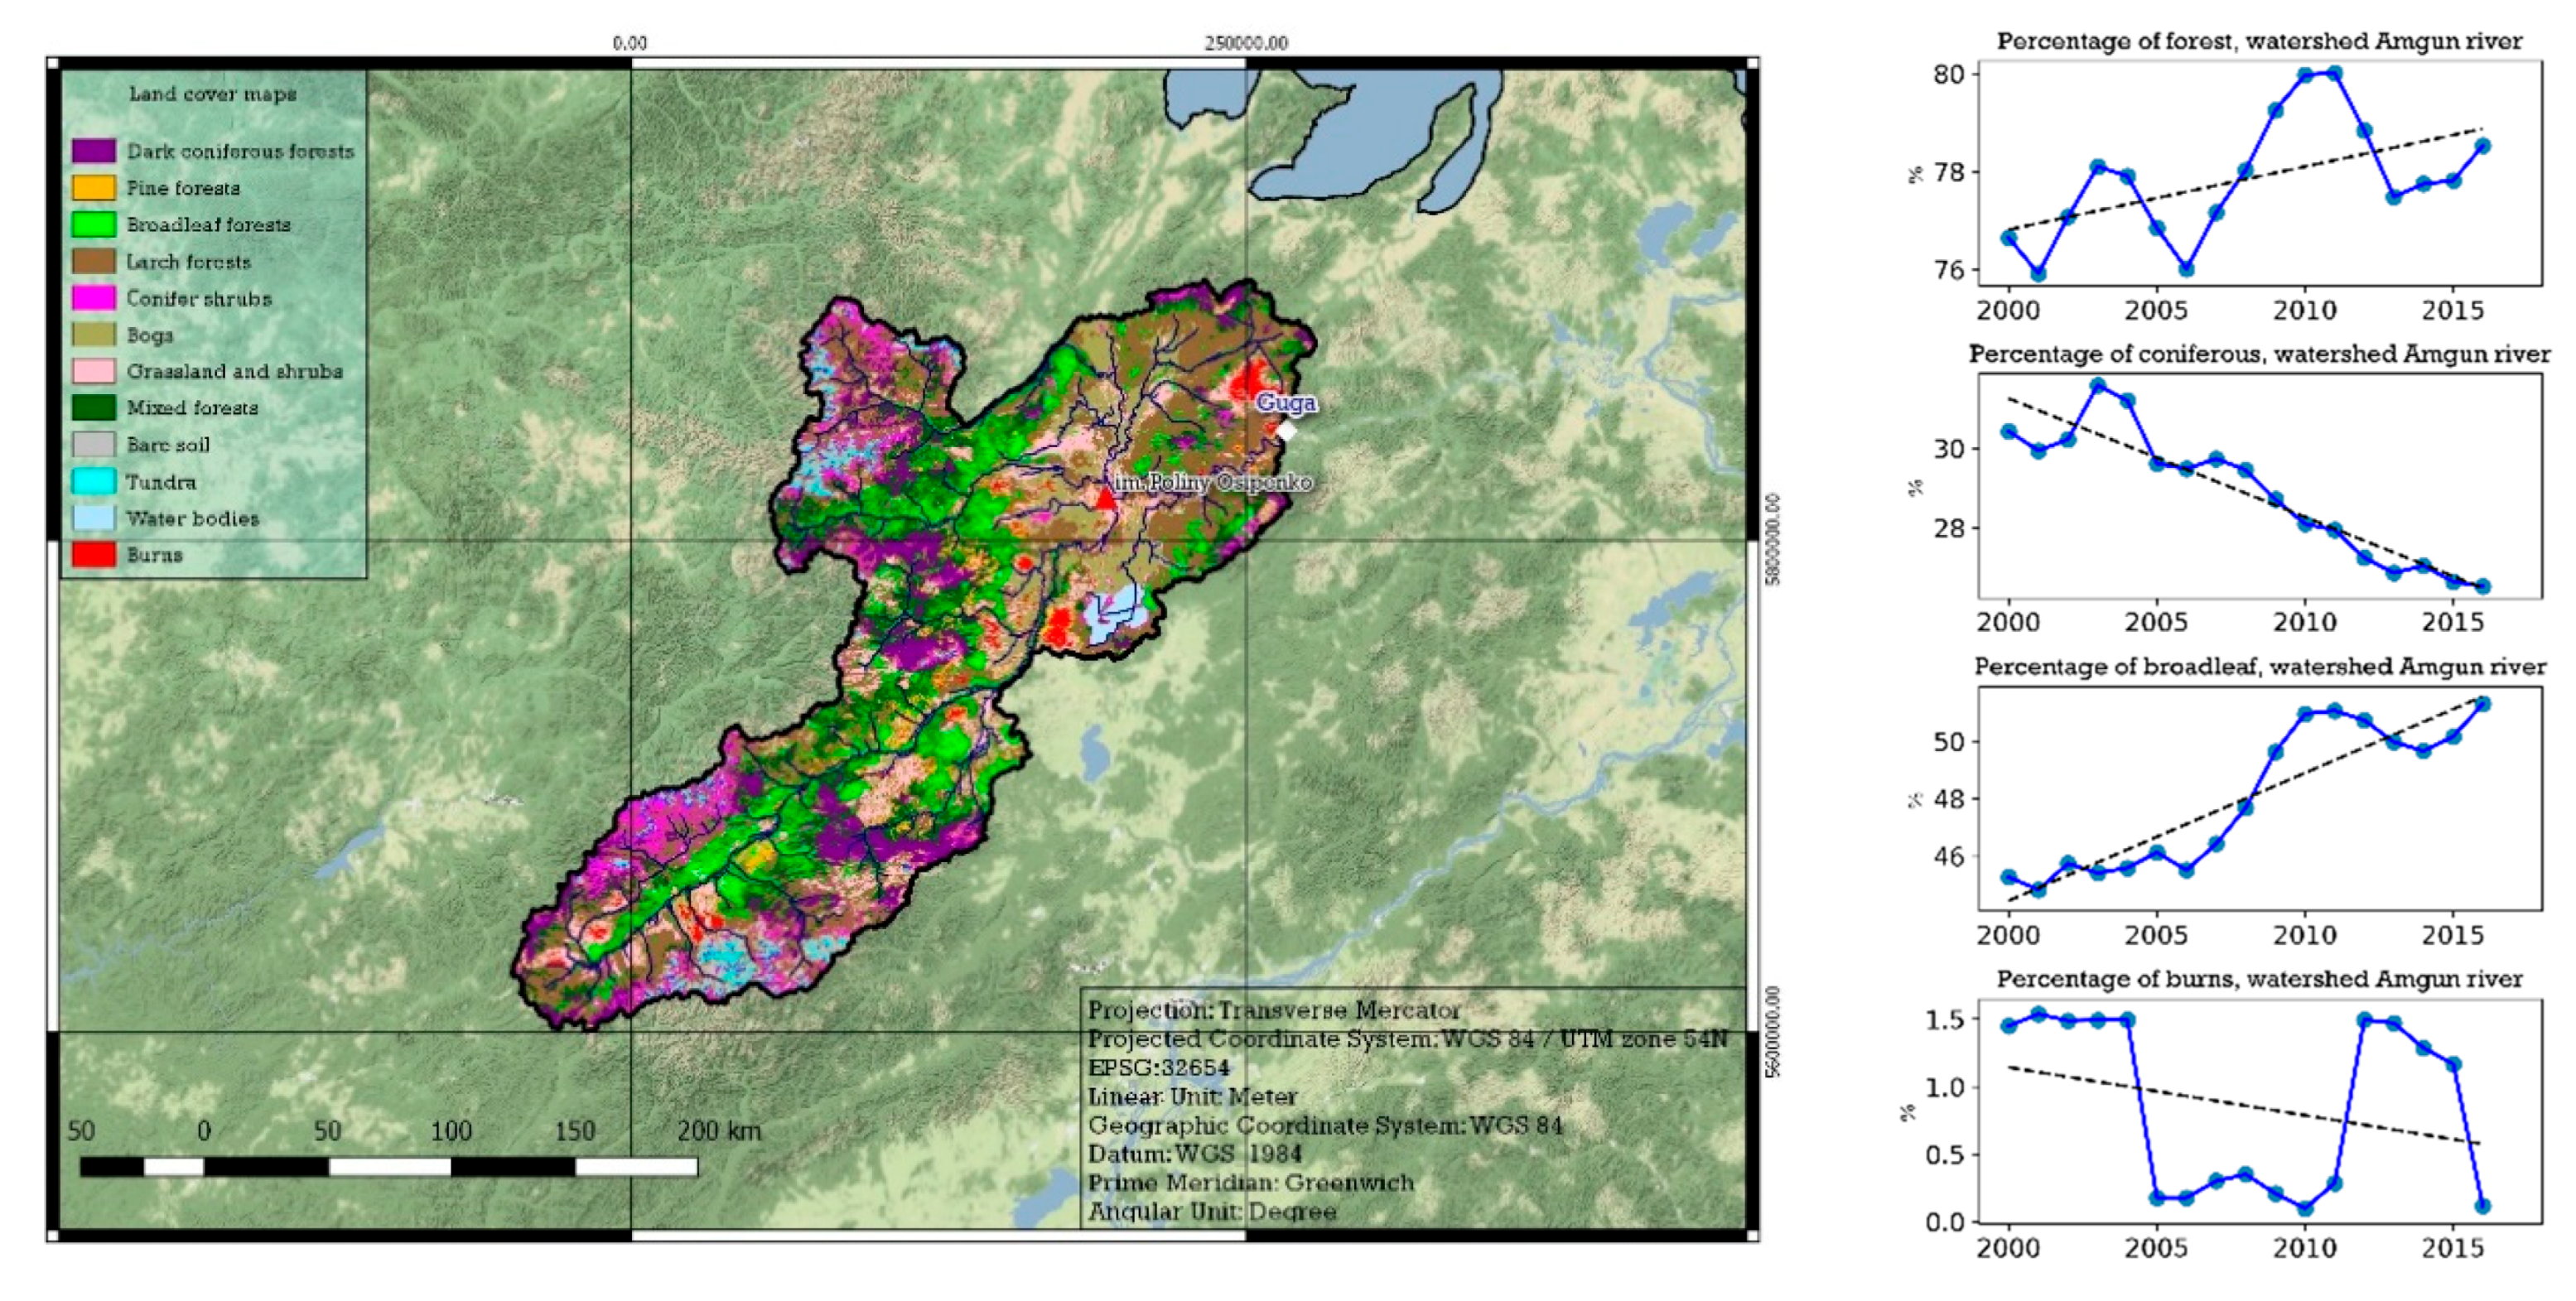
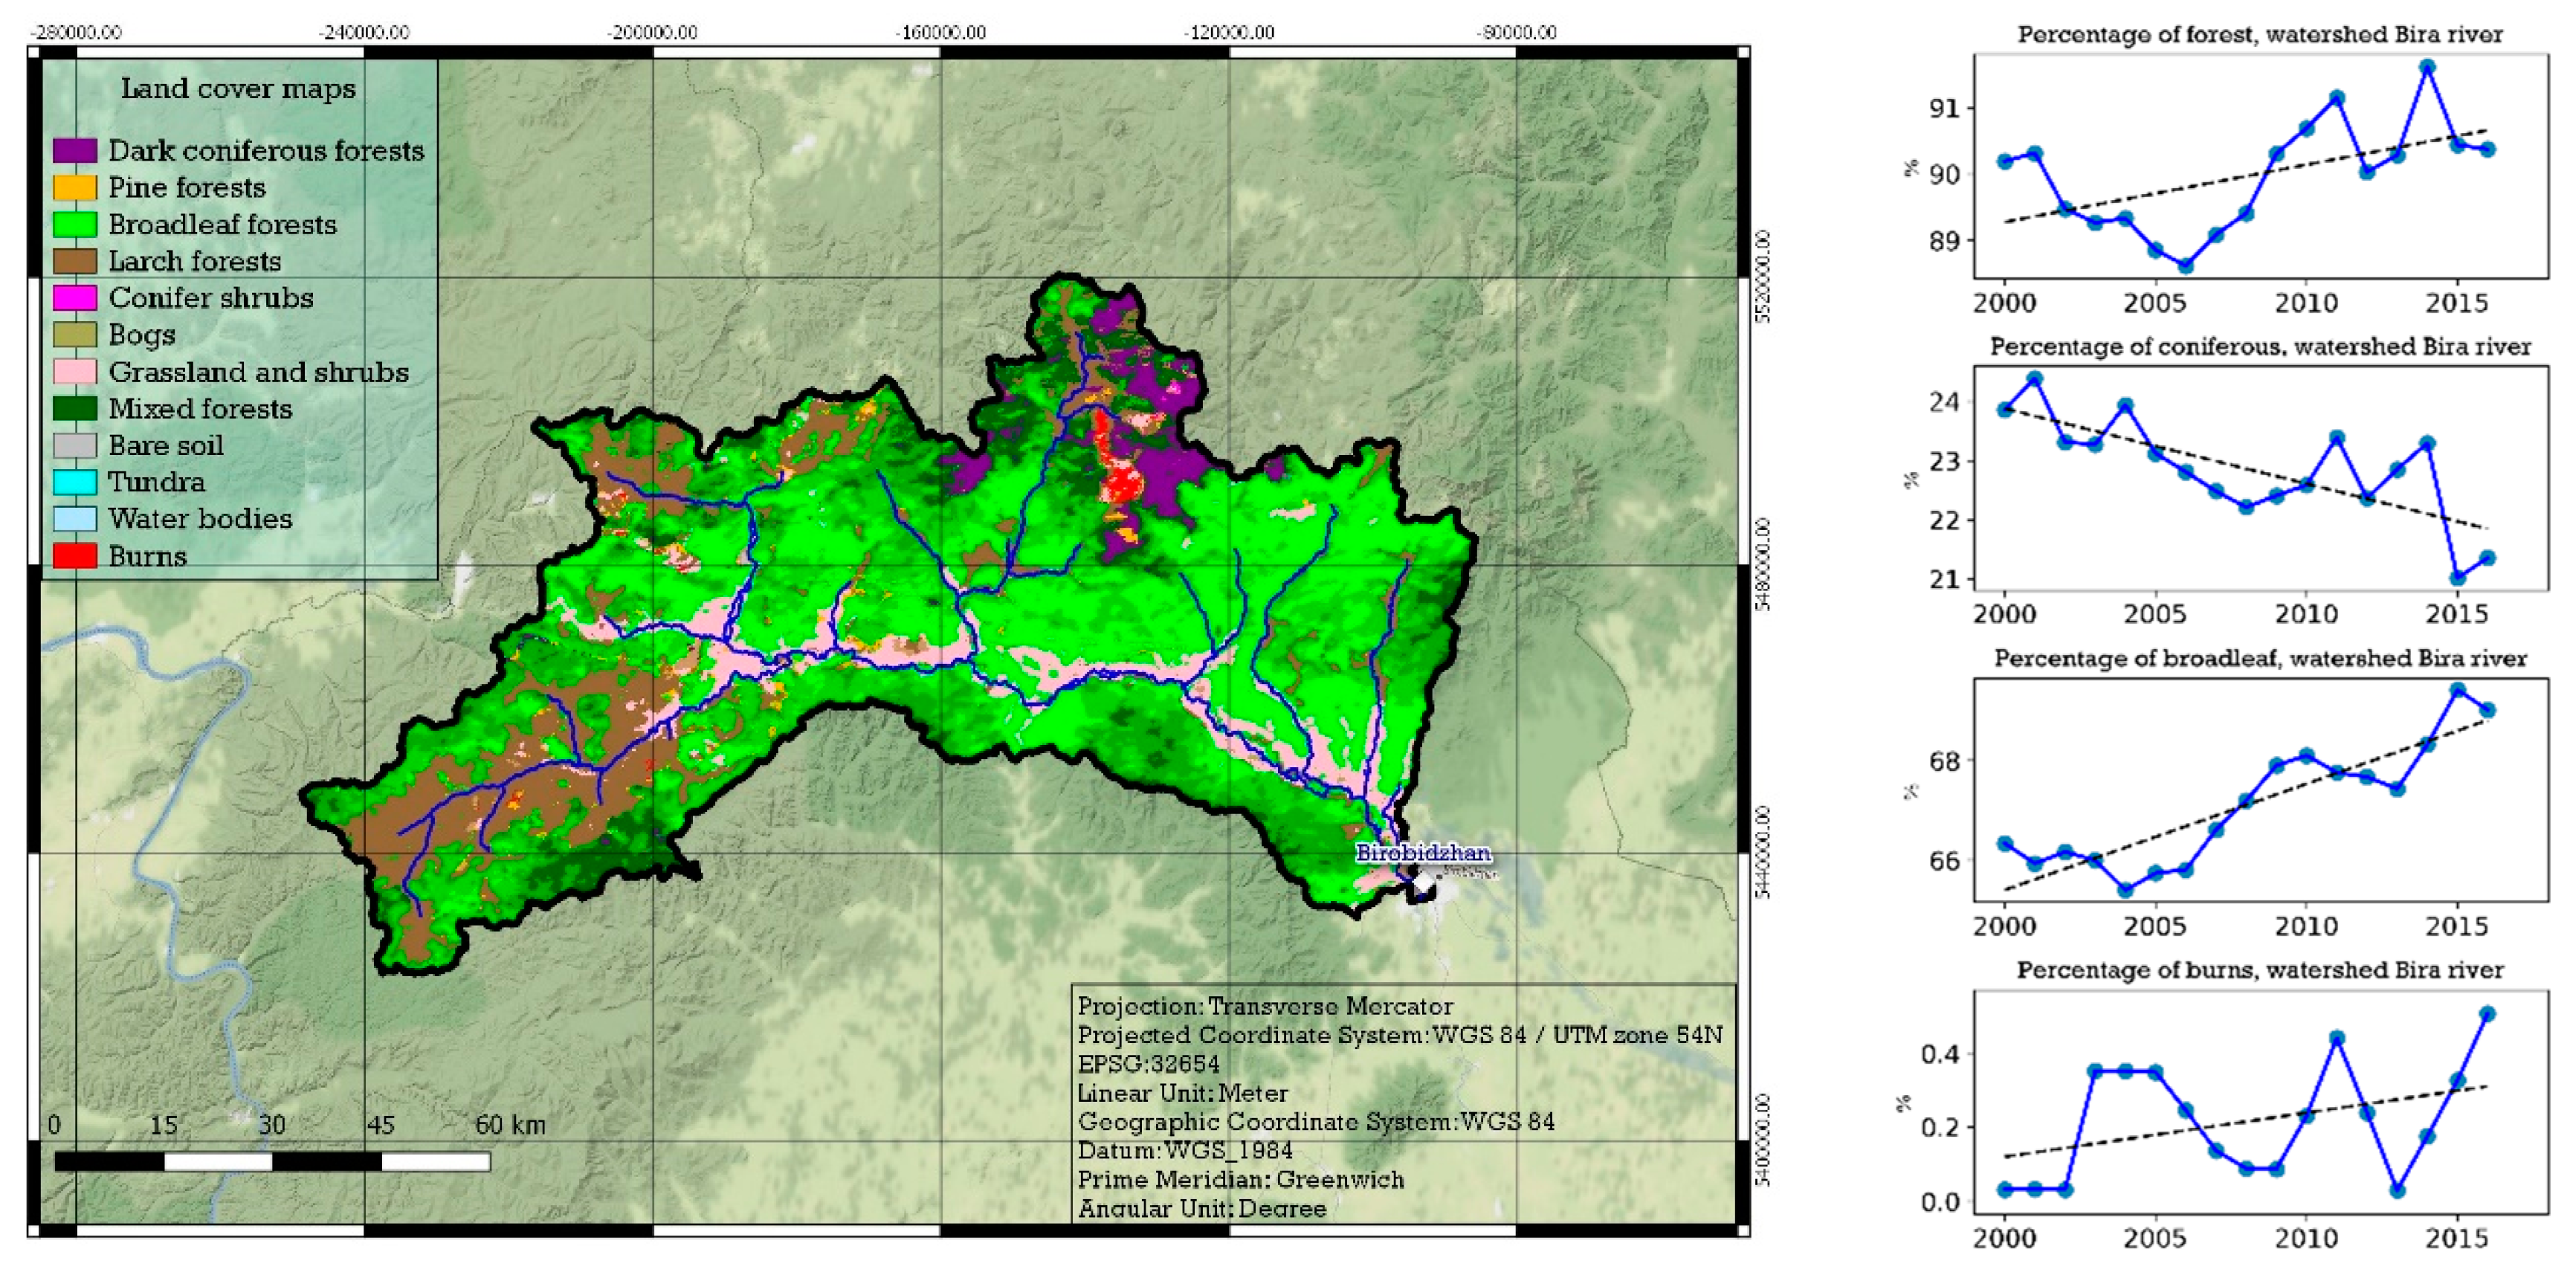
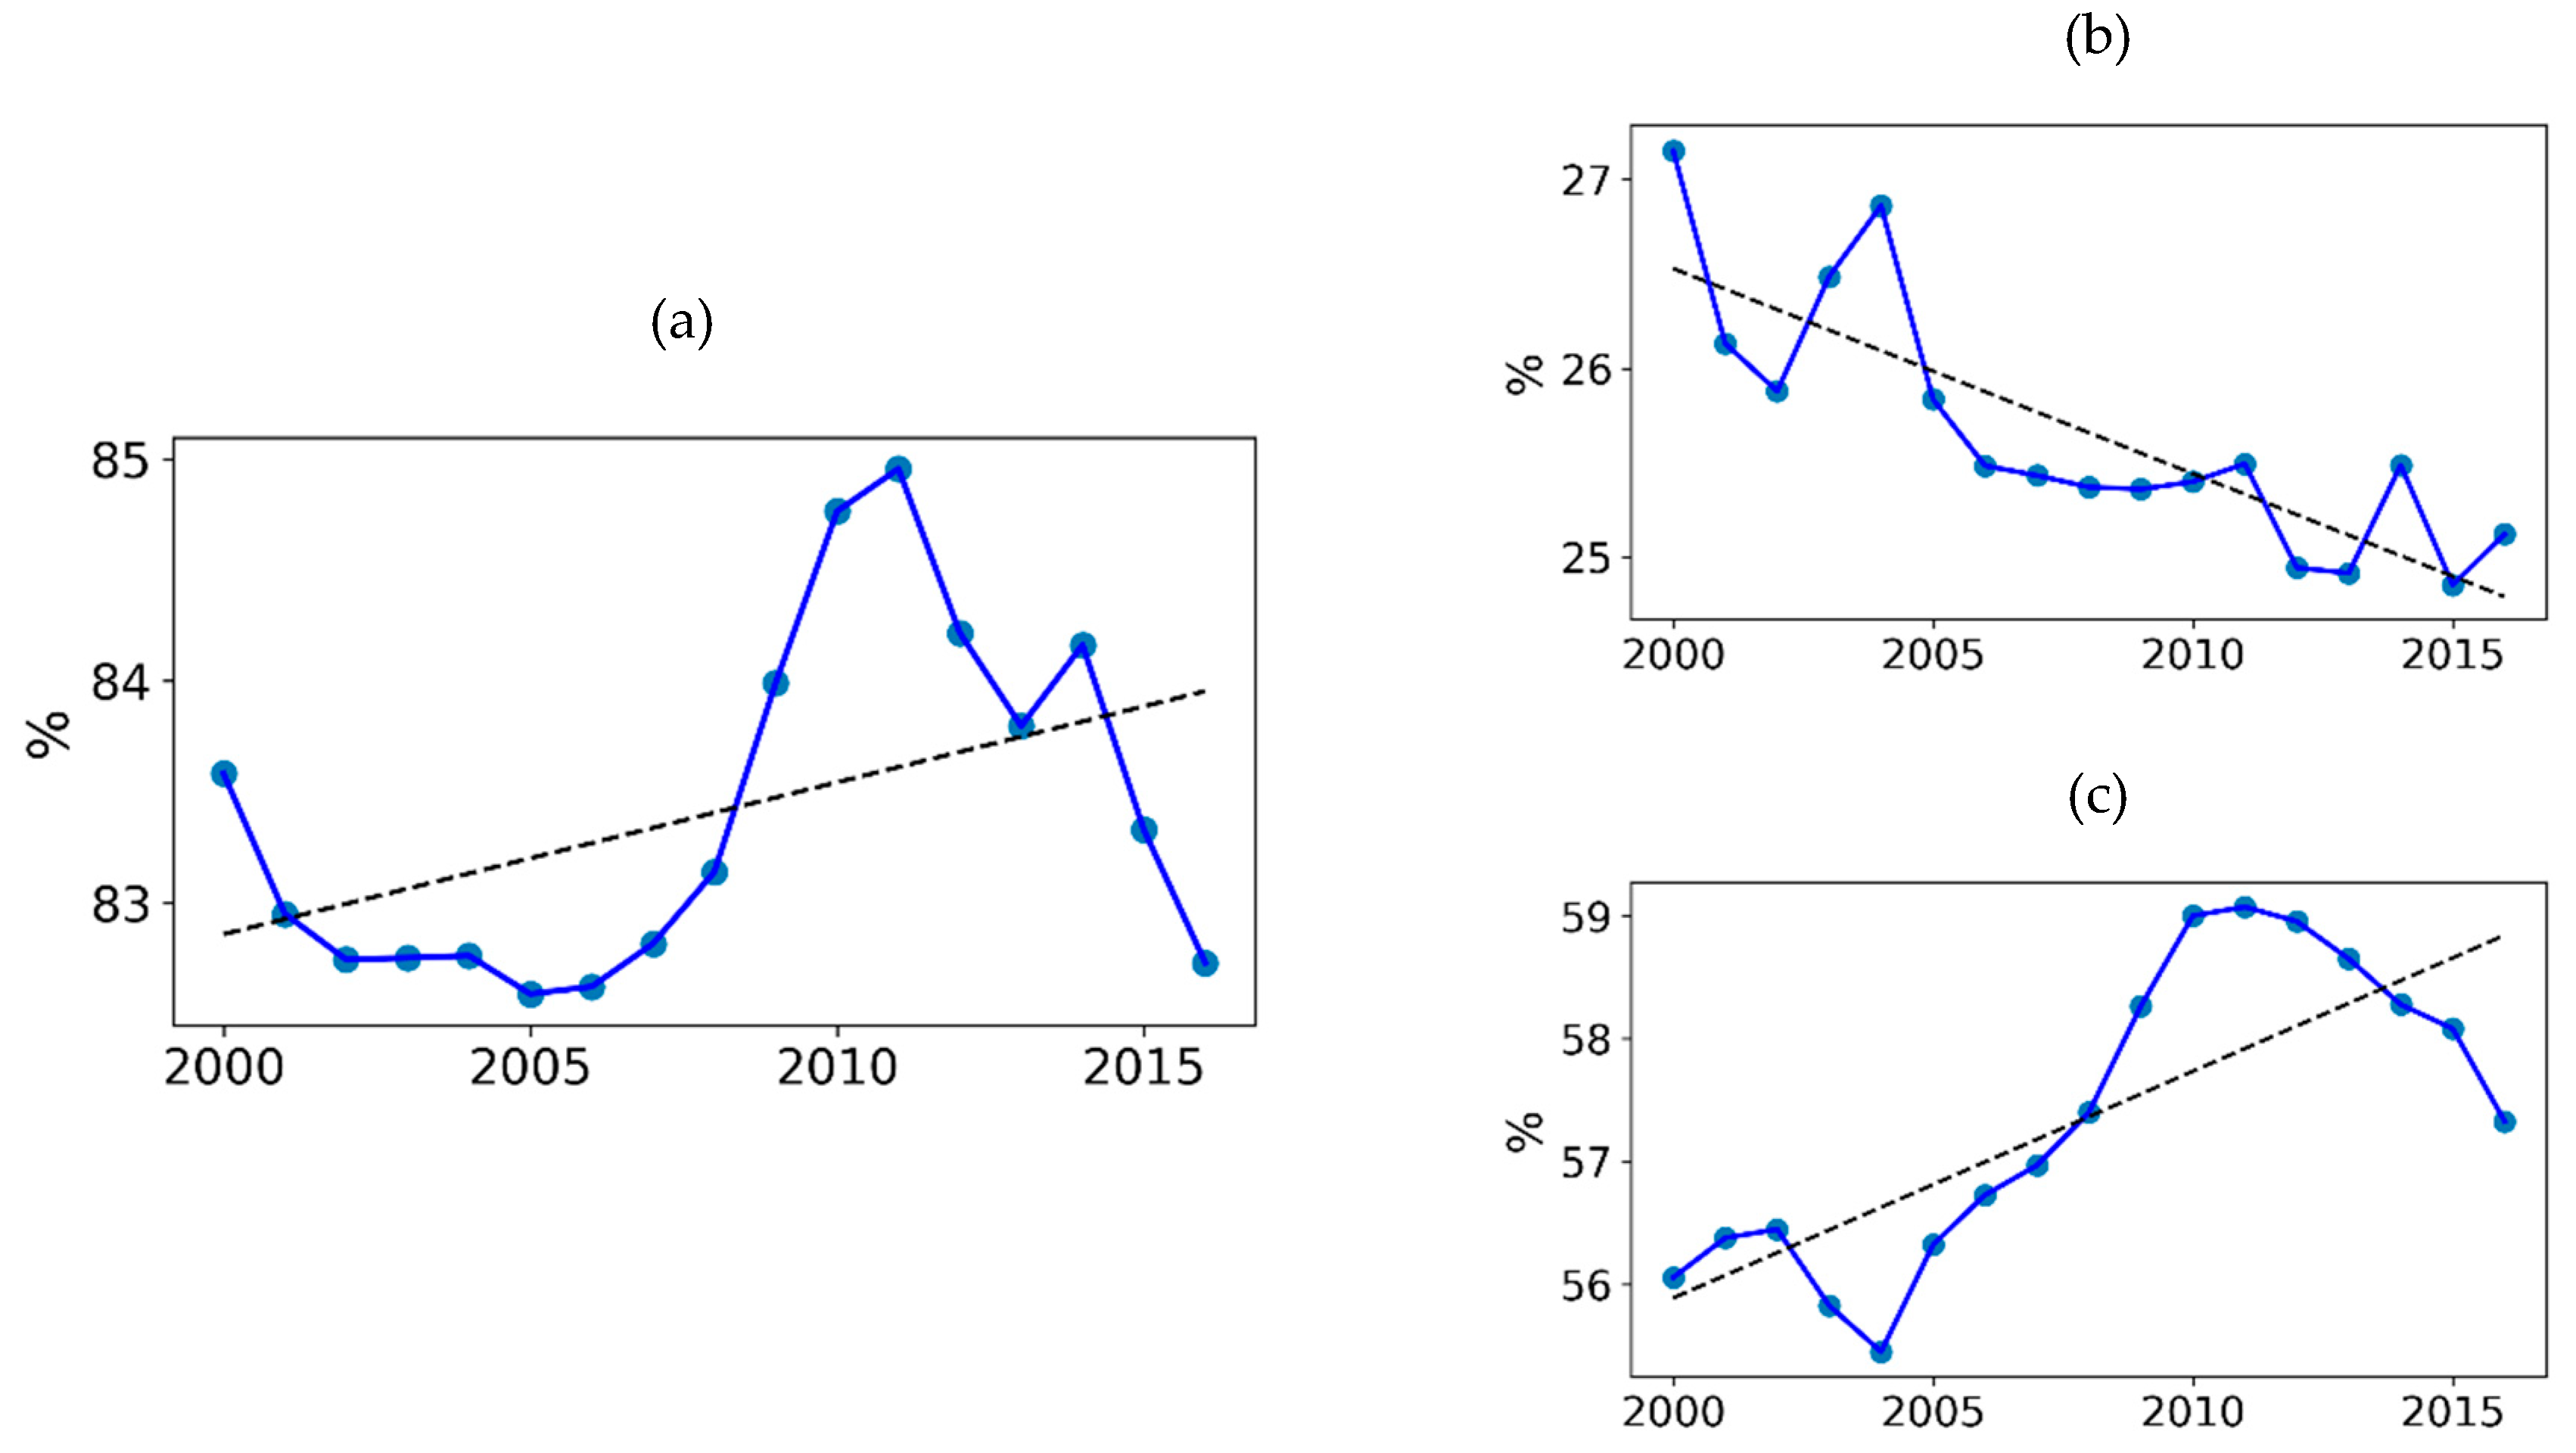
3.2. Stable Trend Decreasing Percentage of Coniferous Forests

The classification of vegetation types on watersheds was carried out using the LAGMA algorithm (Locally Adaptive Global Mapping Algorithm) [22]. The time series of maps covers the period 2000–2016 and includes 12 thematic classes: Dark coniferous forests, Pine forests, Broadleaf forests, Larch forests, Conifer shrubs, Bogs, Grassland and shrubs, Mixed forests, Bare soil, Tundra, Water bodies, Burns. The forest was considered as a type of vegetation: upright forest (coniferous and deciduous) and creeping forest (Pinus pumila).
The studied forested watersheds have high ratio of forest coverage—on average 81.71%. Moreover, according to the forest management data from the 1950–1960s [17,18] and forestry calculation methods adopted in the field of forestry, the entire species composition of the forest is taken into account. Calculated by remote sensing methods, the forest coverage of watersheds for 2000–2016 has an average of 83.43%, i.e., exceeds forest management data for the previous period (Table 3). Overgrowth of burns and felling areas by fast-growing birch and aspen underwood (as opposed to conifers) could contribute to an increase in forest coverage.
With the use of remote sensing methods, the variability of the total forest-covered watershed area for 2000–2016 has been established, as well as the dynamics of the forest area of various species of trees (Table 3). So, against the backdrop tendency of the increasing total forest coverage, the trend of the area share of primary coniferous forests, which are formed in the forest vegetation conditions typical for the watershed, retains the opposite direction (Figure 8, Figure 9 and Figure 10). The watersheds of the northern rivers and their tributaries have particularly sharp difference between the dynamics of the share of coniferous and deciduous areas, and characteristics of their trends are almost mirror opposite. The dynamics of the areas of fresh burns also has a predominantly opposite direction to the dynamics of the total forest area. However, this applies mainly to dark-coniferous, light-coniferous and larch forests, which have a resinous base and attract more frequent and intensive fires, and more prone to logging as a valuable type of wood.
From all eight watersheds over the overwhelming majority there is a synchronicity in the variability of forest areas in connection with fires and felling, namely: the tendency to reduce coniferous forests and increase in deciduous species. In the dynamics of the forest cover of these watersheds, the dominates specimen mirror of fresh burns by forest species composition (Figure A1, Figure A2, Figure A3, Figure A4 and Figure A5 in Appendix A). Therefore, average value forest cover over the eight watersheds (Figure 11a), which takes into account all species of forest, has a positive trend due to an increase in broadleaf (Figure 11c), but in the dynamics of coniferous species there is a stable trend decline (Figure 11b).

4. Discussion

The frequency of natural disasters in the Amur basin has increased over the 20 years of observations, of which catastrophic hydrological processes have been recorded three times during 2008–2018 (Table 2). The results showed that one of the causes of extreme hydrological phenomena (taking into account the main factor—precipitation) can be identified as deforestation as a result of wildfires and logging. The analysis of the influence of the local climates for 1980-2016 and meteorological parameters (air temperature, dew point, precipitation) on the variability of watershed forests did not reveal any patterns. Precipitation in combination with air temperature and humidity (dew point) created favourable conditions for the growth and vital functions of forest vegetation on watersheds in 2000–2016.
An annual change of watershed forest areas is highly influenced by disafforestation and fires, caused by people in 90% of cases. So it is important to estimate the permissible impact of people activity to prevent irreversible watershed damage. However, this study was out of scope in current paper.
Particular attention is given to the division of the species composition of the forest stand in two groups—coniferous and deciduous forests, each of which has its own share in the total forest coverage of the watershed. Since the 1950s, it takes into account all species of stand, according to the current instructions of the Far-Eastern Forestry of the Russian Federation [20]. The dynamics of the areas of primary coniferous watersheds has the opposite direction to the dynamics of the area of fresh burns after wildfires and logging. This is true mainly to dark-coniferous, light-coniferous and larch forests, which tend to have more intensive fires and are more prone to logging. From this, a conclusion can be made, that one of the main factors influencing the river streamflow and the peaks of rainfall floods on the rivers of the Amur Basin (along with precipitation) is the natural-anthropogenic factor of the destruction of indigenous coniferous forests as a result of wild fires and logging. This is the main conclusion of the present study.
There are reasons to assume, that because of the tendency for decreasing areas of watershed coniferous forests, the conditions contributing to the increases in rivers’ flood flow and flood risks during monsoon and frontal cyclonic rainfalls will remain. In this regard, the action needed to reduce impact of natural disasters in the Amur basin including the methods of predictive assessment of hydrological and forest fire situations. This problem should be solved by national economy corresponding departments (shipping, forestry, agriculture, etc.) in the Amur basin territory.
The current study is based on a concept that the streamflow is the integral indicator of climatic and anthropogenic changes in the watershed geographic environment. The current study is based on a concept that the streamflow is the integral indicator of climatic and anthropogenic changes in the watershed geographic environment. After extreme and contrast hydrological phenomena on Amur river in the summer 2008–2018 (flood, low water), the research was started to find out causes of anomalies in streamflow formation on Amur basin forest watershed. The streamflow indicator of rivers of Amur basin is influenced by change of watershed forest-covered areas, but the strict functional dependency has not been established. To identify the consistent dependency between change of watershed forest area and streamflow, the following information is required:
  • Annual data about forest coverage and new fumes after forest fires and felling;
  • Forest coverage data in a watershed basin;
  • Forests areas separate measurements for species composition.
This kind of data could be obtained using remote sensing approach with regular interval for hydrological and meteorological observation. Since the opening of the Landsat archive for no cost access in 2008, many time series-based forest disturbance mapping algorithms have been developed. For example, in [24] was developed algorithm LandTrendr which allow fixate abrupt disturbance events, including fire and harvest, as well as longer-duration processes such as post-disturbance growth. By flexibly recording both events and processes, the algorithm also captures situations where one precedes or follow the other, the sequence of which is often useful for interpretation: for example, the algorithm can distinguish among abrupt disturbance that follows decline, growth, or relative stability, allowing distinction between fire that burns through insect-damaged stands from fire that burns through regrowing forest.
In [35], an approach was presented that allowed has enabled a highly automated and systematic depiction of a 30-year history of forest change, providing otherwise unavailable insights on disturbance trends including spatial, temporal, and categorical characteristics. The results reveal that fire is the principal disturbance event in northernmost latitudes Saskatchewan, in these places have no fire suppression and they prone to large wildfires. It is noted that non-stand-replacing changes are more prominent in the forested areas of southern Saskatchewan and are particularly common in areas dominated by wetlands and grasslands. In these areas, the vegetation changes reflect episodes closely related with hydrological regimes and precipitation, such as vegetation stress or desiccation processes [36].
In this study, the capabilities of the locally-adaptive image classification method were used. It can be noted that in the Far East of Russia, use of this algorithm, as applied to this particular region, makes it possible to estimate the vegetation cover on more qualitative level compared to similar content of global information products [23,37,38]. The limitations of this method include the fact that it is necessary to conduct a large sample of forest inventory or ground data, which provides a statistical basis for training the classifier. This in turn requires high performance computing. However, with the advent of data from the Proba-V system, it became possible to significantly improve the detail of mapping vegetation cover compared with maps, created earlier by Terra-MODIS time-series dataset of 250 m resolution. Conducted research and developments [39] made it possible to create a new vegetation cover map of Russia by resolution 100 m starting from 2016. Probably, this will allow us to continue research presented in this manuscript on higher level. The obtained experience and results can be useful for study outlying forest regions of the Far East.
It should be noted that remote sensing data of high resolution are becoming increasingly available. Free SAR data are currently of great interest for forest disturbance mapping, including L-band Advanced Land Observing Satellite (ALOS) as well as global C-band SAR images being collected by a pair of Sentinel-1 satellites [40]. Besides, quite a lot is now known research activities in soil moisture according SAR images [41,42,43,44]. Knowledge about degree of forest soil moisture of Amur basin will help to more accurately estimate process of transformation precipitation into surface runoff, subsurface flow and as result streamflow.

5. Conclusions

This study looks into the effect of forest change (due to fires, logging, and climate) on rivers’ streamflow. The results showed that in the Far East of Russia in the Amur River basin, a decrease in the area of coniferous species contributes to increasing streamflow. A positive trend is observed in the dynamics of the depth of streamflow (mm), the increasing values trend in the modification of rainfall flow, an increase in the trend line of the volume of streamflow for July-August (km2). The tendency for reduction of predominantly coniferous forest areas contributes to the transformation of precipitation into the river streamflow with smaller losses during the monsoon rainfalls and frontal cyclones. In addition, coniferous forests use more water for growth and vital functions for longer periods of the year than deciduous, contributing to lower streamflow [16]. The reasons for the reduction of coniferous forests (by comparison with an increase in the broadleaf) are: conifers burn more intensively and often, are more prone to logging, and have a longer recovery period.
High coefficients of flood flow (from 0.50 to 0.70–0.80) in the period of monsoon and frontal rains confirm the climatic nature of the water-physical properties of forest soils. Reduced soil infiltration is observed in the basins of northern rivers (Amgun and Bureya Rivers)—20–30%. The zero trend of the streamflow coefficients of the northern rivers indicates an almost unchanging with time weak soil permeability, which contributes to the flow of precipitation (up to 70–80%) into the river beds and the loss of rainwater during its transformation into the underground flow. Increased soil infiltration (50%) in the basins of the southern rivers (Bira, Bidzhan, and Manoma Rivers) indicates an increase in the water-holding capacity of the watersheds in warmer climatic conditions.
The present tendency for reduction of coniferous forests may contribute to the disruption of the regulatory function of natural levels of acid-alkaline and the main hydrochemical characteristics of streamflow by the root system of woods. This is indicated by the dynamics of wildfires and logging areas. For example, coniferous forests reduce the concentration of nitrates and nitrites by 2–5 times more than deciduous ones [45].
In the temperature and humidity regime of the forest-covered watersheds of the Amur basin (precipitation, temperature, and humidity) for the climatic period from 1980 to 2016 no changes affecting the river streamflow were detected [29,46]. Consequently, the annual variability of forested areas of watersheds is more influenced by the factors of forest destruction as a result of fires and logging. Therefore, the dynamics of the forested area in all watersheds is predominantly a mirror reflection of the dynamics of fresh burs and logging areas.
Despite a slight decrease in forest coverage in the Bureya River watersheds, the dynamics of the average forest coverage of all watersheds has a positive trend due to an increase in the area of deciduous forests, especially in the northern areas of the Amur basin. At the same time, the share of coniferous species in the total forest coverage of these watersheds continues to decrease (trend coefficient k is on average 1%/10 years). This can be explained by a more rapid decrease in the coniferous tree trend (k = 2%/10 years), compared with a slight increase in the forest coverage of deciduous species (k = 0.4%/10 years).
There is a reason to assume that the identified trend of reduction of the coniferous areas of river watersheds will continue long-term. Conditions contributing to the increase in flood flow and flood risk during monsoon and frontal cyclonic rains will still be present, which is also important for the economy of the region, as is the reduction of valuable wood of coniferous forests.
Massive wildfires in the Taiga zone of the Amur basin influence the state and dynamics of forests, their ecological balance, and by far exceed man-made impacts. In this regard, a system is needed to reduce the impact of natural disasters in the Amur basin, which would include the methods of predictive assessment of hazardous situations. This is an important problem for the national economy (shipping, forestry and agriculture, etc.).

Author Contributions

Conceptualization, G.S.; formal analysis, G.S.; investigation, G.S. and A.V.; methodology, G.S. and A.V.; project administration, G.S.; software, A.V.; supervision, G.S. and A.V.; validation, A.V.; writing—original draft, G.S. and A.V.; writing—review and editing, G.S., A.V. and S.K.

Acknowledgments

This research was supported in through computational resources provided by the Shared Facility Center “Data Center of FEB RAS” (Khabarovsk) [47]. The authors wish to thank three anonymous reviewers for their valuable comments and suggestions to improve this article.

Conflicts of Interest

The authors declare no conflict of interest.

Appendix A

Figure A1. Vegetation dynamics of Bureya River watershed. Stream gaging is marked with the white diamond.
Geosciences 09 00262 g0a1
Figure A2. Vegetation dynamics of Kur River watershed. Stream gaging is marked with the white diamond.
Geosciences 09 00262 g0a2
Figure A3. Vegetation dynamics of Nimelen River watershed. Stream gaging is marked with the white diamond.
Geosciences 09 00262 g0a3
Figure A4. Vegetation dynamics of Bidzhan River watershed. Stream gaging is marked with the white diamond.
Geosciences 09 00262 g0a4
Figure A5. Vegetation dynamics of Manoma River watershed. Stream gaging is marked with the white diamond.
Geosciences 09 00262 g0a5

References

  1. Giambelluca, T.W.; Nullet, M.A.; Ziegler, A.D.; Tran, L. Latent and sensible energy flux over deforested land surfaces in the eastern Amazon and northern Thailand. Singap. J. Trop. Geogr. 2000, 21, 107–130. [Google Scholar] [CrossRef]
  2. Bonell, M. Possible impacts of climate variability and change on tropical forest hydrology. Clim. Chang. 1998, 39, 215–272. [Google Scholar] [CrossRef]
  3. Bosch, J.M.; Hewlett, J.D. A review of catchment experiments to determine the effect of vegetation changes on water yield and evapo-transpiration. J. Hydrol. 1982, 55, 3–23. [Google Scholar] [CrossRef]
  4. Brown, A.; Zhang, L.; McMahon, T.; Western, A.; Vertessy, R. A review of paired catchment studies with reference to the seasonal flows and climate variability. J. Hydrol. 2005, 310, 28–61. [Google Scholar] [CrossRef]
  5. Espejo, J.C.; Messinger, M.; Román-Dañobeytia, F.; Ascorra, C.; Fernandez, L.E.; Silman, M. Deforestation and Forest Degradation Due to Gold Mining in the Peruvian Amazon: A 34-Year Perspective. Remote Sens. 2018, 10, 1903. [Google Scholar]
  6. Jones, J.A.; Post, D.A. Seasonal and successional streamflow response to forest cutting and regrowth in the Northwest and Eastern United States. Water Resour. Res. 2004, 40. [Google Scholar] [CrossRef]
  7. Krestovskiy, O.I. Impact of Deforestation and Forest Restoration on River Water; Gidrometeorologicheskoe izd.: Leningrad, Russia, 1983; 117p. [Google Scholar]
  8. Maina, J.; De Moel, H.; Zinke, J.; Madin, J.; McClanahan, T.; Vermaat, J.E. Human deforestation outweighs future climate change impacts of sedimentation on coral reefs. Nature Communications. Nat. Commun. 2013, 4, 1986. [Google Scholar] [CrossRef]
  9. Swank, W.T.; Swift, L.W., Jr.; Douglas, J.E. Streamflow changes associated with forest cutting species conversions and natural disturbances. In Forest Hydrology and Ecology at Coweeta; Springer: New York, NY, USA, 1988; pp. 297–312. [Google Scholar]
  10. Klinzov, A.P. The Protective Role of Sakhalin Forests; Far Eastern Forestry Research Institute: Khabarovsk, Russia, 1973; 233p. [Google Scholar]
  11. Costa, M.H.; Botta, A.; Cardille, J.A. Effects of large-scale changes in land cover on the discharge of the Tocantins River, Southeastern Amazonia. J. Hydrol. 2003, 283, 206–217. [Google Scholar] [CrossRef]
  12. Matheussen, B.; Kirschbaum, R.L.; Goodman, I.A.; O’Donnell, G.M.; Lettenmaier, D.P. Effects of land cover change on streamflow in the interior Columbia River Catchment (USA and Canada). Hydrol. Process. 2000, 14, 867–885. [Google Scholar] [CrossRef]
  13. Siriwardena, L.; Finlayson, B.L.; McMahon, T.A. The impacts of land use change on catchment hydrology in large catchments: The Comet River, Central Queensland, Australia. J. Hydrol. 2006, 326, 199–214. [Google Scholar] [CrossRef]
  14. Zhang, Y.; Guan, D.; Jin, C.; Wang, A.; Wu, J.; Yuan, F. Impacts of climate change and land use change on runoff of forest catchment in northeast China. Hydrol. Process. 2014, 28, 186–196. [Google Scholar] [CrossRef]
  15. Kolesnikov, B.P. Forest areas of the taiga zone of the USSR and the forestry system in the aspect of long-term forecasts. In Informational Bulletin of the Scientific Council on the Integrated Development of Taiga Territories; Siberian Institute of Geography: Irkutsk, Russia, 1969; pp. 9–40. [Google Scholar]
  16. Danilin, A.K. Forest management of the Far East; Publishing Group “Our time”: Khabarovsk, Russia, 2009; 335p. [Google Scholar]
  17. Resources of Surface Waters of the USSR. Vol. 18. Far East. Issue 1. Upper and Middle Amur River; Gidrometeorologicheskoe izd.: Leningrad, Russia, 1966; 781p.
  18. Resources of Surface Waters of the USSR. Vol. 18. Far East. Issue 2. Lower Amur River; Gidrometeorologicheskoe izd.: Leningrad, Russia, 1970; 592p.
  19. Solov’ev, K.P. Cedar-Deciduous Forests of the Far East and the Management in Them; Khabarovsk Book Publishing: Khabarovsk, Russia, 1958; 367p. [Google Scholar]
  20. Shirokova, M.R. Dependence of the monsoon climate river runoff on physiographic factors in the Lower Amur region. In Formation of Natural Waters of the Far East; Far Eastern Scientific Centre: Vladivostok, Russia, 1983; pp. 43–55. [Google Scholar]
  21. Opritova, R.V. Elevated Phytomass of Forests and River Runoff in the South Sikhote-Alin; Far Eastern Branch: Vladivostok, Russia, 1991; 781p. [Google Scholar]
  22. Bartalev, S.A.; Egorov, V.A.; Loupian, E.A.; Khvostikov, S.A. A new locally-adaptive classification method LAGMA for large-scale land cover mapping using remote-sensing data. Remote Sens. Lett. 2014, 5, 55–64. [Google Scholar] [CrossRef]
  23. Hansen, M.C.; Potapov, P.V.; Moore, R.; Hancher, M.; Turubanova, S.A.; Tyukavina, A.; Thau, D.; Stehman, S.V.; Goetz, S.J.; Loveland, T.R.; et al. High-resolution global maps of 21st-century forest cover change. Science 2013, 342, 850–853. [Google Scholar] [CrossRef] [PubMed]
  24. Kennedy, R.E.; Yang, Z.; Cohen, W.B. Detecting trends in forest disturbance and recovery using yearly Landsat time series: 1. LandTrendr—Temporal segmentation algorithms. Remote Sens. Environ. 2010, 114, 2897–2910. [Google Scholar] [CrossRef]
  25. Zhou, S.; Zhang, W. Calibration and validation of a semi-distributed hydrological model in the Amur River Basin using remote sensing data. Remote Sens. Agric. Ecosyst. Hydrol. XIX 2017, 10421, 1042104. [Google Scholar]
  26. Tachibana, Y.; Oshima, K.; Ogi, M. Seasonal and interannual variations of Amur River discharge and their relationships to large-scale atmospheric patterns and moisture fluxes. J. Geophys. Res. Atmos. 2008, 113, D16102. [Google Scholar] [CrossRef]
  27. Torzhkov, I.O.; Kushnir, E.A.; Konstantinov, A.V.; Koroleva, T.S.; Efimov, S.V.; Shkolnik, I.M. Assessment of future climate change impacts on forestry in Russia. Russ. Meteorol. Hydrol. 2019, 44, 180–186. [Google Scholar] [CrossRef]
  28. Frolov, A.V.; Georgievskii, Y.V. Changes in Water Resources under Conditions of Climate Warming and Their Impact on Water Inflow to Russian Large Reservoirs. Russ. Meteorol. Hydrol. 2018, 43, 390–396. [Google Scholar] [CrossRef]
  29. Sokolova, G.V.; Makogonov, S.V. Development of the forest fire forecast method (a Case Study for the Far East). Russ. Meteorol. Hydrol. 2013, 38, 222–226. [Google Scholar] [CrossRef]
  30. Sokolova, G.V. Analyzing the Amur River water regime for the period preceding the catastrophic flood in 2013. Russ. Meteorol. Hydrol. 2015, 7, 66–69. [Google Scholar] [CrossRef]
  31. Sokolova, G.V.; Teteryatnikova, E.P. The Problem of Long-Term Forecast of Fire Risk in the Forest of the Khabarovsk Territory and Jewish Autonomous Region according to Meteorological Conditions; Sokolova, G., Teteryatnikova, E., Eds.; Russian Academy of Sciences, Far Eastern Branch, Institute of Water and Ecological Problems: Khabarovsk, Russia, 2008; 150p. [Google Scholar]
  32. Heim, W.; Sokolova, G.V.; Trense, D.; Kitagawa, T. Increased populations of endangered cranes after Amur River flood. Waterbirds. 2017, 40, 282–288. [Google Scholar] [CrossRef]
  33. Semenov, E.K.; Sokolikhina, N.N.; Tatarinovich, E.V. Monsoon circulation over the Amur River basin during catastrophic flood and extreme drought in summer. Russ. Meteorol. Hydrol. 2017, 42, 141–149. [Google Scholar] [CrossRef]
  34. Bartalev, S.A.; Egorov, V.A.; Ershov, D.V.; Isaev, A.S.; Loupian, E.A.; Plotnikov, D.E.; Uvarov, I.A. Mapping of Russia’s vegetation cover using MODIS satellite spectroradiometer data. Sovrem. Probl. Distantsionnogo Zondirovaniya Zemli Kosmosa 2011, 8, 285–302. [Google Scholar]
  35. Hermosilla, T.; Wulder, M.A.; White, J.C.; Coops, N.C.; Hobart, G.W. Regional detection, characterization, and attribution of annual forest change from 1984 to 2012 using Landsat-derived time-series metrics. Remote Sens. Environ. 2015, 170, 121–132. [Google Scholar] [CrossRef]
  36. Lichtenthaler, H.K. Vegetation Stress: An Introduction to the Stress Concept in Plants. J. Plant Physiol. 1996, 148, 4–14. [Google Scholar] [CrossRef]
  37. Google’s Earth Engine. Available online: https://earthengine.google.com/ (accessed on 8 June 2019).
  38. Zurqani, H.A.; Christopher, J.P.; Mikhailova, E.A.; Schlautman, M.A.; Sharp, J.L. Geospatial analysis of land use change in the Savannah River Basin using Google Earth Engine. Int. J. Appl. Earth Obs. Geoinf. 2018, 69, 175–185. [Google Scholar] [CrossRef]
  39. Egorov, V.A.; Bartalev, S.A.; Kolbudaev, P.A.; Plotnikov, D.E.; Khvostikov, S.A. Land cover map of Russia derived from Proba-V satellite data. Sovrem. Probl. Distantsionnogo Zondirovaniya Zemli Kosmosa 2018, 15, 282–286. [Google Scholar] [CrossRef]
  40. Torres, R.; Snoeij, P.; Geudtner, D.; Bibby, D.; Davidson, M.; Attema, E.; Potin, P.; Rommen, B.; Floury, N.; Brown, M.; et al. GMES Sentinel-1 mission. Remote Sens. Environ. 2012, 120, 9–24. [Google Scholar] [CrossRef]
  41. Choker, M.; Baghdadi, N.; Zribi, M.; Hajj, M.E.; Paloscia, S.; Verhoest, N.E.C.; Lievens, H.; Mattia, F. Evaluation of the Oh, Dubois and IEM Backscatter Models Using a Large Dataset of SAR Data and Experimental Soil Measurements. Water 2017, 9, 38. [Google Scholar] [CrossRef]
  42. Gao, Q.; Zribi, M.; Escorihuela, M.J.; Baghdadi, N. Synergetic Use of Sentinel-1 and Sentinel-2 Data for Soil Moisture Mapping at 100 m Resolution. Sensors 2017, 17, 1966. [Google Scholar] [CrossRef]
  43. Merzouki, A.; McNairn, H.; Pacheco, A. Mapping Soil Moisture Using RADARSAT-2 Data and Local Autocorrelation Statistics. IEEE J. Sel. Top. Appl. Earth Obs. Remote Sens. 2011, 4, 128–137. [Google Scholar] [CrossRef]
  44. Van Doninck, J.; Peters, J.; Lievens, H.; De Baets, B.; Verhoest, N.E.C. Accounting for seasonality in a soil moisture change detection algorithm for ASAR Wide Swath time series. Hydrol. Earth Syst. Sci. 2012, 16, 773–786. [Google Scholar] [CrossRef] [Green Version]
  45. Spirina, A.G.; Polyanskaya, S.M. Absorption of gray forest soils of nutrients leached from mineral fertilizers. Russ. J. For. Sci. 1987, 3, 163–177. [Google Scholar]
  46. Verkhoturov, A.L.; Sokolova, G.V.; Bartalev, S.A.; Kramareva, L.S. Investigation of forest hydrological processes in watersheds of the Amur River basin according to satellite and hydrometeorological observations. Sovrem. Probl. Distantsionnogo Zondirovaniya Zemli Kosmosa 2018, 15, 142–154. [Google Scholar] [CrossRef]
  47. Sorokin, A.A.; Makogonov, S.V.; Korolev, S.P. The Information Infrastructure for Collective Scientific Work in the Far East of Russia. Sci. Tech. Inf. Process. 2017, 44, 302–304. [Google Scholar] [CrossRef]
Figure 1. Forest fires pattern (1931–2011) and areas of burns (1948–2003) in the Khabarovsk Krai and the Jewish Autonomous Oblast.
Geosciences 09 00262 g001
Figure 2. The Amur River annual maximum water levels near Khabarovsk for the period 1896–2018. Red points are dates with significant recorded events (Table 1).
Geosciences 09 00262 g002
Figure 3. Location of river watersheds of the Middle and Lower Amur River basin (highlighted in purple). Meteorological stations are marked with red triangles, and stream gauges—in with white diamonds.
Geosciences 09 00262 g003
Figure 4. A conceptual map of the impacts on streamflow of climatic and human activities factors in the study region. S—percentage of coniferous (%), N S ¯ —average S of 2000–2016; Q—module of discharge, N Q ¯ —average Q of 2000–2016.
Geosciences 09 00262 g004
Figure 5. Isolines of the distribution of the maximum air temperature (a) and the sum of rainy days (b) according to the data of 50 stations of the Far East for July–August 1980–2009.
Geosciences 09 00262 g005
Figure 6. Discharge, run-off coefficient and water level for July–August 2000–2016 on watersheds: Amgun rivers, Bureya rivers, Bira rivers.
Geosciences 09 00262 g006
Figure 7. Water level for July–August 2000–2016, mean temperature for July–August 1980–2009 and precipitation for July–August 2000–2016 on watersheds.
Geosciences 09 00262 g007aGeosciences 09 00262 g007b
Figure 8. Vegetation dynamics of Amgun River watershed. Stream gaging is marked with the white diamond.
Geosciences 09 00262 g008
Figure 9. Vegetation dynamics of Tyrma River watershed. Stream gaging is marked with the white diamond.
Geosciences 09 00262 g009
Figure 10. Vegetation dynamics of Bira River watershed. Stream gaging is marked with the white diamond.
Geosciences 09 00262 g010
Figure 11. (a) Percentage average of forest average on 8 watersheds Amur River basin, (b) percentage average of coniferous on 8 watersheds Amur River basin, (c) percentage average of broadleaf on 8 watersheds Amur River basin.
Geosciences 09 00262 g011
Table 1. Natural disasters in the River Amur basin over the 20 years of observations.
ObjectDataDescription
Basin of Amur1998Catastrophic forest fires and the 2 September Amur River floods reaching the height of 524 cm near Khabarovsk
Amur river200810–12 August catastrophic Summer-Autumn low water levels is an extreme low flood mark of 65 cm near Khabarovsk
Amur river20133–4 September catastrophic Amur River floods reaching the height of 808 cm near Khabarovsk
Shilka river20187 August catastrophic River Shilka floods (the left part of Amur River, caused the Amur River floods reaching the height of 483 cm near Khabarovsk
Table 2. Streamflow and water level parameters.
NameDescription
Volume of runoff, W (m3)An amount of water passing in the river course through a given gauge over a set period of time (for example, annually)
Depth of runoff, Y (mm)A layer of water evenly distributed over the area and flowing from a watershed over a period of time
Discharge, M (l/sec·km2)Reflects the amount of flowing water (presented as average water discharge over a set period of time) from every square kilometre of a watershed over 1 s.
Runoff coefficient during the rainfall floods period (July–August), α (%)The ratio of the depth of streamflow (mm) to the amount of atmospheric precipitation in the watershed area (mm) over the same period according to the local meteorological station
Water level over the zero mark on the gage, H (cm)The maximum water levels over the period of rainfall floods (cm)
Table 3. The area and forest coverage of watersheds of the Middle and Lower Amur.
RiverStream GaugeArea of Watershed (ha)Percentage of Forest (%)
Amgunsettlement Guga41,000 *4063671 * 77.8
Bidzhansettlement Bidzhan7000 *724469 *60.3
BiraBirobidzhan7560 *754886 * 90.1
Bureyasettlement Ust-Niman26,500 *26,36487 * 85.2
Kursettlement Novokurovka11,600 *11,48782 *86.6
Manomasettlement Manoma 12220 *244894 *94.8
Nimelensettlement Timchenko14,100 *13,88275.0
Tyrmasettlement Tyrma6550 *656183 *89.2
*—Marked forest condition data 1950–1960, [17,18].

