Article

Use of Paleoflood Deposits to Determine the Contribution of Anthropogenic Trace Metals to Alluvial Sediments in the Hyperarid Rio Loa Basin, Chile

1
Department of Geosciences & Natural Resources, Western Carolina University, Cullowhee, NC 28723, USA
2
Equinox Environmental, Asheville, NC 28801, USA
*
Author to whom correspondence should be addressed.
Geosciences 2019, 9(6), 244; https://doi.org/10.3390/geosciences9060244
Submission received: 2 May 2019 / Revised: 24 May 2019 / Accepted: 28 May 2019 / Published: 31 May 2019
(This article belongs to the Special Issue Contaminant Migration Processes in the Environment)

Abstract

:
Toxic trace metals are a common and significant contaminant in riverine ecosystems, and are derived from both natural and anthropogenic sources. Determining the contributions of metals from these sources has proven difficult, in part, because physical and biogeochemical processes alter the nature (e.g., grain size, mineral composition, organic matter content) of the source materials as they are transported through the drainage network. This study examined the use of paleoflood deposits located along the hyperarid Rio Salado, a tributary to the Rio Loa of northern Chile, to construct local background functions and enrichment factors (LEFs) to differentiate between natural and anthropogenic metal sources. Significant variations in metal content occurred between river reaches and flood deposits of a given reach; these variations were primarily related to changes in sediment source that may reflect differences in El Niño and La Niña precipitation patterns. Three conservative elements (Al, Fe, Co) were examined to construct background functions for seven trace metals. Cobalt yielded the most effective background functions for As, Cd, Ni, Pb, and Zn; Fe was selected for Cr, and Al for Cu. The resulting LEFs approximated 1, illustrating that paleoflood deposits produced effective background functions, and could be applied to downstream sites contaminated by mining activity.

1. Introduction

Toxic trace metals and metalloids (hereafter referred to as trace metals) are among the most common and significant contaminants in riverine ecosystems [1,2,3,4,5,6]. In rivers characterized by “typical” Eh and pH conditions, trace metals are predominantly sorbed to sediments, particularly fine-grained, chemically reactive sediments. As a result, more than 90% of the total trace metal load is transported with particulates by physical processes [7,8], and is incorporated into channel bed, floodplain, and other types of alluvial deposits [9,10]. Alluvial deposits, then, contain a record of the spatial and temporal variations in trace metal transport through the river system, and can provide important insights into the degree to which anthropogenic activities including mining, waste water treatment, agriculture, and industry, among others, have contaminated the aquatic environment.
The degree to which human derived trace metals have contaminated a river or river reach is typically assessed by comparing sediment concentrations in the channel bed or its adjacent floodplain to background values. Background has been defined in different ways for different purposes [11]; it is defined here as the concentration of the contaminant in sediment that is devoid of anthropogenically derived trace metals (after definition No. 8 provided by Reimann and Garrett [11]). While the concept of background is simple, defining background concentrations for riverine environments has proven problematic. In fact, the determination of background can be one of the more contentious aspects of a site investigation, particularly where the polluter-pays-principle is in effect, because it helps determine where remediation is required, and the volume of sediment that must be treated. Defining background is particularly difficult in mining areas where the catchment is underlain by mineralized rocks characterized by trace metal concentrations that can be similar to the anthropogenic source(s).
Distinguishing between natural and anthropogenic metal concentrations is further complicated by physical and biogeochemical processes that act on natural and anthropogenic source materials as they are transported downstream through the drainage network. A process of particular importance is hydraulic sorting which partitions the metal(s) of concern into specific grain size fractions, which in turn are deposited in spatially specific sites within the channel bed and its associated floodplain [9]. Other processes of importance include the incorporation of non-reactive constituents (e.g., organic matter, carbonates) into the suspended and deposited sediment, and various chemical transformations such as reductive/oxidative reactions (that may, for example, allow grains to be coated with Fe and Mn oxides and hydroxides). The net effect of these processes is for trace metals to become fractionated during transport such that they are associated with sediments characterized by distinct sedimentologic traits, leading to concentrations that may be significantly higher or lower than in the original source materials. This fractionation process is element specific, and depends on the local climatic, hydrologic, and geomorphic setting [9,12].
Early attempts to account for differences in sediment-related sample concentrations focused primarily on grain size. This approach, which is still widely used by both the research and regulatory communities, involves the analysis of a specific grain size fraction (e.g., sediments <63 µm in size), or the normalization of the concentration measured in the bulk sediments (<2 mm in size) by a specific grain size fraction [13]. These approaches assume that the utilized grain size fraction is the chemically active phase and contains 100% of the trace metals. Recent studies have shown, however, that granulometric normalization does not fully compensate for metal variability in alluvial deposits [12,14], in part, because the metal content of the sediments is also dictated by the lithologic composition of the deposits [12,14,15]. Coarse (sand-sized) sediments or rock fragments may, for example, include mafic (e.g., biotite, augite and amphiboles) or sulfide (e.g., pyrite, galena, and sphalerite) minerals that contain the trace metal(s) of interest. Moreover, the fine-sediment fraction may contain components such as non-reactive organic matter and/or silt-sized quartz grains that act to dilute elemental concentrations [16].
An alternative, widely used approach to determine the degree to which sediments are contaminated by anthropogenic pollutants has been the calculation of an enrichment factor (EF). EFs are commonly determined by normalizing the target trace metal by a conservative reference element [17]. One form of this approach is the “double-normalization” technique, mathematically expressed as
EF = (M/Mref)/(M/Mref)bc
where M is the target trace metal of interest, Mref is the reference element, and bc refers to the average concentrations of the target metal and reference element in uncontaminated rocks or sediments. Commonly utilized reference elements include Al, Fe, Li, Rb, Si, Ti, and, more recently, Co. The approach is thought to address variations in both grain size and particle mineralogy. For example, the most widely used reference element, Al, is a significant component of aluminosilicate minerals, including fine-grained (<~2 µm) clay minerals. Its occurrence is therefore an indicator of both grain size and composition [12,18,19].
Historically, elemental averages determined for upper continental crustal rocks or shale (bc, Equation (1)) were used as background values in the calculation of enrichment factors [17,20,21]. The use of these elemental averages has proven inappropriate [12,14,22], and may result in large errors in the calculation of EF values [14] for two primary reasons. First, elemental concentrations determined from upper continental crustal rock or shale may poorly represent rocks that actually underlie the catchment of study. Second, the metal concentrations measured in rocks will be altered, as described earlier, by physical or biogeochemical fractionation processes that act on the source materials as they are transported downstream.
In light of the above, recent studies have argued that the use of enrichment factors should be replaced with the calculation of a local enrichment factor (LEF) [12,14,22], in which,
LEF = MS/MBG
where MS is the concentration of the target metal of concern in the sample, and MBG is the concentration of the metal of concern in the local (non-anthropogenically polluted) background sediments. MBG is empirically predicted using a background function, such that
MBG = f(Mref)
In most instances, background functions are simple bivariate regressions of the concentrations, derived from unpolluted sediments, between the target trace metal and a parameter that accounts for metal fractionation during transport. The most common functions involve grain size, organic matter content, or the concentration of a conservative reference element (e.g., Al, Fe, Ti, etc.).
The development of background functions requires the sampling and analysis of unpolluted sediments. Non-contaminated sediments are commonly found within pre-historic alluvial deposits associated with riverine terraces or buried below surficial floodplain deposits, among other locations [9]. In some catchments, however, the identification of non-contaminated sediments can be problematic (see, for example, Nováková et al. [23]). The identification of non-contaminated sediments can be particularly difficult in semi-arid, arid, and hyperarid settings where the majority of the sediment and sediment-associated contaminants are transported by extreme, but rare floods that inundate and rework most or all of the valley floor. The geochemistry of surface- and groundwater in these systems also differs from wetter climatic regimes in that aridity and elevated evaporation rates often lead to reduced biota and biotic activity, reduced dissolved organic carbon contents, and highly saline conditions, among a host of other factors, which influence the aqueous transport and post-depositional redistribution of the trace metals (see, for example Sims et al., [24]). A case in point is the hyperarid Rio Loa-Rio Salado drainage system of northern Chile (Figure 1).
The primary objective of this study was to determine if paleoflood deposits found along the Rio Salado could be used to construct the background functions needed for the calculation and application of local enrichment factors to differentiate between natural and anthropogenic metal sources. Inherent in this objective was an assessment of the factors that controlled the spatial and temporal variations in metal concentrations within the deposits, and an assessment of whether calculated functions and LEFs could be used to differentiate between natural and anthropogenic contamination of alluvial deposits located along the Rio Loa.

2. Geographic and Climatic Setting

The Rio Loa heads along the western flank of the Andes and flows downstream across the Atacama Desert, one of the driest places on the planet (Figure 1). Throughout its course the Rio Loa is deeply incised into the underlying bedrock. In the upstream most regions of the western Cordillera, incision exceeds several hundred meters, and consists to two primary drainages, the Upper Rio Loa and the Rio Salado. The Upper Loa extends from the base of the Miño volcano in the Andes to its confluence with the Rio Salado (Figure 1). The Rio Salado flows in a westerly direction from the El Tatio Geyser Basin in the Andes until reaching the Rio Loa. These catchments are underlain by limestones, rhyolitic and liparitic volcanic deposits, and Miocene to Holocene alluvial and lacustrine deposits. Channel gradients in these upstream drainages are relatively high (>0.05), and confined to narrow, bedrock controlled valleys characterized by few depositional landforms and little sediment storage. Downstream of the confluence of the Rio Salado and the Rio Loa the drainage system enters the Calama Basin, which is underlain predominantly by Miocene to Holocene alluvial deposits and Pliocene to Holocene evaporitic deposits. The transport and deposition of sediment along this reach of the Rio Loa alternates between relatively narrow, steep bedrock controlled valleys possessing few fluvial landforms and wide valleys containing lower gradient channels, floodplains, and extensive terraces underlain by both alluvial and paleo-wetland deposits that form the valley floor. The Lower Rio Loa flows northward until the river turns sharply to the west and flows through a canyon composed of Mesozoic and Paleozoic sedimentary formations exposed in the Coastal Mountain range (Cordillera de la Costa).
In spite of the Atacama’s extreme aridity, the upstream reaches of the Rio Loa are perennial. The continuous surface flow is derived from precipitation and runoff at high elevations (>4000 m) along the western Andes, and the emergence of groundwater below about 2500 m from thick alluvial aquifers within the Calama depositional basin [25,26]. Spatial variations in annual rainfall (and evapotranspiration) within the catchment are extreme, varying semi-exponentially from west to east as a function of elevation [27]. Below ~2300 m annual precipitation is often <1–5 mm/yr, whereas between about 2300 and 3000 m, precipitation is on the order of 20 mm/yr. Above 3000 m, annual precipitation varies from ~150 to 300 mm/yr) [26]. The majority of the rainfall (~80–90%) falls during the austral summer months (December to March). During wet summer months, multi-peaked seasonal floods, many caused by rain on snow events, pass down the axis of major rivers on the western flank of the Andes. Floods within lower elevation tributaries are rarely produced by rainfall that originated from the east. Rather, flooding in these tributary basins is produced by north-easterly moving frontal storms, sourced in the Pacific [26,28].
Water and sediments within the Rio Loa are, unfortunately, highly contaminated by trace metals and metalloids, including As, Cd, Cr, and Cu. Table 1, for example, shows that sediments locally exceeded threshold effect and/or probable effect guidelines for aquatic biota put forth by MacDonald et al. [29]. These metals are derived from both natural and anthropogenic sources. The El Tatio Geyser Basin drained by the Rio Salado, a major tributary to the Rio Loa, is a particularly important natural source of metals, especially As [30]. Dissolved As concentrations in water from the geyser field reached 10,000 µg/L, and are the highest reported for any surficial water body [31]. Arsenic concentrations as high as 11,000 ppm have been reported in sediments within the El Tatio Basin. Anthropogenic metals are primarily derived from three large Cu mines, including Chuquicamata, Radomiro Tomic, and El Abra located north of Calama (Figure 1). Mining of the Cu-Mo-Ag-Au deposits at Chuquicamata, the largest of the three, began on an industrial scale in 1923; it is now one of the largest Cu mines in the world [30]. Waste products from the mine are currently discharged to the 40 km2 Talabre impoundment east of Calama (Figure 1), but prior to the impoundment’s construction in the early-1990′s, mining debris and effluent directly entered the upper Rio Loa and the Rio San Salvador, where considerable quantities of historic mine tailings remain within its headwaters. Debris from Radomiro Tomic and El Abra, located further north of Calama, also occurs along the headwaters of several large alluvial fan complexes and is transported through a channelized network during high runoff events to the upper Rio Loa (Figure 1).
While high magnitude floods within the Rio Loa basin are rare, recent studies have shown that contaminated sediments from both natural and anthropogenic sources are primarily dispersed by these events. For example, flooding in 2001 resulted in the partial inundation of Calama, and the deposition 10s of cm of sediment over 100s of km2 [26].

3. Methods

3.1. Characterization of Paleoflood Deposits

Paleoflood deposits were identified along numerous reaches of the Rio Salado. Two were selected for detailed study, and are referred to as reach RS and PD (Figure 1). Individual flood deposits were defined on the basis of grain size and color, primary sedimentary structures, induration, and the presence of bounding surfaces, among other parameters. Once defined, the sedimentology of each unit was characterized following the procedures outlined in Kottlowski [33] and Bridge [34]. The deposits were then systematically sampled for physical and geochemical analyses as well as radiocarbon dating. Samples were obtained from vertical exposures that had been cleaned of loose debris (sediments). All samples were placed in polypropylene sampling bottles, and shipped to Western Carolina University for analysis.

3.2. Determination of Flood Magnitude and Frequency

Inverse hydraulic modeling methods using paleostage indicators, particularly those associated with slackwater deposits [35], are often effective at estimating discharge in arid environments [36,37,38]. During this investigation, step-backwater methods, conducted using the Hydrologic Engineering River Analysis System (HEC-RAS) and patterned after O’Connor and Webb [39] and Webb and Jarrett [40], were used to estimate paleoflood flows along the two selected study reaches.
The approach required an understanding of the vertical elevation of each flood deposit and dimensions of the channel’s cross section. In October 2014, both were surveyed in the field at 12 locations within reach PD and 6 sites for the downstream reach (RS). The location of the cross sections was selected to characterize the complexity of the channel geometry. Cross-section measurements were made using two methods. In accessible areas, a Leica total station was used and geolocated by a GPS accurate to ±3 m. All coordinates were recorded using the WGS 84 datum and the UTM coordinate system. In areas where the canyon was inaccessible because of near-vertical walls, narrow channel/trench widths and high depths were determined using a laser range finder.
All cross-section data collected in the field were entered into HEC-RAS and additional cross sections were interpolated at a maximum along-channel interval of 0.026 km. The quality of the interpolated cross sections was enhanced by using a combination of detailed field notes and georeferencing to high resolution aerial imagery. During this investigation, the standard step method was used in the modeling effort. It is an iterative approach in which the water surface elevation is computed for a given channel geometry, roughness and discharge at a specific site. This process is then continued between adjacent cross section pairs until a water surface elevation is determined for the entire reach.
Flood frequency and magnitude analyses were conducted using the Log-Pearson Type III distribution recommended by the US Interagency Advisory Committee on Water Data (WRC, 1982), historical data from the El Sifon gauging station (Figure 1), and the estimated paleoflood data. Given the study reach is located downstream of the El Sifon gauging station, an adjustment was made to the peak discharge based on the methods provided by Culdworth Jr. [41] to account for differences in discharge between the study sites and gauging station. The analysis was conducted using the PeakfqSA software package (7.1, U.S. Geological Survey, Washington, DC, USA) that was designed to incorporate historic and paleoflood data into flood frequency analyses [42]. PeakfqSA employs a relatively general parameter-estimation technique called the Expected Moments Method (EMA). In this case, EMA was defined as floods characterized by magnitudes described by a discharge range [43]; the lower boundary was set at 200 m3/s (as defined by the paleoflood estimates), whereas the upper boundary was assumed to be infinite (which allowed for the possibility that floods occurred that were larger than those preserved in the stratigraphic record).

3.3. Analytical Methods

The sediment samples collected from reaches PD and RS were dried for 24 h at 100 °C, and passed through a 63 µm sieve to collect the fine-sediment fraction. The <63 µm sediment was then split and weighed into 0.5 ± 0.01 g subsamples, placed into nitric acid washed Erlenmeyer flasks, and spiked with 0.04 mL of yttrium (used as an internal reference standard that provided a check against instrument drift). A few drops of 20–30% nitric acid was then used to moisten the samples, after which 5 ml of concentrated (~68%), trace metal grade HNO3 was added for digestion. Sample containers were subsequently covered with parafilm and placed on a hot plate at a temperature of 130 °C for 14 to 16 h. Samples were subsequently allowed to cool, after which 1 ml of 30% hydrogen peroxide was added to remove organics. Samples were brought to volume with ultra-pure deionized water (18.2 MΩ).
After digestion, the extractants were analyzed for selected major elements (e.g., Al, Fe) as well as trace metals and metalloids (As, Cd, Co, Cr, Cu, Ni, Pb, and Zn) by means of a Perkin Elmer Optima 4100DV Inductively Coupled Plasma Optical Emission Spectrometer (ICP-OES, PerkinElmer, Inc., Waltham, MA, USA). Calibration was performed using in-house and National Institute of Standards and Technology (NIST) standards. Reagent blanks and analyte concentrations for the working standards were plotted against blank-subtracted integrated peak areas. A regression line was fitted to the calibration points and the equation of the line was used to quantify unknown sample concentrations. Deviation of standards from the regression line was used to estimate analytical accuracy, and replicate analyses were used to determine analytical precision. Both accuracy and precision were typically within +/− 5 %. The bulk and fine-grained sediment fractions of samples collected from site RL1 were analyzed by Wilson [32] using a similar approach.
Radiocarbon analyses were carried out on decomposed organic materials (humus) collected from the deposits by Beta Analytical, located in Miami, Florida using accelerator mass spectrometry (AMS). Herein, uncalibrated radiocarbon dates are presented.
The grain-size distribution of the <2 mm sediment samples was determined using a Mastersizer 2000 particle size analyzer (Malvern Instruments, Malvern, UK). Prior to analysis, ~5 g of sediment was combined in a 50 mL beaker with 5 mL of pyrophosphate and ~30 to 40 mL of deionized water. The mixture was stirred, allowed to sit for approximately 12 h, and stirred again prior to analysis. A 25 mg subsample of the sediments, which was combined with ~20 to 30 mg of WO3 (tungsten trioxide), was also analyzed for total organic carbon using the Vario EL III Elemental Analyzer (Elementar, Mt. Laurel, NJ, USA) at Western Carolina University.

3.4. Statistical Analysis

Least squares regression was carried out between selected trace metals (As, Cd, Cr, Cu, Pb, and Zn) and three reference elements (Al, Fe, and Co) to define background functions. Selection of the most appropriate reference element for a given target metal (background function) was based on the strength of the regression relationship (i.e., the regression coefficient). Once selected, the empirical distribution of LEFs (Ms/Mref) was used to determine the threshold LEF values, above which sediments were considered enriched at the 95% and 99% confidence intervals. Not all of the distributions were normal (Gaussian); thus, thresholds were defined using the percentiles of observations (after the procedures put forth by Matys Grygar and Popelka [12]). Differences in metal concentrations between sites and deposits were determined using the non-parametric Wilcoxon matched-pair test. Basic statistical and regression analyses were conducted using the IBM SPSS Statistics, version 23 software package (IBM Corporation, Armonk, NY, USA), whereas box plots were created using Origin 9.0 (Origin Lab Corporation, Northampton, MA, USA).

4. Results

4.1. Identification and Characterization of Flood Deposits

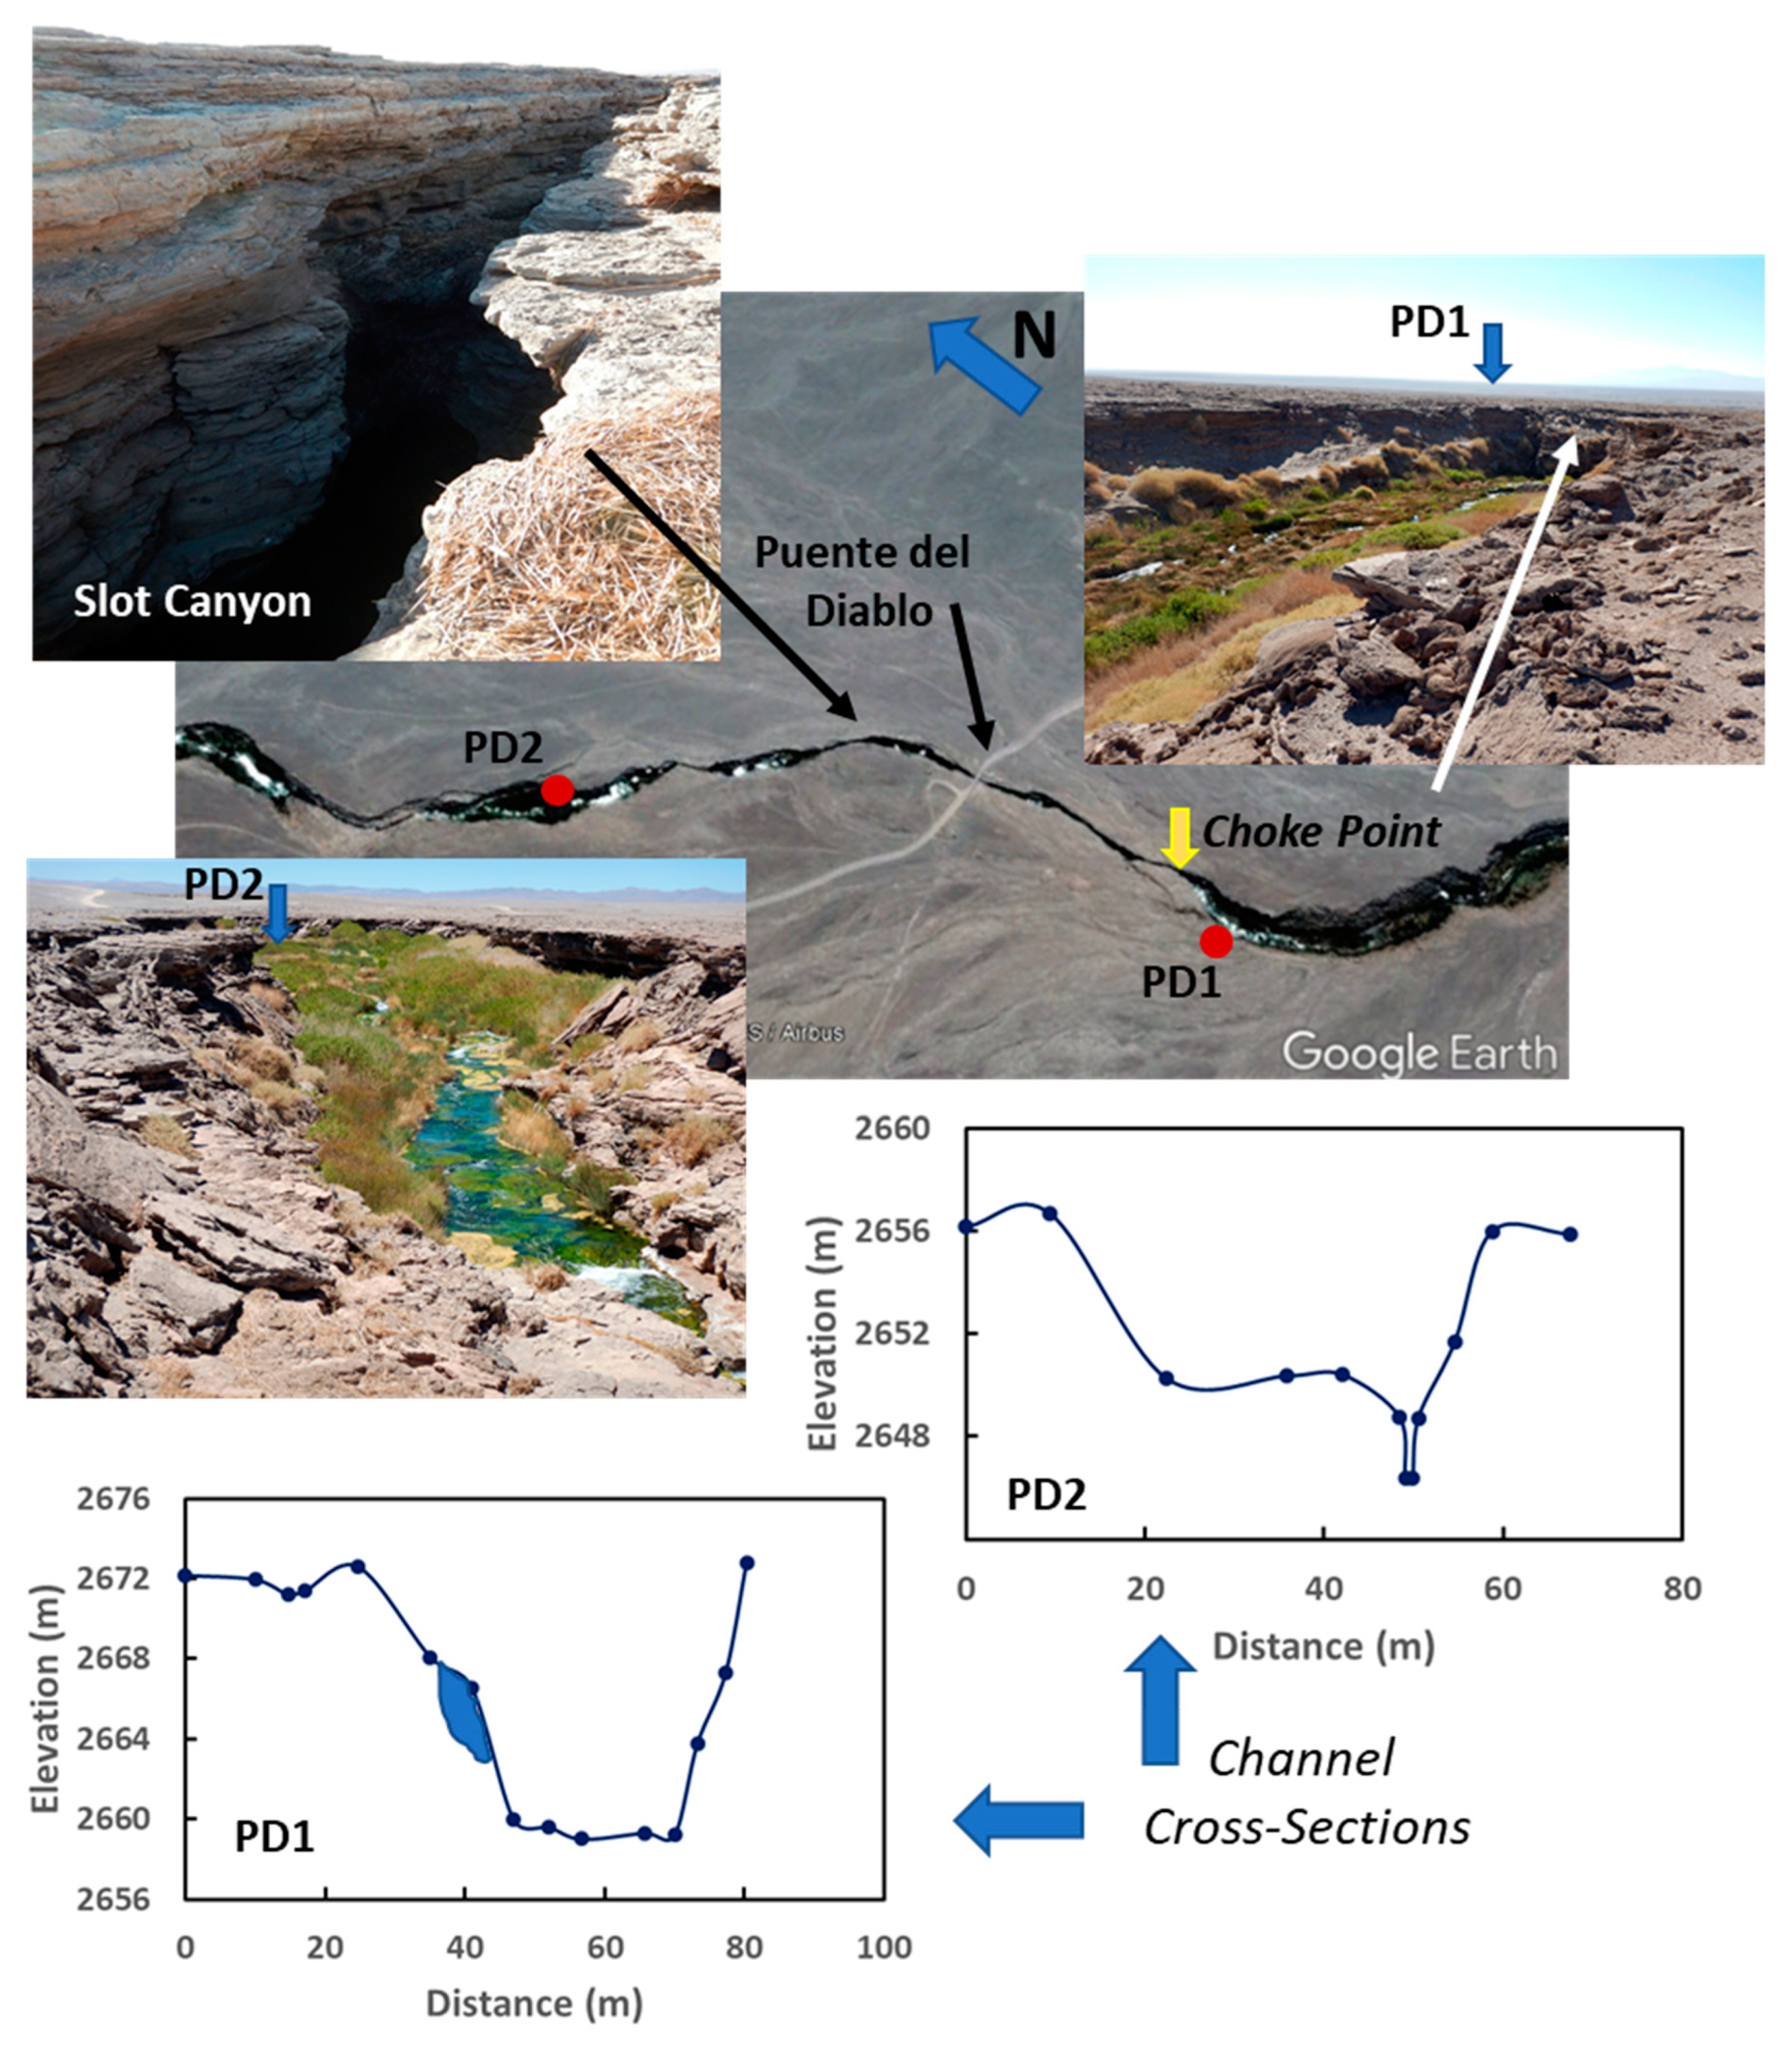
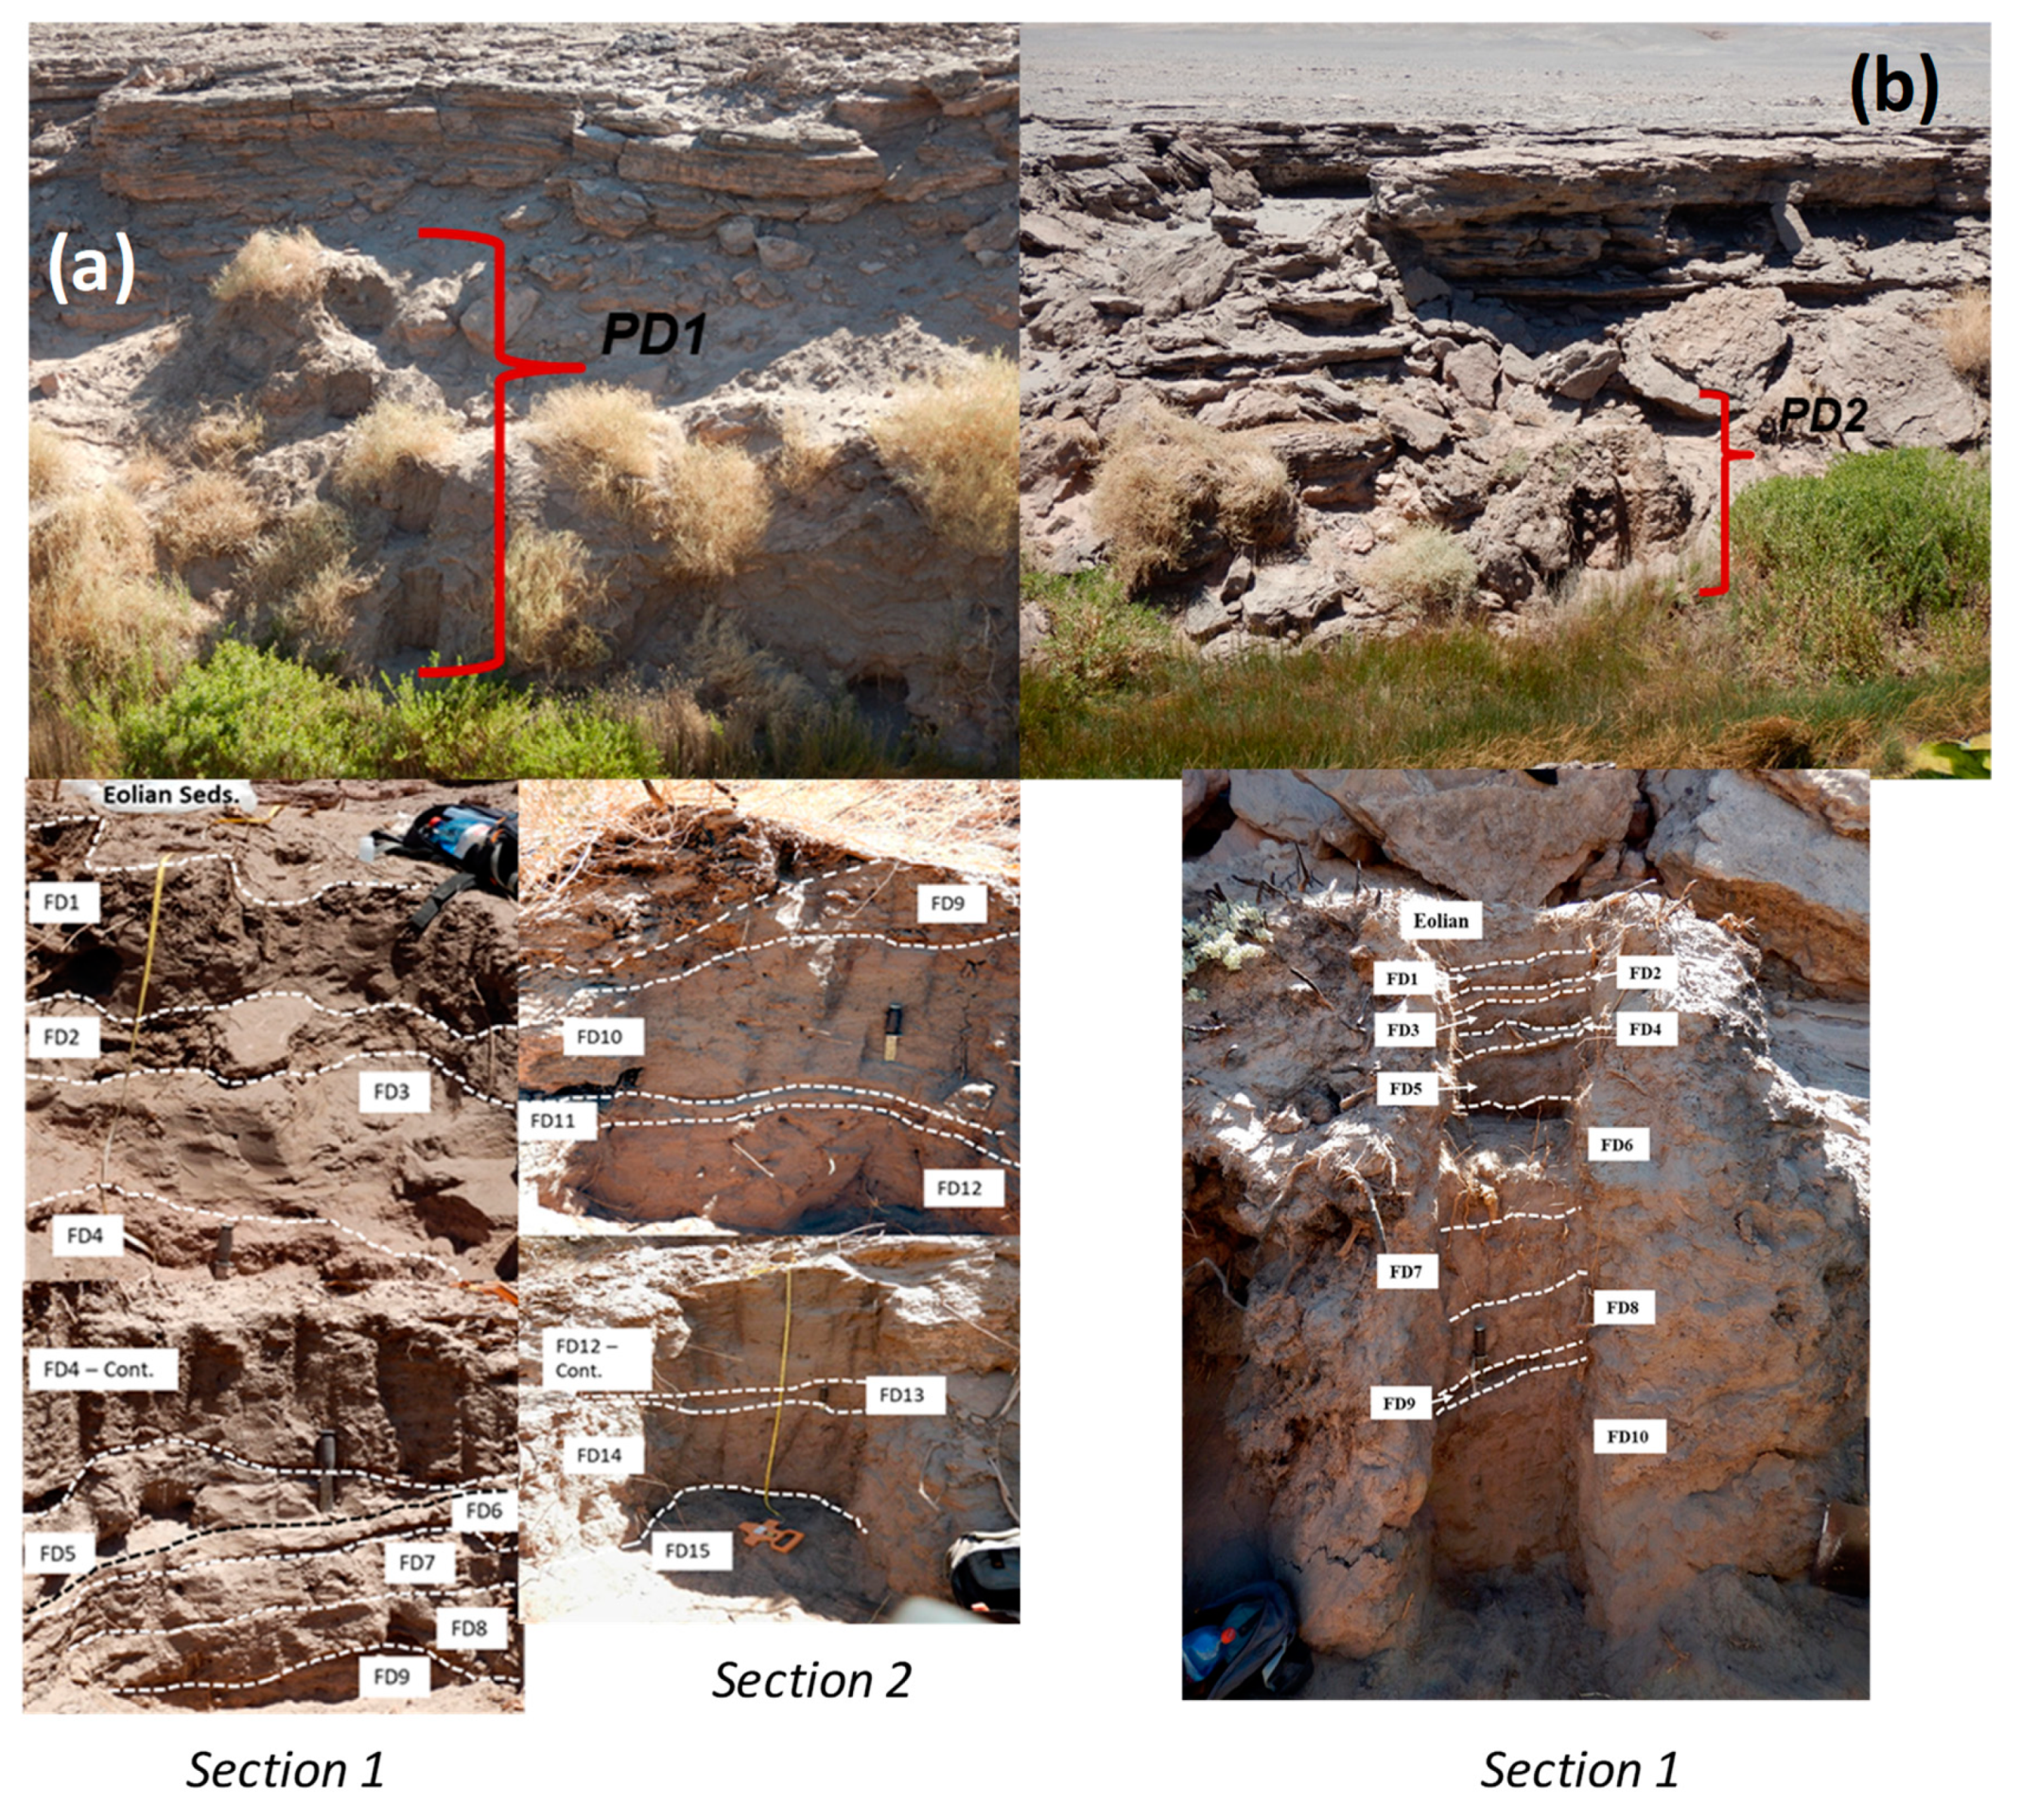
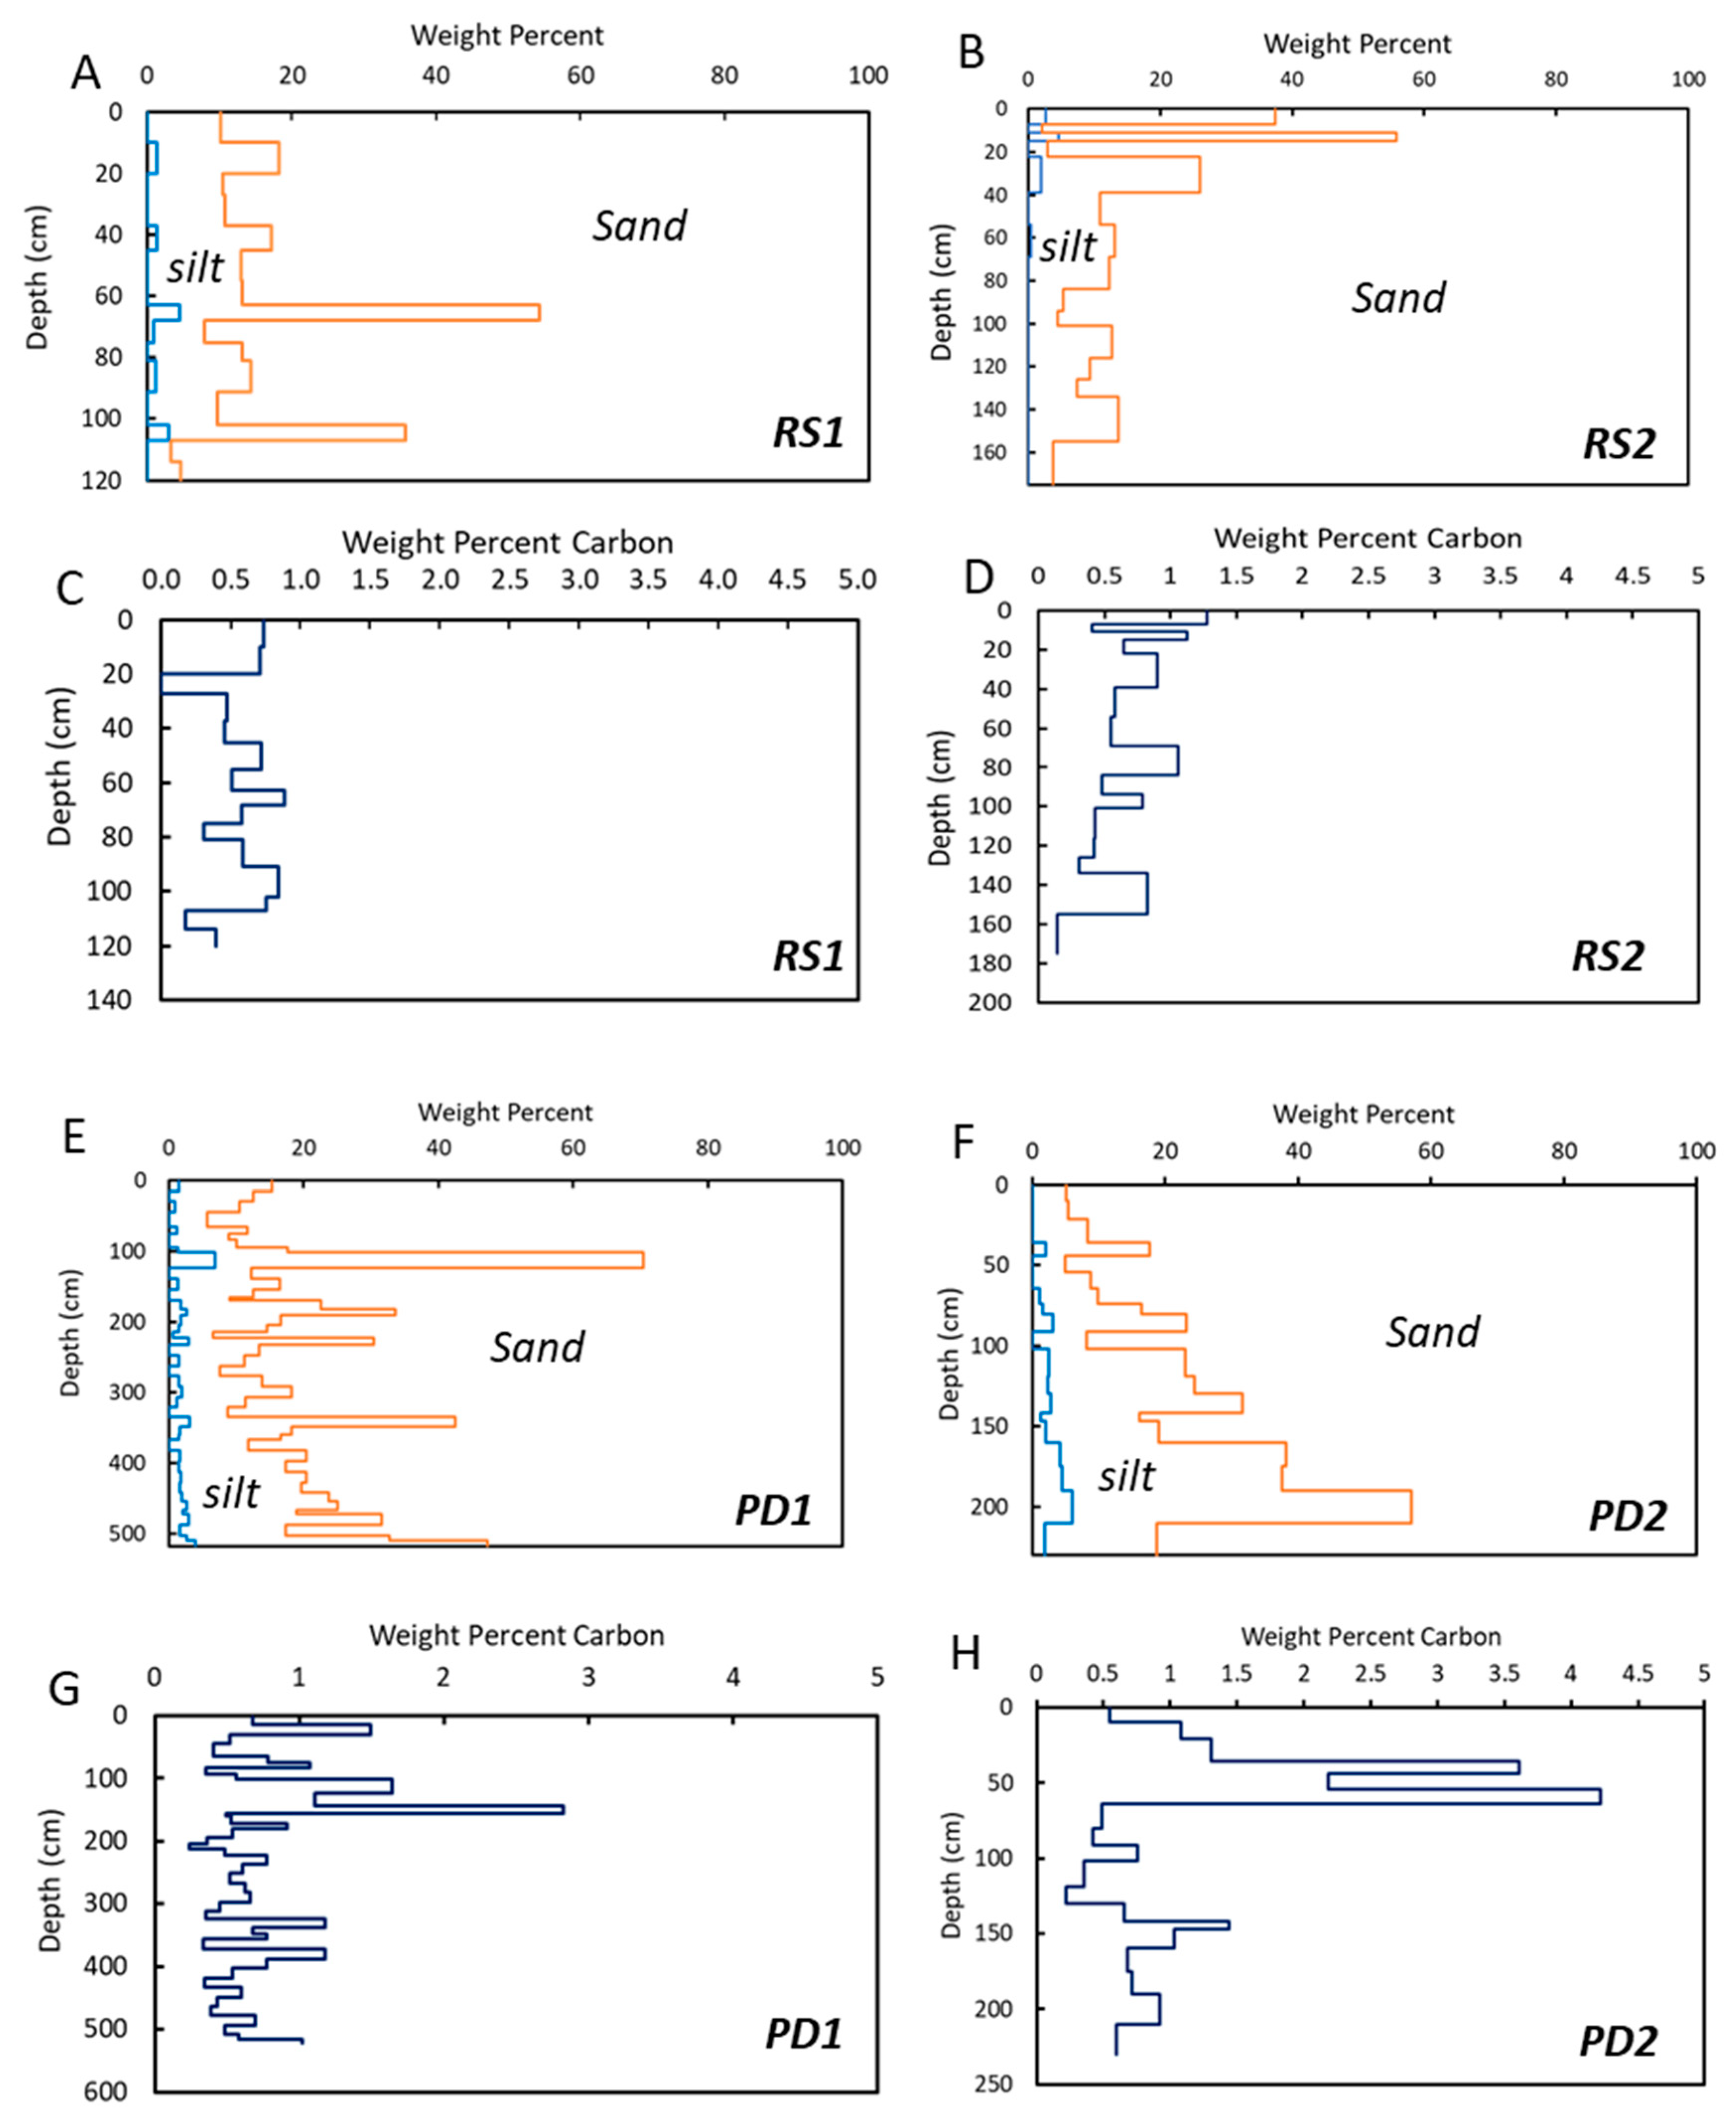
Paleoflood deposits were identified at multiple sites along the Rio Salado. Herein, we focus on well-preserved stratigraphic sequences located at four sites along two stream reaches. The upstream most reach, referred to as PD, after a local bridge, is approximately 1.4 km long (Figure 1). Its primary feature is a narrow “slot” canyon (Figure 2) that is approximately 1 to 2 m wide, exhibits nearly vertical bedrock walls, and is incised approximately 7–10 m below the valley floor. Up- and downstream of this reach, the canyon expands to a width of approximately 50 m, and a thin veneer (<2 m) of alluvium covers the underlying bedrock along the channel. Paleoflood deposits are locally preserved along the canyon walls, above the floor trench (Figure 2 and Figure 3). A particularly well-preserved section of flood deposits was identified about 200 m upstream of the “choke-point” (i.e., the site characterized by an abrupt decrease in canyon width, 22°18′53.28” S, 068°28′38.28” W), and is referred to as PD1. The stratigraphic sequence at PD1 was characterized by alternating layers of finer and coarser sediments (Figure 3). Each layer, defined as a distinct lithostratigraphic unit, was interpreted to have been deposited by a flood in a relatively low-energy and low-velocity environment created by the downstream chock-point. A total of 15 flood deposits were identified, all of which were dominated by sand- and, to a lesser degree, silt-sized sediment (<63 µm); clay-sized materials comprised less than about 5% of the material (Figure 4e). The stratigraphic sequence, which measures approximately 5.2 m in thickness, was characterized by an upward increase in sand content within the deposits (Figure 4e). A total of 41 samples were collected for physical and geochemical analyses.
Sampling Site PD2 is located approximately 160 m downstream of the narrow bedrock constricted reach that formed the choke point (Figure 2, 22°18′27.36” S, 068°28′55.56” W). Deposition at the site occurred upstream of bedrock and large colluvial boulders that protruded from the canyon wall. It may also have been aided by a decrease in flow velocities associated with divergent flow conditions as water emerged from the narrow upstream canyon. A total of 10 flood deposits were identified. As at PD1, the deposits were dominated by silty fine to medium sand-sized sediment, and the deposits tended to coarsen upward (Figure 4f). A total of 19 samples were collected from the deposits for physical and chemical analyses.
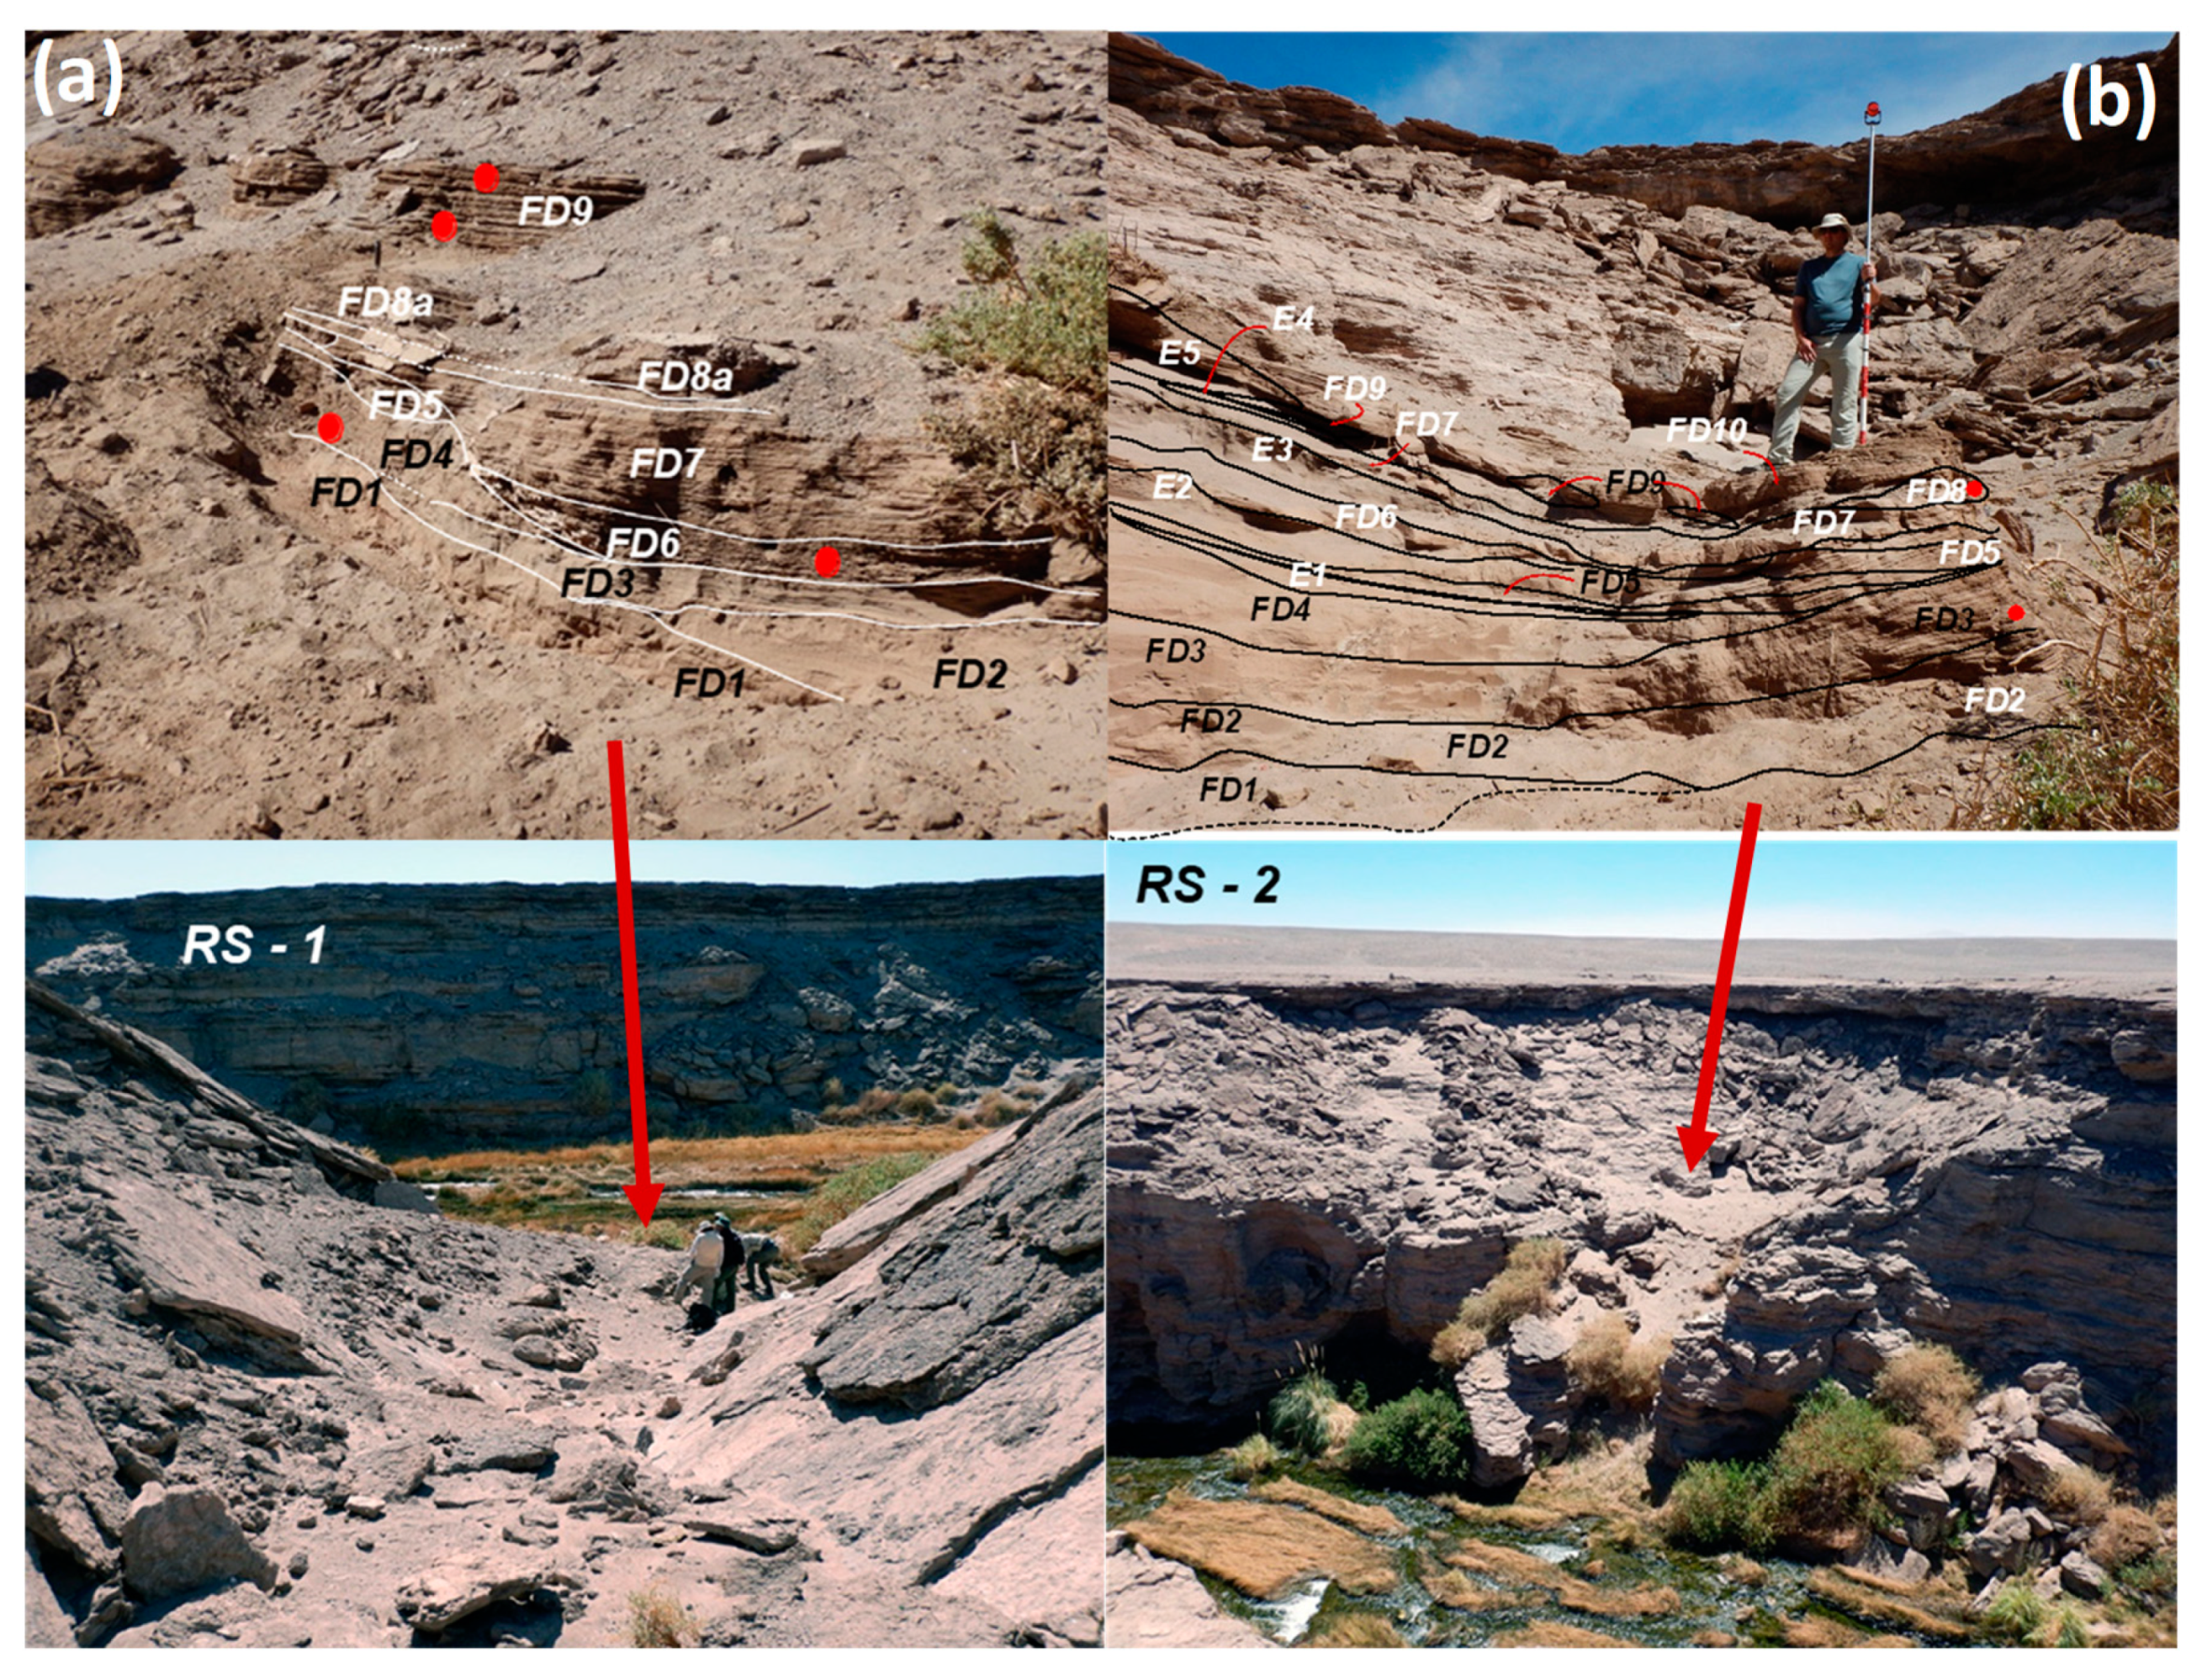
In contrast to reach PD, the downstream reach (RS) was characterized by a bedrock canyon that ranged from approximately 40 to 70 m in width and that was incised about 20 m below the valley floor (Figure 5). The floor of the trench is composed of recent alluvial “floodplain” sediments that are inundated by low magnitude events, whereas paleoflood deposits occur in tributary-alcoves associated with small drainage systems well above the floodplain. Two sets of flood deposits were described along the reach. Nine paleoflood deposits were described at RS1 (Figure 5, 22°18′37.08” S, 68°31′13.80” W). They were located in the “mouth” of a small tributary gully, and were located 6 to 7.5 m above the low-flow water surface. Deposits described at RS2 (22°18′41.04” S, 068°31′22.44” W), located about 0.28 km downstream, were deposited in an alcove cut in the canyon wall by a small channel that delivered flow to the edge of the canyon (Figure 6). Ten flood deposits were located between 5 to 7 m above the low-flow water surface. The deposits at both sites were characterized by horizontally laminated layers of silt- and fine to medium sand (Figure 4A,B). The laminations locally contained organic matter and plant fragments, which, given the complete lack of vegetation outside of the canyon, was presumably derived from the channel and floodplain at the bottom of the trench. Unlike the sequences of paleoflood deposits described along reach PD, the sequences along reach RS did not coarsen upwards (Figure 4). Rather, deposit grain size varied about a mean condition, and variations were generally less between the layers than associated with reach PD. In addition, flood deposits near the surface of the sequence were interbedded with loose, well-sorted, medium to coarse sands, which were interpreted to have been deposited by eolian processes (Figure 6).
A total of four radiocarbon samples were collected from RS1 and RS2. At RS1, samples collected from FD9 and FD4 (Figure 6) exhibited radiocarbon ages of 390 ± 30 years before present (YBP) and 210 ± 30 YBP, respectively. Samples collected from flood deposits FD8 and FD3 at RS2 dated between 350 ± 30 and 250 ± 30 YBP. Radiocarbon samples collected from PD1 and PD2 were not analyzed because of financial limitations, and a lack of correlation between deposit height above the channel bed and water surface elevation of the modeled flood events. Additional information on the stratigraphy and age of the paleoflood deposits at the four sites can be found in Walsh [44].

4.2. Paleohydrologic Analyses

Within arid and hyperarid basins, sediment-associated trace metals are primarily transported by rare, high magnitude events, such as the 2001 flood that occurred within the Rio Loa-Rio Salado catchment. The sedimentology, mineralogy, and therefore geochemistry of the produced alluvial deposits are likely to reflect, in part, the magnitude of the depositing flows [45,46]. Herein, we examine the paleohydrologic conditions responsible for the deposition of the flood deposits within the two reaches to provide the hydrologic context for their formation. The analysis also provided valuable insights into the age of the deposits, the frequency with which large sediment transporting events occur, and the potential atmospheric conditions associated with their occurrence.
Along reach RS, the model generated water surface profiles were typical of a subcritical flow regime, reflecting an absence of abrupt and significant changes in canyon width and/or depth. The modeled water surface elevations were calibrated by adjusting Manning’s roughness coefficient, n, such that the elevation of surface water profiles along the reach matched the surface elevation of the deposits at RS1 and RS2 during the February 2001 flood. Houston [26] estimated a peak instantaneous flow for the 2001 event to be 310 m3/s at the El Sifon gauging station near Ayquina (Figure 1). Manning’s n values of 0.035 for banks and 0.05 for the channel provided the best fit between the known and calculated elevation of the water surface for a discharge of 310 m3/s, adjusted for differences in catchment area between the two sites. Studies in similar settings have reported similar best fit Manning’s n values of 0.035 to 0.045 [47,48].
The water surface profiles indicate that flood deposit FD9 at RS1 correlates to FD3 at RS2. The correlation is supported by similar radiocarbon ages between FD9 (390 ± 30 YBP) and FD3 (350 ± 30 YBP).
The discharges determined for the lowest (FD2 at RS2) and highest (FD8 at RS2) flood deposits ranged between 240 and 515 m3/s. A total of 10 flood deposits occur within this range of discharge values, and were used to determine flood frequencies. In doing so, it was recognized that the paleoflood record may not be complete; some floods may not have resulted in the deposition of recognizable paleoflood deposits along the reach, whereas others may have been eroded. For slackwater deposits which were of unknown age (not directly dated), but whose age was constrained by their stratigraphic position, it was assumed that the timing of their respective floods was evenly spaced throughout the constrained time range. This approach is considered valid because the “number of floods per time period is more important in flood frequency analysis than the exact ages of the floods” [47].
The flood frequency analysis was performed using data from both the 10 paleoflood deposits and gauging station records collected at the El Sifon gauge near Ayquina. Data utilized from the El Sifon gauge were collected between 1991–2015 by the Chilean General Water Directorate. The largest flood on record during the 24-years of data from El Sifon was the 2001 event, which was estimated to have had a peak instantaneous discharge of 443 m3/s (after adjustment for drainage area) [26].
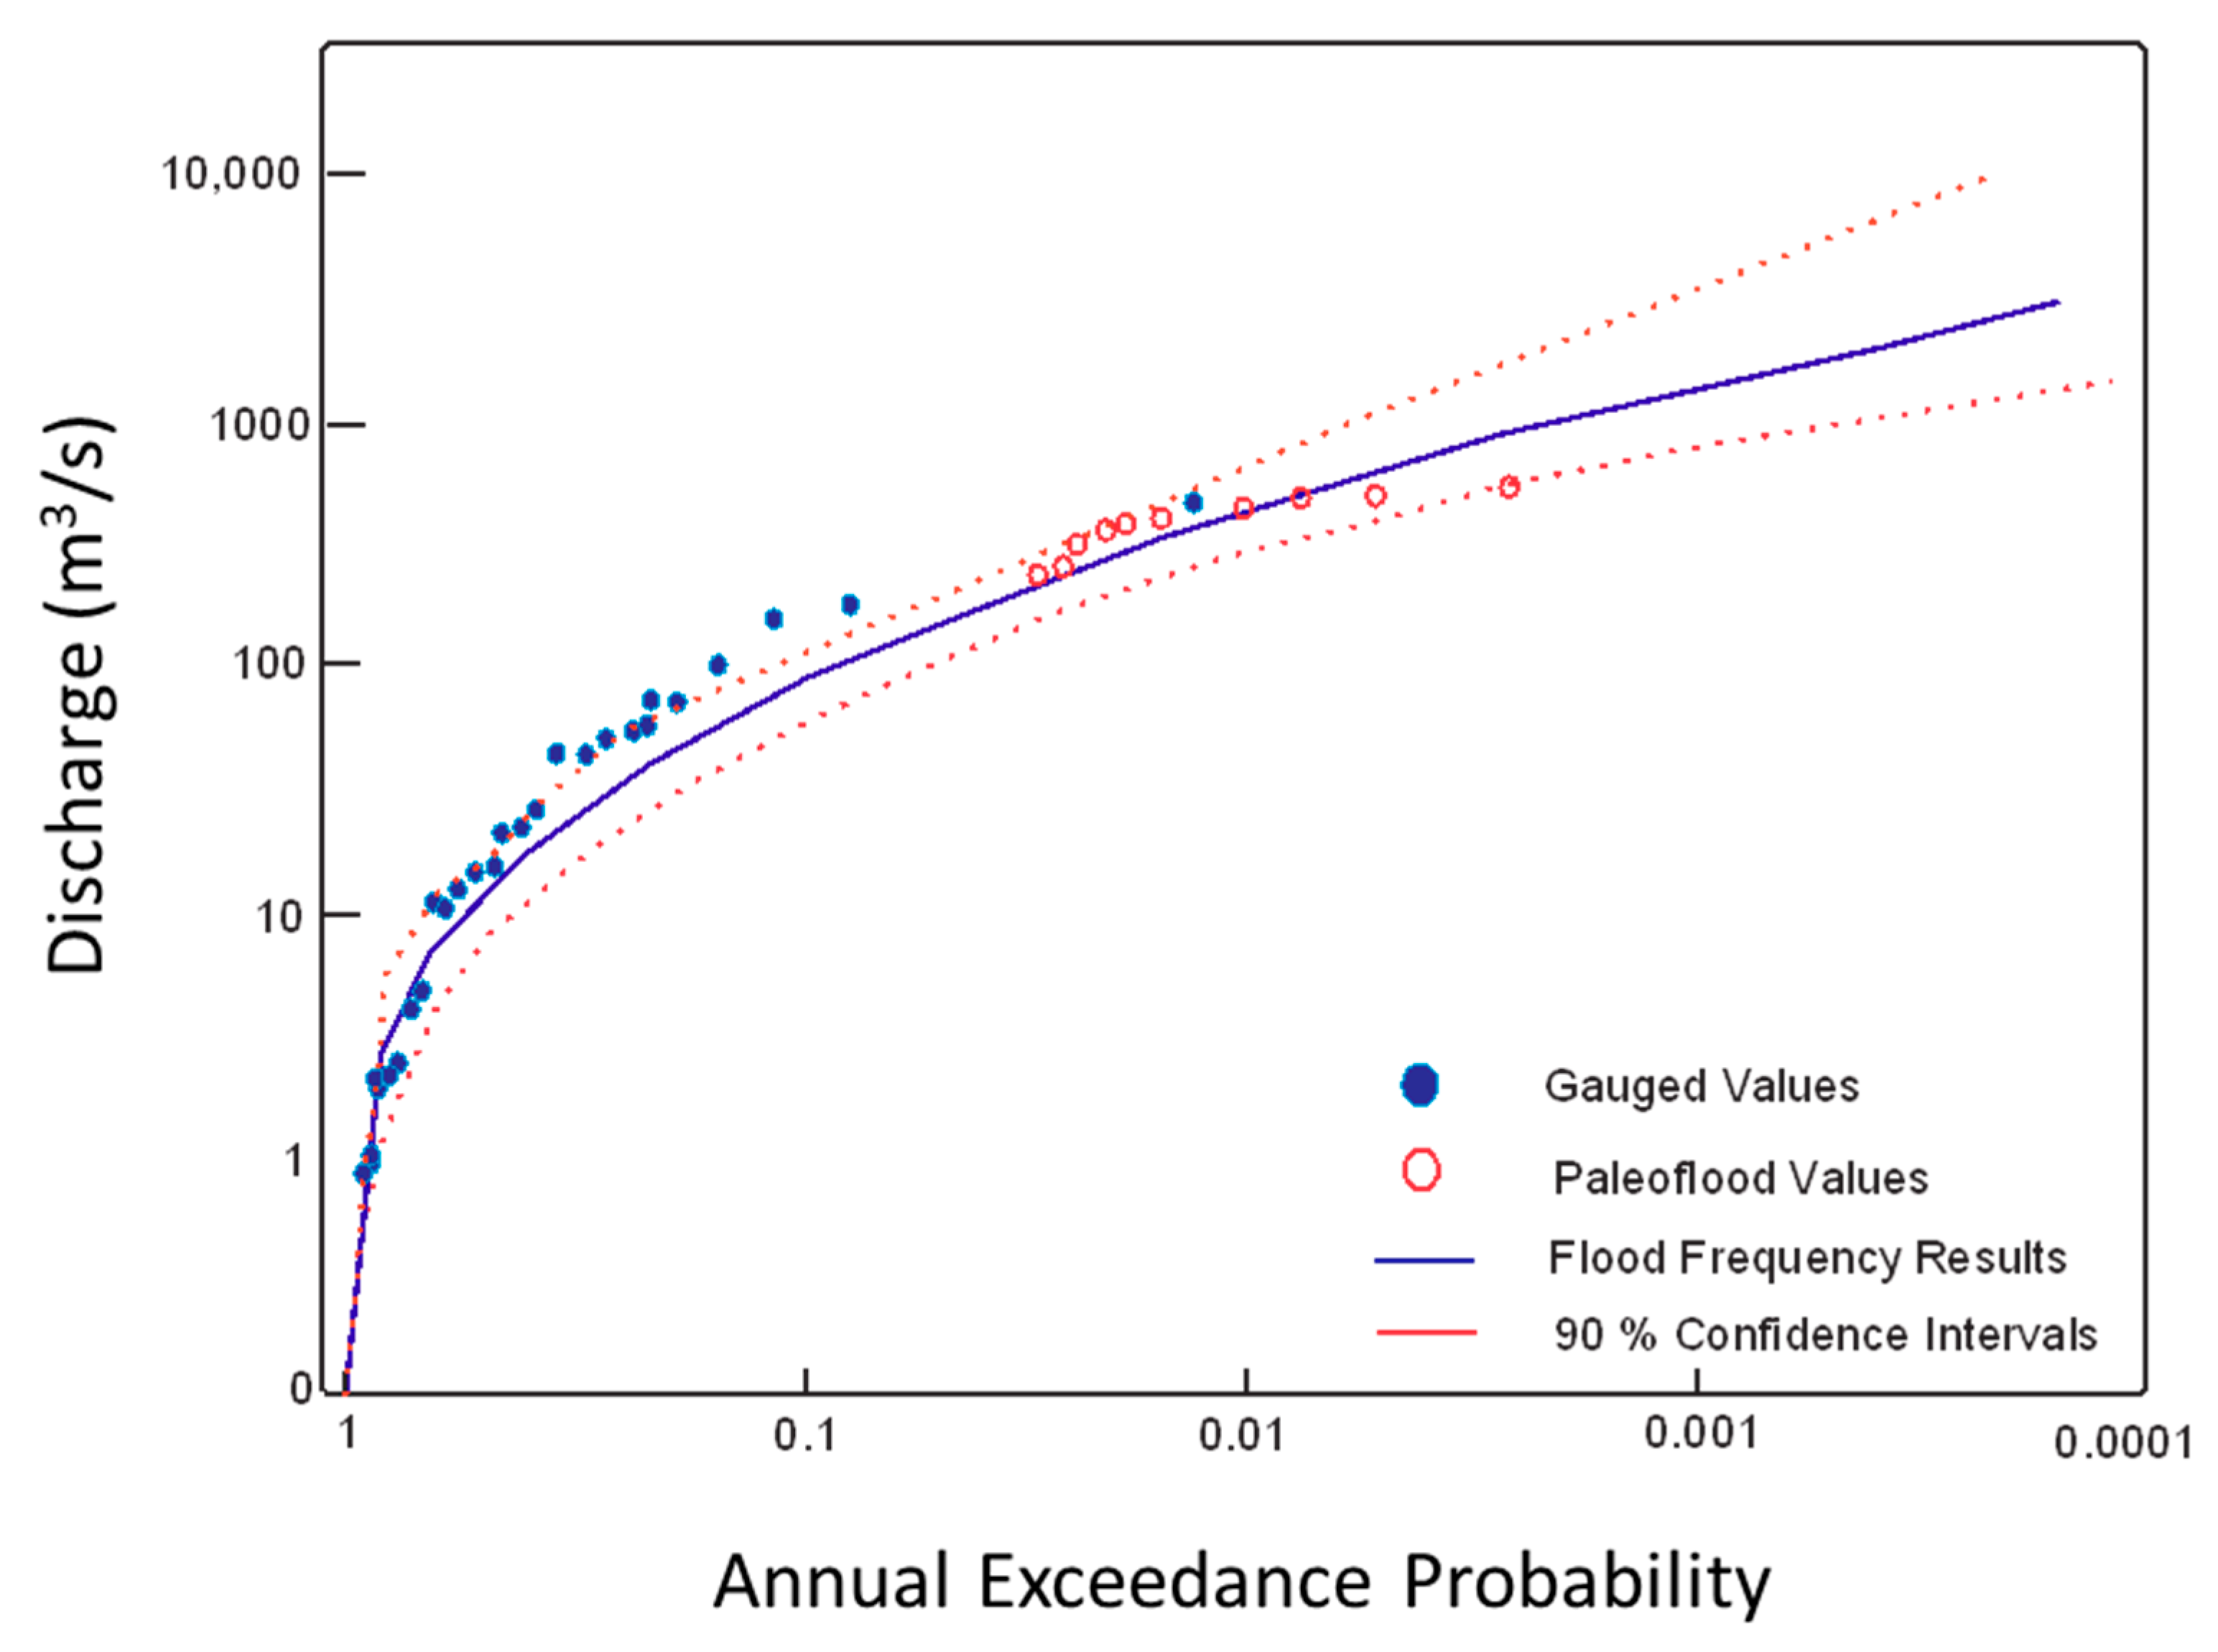
The flood frequency analysis showed that the 100-year flood exhibited a discharge of 429 m3/s. The 500-year flood was more than twice as large, 997 m3/s. Paleofloods with computed discharges <490 m3/s plotted above the flood frequency curve, whereas paleofloods with discharges greater than 490 m3/s plotted below the flood frequency curve (Figure 7). A poor fit for some of the gauged data occurred because the left-hand tail of the observed data was censored. This is a valid approach in arid regions where there are many years when no rainfall occurs [49]. Comparison of the computed elevations of the 50- and 100-year floods to the FD-9 slackwater deposits at RS-1 indicates that this deposit exhibited a recurrence interval exceeding the 100-year flood.
Hydrologic modeling along reach PD was complicated by abrupt variations in water surface profile elevations associated with cataracts and abrupt constrictions in the width of the bedrock canyon (Figure 2). Nonetheless, the maximum estimated discharge for reach PD, based on the elevations of slackwater deposits at PD1, was approximately 310 m3/s. Within the narrow (1–2 m wide) bedrock canyon, flood debris including sediment, wood, and plant fragments, was lodged ~2 m below the canyon rim. We believe this lodged debris was emplaced during the 2001 flood. The modeled discharge of the lodged debris (based on its maximum elevation) is consistent with the discharge of the 2001 flood as estimated by Houston [26] (443 m3/s) when corrected for basin area. Given that the 2001 event would have inundated the highest paleoflood deposits at both PD1 and PD2, the deposits were poor indicators of maximum flood stage within the canyon, and the discharge of the floods responsible for their deposition was underestimated by the modeling approach. Thus, radiocarbon dates needed to determine flood frequencies were not obtained for the site.

4.3. Deposit Geochemistry

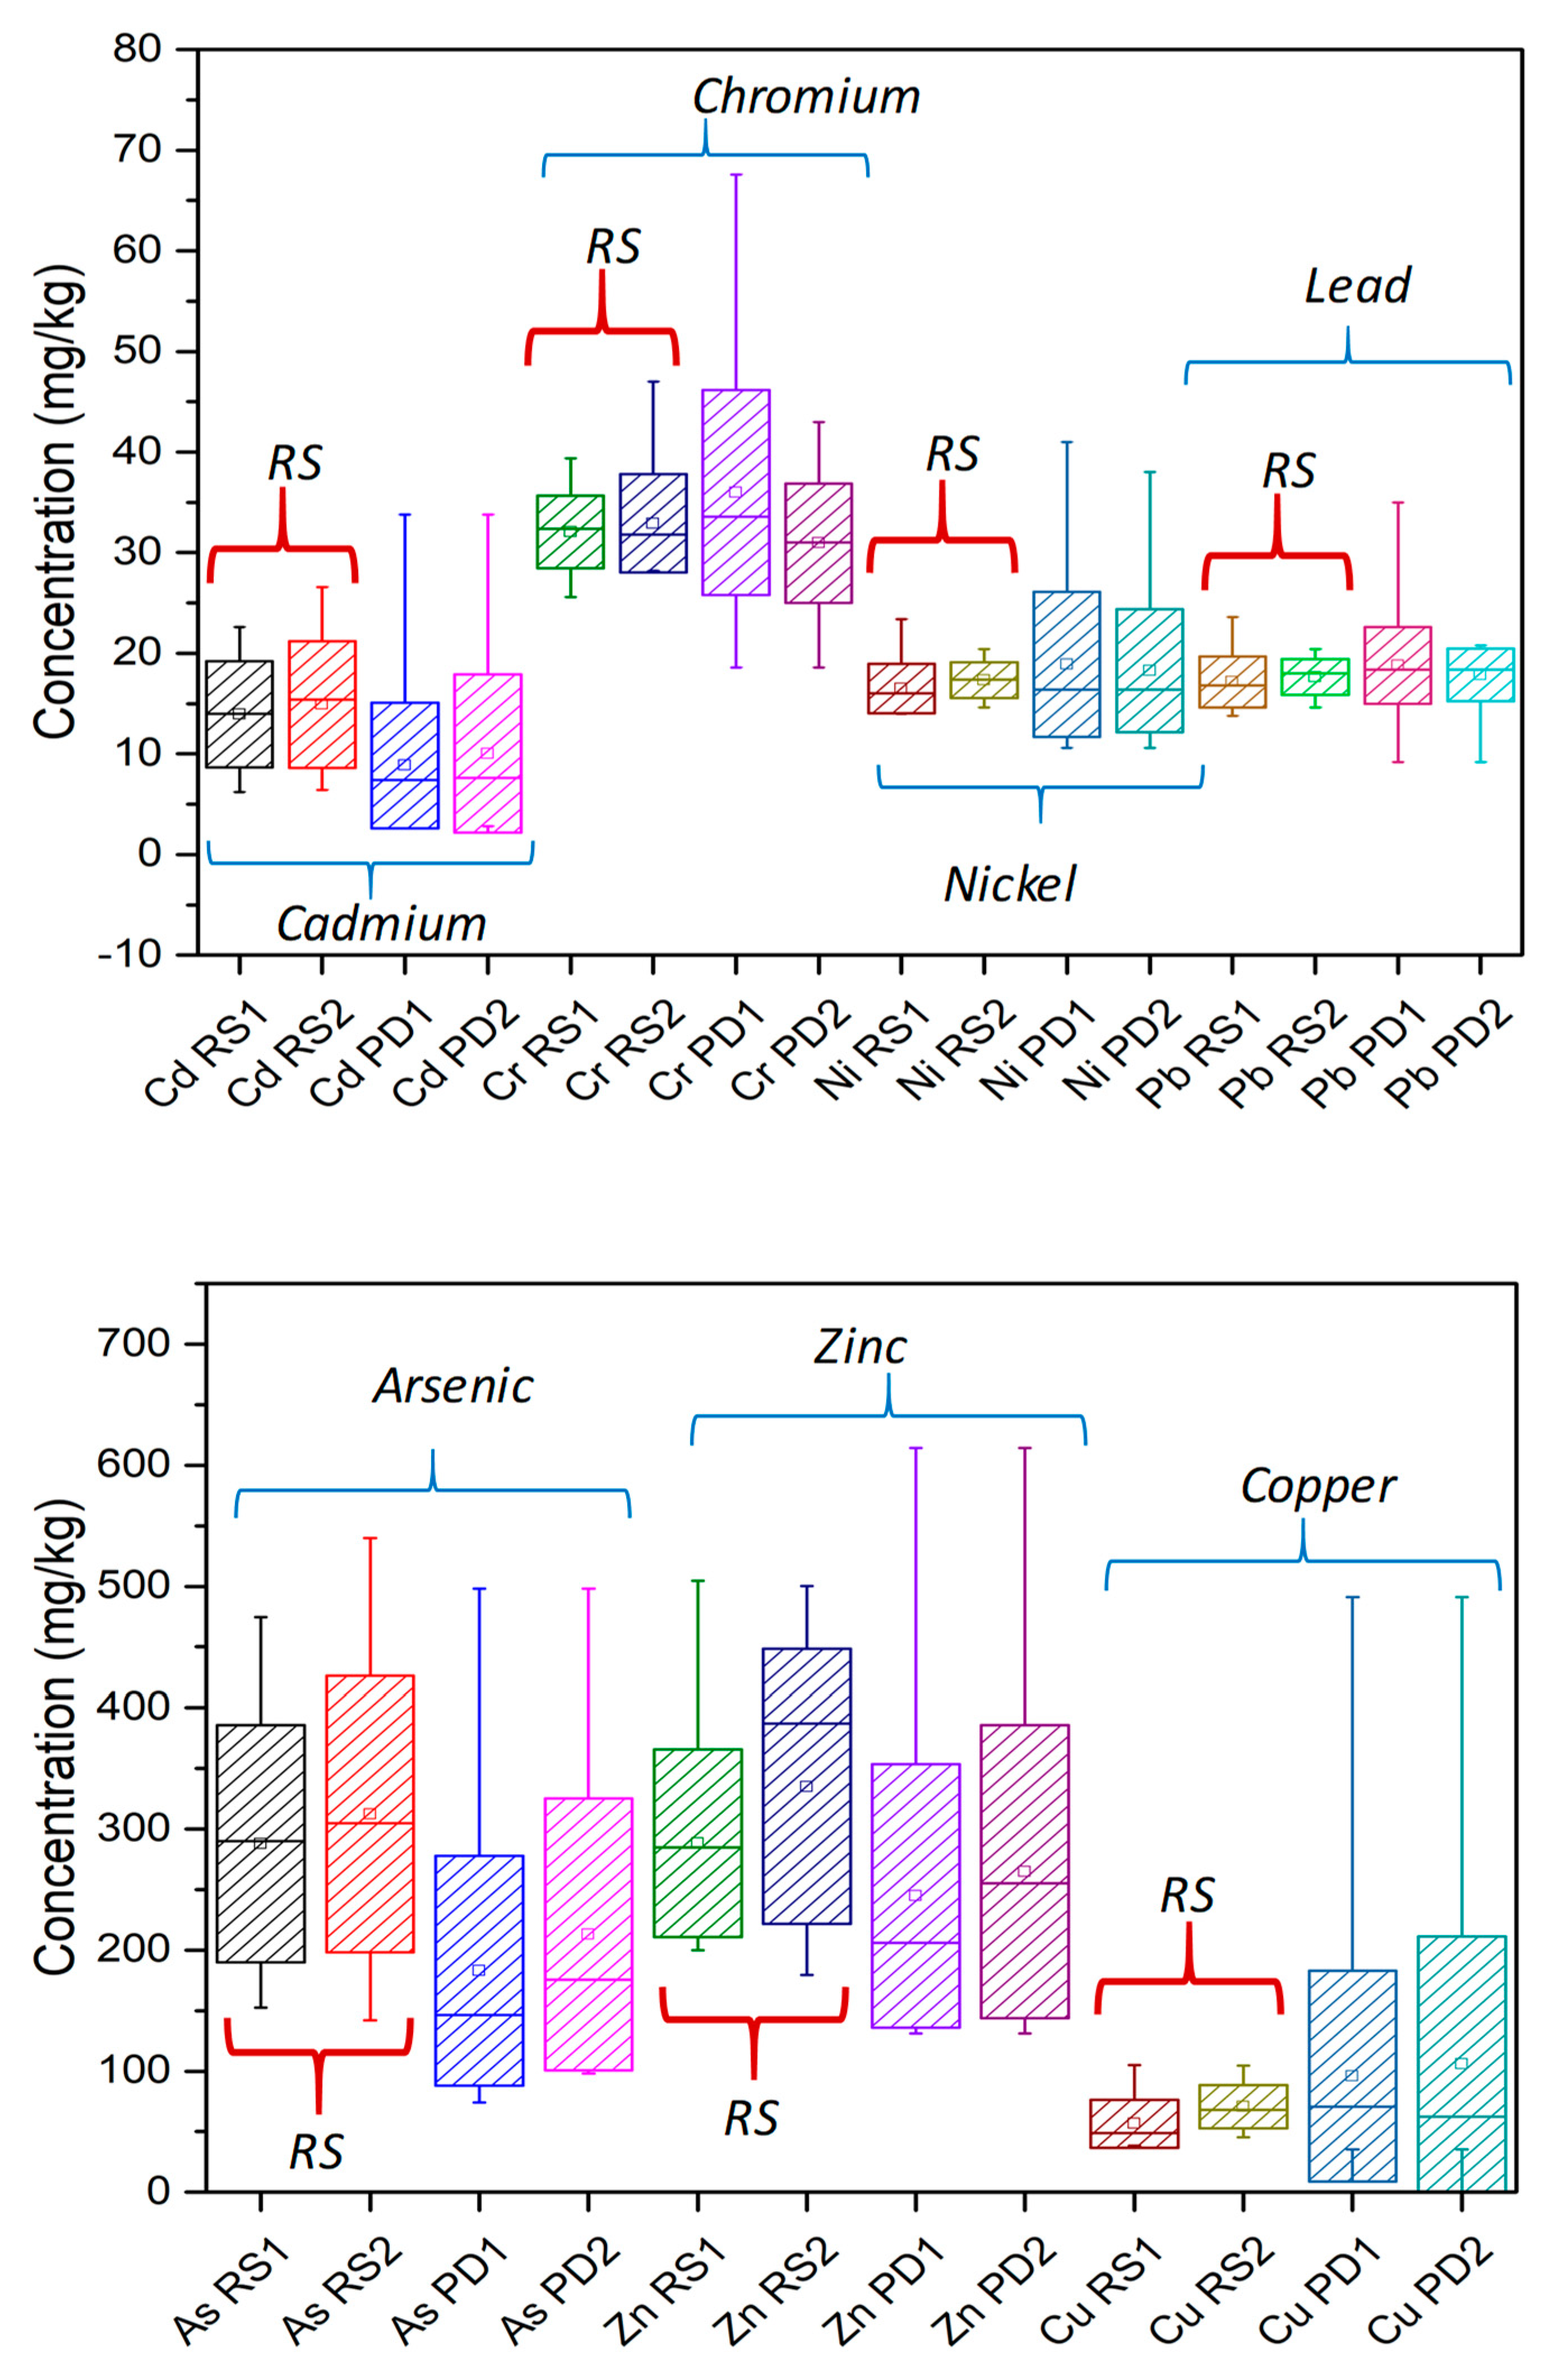
Sediment samples collected from the four paleoflood sequences were analyzed for seven metals, including As, Cd, Cu, Cr, Ni, Pb, and Zn. Basic statistical data for each element, stratified by stratigraphic section, are shown in Figure 8 and Table 2. There were no statistically significant differences in metal concentrations (p = 0.01) between the two sites within a given reach. The concentrations of As, Cd, and Zn differed at the p = 0.01 level between reaches RS and PD (Figure 7). The other metals (Cr, Cu, Ni, and Pb) exhibited similar concentrations between reaches.
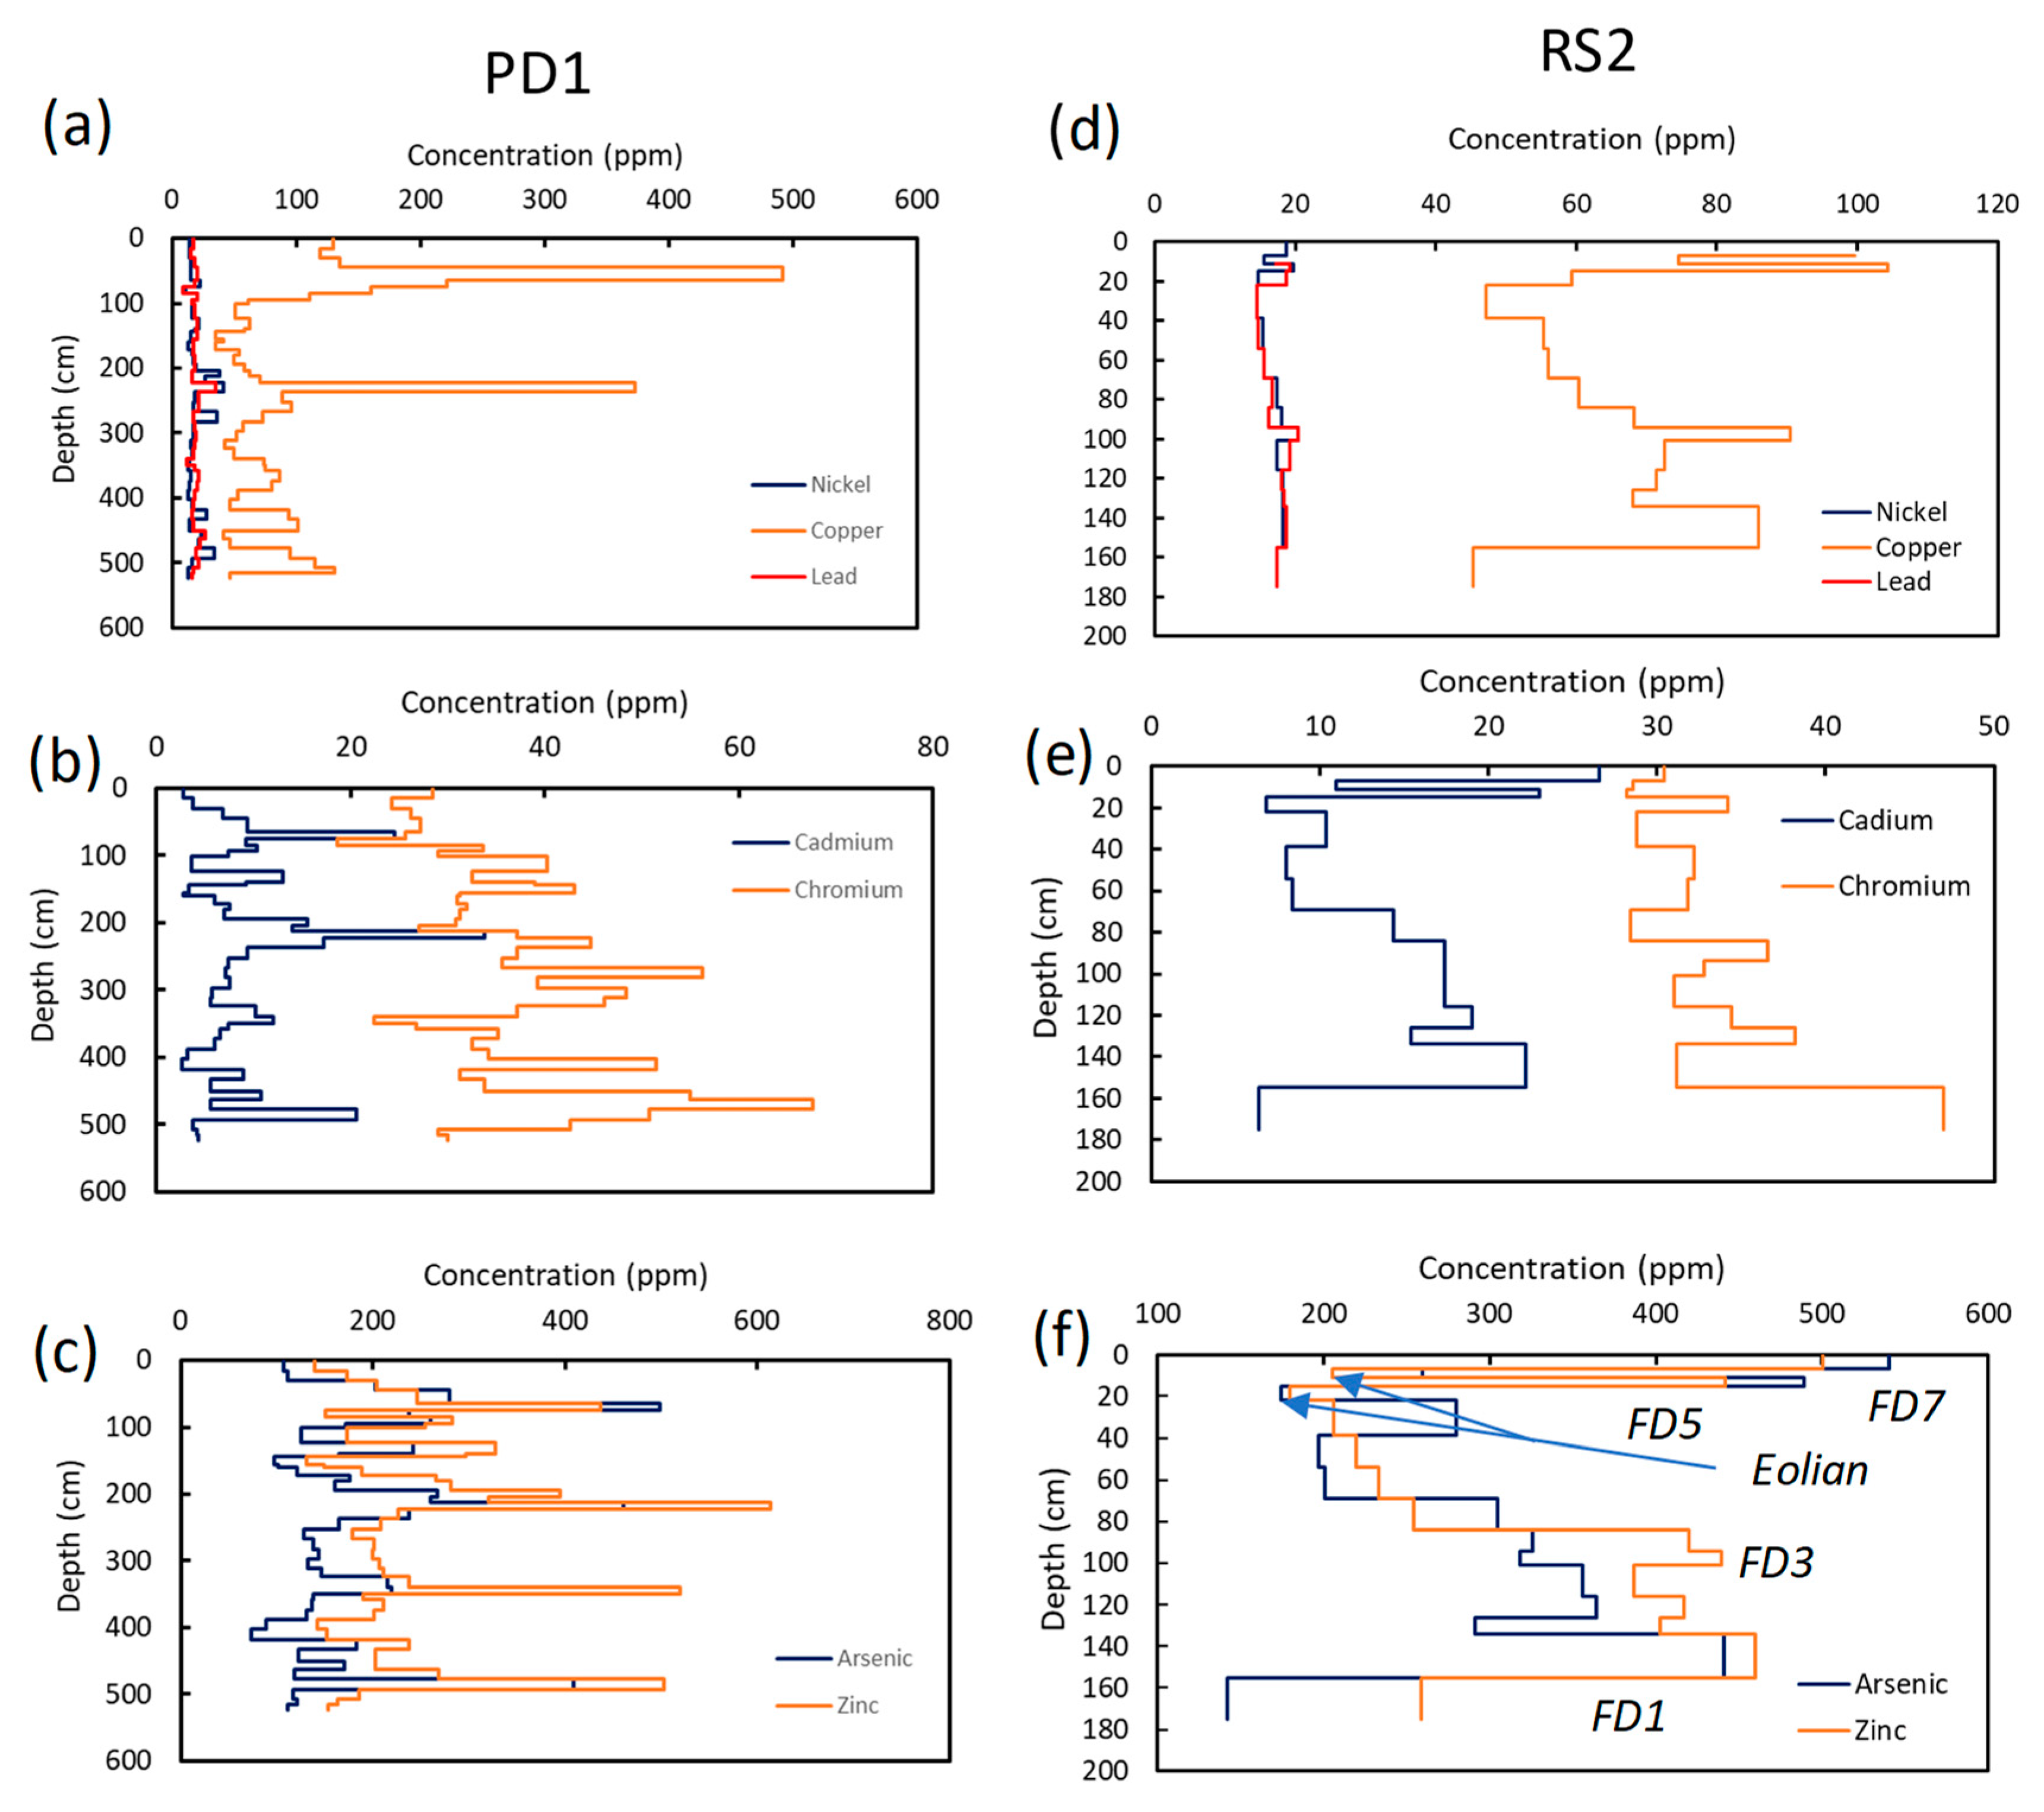
Within a stratigraphic section, concentrations of metals associated with the <63 µm sediment fraction varied between flood deposits and samples (Figure 9), illustrating that concentrations were not solely a function of the fine-grained sediment content of the materials. Moreover, concentrations did not systematically change as a function of depth within the stratigraphic sequences (see, for example, Figure 9). Arsenic, Cd, Ni, and Zn tended to co-vary within the deposits at both sites; they exhibited relatively high correlation coefficients that were statistically significant at the 0.01 level (Table 3). Chromium correlated with Ni and Pb in samples from PD (but not RS) and was inversely correlated to As and Cd at RS. Copper was highly correlated to As, Cd, Ni, Pb, and Zn within deposits at RS, but was only weakly correlated to As and Pb at PD (Table 3).

4.4. Calculation and Selection of Background Functions

With the exception of the upper most sediment layers associated with the 2001 event, the paleohydrologic and radiocarbon data suggest that the flood deposits pre-date industrialized mining operations in the basin. These deposits, then, can be used to develop background functions which relate a target element in pristine sediments to a reference element, provided that the post-depositional migration of the elements has been minimal. Post-depositional migration is most often associated with redox reactions, which are most commonly observed for Fe and Mn. In the case of the studied paleoflood deposits (see, [50,51]), there was no field evidence for reducing conditions within the deposits. Nor were there depth-specific accumulations of Fe and trace metals within the deposits suggestive of migration. The lack of migration is not surprising given the height of the deposits above the channel bed (and, thus, groundwater), and the extreme aridity of the region.
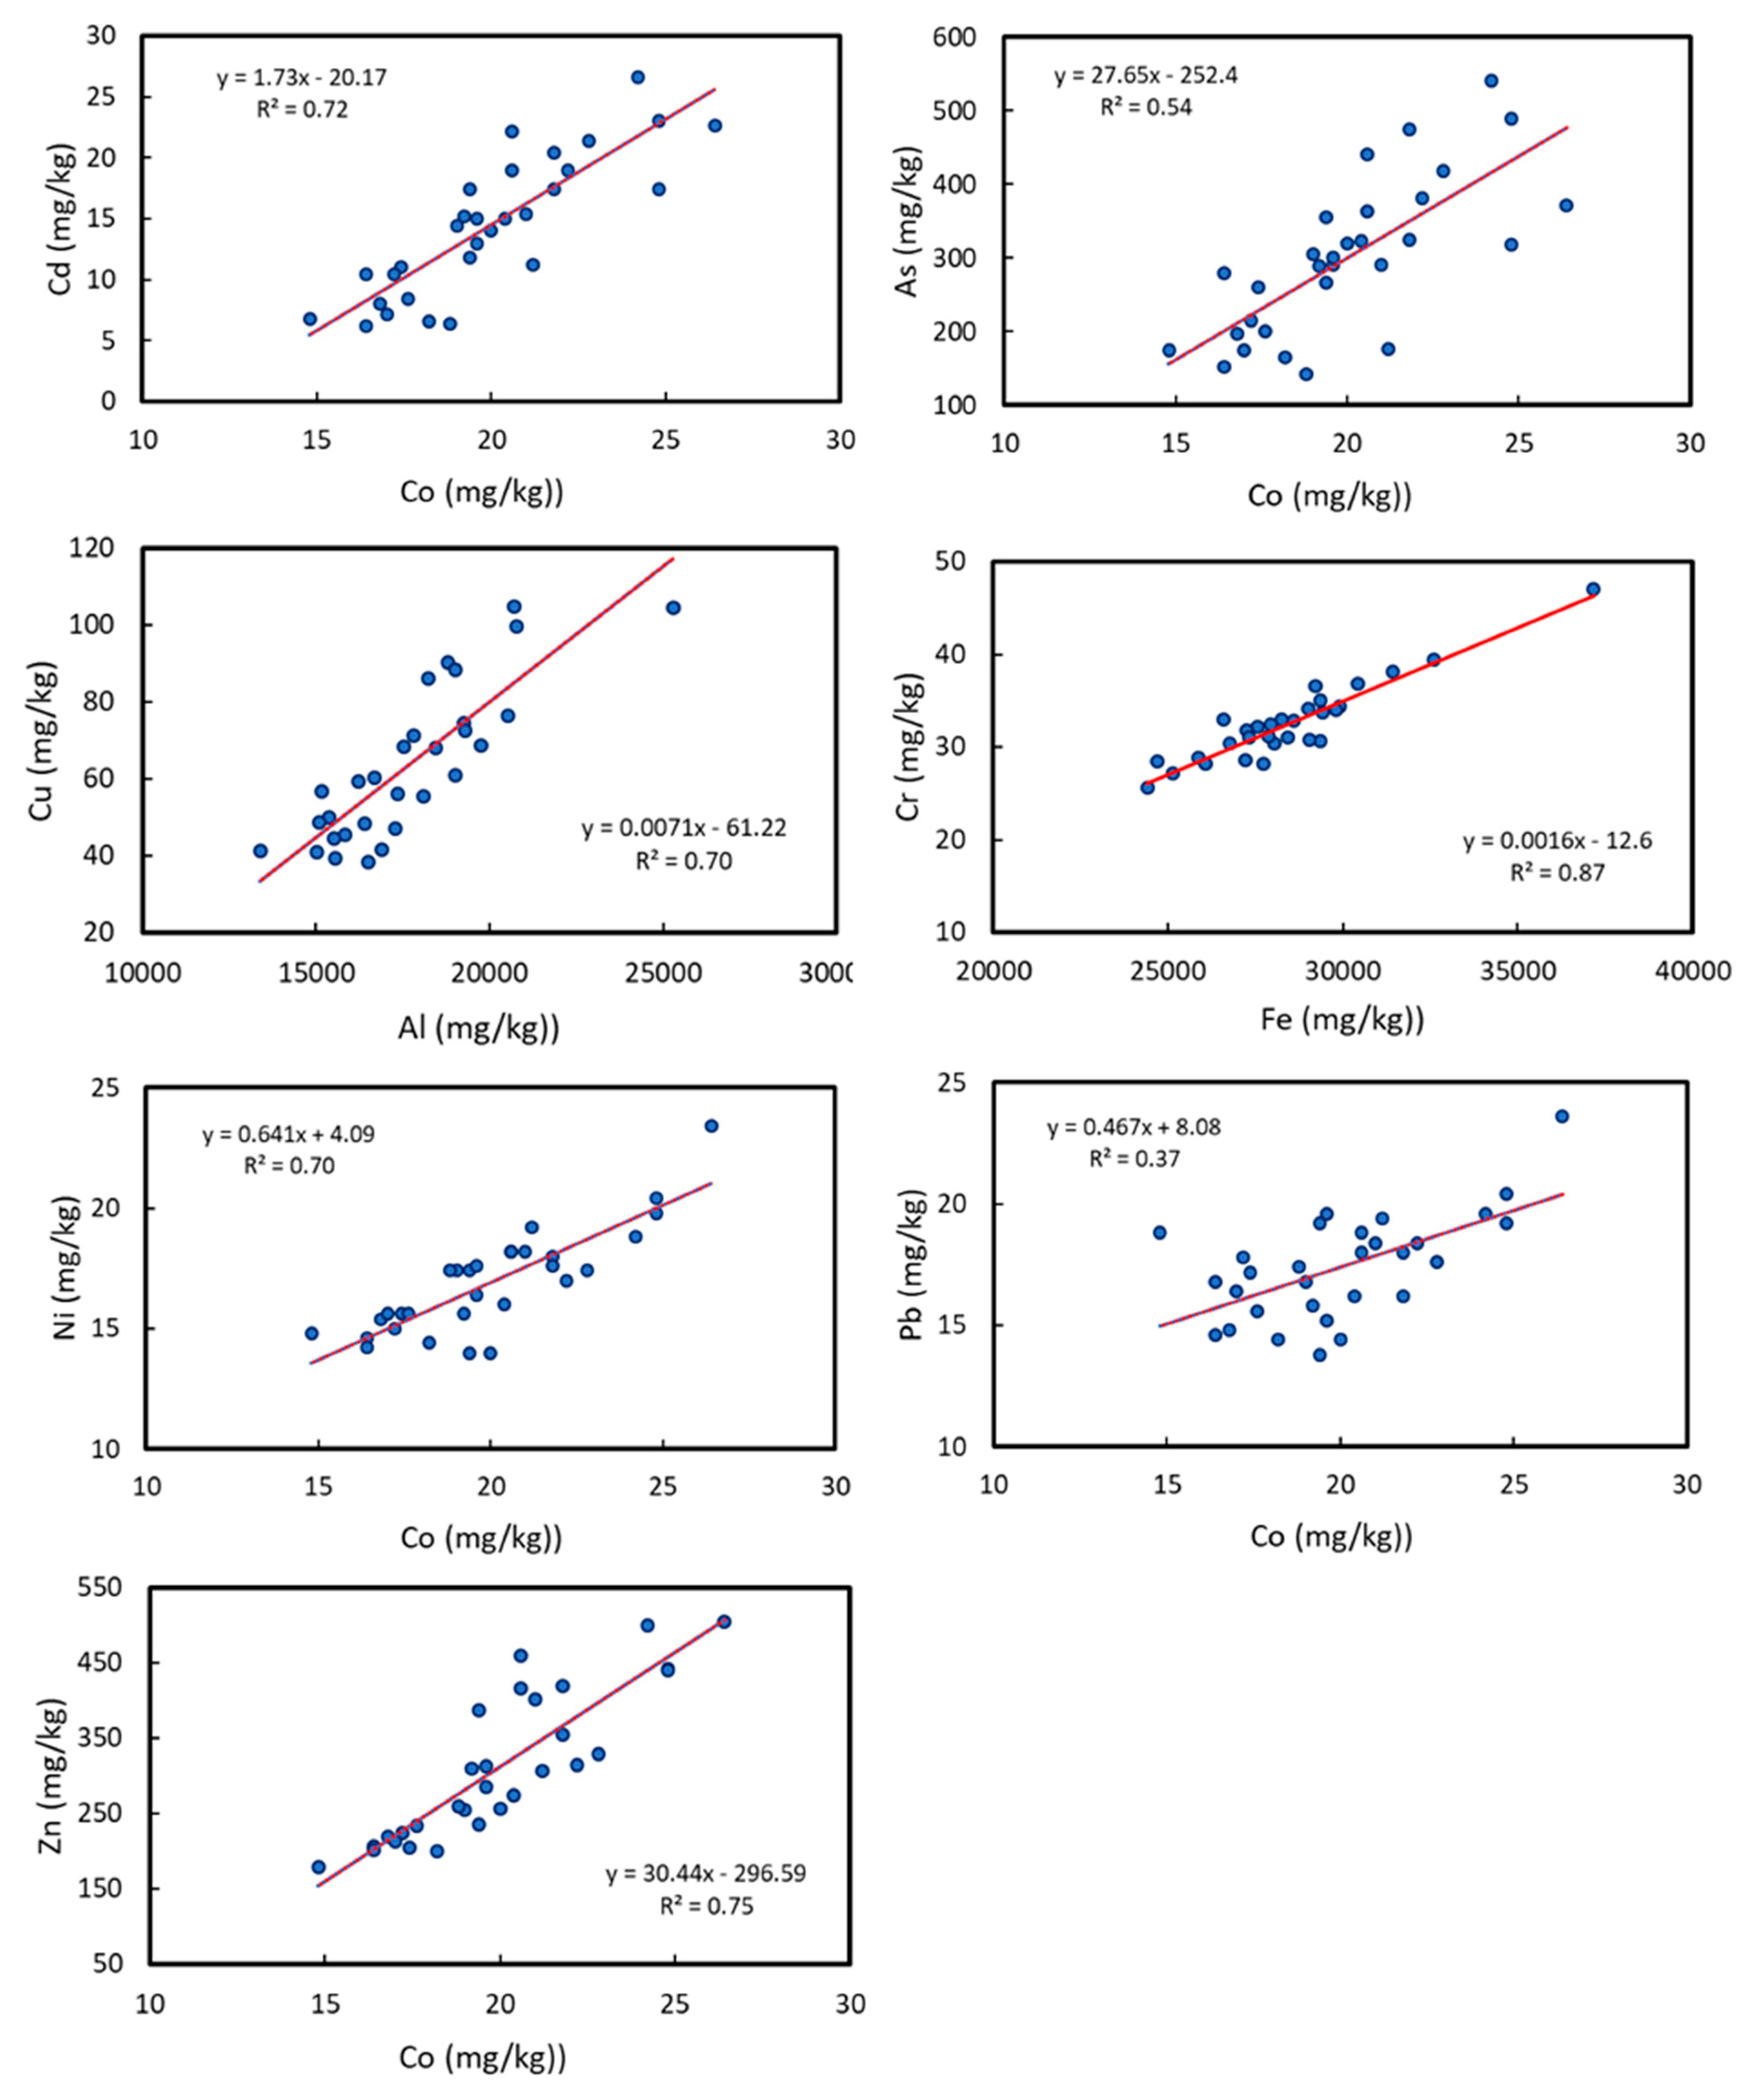
In light of the above, regression analyses between the seven trace metals analyzed for each stratigraphic section (As, Cd, Cu, Cr, Ni, Pb, and Zn) and three reference elements (Al, Fe, and Co) were conducted to develop background functions for the basin. The analyses were conducted on three datasets: (1) data from all four stratigraphic sequences located within both studied reaches (90 samples), (2) data from only reach RS (30 samples), and (3) data from only reach PD (60 samples). The decision of which reference element to use for a background function was based on the strength of the regression coefficients and whether the regressions were statistically significant at the 0.01 level. Table 4 provides the regression models that were selected for each set of data. For reach RS, Co was selected as the reference element for all trace metals except Cr and Cu. Iron was selected as the reference element for Cr; Al was selected for Cu (Figure 10). In contrast to reach RS, statistically significant regressions for Cr, Cu, and Pb could not be developed for any of the three reference elements for reach PD (Table 4). Moreover, while statistically significant, the regression coefficients between Ni and Co for both reaches were relatively low (Table 4).

4.5. Calculation and Analysis of Local Enrichment Factors

The background functions shown in Table 4 were used to calculate local enrichment factors as defined for each of the three datasets using Equation (2). For As, Cd, Ni, and Zn, there were no statistically significant differences in the enrichment factors between reaches PD and RS. LEFs could not be determined for Cr, Cu, and Pb for reach PD (and therefore the total dataset) because background functions could not be developed.
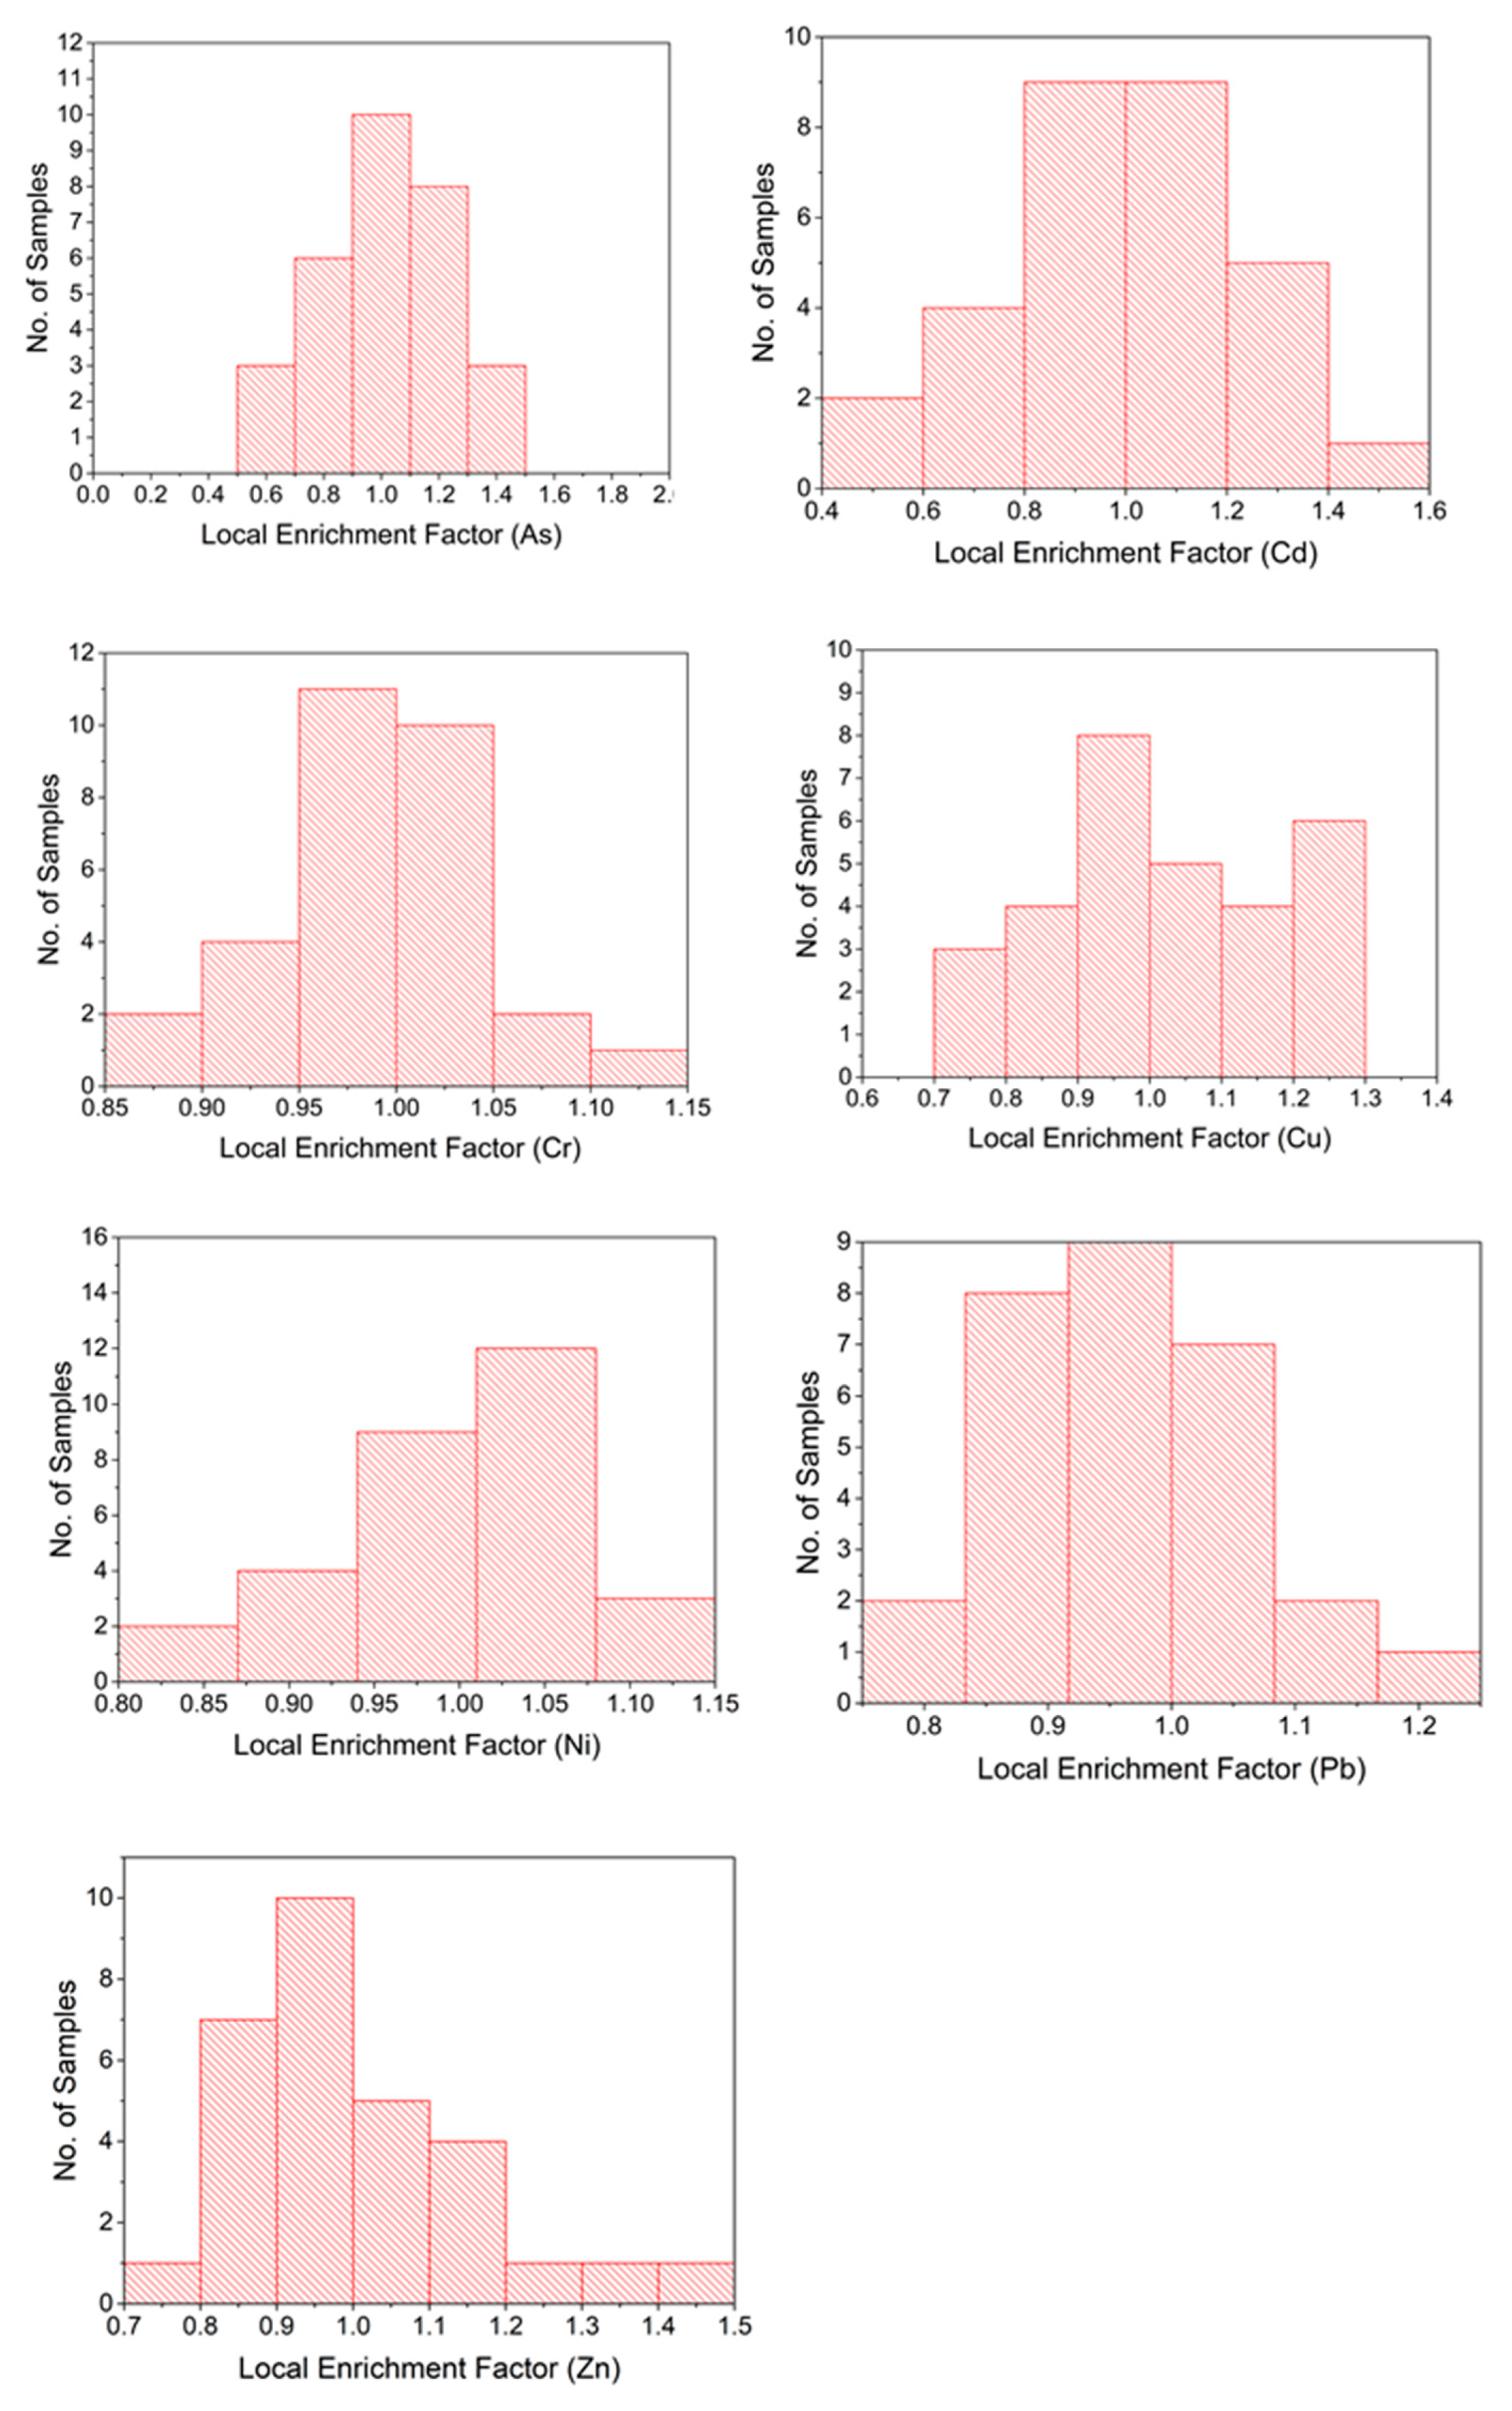
Theoretically, LEFs calculated for pristine deposits should equal 1. In general, the calculated LEFs for a given reach exhibited a relatively narrow, unimodal distribution, centered around 1 (Figure 11). The distributions for Cu and Pb are relatively flat, whereas that of Zn is slightly skewed.
The primary use of LEFs is to define sediments that are enriched (contaminated) by anthropogenic activities. A sediment sample can be defined as enriched when its LEF exceeds a statistically defined threshold. Table 4 provides the calculated thresholds at the 95 and 99% probability levels for LEFs calculated from each of the background functions.

4.6. Downstream Alluvial Deposits

Downstream of the confluence between the Rio Salado and Rio Loa the transport and deposition of sediment alternates between relatively narrow, steep bedrock controlled valleys possessing few fluvial landforms or alluvial deposits, and wide valleys containing lower gradient channels incised into thick alluvial deposits. The alluvial deposits in the areas of wide valleys are significantly more extensive and thicker than those upstream along the Rio Salado. During the 2001 flood, most of their valley floor was inundated, and Houston [26] reported widespread deposition measuring in the 10s of centimeters along these reaches. In addition, the deposits downstream of the upper Rio Loa may be contaminated by waste materials (tailings) from Cu mines located north of Calama and which released sediment-associated trace metals into the upper Rio Loa [30,32]. The alluvial deposits exposed in the scarp of the incised terrace were described and sampled along reach RL at RL1 (22°27′17.13″ S, 68°43′39.73″ W) during an earlier investigation [32]. The reach is thought to be representative of the deposits located long this part of the Rio Loa within the Calama Basin, and to reflect deposition during rare, high magnitude events.
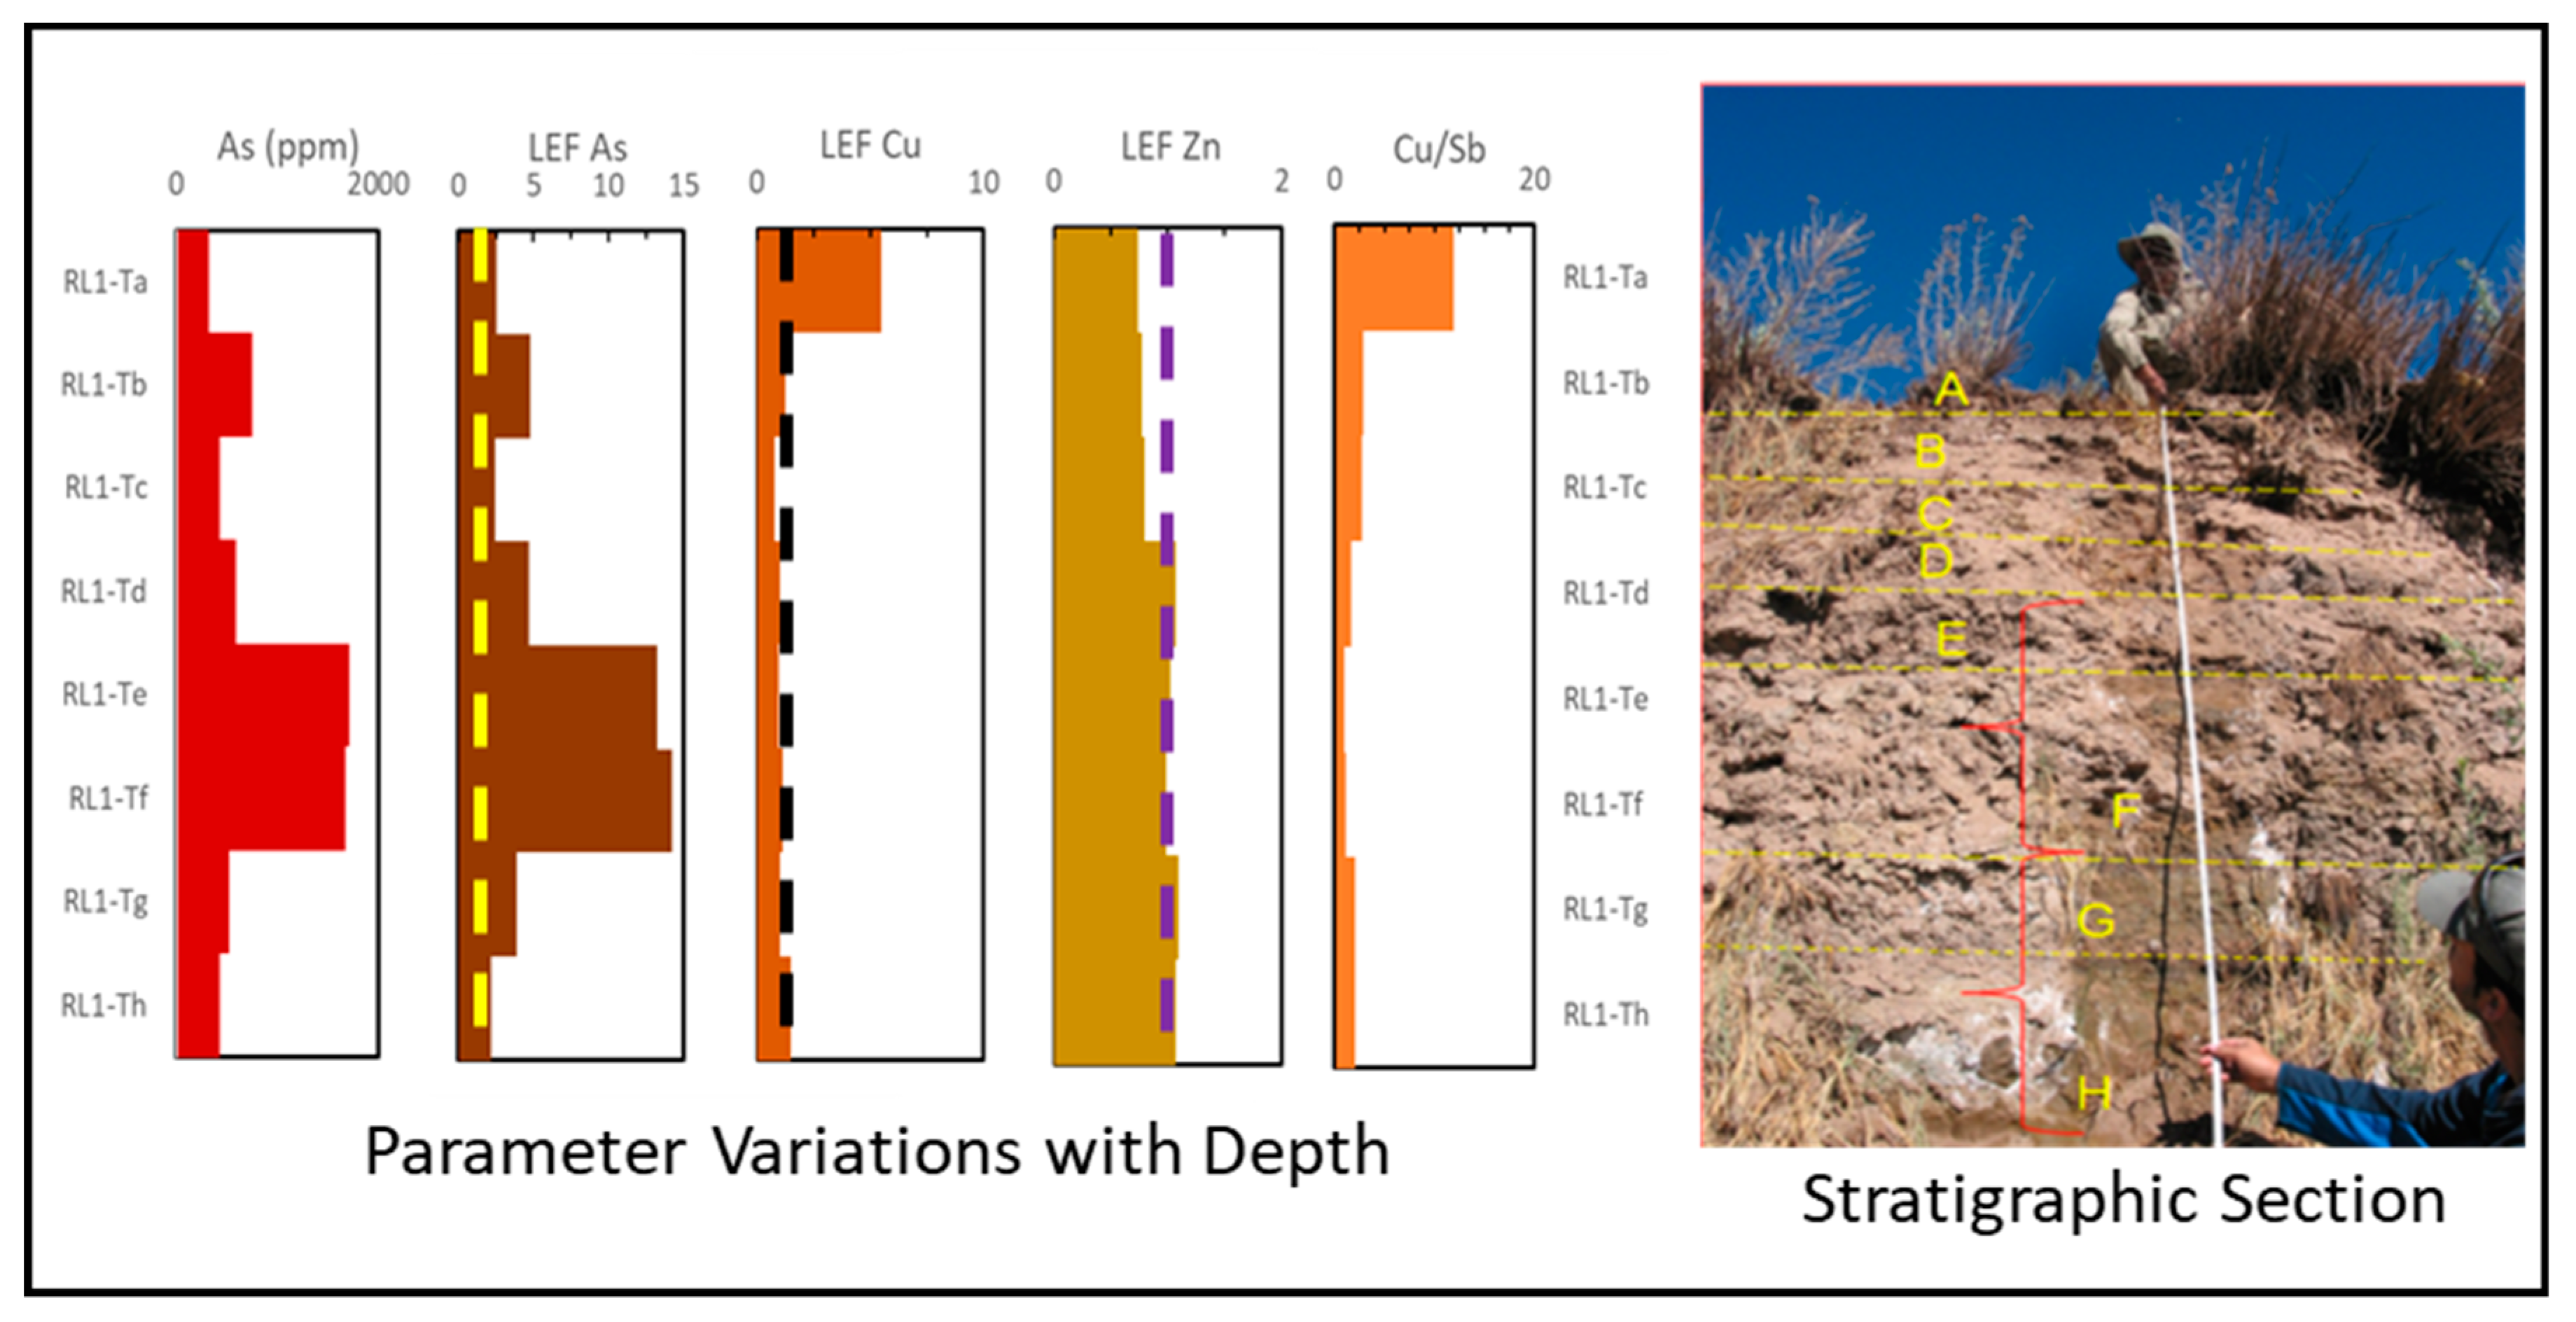
The terrace along reach RL is characterized by a laterally extensive, flat-lying, low-relief surface that forms the valley floor (Figure 1). The terrace tread rests approximately 3.7 m above the inset floodplain, and is composed of eight separate stratigraphic units, labeled on Figure 12 as A through H. Quantitative grain size data are not available for this section. However, Units A through F were dominated by loamy, silt-sized particles that become more indurated with depth. Unit G is dominated by silt that becomes more organic rich with depth, whereas Unit H is a paleo-soil composed of interlayered loam and fine sand-sized particles.
Geochemically, the concentrations of As were consistently high, and ranged between 330–1713 mg/kg (Table 5). Copper values were also elevated at the site in the upper two units, leading to relatively high Cu/Sb ratios (Figure 12). LEF values were calculated using the background functions developed for reach RS. Significantly, the LEFs calculated for Unit H, a buried soil (paleosol) that pre-dates local mining, for all seven elements were close to the 99% threshold calculated using the data from reach RS. Both As and Cu exhibited significant enrichment (Figure 12). In the case of As, enrichment occurred in Units E and F, reaching values of nearly 15. The upper most units (A-C), presumed to be associated with more recent floods including the 2001 event, were only slightly enriched (Figure 12). Copper was only enriched in the upper most Unit (A). Zinc, Cd, Cr, and Ni exhibited only minor enrichment or depletion throughout the profile (Figure 12, data for Cd, Cr, and Ni not shown).

5. Discussion

5.1. Sedimentologic, Hydrologic and Source Controls on Metal Concentrations

The paleoflood sediments located along reaches PD and RS were deposited in differing hydrologic environments. At PD, deposition occurred in zones of rapidly changing downstream flow velocities created by alterations in the dimensions and slope of the bedrock controlled valleys (Figure 2 and Figure 3). While a flood frequency analysis was not conducted for reach PD, comparison of the range of depositing flows between reach PD and RS suggest that the deposits were associated with floods possessing recurrence intervals measured in decades, and, with the exception of the surface sediments associated with the 2001 event, were deposited over a period dating back several hundreds of years, thereby pre-dating modern mining activities.
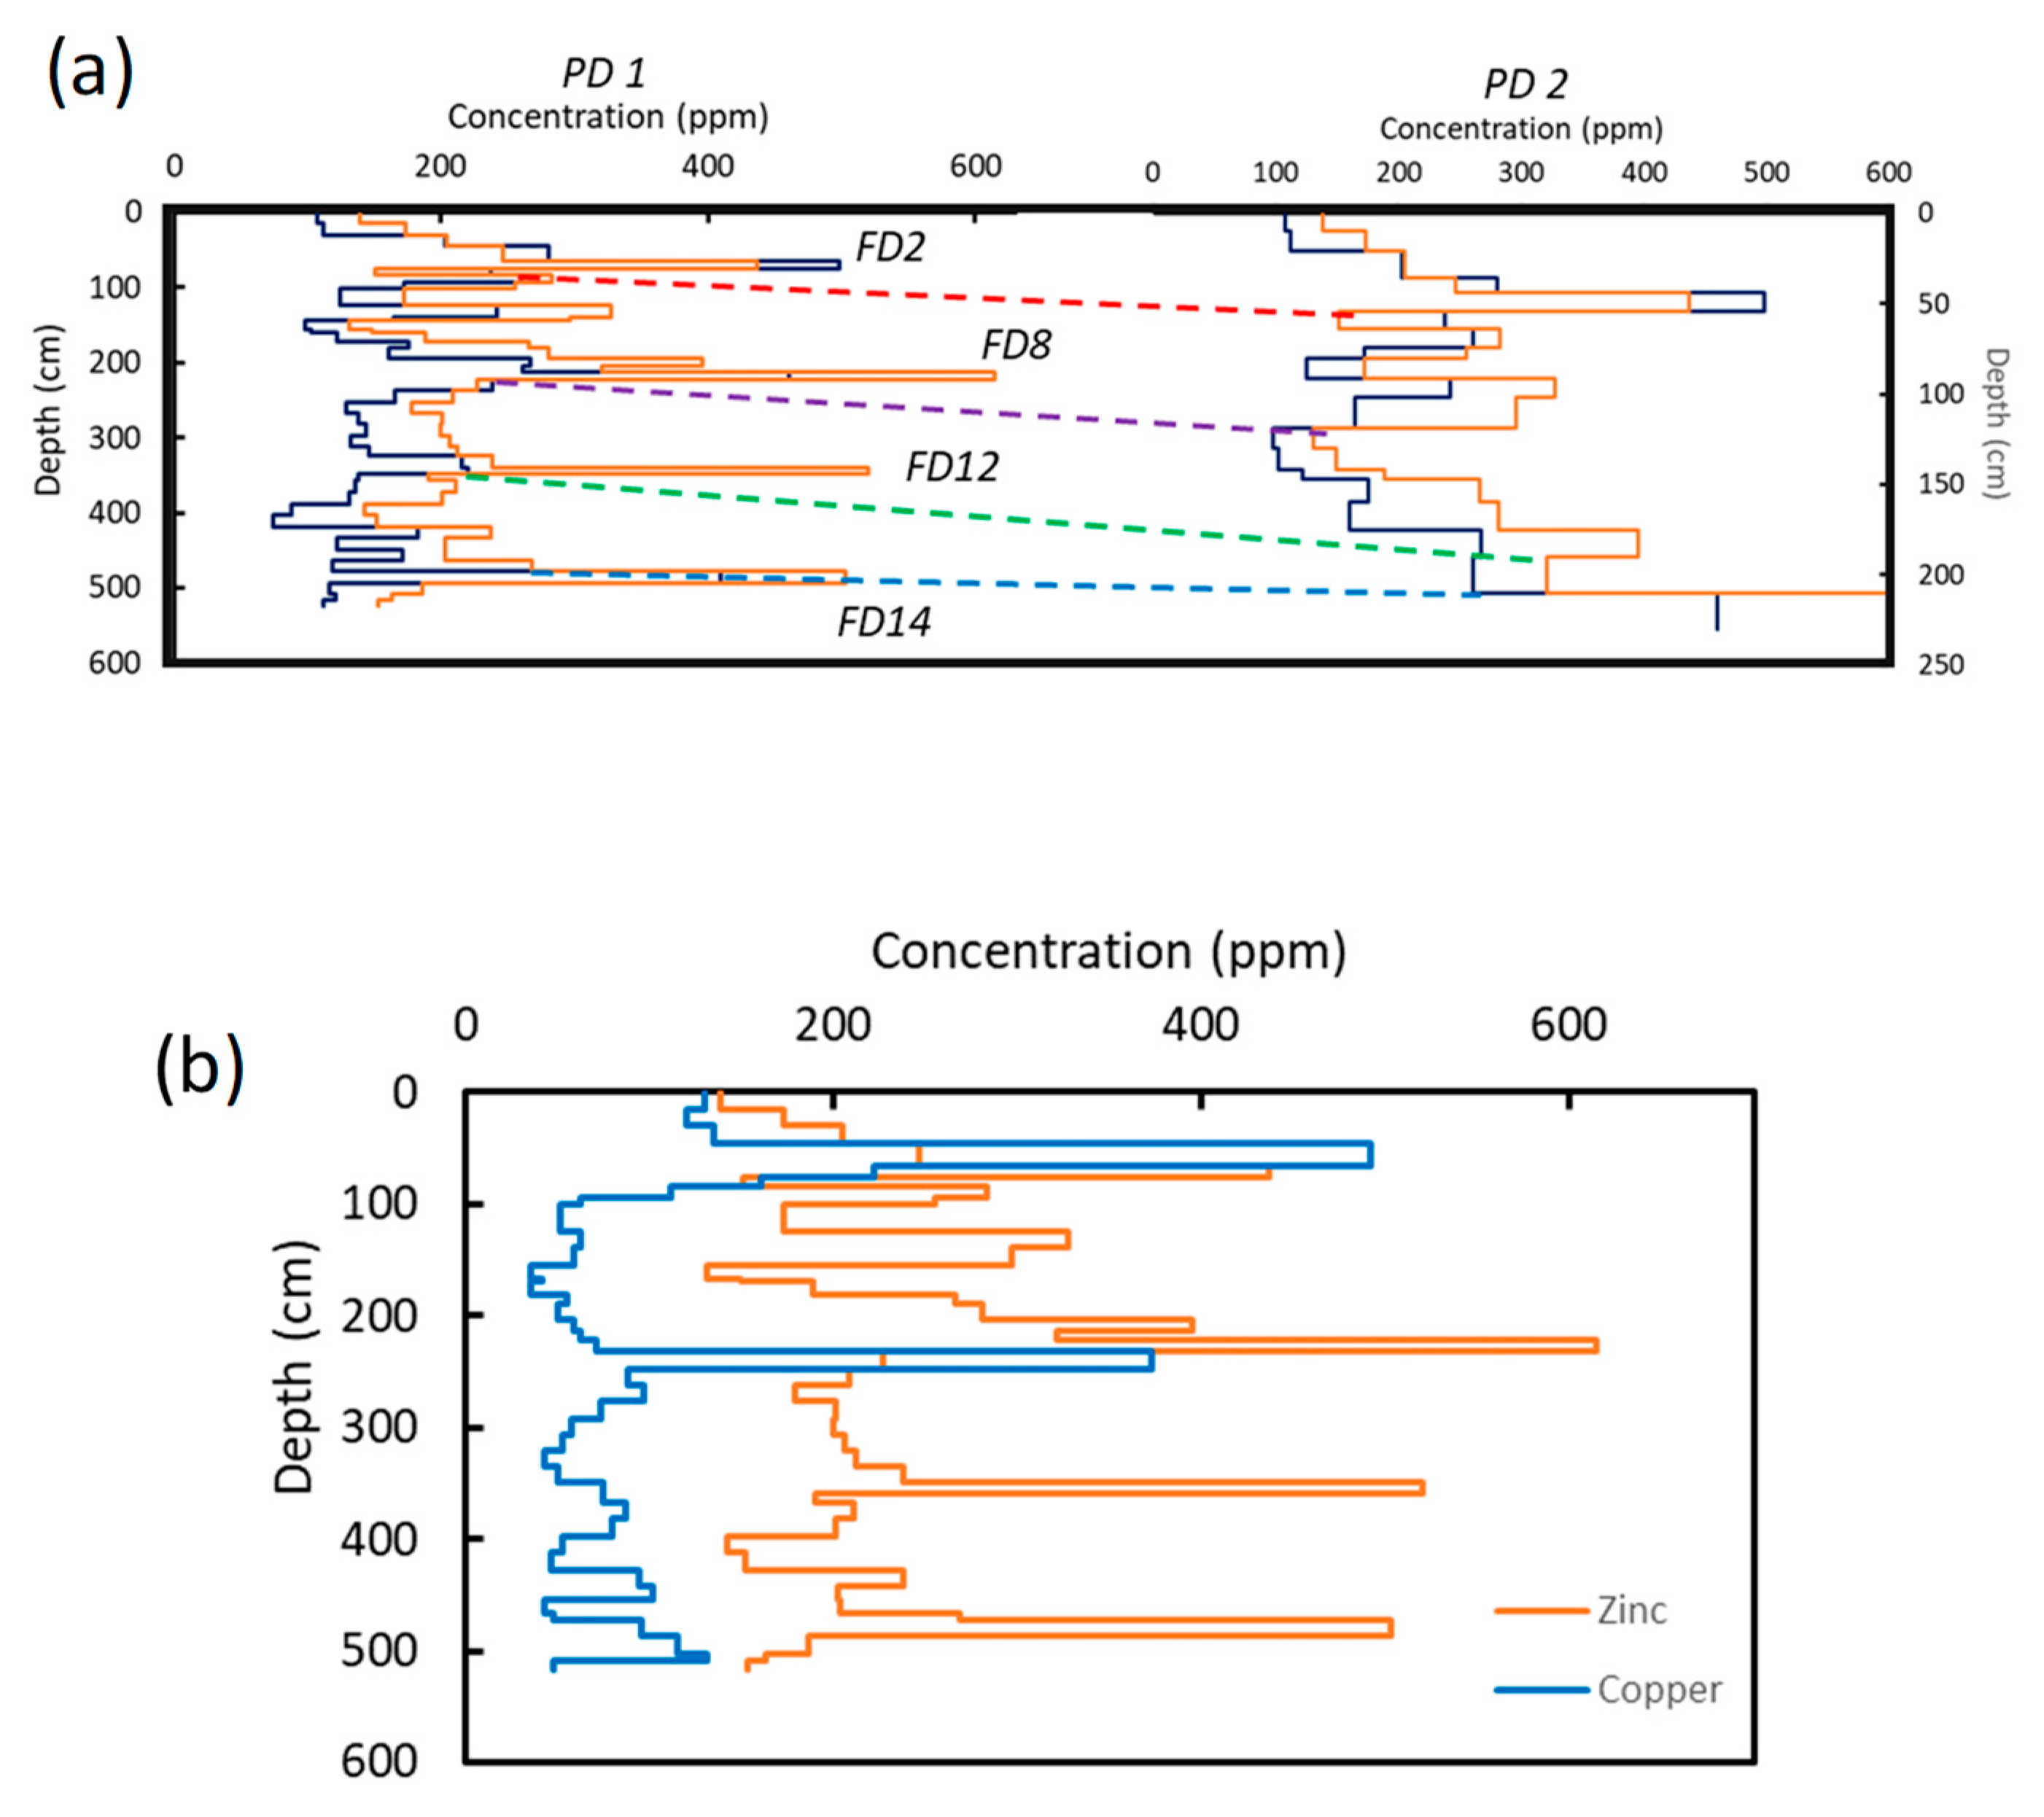
Deposits at both PD1 and PD2 exhibited significant interlayer variations in grain size, and a pronounced upward increase in sand content (Figure 4). The cause of the increase in sand in the upper, and therefore, younger deposits is unclear, but may be related to increases in the velocity of the flows required to deposit sediments on a progressively higher surface (the change in elevation from the bottom to the top of the stratigraphic sequence was approximately 2.5 and 4 m at PD1 and PD2, respectively). To alleviate the potential influence of grain size on metal concentrations, metal content was determined on only the fine-grained (<63 µm) sediment fraction, which was hypothesized to be the chemically reactive sediment [13,52]. The trace metal concentrations within the fine-grained sediments varied widely between and within the flood deposits. The most conspicuous variations were associated with periodic spikes in metal content that exceed the concentrations in sediments above and below the unit by a factor of 2 to 3 (Figure 9). In some cases, such as for As and Zn in FD8 at PD1 (Figure 9c), the spike is associated with the entire flood deposit. In other instances, such as for FD12, concentrations were associated with a specific interval of deposition within the flood deposit. In both instances, the variations in metal content are associated with only the fine-grained sediment, indicating that factors other than grain size and particle surface area are controlling metal concentrations.
The concentrations of As, Cd, Zn and, to a lesser degree, Cu and Ni were correlated within the deposits at PD (Table 3); statistically significant, but relatively weak, correlations were also observed between Ni, Cr, and Pb. Such correlations between metals are often used as an indicator of the behavior and source of the metals in river systems [53,54]. With regards to the former, Cu was positively correlated to the organic matter (C) content of the sediment (Table 3), suggesting that it was at least partially associated with (sorbed to) chemically reactive, decomposed organic substances within the deposits. In contrast, Cr was negatively correlated to C content. However, a comparison of the depth variations in C content (Figure 4) to Cu and Cr (Figure 9) shows that the spikes in metal concentrations cannot be fully explained by variations in organic matter.
Given that the observed vertical/temporal variations in metal concentration are not strongly related to changes in either grain size or C content, the variations are likely to reflect mineralogical differences in the sampled sediments, which have yet to quantitatively documented. Such differences may have been created by two processes. First, the trace metal content, and composition of the sediments, are known to depend on the transport and depositional regime of the site [9,46], which vary as a function of flood magnitude. Thus, the observed spikes in concentration may reflect differences in the magnitude of the depositing floods and how they affect the composition of the sediment that can be transported and deposited given the local morphologic characteristics of the channel. A second, and more likely, driver of changing sediment composition is a change in sediment source. This is supported by general similarities in the vertical pattern in the changes in metal concentrations between the deposits at PD1 and PD2 (Figure 13). In fact, while the deposits at the two sites differ considerably in thickness, and therefore depositional regime, the deposits can be correlated on the basis of metal concentrations between PD1 and PD2 (Figure 13). The ability to do so suggests that chemostratigraphic methods may serve as a valuable tool to correlate flood deposits along a given reach of the drainage network.
Interestingly, spikes in As, Cd, Ni and Zn do not correlate with spikes in Cu (Figure 13b), nor do the spikes in these metals correlate with spikes in Cr and Pb (Figure 9). Assuming that the trends represent changes in sediment source, it appears that three predominant bedrock sources occur in the basin, including rocks elevated in concentrations of As, Cd, Ni, and Zn, rocks elevated in Cu, and rocks elevated in Ni, Pb, and Cr.
The paleoflood sediments examined and sampled along reach RS represent classic slackwater sediments as described by Kochel and Baker [35], Baker et al. [37]; Baker [38], and O’Connor and Webb [39]. They are characterized by fine-grained, loamy sediments deposited in a zone of backwater flow at the mouth of a small-tributary (RS1) and within an alcove cut in the bedrock of the valley wall (RS2) (Figure 5). Hydrologically, modeled water surface profiles were more uniform than along PD, reflecting the wider dimensions and less variable nature of the entrenched canyon’s width and slope. Moreover, variations in the grain size and organic matter content of the slackwater deposits at RS were less than those observed along reach PD (Figure 4). One of the most notable differences between the deposits at RS and PD is the organic matter content of the deposits; the C content of the deposits was significantly lower at RS (Table 2).
With regards to trace metals, concentrations were more uniformly distributed within a given flood deposit, and abrupt changes (spikes) in concentration were more subdued than observed along reach PD (Figure 9). As was the case at PD1, the flood deposit sampled and analyzed at RS1 and RS2 could be correlated on the basis of sediment geochemistry [44]. For example, FD3 at RS2 was geochemically similar to deposit FD9 at RS1, indicating that they may be temporally related. This correlation is supported by a correlation in modeled water surface elevations and the radiocarbon dating of organic materials at FD3 and FD9 which yielded overlapping ages of 350 ± 30 and 390 ± 30 YBP, respectively.
Between reaches, the concentrations of As, Cd, and Zn, which were statistically correlated, exhibited significantly higher concentrations at RS than at PD. The concentrations of Cu, Cr, Ni, and Pb between reaches RS and PD were statistically similar (Figure 8). Moreover, a comparison of the vertical variations in metal concentrations between RS2 and PD1 (Figure 9), shows that flood deposits cannot be correlated between PD and RS on the basis of sediment geochemistry [44]. We attribute these differences in the vertical patterns in concentration, both at a site and between sites, to variations in sediment source during the floods. Differences between sites RS and PD most likely result from the influx of sediment from a major tributary, El Loa, which drains a volcanic area, and enters the axial channel between the two sites (Figure 1). Field observations revealed that El Loa is characterized by large-scale channel bars and alluvial deposits indicative of large sediment loads. Such alluvial deposits were absent along the axial channel of the Rio Salado at both RS and PD, suggesting that the El Loa provides a significant portion of the sediment to the lower reaches of the Rio Salado, including reach RS. These sediments presumably exhibited higher concentrations of As, Cd, and Zn. In addition, the lack of significant sediment storage along the Rio Salado upstream of reach PD would have limited the reworking of previously deposited sediments along the incised channel, and the geochemical homogenization of the sediment between flood deposits at PD.
Spatial differences in metal concentrations between and within a given location may also be due to variations in the hydrologic drivers of the depositing floods. A number of studies in southern and coastal Peru have examined the linkages between flood deposits and the El Niño Southern Oscillation (ENSO) (see Keefer et al. [55] for a review). Although the hydroclimatology of the Atacama Desert is complex, there appears to be a strong correlation between flood deposits and ENSO related events [27]. During the El Niño phase, the strength of the Bolivian High decreases and shifts southward, weakening easterly winds that transport moisture onto the Altiplano. Thus, the western Cordillera and the western flank of the Andes are characterized by relatively dry conditions during El Niño events. However, rainfall from Pacific frontal storms can penetrate inland, and produce floods within higher elevation axial drainages, and low- to moderate-elevation ephemeral tributaries. An extreme, El Niño-related event that occurred in 1607 has been described in historical documents for the region [56], and was identified in paleoflood deposits examined along the coast of Peru [55,57] and along the northern Atacama of southern Peru [56]. Interestingly, the date of this event falls within the main mode (95% probability) of the calibrated ages for flood deposits FD9 and FD3 along reach RS, suggesting they were also deposited by this event. Thus, the geochemistry of these deposits would reflect the influx of sediment to the Rio Salado from lower-elevation bedrock units.
In contrast, during La Niña episodes large rainfall events sourced from the east occur over the Altiplano and the western flank of the Andes, and cause large-scale flooding along axial channels. Lower elevation channel systems are not affected by these precipitation events. The 2001 event that inundated the city of Calama, and caused extensive channel bed and bank erosion, particularly within the upper and middle reaches of the drainage system, was associated with a La Niña episode [26]. Thus, flooding, and sediment geochemistry within the Rio Salado-Rio Loa system appears to be consistent with the argument put forth by Magilligan et al. [27]. They argued that the paleoflood records for the past ~20k years within the main stream and tributary sections of the Rio Moquegua, located along the northern fringes of the Atacama, differed because the tributaries recorded only El Niño events whereas the axial channels recorded both El Niño and La Niña events. The point is that differences in the flood generating mechanisms may have produced major differences in the primary source of the sediments and trace metals transported into and along the axial drainage system of the Rio Salado-Rio Loa system.

5.2. Use of Paleoflood Deposits to Calculate Background Functions

The differentiation between natural and anthropogenic contributions of trace metals to riverine sediments has proven to be a challenge, particularly in basins with mining activity, such as the Rio Loa, where mineralized rocks can make it difficult to decipher the impacts of human activities on sediment quality. Herein, we explored the use of paleoflood deposits within the Rio Salado basin to create background functions between trace metals and three conservative elements: Al, Fe, and Co. With the exception of the surface materials that were inundated by the 2001 event, the delineated flood deposits predate historic mining within the area, and are therefore considered to be devoid of anthropogenic metal inputs.
As noted by Wang et al. [58], care must be taken when selecting the most appropriate normalizer for background functions. Loring [59] argued that utilized normalizers (reference elements) should be a primary constituent of the trace metal carriers in the sediment and reflect the granulometric variations in the samples. Moreover, their concentration should be easy to precisely determine, should not be associated with anthropogenic influences, and should exhibit negligible post-depositional migration within the deposits. As an important constituent of aluminosilicate minerals, Al exhibits all of the above traits, and is frequently used as a normalizer in the calculation of enrichment factors [15,58,60]. Iron has also been widely used where evidence of anaerobic conditions that promote redox reactions, and which lead to metal mobility, are lacking (as is the case here) [58,61,62]. Cobalt has been less frequently used, but Sakan et al. [14] argued that it should be considered as a normalizer in areas where there is no “substantial anthropogenic contributions” to the sediments. This argument is based, in part, on the fact that Co is generally associated with (sorbed to) silicate and clay minerals [63] and, in many instances, is not associated with anthropogenic contamination. Moreover, it is expected to behave in river systems in a manner similar to anthropogenically derived trace metals [12].
Aluminum, Fe, and Co all satisfied the above criteria for a potential normalizer. Thus, selection of the most appropriate background function was based on the strength of the regression coefficients. Along both reaches PD and RS, statistically significant (p = 0.01) background functions for As, Cd, Ni, and Zn were created using Co (Table 4). Statistically significant regressions did not exist for any of three normalizers and Cu, Cr, and Pb for reach PD. However, for reach RS, Fe was correlated to Cr, and Al to Cu, and used for the background functions. The inability to define background functions using Al, Fe and other normalizers has been attributed in previous studies to the occurrence of specific constituents which affect metal concentrations within the sediments or soils. For example, statistically insignificant correlations between Al and selected trace metals may be produced by organic matter, either because non-reactive autochthonous organic matter dilutes elemental concentrations [12], or because reactive organic matter serves as a primary carrier of trace metals [59]. The C content of the deposits at PD is significantly higher (p = 0.01) than at RS (Table 2). Moreover, while the C content of the deposits is only weakly correlated to Cu and Cr at PD, significant positive correlations occur between the C content of the deposits and As, Cd, Cu, and Zn at RS. Hypothetically, these significant correlations at RS would reduce the correlation between metal concentrations and Al, Fe, and Co. However, it is along reach RS that significant correlations between the normalizers and Cu, Cr, and Pb exist. Thus, differences in the organic matter content of the deposits between the two reaches cannot explain the inability to develop background functions using Al, Fe, or Co.
Previous investigators have also argued that the inclusion of variable amounts of constituents other than C can hinder the development of background functions, including feldspar, sulfidic minerals or phases, and mafic minerals [62,64,65,66]. The direct influence of these constituents along the Rio Salado would require a detailed mineralogical analysis of the deposits, which has yet to be completed. However, it is important to note that the sedimentological and elemental composition of the deposits are more variable along reach PD; the sequence includes thin (5–15 cm) layers of sediment highly enriched in trace metals (e.g., As, Cd, Cu, Zn), which may be related to their sulfide or mafic mineral content. Qualitative petrographic observations suggest that sediments associated with these deposits are less mature than those at RS, containing abundant feldspars and a host of mafic minerals. The more uniform sedimentology of the deposits at RS may be related to the reaches’ more uniform hydrologic characteristics. Perhaps more importantly, however, the El Loa drainage basin, a tributary that enters the axial channel of the Rio Salado between PD and RS, is characterized by large alluvial terraces and channel deposits suggestive of large sediment transport rates. In contrast, the narrow, bedrock controlled trench of the Rio Salado upstream of the El Loa has little room for sediment storage, and lacks evidence for significant downstream sediment transport. Thus, it appears that reach RS is dominated by sediment derived from the tributary basin of the El Loa. This downstream change in the predominant source of sediment to the Rio Salado presumably resulted in the observed change in As, Cd, and Zn concentrations between the two reaches. It may also have inhibited the correlation of paleoflood deposits between reach PD and RS on the basis of deposit geochemistry.
An important, but often overlooked question in the analysis of sediments for trace metals is what type of acid digestion should be used? Matys Grygar and Popelka [12] argue against the use of “pseudo-total” analyses for the calculation of background functions as they leave some primary minerals in the solid residue. Their argument is based on (1) a considerable portion of the target and reference elements may not be determined by the analysis, particularly in mineralogically immature sediments (e.g., along the Rio Salado-Rio Loa system), and (2) trace metal concentrations determined by pseudo-total analyses cannot be directly compared to upper continental crustal or other global averages. We agree that if the only purpose of the geochemical analyses is to separate natural from anthropogenic enrichment, then a total analysis, often conducted using HF, is most appropriate. However, geochemical data collected for environmental studies is likely to be used for a variety of other purposes, including the assessment of the potential impacts of toxic trace metals on ecological and human health. Total digestions are poorly suited for this purpose because the measured concentrations include metals locked in the crystalline structure of the analyzed minerals that are not bioavailable. As a result, most environmental assessments, including those conducted by many regulatory agencies, rely on pseudo-total (also referred to as partial) analyses, particular the use of aqua regia (a combination of HNO3 and HCL) (see, for example, USEPA Method 200.7). Moreover, data obtained by total digestions cannot be compared to many guideline values used to assess potential environmental impacts of trace meals on aquatic biota (e.g., MacDonald et al. [29]).
In the case of reach PD, the inability to develop statistically significant correlations between the three normalizers (Al, Fe, and Cu), and Cr, Cu, and Pb may not only be due to the relatively immature nature of the sediments, but to the use of a pseudo-total (partial) digestion, which failed to fully characterize the Al and Fe contents of the deposits. The use of a partial digestion in this study may also explain why Co was found to be the most effective normalizer at both PD and RS. It can, in fact, be argued that Al and Fe should not be used as normalizers for immature deposits when total digestions have not been applied. In such areas, then, we are left with the need to conduct total digestions on deposits for the differentiation of elemental sources (as suggested by [12]), and partial or sequential digestions for more environmentally (toxicologically) related studies.

5.3. Calculated Local Enrichment Factors

The background functions shown in Table 4 were used to calculate LEFs using Equation (2). Given that the LEFs were calculated using data from the paleoflood deposits that were assumed to represent background materials, the values should theoretically equal 1. LEFs were not generated for Cr, Cu, or Pb at PD as background functions could not be developed for these elements at that site. The calculated LEFs for a specific metal at both RS and PD exhibited narrow distributions with modes centered at or close to 1. At RS, where LEFs could be calculated for all seven trace metals, variations from 1 were most pronounced for Cr, Pb, and Ni, which exhibited background functions with relatively weak regression coefficients (Figure 11). While differences in the concentrations and background functions occurred between PD and RS for As, Cd, Ni, and Zn, the calculated LEFs exhibited only minor variations in their overall distribution, none of which were statistically different between sites (p = 0.01). The obtained data indicate that the paleoflood deposits could be used to effectively define natural concentrations of sediment-associated trace metals within alluvial deposits of the Rio Salado-Rio Loa system.

5.4. Application of LEF Thresholds to Downstream Alluvial Deposits

The combined effects of high concentrations of metals from natural sources and the wide spread flooding and sediment deposition during extreme events along the Rio Loa, has hindered the differentiation of natural and human related trace metals within the basin’s valley fill. For example, at site RL1, located along the Rio Loa east of Calama (Figure 1), eight alluvial deposits were delineated within an alluvial terrace (Figure 12). The deposits, which occurred at a height of 1 to 3 m above the modern channel bed, were interpreted to represent deposition during high magnitude events similar to that which occurred in 2001. They were then exposed during a more recent phase of channel incision. Trace metal concentrations within the deposits were elevated above those typically associated with background materials [32]. The sediment-associated As concentrations, for example, exceeded 1700 mg/kg in bulk (<2 mm) sediment [32]. Typical background values associated with continental rocks range between about 2 and 13 mg/kg [8]. The question, then, is whether the concentrations of As and the other metals represent the naturally high values associated with the basin’s mineralized rocks and the El Tatio Geyser basin, or whether the deposits were contaminated by one or more of the Cu mines.
The LEFs for the alluvial sediments located within the valley filled deposits at site RL1 are shown in Figure 12. These values were then compared to the 99% LEF thresholds defined for the paleoflood deposits at RS. Data from RS were used because (1) the LEF values were not statistically different between the two reaches PD and RS, and (2) the sediment geochemistry at RS reflects the large influx of sediment from El Loa, which is likely to provide a majority of the sediment to reach RL1. In addition, the thresholds defined for As, Cd, Ni, and Zn at RS tended to be lower than those obtained for PD (Table 4). Thus, using data from RS provided a more conservative view of enrichment by human induced sources.
Figure 12 shows that considerable variability in enrichment exists between the seven analyzed metals. Arsenic exhibited considerable enrichment in all eight of the stratigraphic units delineated at the site (RL1). In contrast, Cu was enriched in the upper most (surficial) unit. Cadmium, Cr, and Pb exhibited values less than 1.2 throughout the entire profile; LEF values for Ni never exceeded 1.95. Enrichment, then, was minimal except for As and Cu (for comparison, Acevedo-Figueroa et al. [67] argued that enrichment factors below 3 were characteristic of materials exhibiting only minor enrichment).
It was not surprising that the LEF values calculated for Cd, Cr, Pb and Ni showed little or no enrichment. Previously collected geochemical data found that their concentrations were relatively low, and below aquatic threshold criteria put forth by MacDonald et al. [29] within sediments from the channel bed of the Rio Loa downstream of the Upper Rio Loa-Rio Salado confluence, and tributaries draining the mine sites (Table 1) [32]. In contrast, Cu was found to be elevated in the Rio Loa and its mine-affected tributaries. Given that the surface of the deposits at site RL1 was inundated during the 2001 event, these sediments were expected to be enriched in mining related Cu. It is also interesting that the vertical distribution of the LEF is similar to that exhibited by the Cu/Sb ratio. Wilson [32] argued that the Cu/Sb ratio represented an effective tracer for determining the contribution of mining versus naturally derived sediment because Cu was highly enriched in the local mine tailings, but relatively low within sediments from El Tatio and the Rio Salado. In contrast, Sb was highly enriched in sediments from El Tatio, but limited in mine tailings.
The LEF values calculated for As at RL1 suggest that As is enriched throughout the stratigraphic sequence, and reflect As concentrations that were extremely high (Figure 12). The cause for this enrichment is not entirely understood. However, it is possible that the enrichment represents the accumulation of As in the sediments from infiltrating surface waters during flooding and/or from groundwaters. Arsenic concentrations in water from the El Tatio Geyser basin are the highest ever reported for any surficial water body (>10,000 μg/L) [30,31]. For comparison, the drinking water guideline proposed by the World Health Organization is 10 μg/L [67]. Romero et al. [30] found that the dissolved As concentrations at El Tatio remained high along the Rio Salado-Rio Loa system for at least 280 km downstream, ranging from 100 to >1000 μg/L. It seems reasonable, then, that As could be sorbed to the sediments from infiltrating flood waters that inundated the site. Moreover, while the sediments have not be directly dated, late Holocene paleo-wetland deposits associated with a terrace located about 3 km downstream of the site, and which occur at a similar height above the contemporary channel, have been dated to about 830 YBP [28]. The geomorphic history the channel proposed by Rech et al. [28] suggests that significant groundwater discharge was feeding the wetlands prior to channel incision that occurred sometime after about 830 YBP. Thus, this reach of the Rio Loa, including site RL1, was likely to have experienced periods of enhanced groundwater flow, prior to channel incision, during which As could accumulate in the alluvial sediments. The accumulation of As in the deposits would have been aided by the regions’ hyperarid conditions that foster the evaporation of soil waters.

6. Summary and Conclusions

As is the case in many mineralized basins, deciphering the enrichment and contribution of anthropogenic metals within alluvial sediments of the hyperarid Rio Loa basin of northern Chile has proven problematic. Complicating the problem further is the widespread inundation, reworking, and deposition of sediment throughout the valley bottom during rare, but extreme floods that are responsible for transporting the majority of both natural and contaminated (mining related) sediments in the region. Thus, background sediment sources are scarce. During this study, paleoflood deposits located along two reaches (RS and PD) of the Rio Salado, a tributary to the Rio Loa, were delineated, sampled, and analyzed for selected trace metals. The hydrology of, and deposition of sediment within, the two reaches differed. Within the upstream reach, PD, the analyzed sediments were deposited immediately upstream and downstream of an abrupt decrease in trench width (a choke point) in zones of reduced flow. Paleohydrologic reconstructions showed that abrupt spatial changes in the width, depth, and slope of the incised trench of the Rio Salado at PD led to significant changes in flow velocities and water surface profiles as well as the grain size and C content of the deposited sediment. In contrast to reach PD, flood deposits within reach RS occurred as slackwater sediments deposited within tributary alcoves cut in the valley walls. Paleohydrologic reconstructions showed that spatial variations in flow characteristics and water surface profiles were more uniform than at reach PD, resulting in deposits with more uniform grain size and C contents. With the exception of the upper most deposit (thought to represent deposition during ~100-year flood in 2001), the analyzed paleoflood sediments were deposited during events with recurrence intervals measured in decades and which dated back to at least 390 years YBP. They therefore represent alluvial sediments that pre-date mining and other major anthropogenic activities in the basin.
Geochemically, the deposits at reach PD were characterized by thin, abrupt increases (spikes) in As, Cd, Cu, Ni, and Zn concentration; spikes in Cu did not correlate with the other metals. While intra- and interflood changes in metal concentrations occur within deposits of reach RS, they were more subdued than at reach PD. The vertical changes in metal concentrations associated with both intra- and interflood deposition are thought to be due to changes in sediment source. It is possible that the interflood alterations in sediment/metal sources are related to precipitation patterns associated with El Niño and La Niña episodes that impact different parts of the basin. The more pronounced variations in concentrations at PD may also reflect a lack of sediment storage within and upstream of reach PD, which inhibited the reworking and homogenation of the geochemical signature associated with the sediment source materials.
Background functions for deposits along reach RS could be developed for all seven analyzed trace metals. Cobalt yield the most effective background functions for As, Cd, Ni, Pb, and Zn; Fe was selected for Cr; and Al for Cu. Background functions could not be defined for Cu, Cr, and Pb using Al, Fe, or Co for deposits along reach PD. The inability to do so may reflect, in part, the larger, abrupt variations in metal concentrations and changes in sediment source along reach PD. In the case of Al and Fe, it may also reflect the use of partial, rather than total, digestion methods, the former of which are commonly used for environmental studies. Thus, for immature alluvial sediments such as found within the Rio Loa-Rio Salado system, source determination may require one set of analyses (total digestions) and biological/toxicity assessments a second set of analyses (based on partial or sequential analyses).
LEFs developed using the background functions defined for the paleoflood deposits exhibited a narrow distribution centered around 1, suggesting that the paleoflood deposits served as effective background materials. The application of the defined LEFs to a thick section of alluvial valley fill located downstream along the Rio Loa suggests that Cu was enriched in the upper most deposits, which were likely to have been associated with the 2001 flood known to have transported Cu contaminated mine tailings. Cadmium, Cr, Ni, Pb and Zn exhibited little enrichment. These trends are consistent with Cu/Sb ratios used as a potential tracer of mine versus natural enrichment in the basin, and with trace metal concentrations determined for mine tailings. Arsenic was highly enriched in all of the alluvial valley fill deposits. Its enrichment presumably reflected the sorption of As from groundwaters. The use of paleoflood deposits to calculate LEFs was shown to be an effective method of deciphering the contributions of natural and anthropogenic metals to rivers in hyperarid and arid environments where large events transport the majority of the sediment load and background deposits are scarce.

Author Contributions

Conceptualization, J.R.M.; Formal analysis, D.W.; Investigation, J.R.M., D.W., and L.F.V.; Methodology, J.R.M.; Writing—original draft, J.R.M.; Writing—review & editing, D.W. and L.F.V.

Funding

This research was funded, in part, by the Whitmire endowment at Western Carolina University.

Acknowledgments

Faculty and staff, including Cristian Jofre Olivares, from the Instituto Profesional AIEP, de la Universidad Andres Bello in Calama, Chile aided in the collection and interpretation of field data. Their assistance is greatly appreciated. We also thank three anonymous reviewers for their constructive comments.

Conflicts of Interest

The authors declare no conflict of interest.

References

  1. USEPA. The Incidence and Severity of Sediment Contamination in Surface Waters of the United States; National Sediment Quality Survey, 2nd ed.; EPA-823-R-04-007; US Environmental Protection Agency, Office of Science and Technology: Washington, DC, USA, 2004.
  2. Davutluoglu, O.I.; Seckin, G.; Ersu, C.B.; Yilmaz, T.; Sari, B. Heavy Metal Content and Distribution in Surface Sediments of the Seyhan River, Turkey. J. Environ. Manag. 2011, 92, 2250–2259. [Google Scholar] [CrossRef]
  3. Relic, D.; Dordevic, D.; Sakan, S.; Andelkovic, I.; Pantelic, A.; Stankovic, R.; Popovic, A. Conventional, Microwave, and Ultrasound Sequential Extractions for the Fractionation of Metals in Sediments within the Petrochemical Industry, Serbia. Environ. Monit. Assess. 2013, 85, 7627–7645. [Google Scholar] [CrossRef] [PubMed]
  4. Sakan, S.; Dordevic, D. Distinguishing between Natural and Anthropogenic Sources of Trace Elements in the Sediments Using the Methods of Geochemical Normalization and Statistical Analysis. In Trace Elements: Environmental Sources, Geochemistry and Human Health; Nova Science Publishers, Inc.: Hauppauge, NY, USA, 2012; pp. 117–134. [Google Scholar]
  5. Sakan, S.M.; ĐorĐević, D.S.; Lazić, M.M.; Tadić, M.M. Assessment of Arsenic and Mercury Contamination in the Tisa River Sediments and Industrial Canal Sediments (Danube Alluvial Formation), Serbia. J. Environ. Sci. Heal. Part A 2012, 47, 109–116. [Google Scholar] [CrossRef] [PubMed]
  6. Sakan, S.; Dordevic, D. Assessment of Trace Element Contamination in the River and Alluvial Sediments Using a Sequential Extraction Technique and Statistical Analysis. In Metal Contamination: Sources, Detection and Environmental Impact; Hong-Bo, S., Ed.; Nova Science Publishers, Inc.: Hauppauge, NY, USA, 2013; pp. 119–155. [Google Scholar]
  7. Gibbs, R. Transport Phases of Transition Metals in the Amazon and Yukon Rivers. Geol. Soc. Am. Bull. 1977, 88, 829–843. [Google Scholar] [CrossRef]
  8. Martin, J.M.; Meybeck, M. Elemental Mass-Balance of Material Carried by Major World Rivers. Mar. Chem. 1979, 7, 173–206. [Google Scholar] [CrossRef]
  9. Miller, J.R.; Miller, S.M.O. Contaminated Rivers: A Geomorphological-Geochemical Approach to Site Assessment and Remediation; Springer Science & Business Media: Berlin, Germany, 2007. [Google Scholar]
  10. Comoro, S.; Vaccaro, G.; De Dapitani, E.; Bawlik, B.W. Characterization of the Danube River Sediments Using PMF Multivariate Approach. Chemosphere 2014, 95, 329–335. [Google Scholar] [CrossRef]
  11. Reimann, C.; Garrett, R.G. Geochemical Background—Concept and Reality. Sci. Total. Environ. 2005, 350, 12–27. [Google Scholar] [CrossRef]
  12. Grygar, T.M.; Popelka, J. Revisiting Geochemical Methods of Distinguishing Natural Concentrations and Pollution by Risk Elements in Fluvial Sediments. J. Geochem. Explor. 2016, 170, 39–57. [Google Scholar] [CrossRef]
  13. Horowitz, A.J. Primer on Sediment-Trace Element Chemistry; Lewis Publishers: Boca Raton, FL, USA, 1991. [Google Scholar]
  14. Sakan, S.; Sakan, N.M.; Đorđević, D. Evaluation of the Possibility of Using Normalization with Cobalt in Detection of Anthropogenic Heavy Metals in Sediments. Adv. Chem. Res. 2015, 167–183. [Google Scholar]
  15. Ho, H.H.; Swennen, R.; Cappuyns, V.; Vassilieva, E.; Van Tran, T. Necessity of Normalization to Aluminum to Assess the Contamination by Heavy Metals and Arsenic in Sediments near Haiphong Harbor, Vietnam. J. Asian Earth Sci. 2012, 56, 229–239. [Google Scholar] [CrossRef]
  16. Borovec, Z. Elements in Size-Fractionated Bottom Sediments of the Elbe River in Its Czech Part. Aquat. Sci. 2000, 62, 232–251. [Google Scholar] [CrossRef]
  17. Reimann, C.; de Caritat, P. Distinguishing between Natural and Anthropogenic Sources for Elements in the Environment: Regional Geochemical Surveys versus Enrichment Factors. Sci. Total. Environ. 2005, 337, 91–107. [Google Scholar] [CrossRef]
  18. Covelli, S.; Fontolan, G. Application of a Normalization Procedure in Determining Regional Geochemical Baselines. Environ. Geol. 1997, 30, 34–45. [Google Scholar] [CrossRef]
  19. Vijver, M.G.; Spijker, J.; Vink, J.P.M.; Posthuma, L. Determining Metal Origins and Availability in Fluvial Deposits by Analysis of Geochemical Baselines and Solid–Solution Partitioning Measurements and Modelling. Environ. Pollut. 2008, 156, 832–839. [Google Scholar] [CrossRef] [PubMed]
  20. Turekian, K.K.; Wedepohl, K.H. Distribution of the Elements in Some Major Units of the Earth’s Crust. Geol. Soc. Am. Bull. 1961, 72, 175–192. [Google Scholar] [CrossRef]
  21. Beck, M.L.; Hopkins, W.A.; Jackson, B.P. Spatial and Temporal Variation in the Diet of Tree Swallows: Implications for Trace Element Exposure Following Habitat Remediation. Arch. Environ. Contam. Toxicol. 2013, 65, 575–587. [Google Scholar] [CrossRef]
  22. Grygar, T.M.; Elznicová, J.; Bábek, O.; Hošek, M.; Engel, Z.; Kiss, T. Obtaining Isochrones from Pollution Signals in a Fluvial Sediment Record: A Case Study in a Uranium-Polluted Floodplain of the Ploučnice River, Czech Republic. Appl. Geochem. 2014, 48, 1–15. [Google Scholar] [CrossRef]
  23. Novakova, T.; Kotková, K.; Elznicova, J.; Strnad, L.; Engel, Z.; Grygar, T.M. Pollutant Dispersal and Stability in a Severely Polluted Floodplain: A Case Study in the Litavka River, Czech Republic. J. Geochem. Explor. 2015, 156, 131–144. [Google Scholar] [CrossRef]
  24. Sims, D.B.; Hooda, P.S.; Gillmore, G.K. Mining Activities and Associated Environmental Impacts in Arid Climates: A Literature Review. Environ. Pollut. 2013, 2, 22. [Google Scholar] [CrossRef]
  25. Rech, J.A.; Pigati, J.S.; Quade, J.; Betancourt, J.L. Re-Evaluation of Mid-Holocene Deposits at Quebrada Puripica, Northern Chile. Palaeogeogr. Palaeoclimatol. Palaeoecol. 2003, 194, 207–222. [Google Scholar] [CrossRef]
  26. Houston, J. The Great Atacama Flood of 2001 and Its Implications for Andean Hydrology. Hydrol. Process. 2006, 20, 591–610. [Google Scholar] [CrossRef]
  27. Magilligan, F.J.; Goldstein, P.S.; Fisher, G.B.; Bostick, B.C.; Manners, R.B. Late Quaternary Hydroclimatology of a Hyper-Arid Andean Watershed: Climate Change, Floods, and Hydrologic Responses to the El Niño-Southern Oscillation in the Atacama Desert. Geomorphology 2008, 101, 14–32. [Google Scholar] [CrossRef]
  28. Rech, J.A.; Quade, J.; Betancourt, J.L. Late Quaternary Paleohydrology of the Central Atacama Desert (Lat 22°–24°S), Chile. GSA Bull. 2002, 114, 334–348. [Google Scholar] [CrossRef]
  29. MacDonald, D.D.; Ingersoll, C.G.; Berger, T.A. Development and Evaluation of Consensus-Based Sediment Quality Guidelines for Freshwater Ecosystems. Arch. Environ. Contam. Toxicol. 2000, 39, 20–31. [Google Scholar] [CrossRef] [PubMed]
  30. Romero, L.; Alonso, H.; Campano, P.; Fanfani, L.; Cidu, R.; Dadea, C.; Keegan, T.; Thornton, I.; Farago, M. Arsenic Enrichment in Waters and Sediments of the Rio Loa (Second Region, Chile). Applie Geochem. 2003, 18, 399–1416. [Google Scholar] [CrossRef]
  31. Landrum, J.T.; Bennett, P.C.; Engel, A.S.; Alsina, M.A.; Pasten, P.A.; Milliken, K. Partitioning Geochemistry of Arsenic and Antimony, El Tatio Geyser Field, Chile. Appl. Geochem. 2009, 24, 664–676. [Google Scholar] [CrossRef]
  32. Wilson, L.R. Determination of Trace Element Provenance, Rio Loa Basin, Northern Chile. Master’s Thesis, Western Carolina University, Cullowhee, NC, USA, 2011. [Google Scholar]
  33. Kottlowski, F.E. Measuring Stratigraphic Sections; Holt, Rinehart, and Winston: New York, NY, USA, 1965. [Google Scholar]
  34. Bridge, J.S. Rivers and Floodplains; Wiley-Blackwell: Hoboken, NJ, USA, 2003. [Google Scholar]
  35. Kochel, R.C.; Baker, V.R. Paleoflood Hydrology. Science 1982, 215, 353–361. [Google Scholar] [CrossRef] [PubMed]
  36. Baker, V.R. Palaeoflood Hydrology in a Global Context. CATENA 2006, 66, 161–168. [Google Scholar] [CrossRef]
  37. Baker, V.R.; Kochel, R.C.; Patton, P.C.; Pickup, G. Palaeohydrologic Analysis of Holocene Flood Slack-Water Sediments. In Modern and Ancient Fluvial Systems; John Wiley & Sons: Hoboken, NJ, USA, 2009; pp. 229–239. [Google Scholar]
  38. Baker, V.R. Paleoflood Hydrology: Origin, Progress, Prospects. Geomorphology 2008, 101, 1–13. [Google Scholar] [CrossRef]
  39. O’Connor, J.E.; Webb, R.W. Hydraulic Modeling for Paleoflood Analysis. In Flood Geomorphology; Baker, V.R., Kochel, R.C., Patton, P., Eds.; John Wiley & Sons: Hoboken, NJ, USA, 1988; pp. 393–402, 503. [Google Scholar]
  40. Webb, R.H.; Jarrett, R.D. One-Dimensional Estimation Techniques for Discharges of Paleofloods and Historical Floods: Ancient Floods, Modern Hazards: Principles and Applications of Paleoflood Hydrology. In Ancient Floods, Modern Hazards: Principles and Applications of Paleoflood Hydrology; House, P.K., Webb, R.H., Baker, V.R., Levish, D.R., Eds.; Water Science and Applications; American Geophysical Union: Washington, DC, USA, 2002; Volume 5, pp. 111–125. [Google Scholar]
  41. Cudworth, A.G., Jr. Flood Hydrology Manual; Surface Water Branch, U.S Department of Interior, Bureau of Reclamation: Denver, CO, USA, 1989.
  42. Cohn, T. User Manual for Program PeakfqSA Flood-Frequency Analysis with the Expected Moments Algorithm; United States Geological Survey: Reston, VA, USA, 2012.
  43. England, J.F., Jr.; Salas, J.D.; Jarrett, R.D. Comparison of Two Moment-Based Estimators That Utilize Historical and Paleoflood Data for the Log-Pearson Type III Distribution. Water Resour. Res. 2003, 39, 1243. [Google Scholar] [CrossRef]
  44. Walsh, D. Chemostratigraphy of Slackwater Deposits and Paleoflood Hydrology of the Rio Salado, Antofagasta Region, Chile. Master’s Thesis, Western Carolina University, Cullowhee, NC, USA, 2016. [Google Scholar]
  45. Miller, J.R.; Lechler, P.J.; Mackin, G.; Germanoski, D.; Villarroel, L.F. Evaluation of Particle Dispersal from Mining and Milling Operations Using Lead Isotopic Fingerprinting Techniques, Rio Pilcomayo Basin, Bolivia. Sci. Total. Environ. 2007, 384, 355–373. [Google Scholar] [CrossRef]
  46. Falkowska, E.; Falkowski, T. Trace Metals Distribution Pattern in Floodplain Sediments of a Lowland River in Relation to Contemporary Valley Bottom Morphodynamics. Earth Surf. Process. Landforms 2015, 40, 876–887. [Google Scholar] [CrossRef]
  47. Greenbaum, N.; Harden, T.M.; Baker, V.R.; Weisheit, J.; Cline, M.L.; Porat, N.; Halevi, R.; Dohrenwend, J. A 2000 Year Natural Record of Magnitudes and Frequencies for the Largest Upper Colorado River Floods near Moab, Utah. Water Resour. Res. 2014, 50, 5249–5269. [Google Scholar] [CrossRef]
  48. Webb, R.H.; O’Connor, J.E.; Baker, V.R. Paleohydrologic Reconstruction of Flood Frequency on the Escalante River, South-Central Utah. In Flood Geomorphology; Baker, V.R., Kochel, R.C., Patton, P.C., Eds.; John Wiley & Sons: Hoboken, NJ, USA, 1988; pp. 403–418. [Google Scholar]
  49. Hussain, Z. Application of the Regional Flood Frequency Analysis to the Upper and Lower Basins of the Indus River, Pakistan. Water Resour. Manag. 2011, 25, 2797–2822. [Google Scholar] [CrossRef]
  50. Grygar, T.; Světlík, I.; Lisá, L.; Koptíková, L.; Bajer, A.; Wray, D.S.; Ettler, V.; Mihaljevič, M.; Nováková, T.; Koubová, M.; et al. Geochemical Tools for the Stratigraphic Correlation of Floodplain Deposits of the Morava River in Strážnické Pomoraví, Czech Republic from the Last Millennium. CATENA 2010, 80, 106–121. [Google Scholar] [CrossRef]
  51. Majerová, L.; Grygar, T.M.; Elznicova, J.; Strnad, L. The Differentiation between Point and Diffuse Industrial Pollution of the Floodplain of the Ploučnice River, Czech Republic. Water Air Soil Pollut. 2013, 224, 1688. [Google Scholar] [CrossRef]
  52. Horowitz, A.J.; Elrick, K.A. The Relation of Stream Sediment Surface Area, Grain Size and Composition to Trace Element Chemistry. Appl. Geochem. 1987, 2, 437–451. [Google Scholar] [CrossRef]
  53. Filgueiras, A.V.; Lavilla, I.; Bendicho, C. Evaluation of Distribution, Mobility and Binding Behaviour of Heavy Metals in Surficial Sediments of Louro River (Galicia, Spain) Using Chemometric Analysis: A Case Study. Sci. Total. Environ. 2004, 330, 115–129. [Google Scholar] [CrossRef] [PubMed]
  54. Benson, N.U.; Asuquo, F.E.; Williams, A.B.; Essien, J.P.; Ekong, C.I.; Akpabio, O.; Olajire, A.A. Source Evaluation and Trace Metal Contamination in Benthic Sediments from Equatorial Ecosystems Using Multivariate Statistical Techniques. PLoS ONE 2016, 11, e0156485. [Google Scholar] [CrossRef]
  55. Keefer, D.K.; Moseley, M.E.; deFrance, S.D. A 38 000-Year Record of Floods and Debris Flows in the Ilo Region of Southern Peru and Its Relation to El Niño Events and Great Earthquakes. Palaeogeogr. Palaeoclimatol. Palaeoecol. 2003, 194, 41–77. [Google Scholar] [CrossRef]
  56. Manners, R.B.; Magilligan, F.J.; Goldstein, P.S. Floodplain Development, El Niño, and Cultural Consequences in a Hyperarid Andean Environment. Ann. Assoc. Am. Geogr. 2007, 97, 229–249. [Google Scholar] [CrossRef]
  57. Wells, L.E. Holocene History of the El Niño Phenomenon as Recorded in Flood Sediments of Northern Coastal Peru. Geology 1990, 18, 1134–1137. [Google Scholar] [CrossRef]
  58. Wang, Z.; Darilek, J.L.; Zhao, Y.; Huang, B.; Sun, W. Defining Soil Geochemical Baselines at Small Scales Using Geochemical Common Factors and Soil Organic Matter as Normalizers. J. Soils Sediments 2011, 11, 3–14. [Google Scholar] [CrossRef]
  59. Loring, D.H. Lithium—A New Approach for the Granulometric Normalization of Trace Metal Data. Mar. Chem. 1990, 29, 155–168. [Google Scholar] [CrossRef]
  60. Soto-Jemenez, M.; Paez-Osuma, F. Cd, Cu, Pb, and Zn in Lagoonal Sediments from Mazatlán Harbor (SE Gulf of California): Bioavailability and Geochemical Fractioning. Bulliten Environ. Contam. Toxicol. 2001, 66, 350–356. [Google Scholar]
  61. Schiff, K.C.; Weisberg, S.B. Iron as a Reference Element for Determining Trace Metal Enrichment in Southern California Coastal Shelf Sediments. Mar. Environ. Res. 1999, 48, 161–176. [Google Scholar] [CrossRef]
  62. Dung, T.T.T.; Cappuyns, V.; Swennen, R.; Phung, N.K. From Geochemical Background Determination to Pollution Assessment of Heavy Metals in Sediments and Soils. Rev. Environ. Sci. Biotechnol. 2013, 12, 335–353. [Google Scholar] [CrossRef]
  63. Föstner, U.; Wittman, G.T.W. Metal Pollution in the Aquatic Environment; Springer: New York, NY, USA, 1981. [Google Scholar]
  64. Baeyens, W.; Panutrakul, S.; Elsken, M.; Leermakers, M.; Navez, J.; Monteny, F. Geochemical Processes in Muddy Adn Sandy Tidal Flat Sediments. Geo-Mar. Lett. 1991, 11, 188. [Google Scholar] [CrossRef]
  65. Herut, B.; Sandler, A. Normalization Methods for Pollutants in Marine Sediments: Review and Recommendations for the Mediterranean Basin; Oil Report H18/2006; UNEP/MAP: Nairobi, Kenya, 2006. [Google Scholar]
  66. The Intergovernmental Océanographie Commission (IOC); The International Atomic Energy Agency; Marine Environment Laboratory (IAEAMEL); The United Nations Environment Programme (UNEP). Manual for the Geochemical Analyses of Marine Sediments and Suspended Particulate Matter; Reference Methods for Marine Pollution Studies, NO. 63; UNEP: New York, NY, USA, 1995. [Google Scholar]
  67. WHO. Guidelines for Drinking-Water Quality, 2nd ed.; World Health Organization: Geneva, Switzerland, 1993; Volume 1. [Google Scholar]
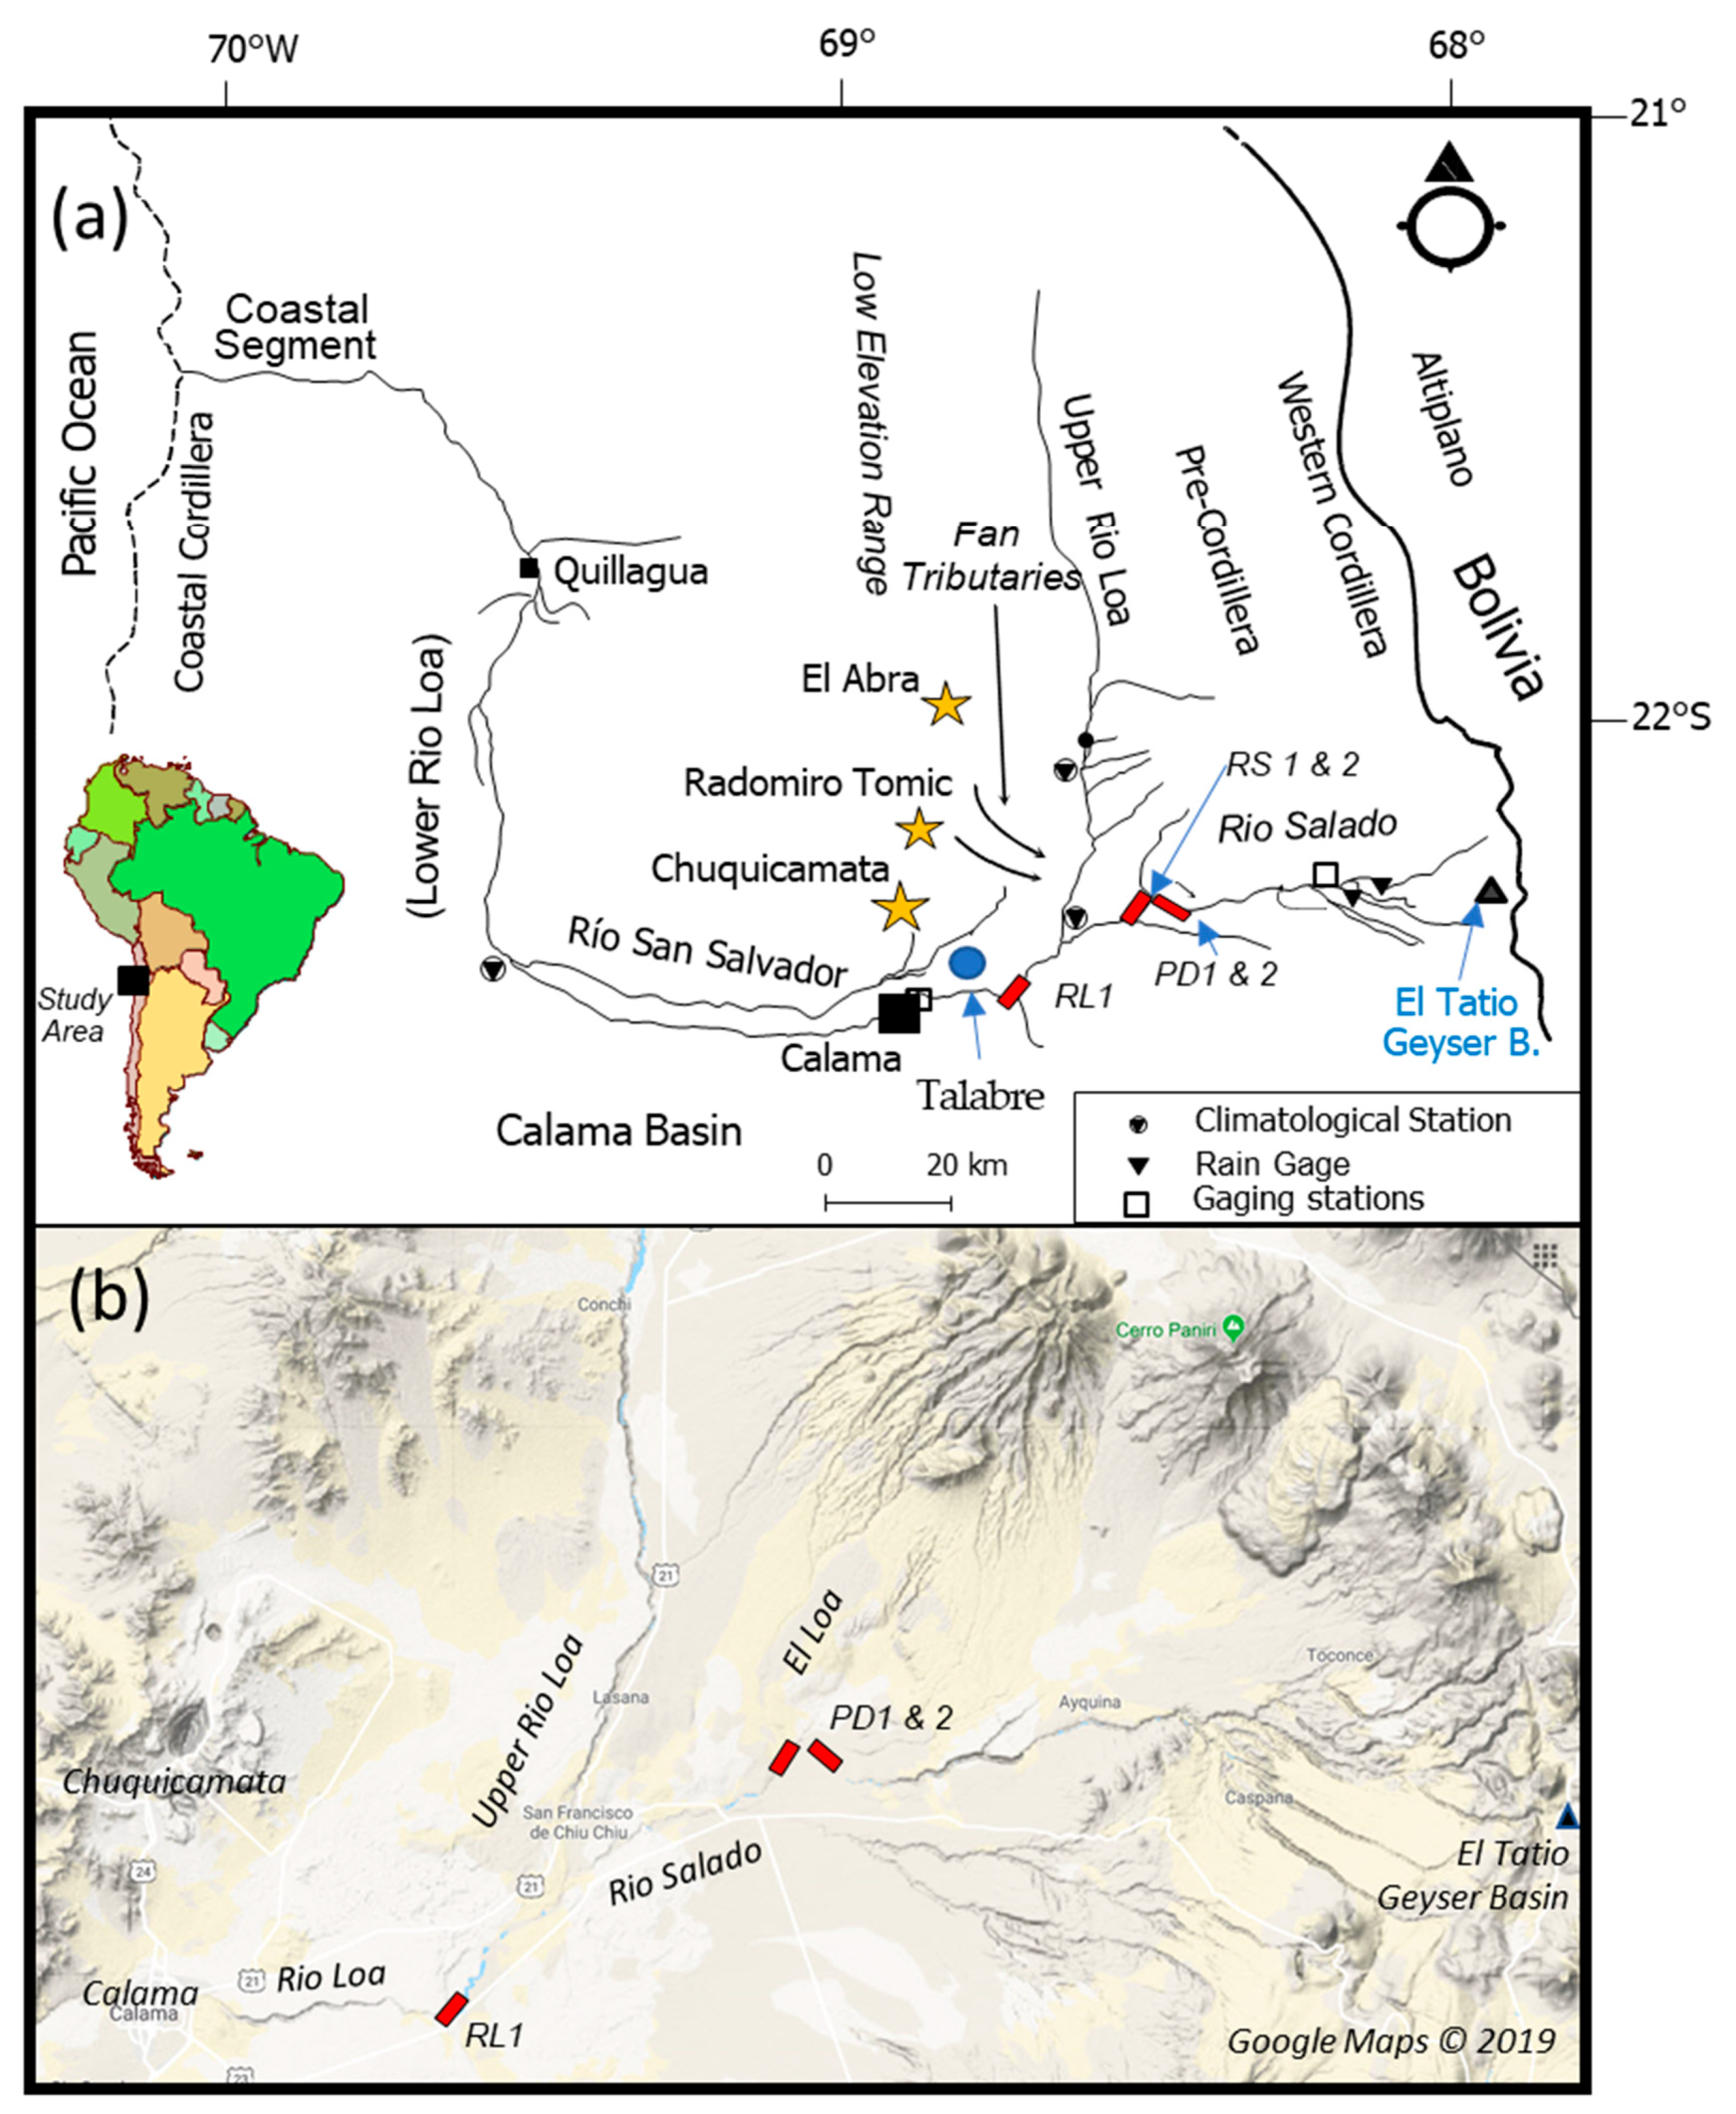
Figure 1. (a) Location map of Rio Loa Basin, northern Chile; (b) schematic diagram illustrating physical and geochemical processes involved in trace metal dispersal.
Geosciences 09 00244 g001
Figure 2. Geomorphic characteristics of reach PD (center image from Google Earth, 10/5/2016, Image © 2019 CNES/Airbus). Upper right photograph was taken looking downstream at the slot canyon. Lower right photograph was taken looking upstream toward the slot canyon.
Geosciences 09 00244 g002
Figure 3. (a) Paleoflood deposits at PD1 characterized and sampled upstream of a bedrock constriction (choke point); 15 flood deposits were identified at PD1; (b) paleoflood deposits characterized and sampled at PD2, located downstream of the bedrock constriction. A total of 10 deposits were defined at PD2.
Geosciences 09 00244 g003
Figure 4. Variations in the grain size distribution and carbon content of the paleoflood deposits. Grain size distribution at RS1 (A), RS2 (B), PD1 (E), and PD2 (F); Organic matter content at RS1 (C), RS2 (D), PD1 (G) and PD2 (H).
Geosciences 09 00244 g004
Figure 5. Geomorphic characteristics of reach PD. Channel is deeply incised into bedrock, but width and depth of the incised trench are relatively uniform.
Geosciences 09 00244 g005
Figure 6. The 9 slackwater deposits (FD) characterized and sampled within the mouth of a tributary at RS1 (a); the 10 slackwater deposits characterized and sampled within a bedrock alcove at RS2 (b). The letter “E” refers to eolian deposits.
Geosciences 09 00244 g006
Figure 7. Results from flood frequency analysis using the paleoflood and gauged records. The 2001 flood has a recurrence interval of ~100 years. Discharge values have an uncertainty of ±25% for the gauged record and an uncertainty of +50% for the paleoflood record. An annual exceedance probability of 0.01 is equal to a 100-year recurrence interval.
Geosciences 09 00244 g007
Figure 8. Comparison of selected trace metal/metalloid concentrations between the paleoflood deposits sampled along reaches RS and PD. Statistically significant differences (p = 0.01) exist between the two reaches for As, Cd, Cr, and Zn.
Geosciences 09 00244 g008
Figure 9. Comparison of the vertical variations in Ni, Cu, and Pb at PD1 (a) and RS2 (d); Cd and Cr at PD1 (b) and RS2 (e); As and Zn at PD1 (c) and RS2 (f). Variations at RS1 and PD1 are representative of deposits along the two reaches.
Geosciences 09 00244 g009
Figure 10. Background functions for the seven analyzed trace metals calculated for reach RS. Analysis considered Al, Fe, and Co. Selected background function was based on strength and significance of the regression relationship.
Geosciences 09 00244 g010
Figure 11. Histograms of local enrichment factors calculated for reach RS. Note that LEFs vary around 1.
Geosciences 09 00244 g011
Figure 12. Vertical distribution of As concentration, selected LEF values, and Cu/Sb ratios for alluvial valley fill deposits located at RL1 (see Figure 1 for site location).
Geosciences 09 00244 g012
Figure 13. (a) Vertical patterns in Zn (orange) and As (blue) concentrations at PD1 and PD2. Dashed lines of various colors show possible correlations between flood deposits based on Zn and As contents; (b) comparison of Zn and Cu concentrations at PD1, illustrating differences in concentration between events.
Geosciences 09 00244 g013
Table 1. Comparison of trace metal concentrations along the Rio Loa r, mine affected tributaries, and sediment from the El Tatio Geyser Basin to consensus based aquatic threshold values; data from Wilson [32]. See Figure 1 for reach locations.
ElementMean Chanel Bed Sediment Concentrations (mg/kg)
TECPECEl Tatio Geyser BasinUpper Rio LoaRio LoaUpper Rio Loa Mine Tribs *Rio San Salvador *
As9.7933.0296034.4248162544
Cd0.994.980.692.171.032.306.64
Cr43.411121.348.415.242.155.9
Cu31.614955.863.716.97261580
Ni22.748.65.5817.47.9422.724.7
Pb35.812815.611.49.5824.2154
Sb--5217.847.409.9222.4
Zn12145944.074.246.01171040
* Channel receives direct runoff from mine tailings.
Table 2. Descriptive statistics for selected geochemical parameters measured in the fine-grained fraction by reach; values reported in mg/kg.
Reach RS
Trace MetalnMeanRangeStandard Deviation
As30299.9141.8–540.0105.3
Cd3014.426.200–26.65.72
Cr3032.5025.60–47.04.24
Cu3063.5738.2–104.819.94
Ni3016.9114.00–23.42.15
Pb3017.4113.80–23.62.16
Zn30311.5179.4–504.498.37
% <63 µm3015.12.0–55.813.7
% Organics300.6000.002–1.2730.291
Reach PD
Trace MetalnMeanRangeStandard Deviation
As60192.474.20–498.2100.8
Cd609.212.60–33.806.76
Cr6034.3918.60–67.609.30
Cu6099.0435.40–491.292.53
Ni6018.7010.60–41.06.82
Pb6018.499.20–35.03.49
Zn60251.0131.0–614.2112.3
% <63 µm6019.35.0–70.512.7
% Organics600.8640.218–4.2240.735
Table 3. Correlations between trace metals and organic matter percentage for total dataset; concentrations determined for <63 µm fraction.
All Data (Both Reaches; n = 90)
ParameterAsCdCrCuNiPbZnOrganics
As1.00-------
Cd0.94 **1.00------
Cr−0.25 *-0.131.00-----
Cu−0.21 *0.12−0.22 *1.00----
Ni0.32 *0.45 **0.33 **0.131.00---
Pb−0.010.080.49 **0.31 **0.42 **1.00--
Zn0.82 *0.90 *−0.060.030.43 **0.061.00-
Organics0.090.01−0.28 **0.38 **0.14−0.120.091.00
Reach PD (n = 60)
ParameterAsCdCrCuNiPbZnOrganics
As1.00-------
Cd0.93 **1.00------
Cr−0.19-0.051.00-----
Cu0.36 **0.19−0.261.00----
Ni0.47 **0.57 **0.33 **0.081.00---
Pb−0.020.060.54 **0.26 *0.37 **1.00--
Zn0.84 **0.90 **−0.030.030.48 **−0.051.00-
Organics0.13−0.01−0.30 *0.34 **−0.21−0.22-0.121.00
Reach RS (n = 30)
ParameterAsCdCrCuNiPbZnOrganics
As1.00-------
Cd0.96 **1.00------
Cr−0.45 *−0.36 *1.00-----
Cu0.69 **0.73 **−0.161.00----
Ni0.52 **0.68 **0.110.83 **1.00---
Pb0.40 *0.53 **0.110.80 **0.84 **1.00--
Zn0.77 **088 **−0.080.80 **0.85 *0.66 **100-
Organics0.68 **0.62 **0.010.55 **0.39 *0.310.44 *1.00
* Correlation is significant at the 0.05; ** correlation is significant at 0.01 level.
Table 4. Background functions for selected trace metals. Concentrations are those associated with <63 µm sediment fraction and are shown in mg/kg; n is total number of samples. Threshold local enrichment factor (LEF) is the value above which the sample is likely to exceed natural variability at a given probability (p).
Background FunctionnR2LEF (p = 95%)LEF (p = 99%)
Reach RS
As = 27.65Co − 252.44300.541.0791.104
Cd = 1.73Co − 20.17300.721.0781.102
Cr = 0.0016Fe − 12.60300.871.0061.012
Cu = 0.007Al − 61.22300.701.0761.096
Ni = 0.641Co + 4.09300.701.0251.083
Pb = 0.467Co + 8.075300.371.0001.062
Zn = 30.44Co − 296.59300.751.0111.079
Reach PD
As = 19.57Co − 175.38600.741.1161.270
Cd = 1.29Co − 15.01600.721.5201.789
Cr = None significant 60---
Cu = None significant60---
Ni = 0.79Co + 3.89600.261.0751.142
Pb = Not significant 60---
Zn = 22.02Co − 162.69609.761.0521.094
Table 5. Summary of trace metal concentrations in alluvial units defined at RL1; values given in mg/kg.
Trace MetalMeanRangeStandard Deviation
As806.6330.7–1713560.2
Cd2.7901.620–5.1401.259
Cr29.811.620–5.4106.765
Cu67.6527.85–219.665.85
Ni15.3412.25–20.152.499
Pb10.894.88–16.384.085
Zn123.185.77–191.531.22