Article

Microbial Diversity in Sub-Seafloor Sediments from the Costa Rica Margin

by
Amanda Martino
1,2,*,
Matthew E. Rhodes
3,
Rosa León-Zayas
4,5,
Isabella E. Valente
3,
Jennifer F. Biddle
5 and
Christopher H. House
2
1
Department of Biology, Saint Francis University, Loretto, PA 15940, USA
2
Department of Geosciences, Penn State University, University Park, PA 16802, USA
3
Department of Biology, College of Charleston, Charleston, SC 29424, USA
4
Department of Biology, Willamette University, Salem, OR 97301, USA
5
School of Marine Science and Policy, University of Delaware, Lewes, DE 19958, USA
*
Author to whom correspondence should be addressed.
Geosciences 2019, 9(5), 218; https://doi.org/10.3390/geosciences9050218
Submission received: 31 March 2019 / Revised: 3 May 2019 / Accepted: 11 May 2019 / Published: 13 May 2019
(This article belongs to the Special Issue Tracking the Deep Biosphere through Time)

Abstract

:
The exploration of the deep biosphere continues to reveal a great diversity of microorganisms, many of which remain poorly understood. This study provides a first look at the microbial community composition of the Costa Rica Margin sub-seafloor from two sites on the upper plate of the subduction zone, between the Cocos and Caribbean plates. Despite being in close geographical proximity, with similar lithologies, both sites show distinctions in the relative abundance of the archaeal domain and major microbial phyla, assessed using a pair of universal primers and supported by the sequencing of six metagenomes. Elusimicrobia, Chloroflexi, Aerophobetes, Actinobacteria, Lokiarchaeota, and Atribacteria were dominant phyla at Site 1378, and Bathyarchaeota, Chloroflexi, Hadesarchaeota, Aerophobetes, Elusimicrobia, and Lokiarchaeota were dominant at Site 1379. Correlations of microbial taxa with geochemistry were examined and notable relationships were seen with ammonia, sulfate, and depth. With deep sediments, there is always a concern that drilling technologies impact analyses due to contamination of the sediments via drilling fluid. Here, we use analysis of the drilling fluid in conjunction with the sediment analysis, to assess the level of contamination and remove any problematic sequences. In the majority of samples, we find the level of drilling fluid contamination, negligible.

1. Introduction

Scientific drilling programs (Deep Sea Drilling Program-DSDP, Ocean Drilling Program-ODP, Integrated Ocean Drilling Program-IODP, and the International Ocean Discovery Program-IODP) have enabled successful studies of microbiology in the deep marine sub-surface. The Peru Margin, Canterbury Basin, Nankai Trough, and Cascadia Margin are just a few of the areas of sediment drilled in order to examine the deep biosphere [1,2,3,4]. However, many areas of ocean sediment remain to be explored. This study provides the first information on microbial community composition and potential biogeochemical relationships present at one of these previously unexplored locations. The Costa Rica Margin sub-seafloor has been targeted by the larger IODP community, due to the unique properties and history of the erosive subduction zone, between the Cocos and Caribbean plates [5]. The Costa Rica subduction system is of interest as it may be a tangible way to see the connection between geology and biology, as influenced by subductive processes [6]. For the deep biosphere, this location is a useful comparison to those that have been investigated previously in other coastal margin locations (for example: Peru, Nankai, Cascadia margin). While some previous margin studies have shown archaea to constitute only a very minor portion of the microbial population of the seafloor [3,7,8], others have suggested a greater influence [9,10]. The environmental conditions in the sub-seafloor that constrain archaeal abundance are currently unknown, and the dominant microbial populations of the Costa Rica Margin are also unknown.
In addition to examining the microbial community composition, this paper also examines the influence of drilling fluid contamination in deep sediment cores. While numerous sub-seafloor sediment microbial communities have now been examined, much of the research has been focused on the first 100–200 m of the sediment column, as this is generally the depth at which advanced piston coring (APC) is successful. Beyond these depths, the sediment column becomes more compacted, requiring extended core barrel (XCB) drilling. Contamination control protocols, developed during ODP Leg 185, and applied during most of the microbiological sampling thereafter, have shown that a substantial increase in penetration of contaminating drilling fluid into the sediment core occurs after the switchover to XCB coring [11,12,13]. Since contaminating microbes may mask or out-compete indigenous subsurface life, current practices focus on reducing the potential for contamination introduction, which has limited most microbiological research to APC-retrieved samples. While it may not be possible, with current drilling methods, to entirely eliminate the contamination of samples during XCB drilling, several studies suggest that the development of methods to investigate indigenous subsurface microbes, despite the presence of contaminating microbes, is worth pursuing [14,15]. Identifying the methods of handling the potential contamination of XCB coring would allow an increased usage of deeper samples for studies of the deep biosphere. Hence, another important feature of the present study, is the utilization of XCB-drilled sub-seafloor sediment cores, through the concurrent molecular analysis of both the sediment samples of interest, and the drilling fluid used in obtaining those samples.
Initial DNA-based studies of the sub-seafloor microbial community composition utilized PCR reactions, targeting the 16S rRNA gene, followed by the construction of clone libraries, in order to amplify DNA fragments prior to Sanger sequencing, from which one would generally obtain several hundred DNA sequences to analyze, as reviewed in [16,17]. In contrast, next-generation DNA sequencing methods, not only eliminate the need for extra steps involved in clone library creation, and thus reduce bias, but also reduce the time and cost of sample preparation. These high throughput sequencing methods allow a more confident assessment of microbial community composition, including the ability to analyze in-situ samples with different measures of contamination [18]. Given the nature of the sampling process used for sub-seafloor microbiology, it is important to have a solid understanding of the potential influence of drilling fluid contamination on molecular-based community composition and diversity analyses. While few studies have looked at the composition of drilling fluid microbial communities [14,19], there is still need for a comprehensive examination of the potential influence of those sequences on in-situ community analyses. A direct comparison of the lineages found in the sediment samples to those found in the drilling fluid, used in obtaining those samples, from both advanced piston coring (APC) and extended core barrel (XCB) methods, would allow for isolation of the in-situ signal. This type of analysis was recently produced for samples from the R/V Chikyu drilled by different methods, and the successful identification and removal of potential contaminants was demonstrated [18].
In the following, we present the first microbial community analysis of the Costa Rica Margin sub-seafloor environment, using 16 sediment samples obtained during IODP Expedition 334. We provide a thorough comparison of the community composition of the sub-seafloor sediment samples to that of a sample of the drilling fluid used to obtain the samples during coring operations. We used a 16S rRNA primer set, designed to target both domains for high throughput PCR-based sequencing. In order to provide some means of analyzing the accuracy of the primer set, as all PCR primers are subject to bias, we include further testing results of the primer set used on several environmental samples where the expected archaeal: Bacterial ratio is well known, and supplement PCR results with those of metagenomic sequencing, which does not utilize specific primers. We determine shifts in the community composition, with depth and with sampling site, and assess correlations between microbial taxa and environmental chemistry.

2. Materials and Methods

2.1. Sample Collection

Sediment samples were collected in March and April of 2011, from sites 1378 and 1379 of IODP Expedition 334, Costa Rica Seismogenesis Project (CRISP: Figure 1, Table S1). Detailed site descriptions can be found in the IODP Proceedings for Expedition 334 [5], but those descriptions are summarized as follows: Both sites were located along the Costa Rica Margin, on the upper plate of a convergent plate boundary between the Cocos plate and the Caribbean plate (part of the larger Middle America Trench system). At Site U1378, located on the middle slope region 38 km offshore of the Osa Peninsula of Costa Rica, sediment extended ~750 m to the upper-plate basement. Coring was successful down to a total of 523 m below seafloor (mbsf), at which point hole conditions prevented further drilling, with the first 128 m taken with the APC coring system before switching to the XCB system [5]. At Site U1379, located on the upper slope region 34 km offshore of Osa Peninsula, sediment extended ~890 m to basement. Coring was successful all the way through the sediment and into the upper basement, with the switchover from the APC to XCB system, occurring at 91 mbsf. The sediments at both sites were described as being dominantly silty clay to clay, with interspersed sandy layers (cm scale for Site 1378 and decimeter scale for 1379) [5]. At site 1378, tephra layers were observed between 0 and 128 mbsf, whereas tephras were located below 177 mbsf at Site 1379. Cell counts performed in the upper 250 m of sediments from Site 1378 and the upper 215 m of sediment from Site 1379 ranged from 106 and 108 cells per cubic centimeter and generally declined with depth [5].
Microbiology samples were obtained at intervals down to 500 mbsf at 1378 and 780 mbsf at 1379. The microbiology samples, retrieved during this expedition, were always taken from the section of sediment core immediately adjacent to samples used for pore-water geochemistry analyses. Further, samples were taken with great care to reduce any possible sources of outside contamination. Whole round sediment core samples were cut from the intact core sections on deck with sterile instruments. These whole round cores were subsampled with modified sterile syringes (luer-lock end removed to allow large opening) after the removal of the upper few millimeters of sediment from the core surface. Subsamples were then immediately placed into −80 °C freezers and were kept frozen until subsequent DNA extraction. Additionally, a sample of the drilling fluid, used during operations on this cruise, was taken directly from the supply in-use during drilling at site 1378 and stored at −80 °C until later DNA extraction.
Three additional samples were utilized for the purpose of supplementary testing of our 16S rRNA universal primer set. The Dead Sea water sample was obtained in 2007, and details have been previously described [21]. The Pacific Ocean seawater sample was collected during IODP Expedition 334, from sampling surface water while stationed at Site 1379 on 25 March 2011. Lastly, the anaerobic digester effluent sample was extracted from a lab-scale fixed-film anaerobic digester system located at Penn State University Department of Geosciences.

2.2. DNA Extraction

PCR-amplifiable DNA was successfully extracted from 9 samples from site 1378, 9 samples from site 1379, and the sample of drilling fluid. DNA was extracted using the PowerSoil DNA Isolation Kit (MO-BIO Laboratories, INC., USA) according to the manufacturer’s protocol with modifications as follows. For the sediment samples, 4 aliquots were used per sample, each 0.3–0.4 g. For the drilling fluid, 4 aliquots of 200 µL each were used. After the addition of solution C1 in the beginning of the protocol, the samples were incubated in a 65 °C water bath for 15 min. Following this step, for each sample, 2 of the replicates received 20 s. of bead beating and 2 received 30 s, and all 4 were combined during the elution step of the extraction, to concentrate retrieved DNA. The extractions for each sample were carried out independently to avoid cross-contamination, and each was done with a blank as well, to which no sample was added, but on which all steps of the procedure were carried out. A representative extraction blank was selected for sequencing as a quality control measure (though all blanks were checked with PCR and no bands were visible). Additionally, all extractions were performed in a laminar flow hood located in a PCR-free laboratory.
Extraction of DNA from the 3 supplementary samples used for primer validation was as follows: 1. Dead Sea sample: DNA extraction was carried out previously as described [21]; 2. Pacific Ocean seawater sample: Approximately 235 mL of the seawater sample was passed through a Sterivex-GV Durapore 0.22 µm filter (EMD Millipore Corp.), from which the filter was then removed and placed into a bead tube from the FastDNA Spin Kit for Soil (MP Biomedicals). DNA was then extracted following the manufacturer’s protocol. At the final step, DNA was eluted to a volume of 100 µL; 3. Anaerobic digester effluent sample: DNA was isolated, using a Powersoil kit (MoBio), according to the manufacturer’s instructions, with 40 s of bead beating.

2.3. 16S rRNA PCR and Amplicon Sequencing

For 16S rRNA analyses, a fragment of the gene encompassing the V6–V9 hypervariable regions was targeted with the primer pair 926F (5’- AAACTYAAAKGAATTGRCGG-3’) and a modified version of 1392R (5’-ACGGGCGGTGTGTRC-3’), developed previously for amplification of DNA from oil sands [21]. The primers were modified further with the addition of 454 Life Science’s A or B sequencing adapters, as well as multiplex identifier (MID) tags permitting multiple samples to be sequenced together. PCR reactions were set up utilizing illustra PuReTaq Ready-To-Go PCR beads (GE HealthCare), with 10 µM of each the forward and reverse primers, and 2 µL of extracted DNA in a total volume of 25 µL. PCR cycling conditions included an initial 5 minute denaturing at 94 °C, followed by 32 cycles (for Costa Rica sediment samples) of 1 min 94 °C, 30 sec at 53 °C, and 2 min at 72 °C, followed by a final 10 minute extension at 72 °C. For the Pacific Ocean seawater sample, only 25 cycles were needed, and for the anaerobic digester sample, 4 separate PCR reactions were run with 15, 20, 25, and 30 cycles, in order to analyze possible effects of cycle number on community composition analysis. PCR cycling conditions for the Dead Sea sample were as described [21]. All PCR products were gel-purified using a PrepEase Gel Extraction Kit (Affymetrix, Inc.) according to the manufacturer’s instructions. Sequencing was carried out at the Pennsylvania State University on a Roche 454 Genome Sequencer FLX+ sequencing system (454 Life Sciences) using Titanium chemistry. Amplicons were sequenced in one direction only.

2.4. 16S rRNA Amplicon Data Analysis

Sample demultiplexing was performed using the mothur package [22], as well as some preliminary quality controls, eliminating sequences shorter than 100 bp, with more than one mismatch in their barcode sequence, or with more than 2 mismatches in their primer sequence. In addition, sequences were screened by quality score using the “qwindowaverage” function in mothur, set at a quality of 35. Resulting individual fasta files were then processed with the NGS analysis pipeline of the SILVA rRNA gene database project (SILVAngs 1.0) [23]. This pipeline included alignment with the SILVA Incremental Aligner (SINA v 1.2.10 for ARB SVN (revision 21008)) [24] against the SILVA SSU rRNA SEED as well as quality control steps [23]. Specifically, reads that had fewer than 50 aligned nucleotides and/or more than 2% ambiguities or homopolymers were excluded from further analysis, as well as putative contaminants, artefacts, and reads with low alignment quality. The remaining sequences were de-replicated and clustered into OTUs on a per sample basis, using cd-hit-est (version 3.1.2) [25] running in accurate mode, ignoring overhangs, and applying identity criteria of 1.00, and 0.98, respectively. A reference sequence from each OTU was classified using a local nucleotide BLAST search against the non-redundant version of the SILVA SSU Ref dataset (release 115; [26]) using blastn (version 2.2.28+; [27]) with standard settings [28]. Because of some of the limitations in BLAST, classification was only assigned to a read if the value of the function (%sequence identity+% alignment coverage)/2 was greater than 93. Unclassified reads were assigned to the group “No Relative.” Classifications of the reference sequences were then mapped onto all reads within their respective OTUs. Additional information on the processing of sequencing blanks is available in the supplemental material.

2.5. Metagenomic Sequencing and Analysis
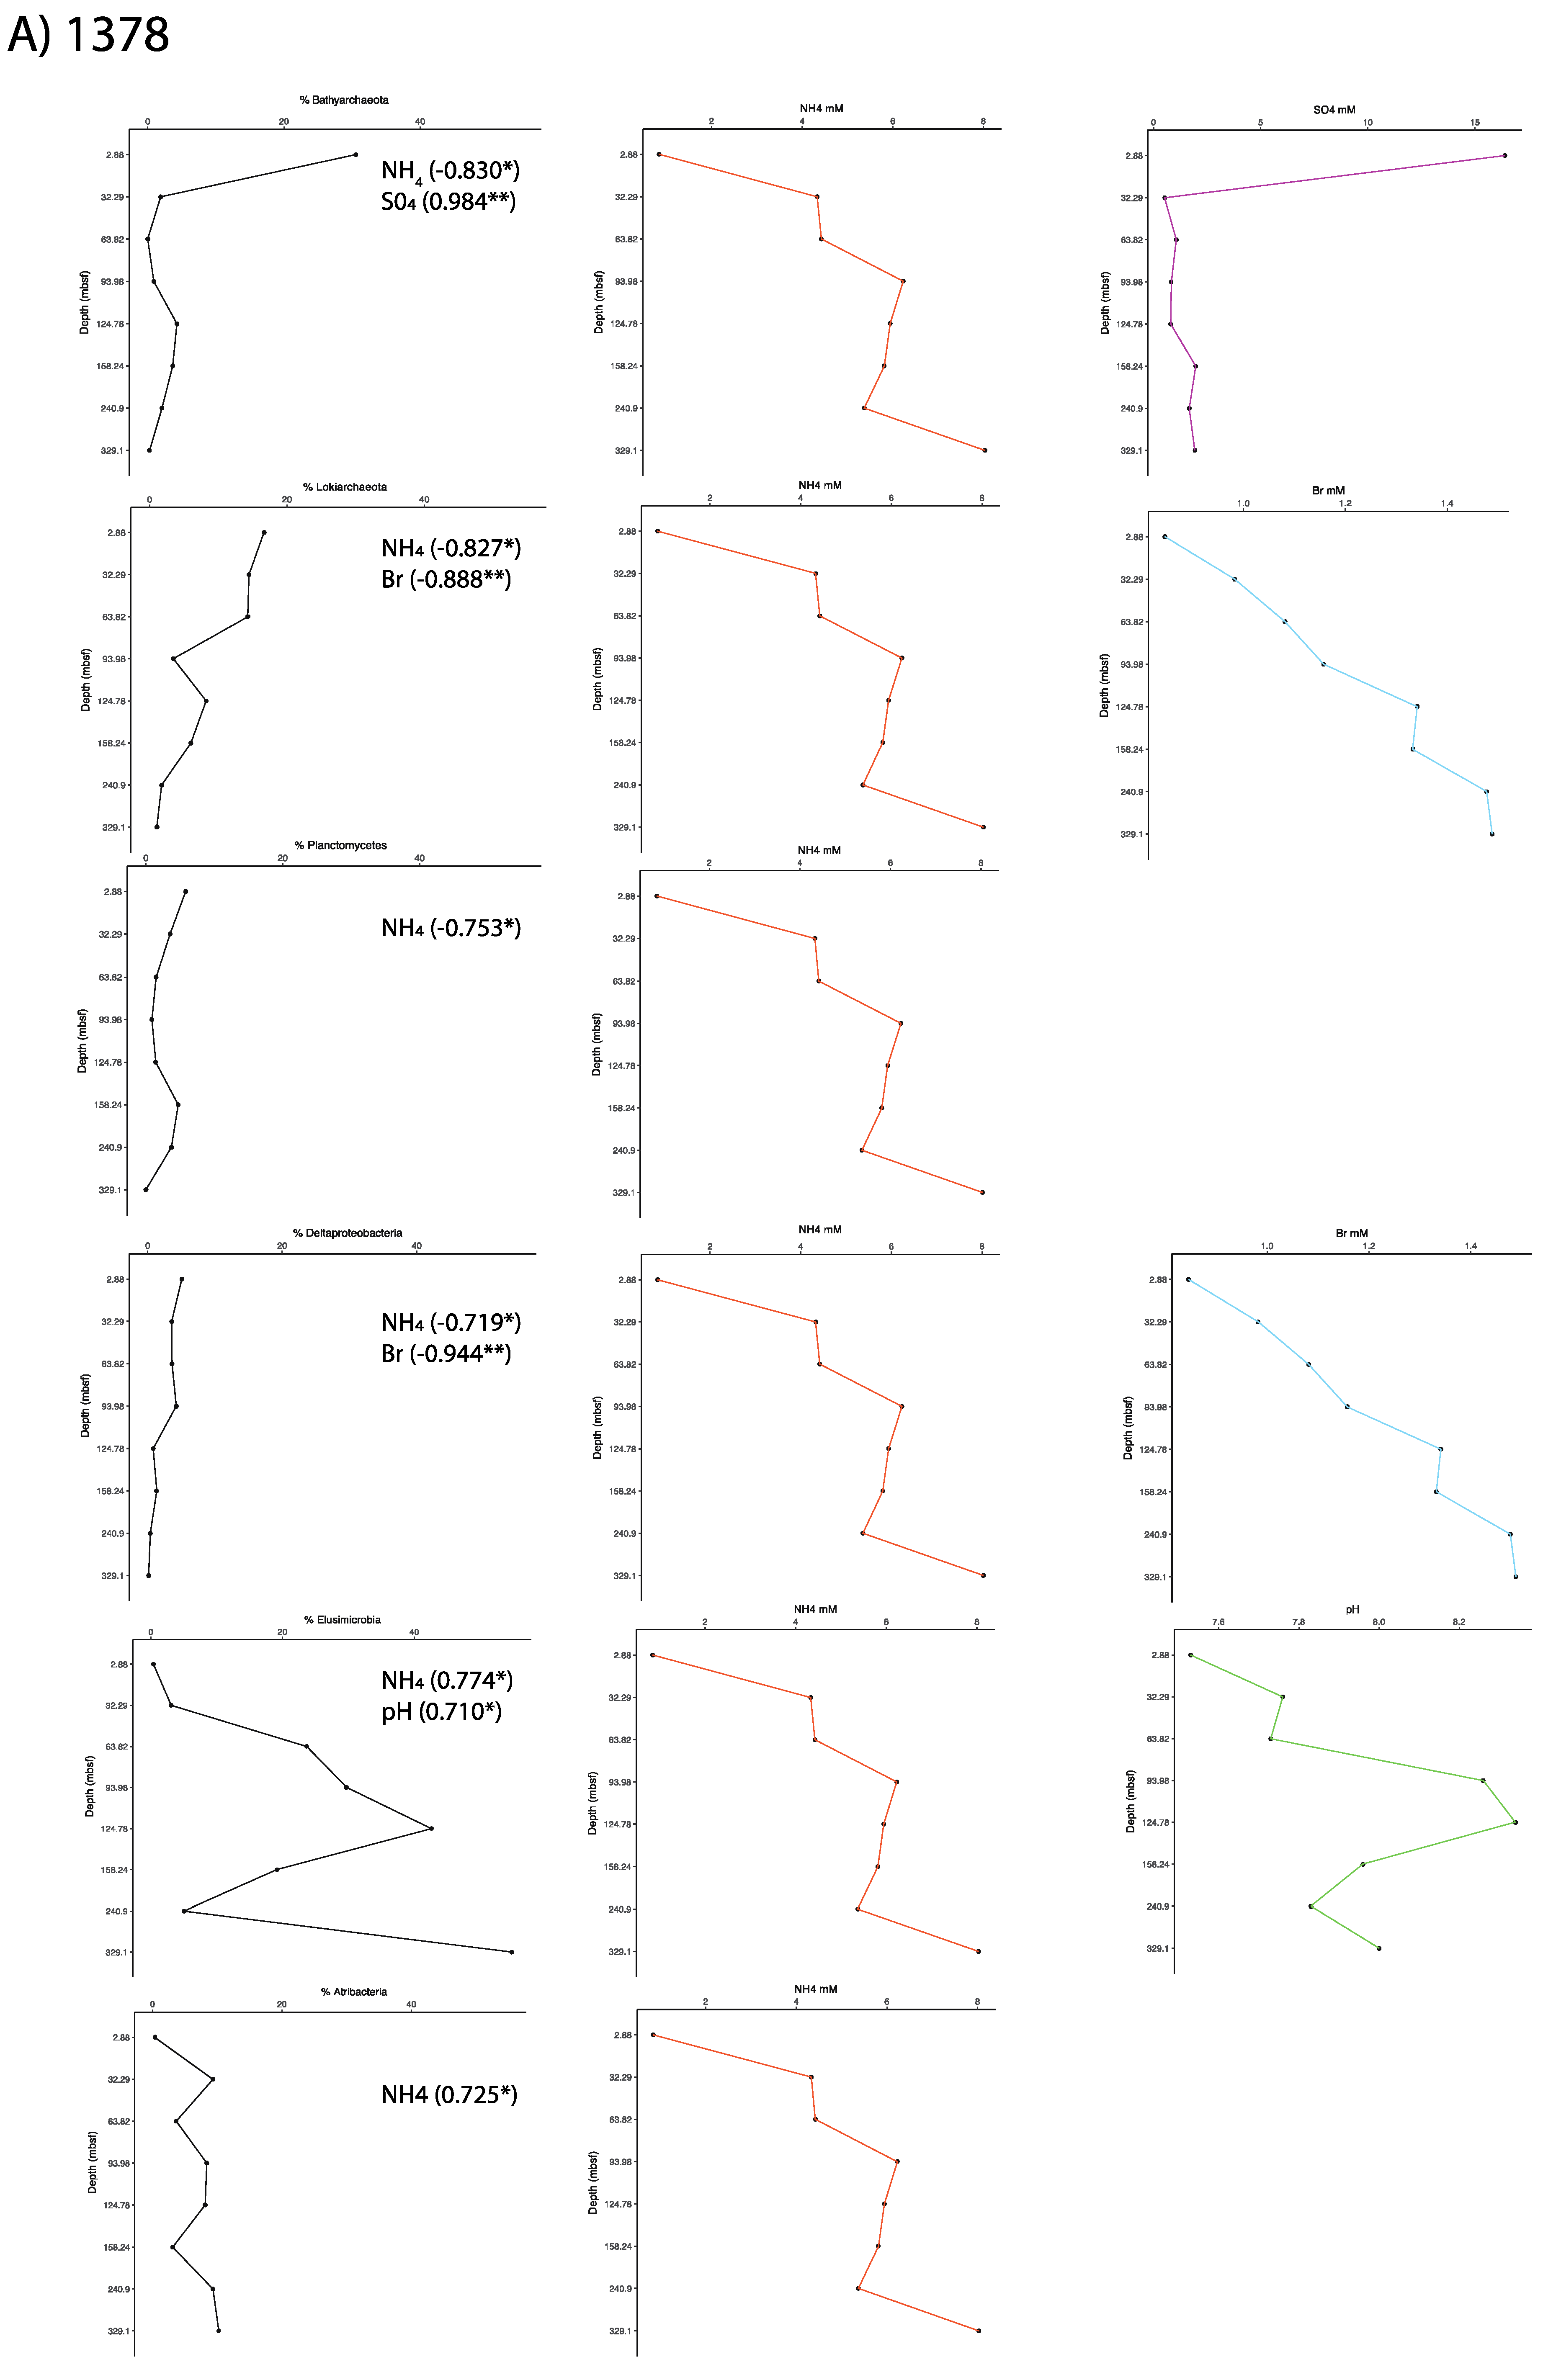
Five of the six Costa Rica sediment samples were sequenced on an Illumina HiSeq, while one was sequenced with 454 Life Sciences pyrosequencing technology. For the 3 samples from Site 1378, extracted DNA was sent to the Marine Biology Laboratory (Woods Hole, MA, USA) had libraries constructed and were sequenced on an Illumina Hiseq 1000. Libraries were constructed to be ~170bp long molecules with ~25–30 bp partial overlap between pairs of reads. Each sample received 1/6th of a lane of sequencing. The sample from 2.88 mbsf had 79,382,253 sequences, 32.29 mbsf had 33,398,960 sequences and 93.98 mbsf had 31,536,056 sequences. For 2 samples from site 1379 (22 mbsf and 45 mbsf) extracted DNA had libraries were constructed with a 350 bp insert and was sequenced by the Schuster lab at Penn State University on an Illumina HiSeq 1000. Each sample received about 1/9th of a lane of sequencing. After removal of adapter sequences, and due to quality issues the first 15 nucleotides and any sequences with ambiguous bases, the sample from 22 mbsf had 118,990,546 sequences, and that from 45 mbsf had 19,804,126 sequences. One additional sample from 1379 (3 mbsf) was sequenced with a different method as it was originally sequenced for a different study. This sample was also sequenced by the Schuster lab, but on a Roche 454 Genome Sequencer FLX sequencing system (454 Life Sciences) with Titanium chemistry. The sample had 300,922 sequences with an average length of 529 bp. Metagenomic sequencing information for primer validation samples is provided in the supplementary material.
Metagenomes, resulting from the 454 sequencing platform, were quality controlled using the prinseq program [29]. Parameters were set to remove any sequence shorter than 60 bp, longer than 800 bp, with an average quality score less than 20, with greater than one ambiguous base, and all replicates. Metagenomes resulting from Illumina sequencing were quality controlled using the trimmomatic program [30] and default parameters. All metagenomes reads were subsequently assigned to taxa using the Kaiju web server [31]. Reads were annotated against the nr + euk database using the greedy run mode with a minimum match length of 11, minimum match score of 75, and five allowed mismatches. Metagenomes were also classified using marker genes by the PhyloSift program using default parameters [32]. In order to standardize analysis across sequencing platforms, we found that using 1 million of the shorter, paired-end Illumina reads, resulted in a similar percentage of protein coding genes being detected as the full dataset (300K reads) of the longer 454 reads.

2.6. Correlations

Geochemical data was obtained from the IODP data repository, with refinements from a shipboard geochemist ([5]; E. Solomon, pers. comm.; (Br Data) [33]; (Sr, B, and Li Data) [34]). The software package SPSS Statistics (IBM) was used to run bivariate correlations between microbial phyla and geochemical parameters, using the default settings for this function. For each phylum, all geochemical correlations were run simultaneously, allowing for the calculation of significance values taking into account the total number of variables tested. These tests produced Pearson Correlation Coefficients and associated significance values (from a 2-tailed test) for each pair of variables tested.

2.7. Accession Numbers

All new amplicon and metagenomic datasets for this study have been deposited in the EMBL-EBI European Nucleotide Archive (ENA) under the study accession number PRJEB11766. The metagenomic and amplicon datasets from the Dead Sea samples were obtained from previously published studies [21,35].

3. Results and Discussion

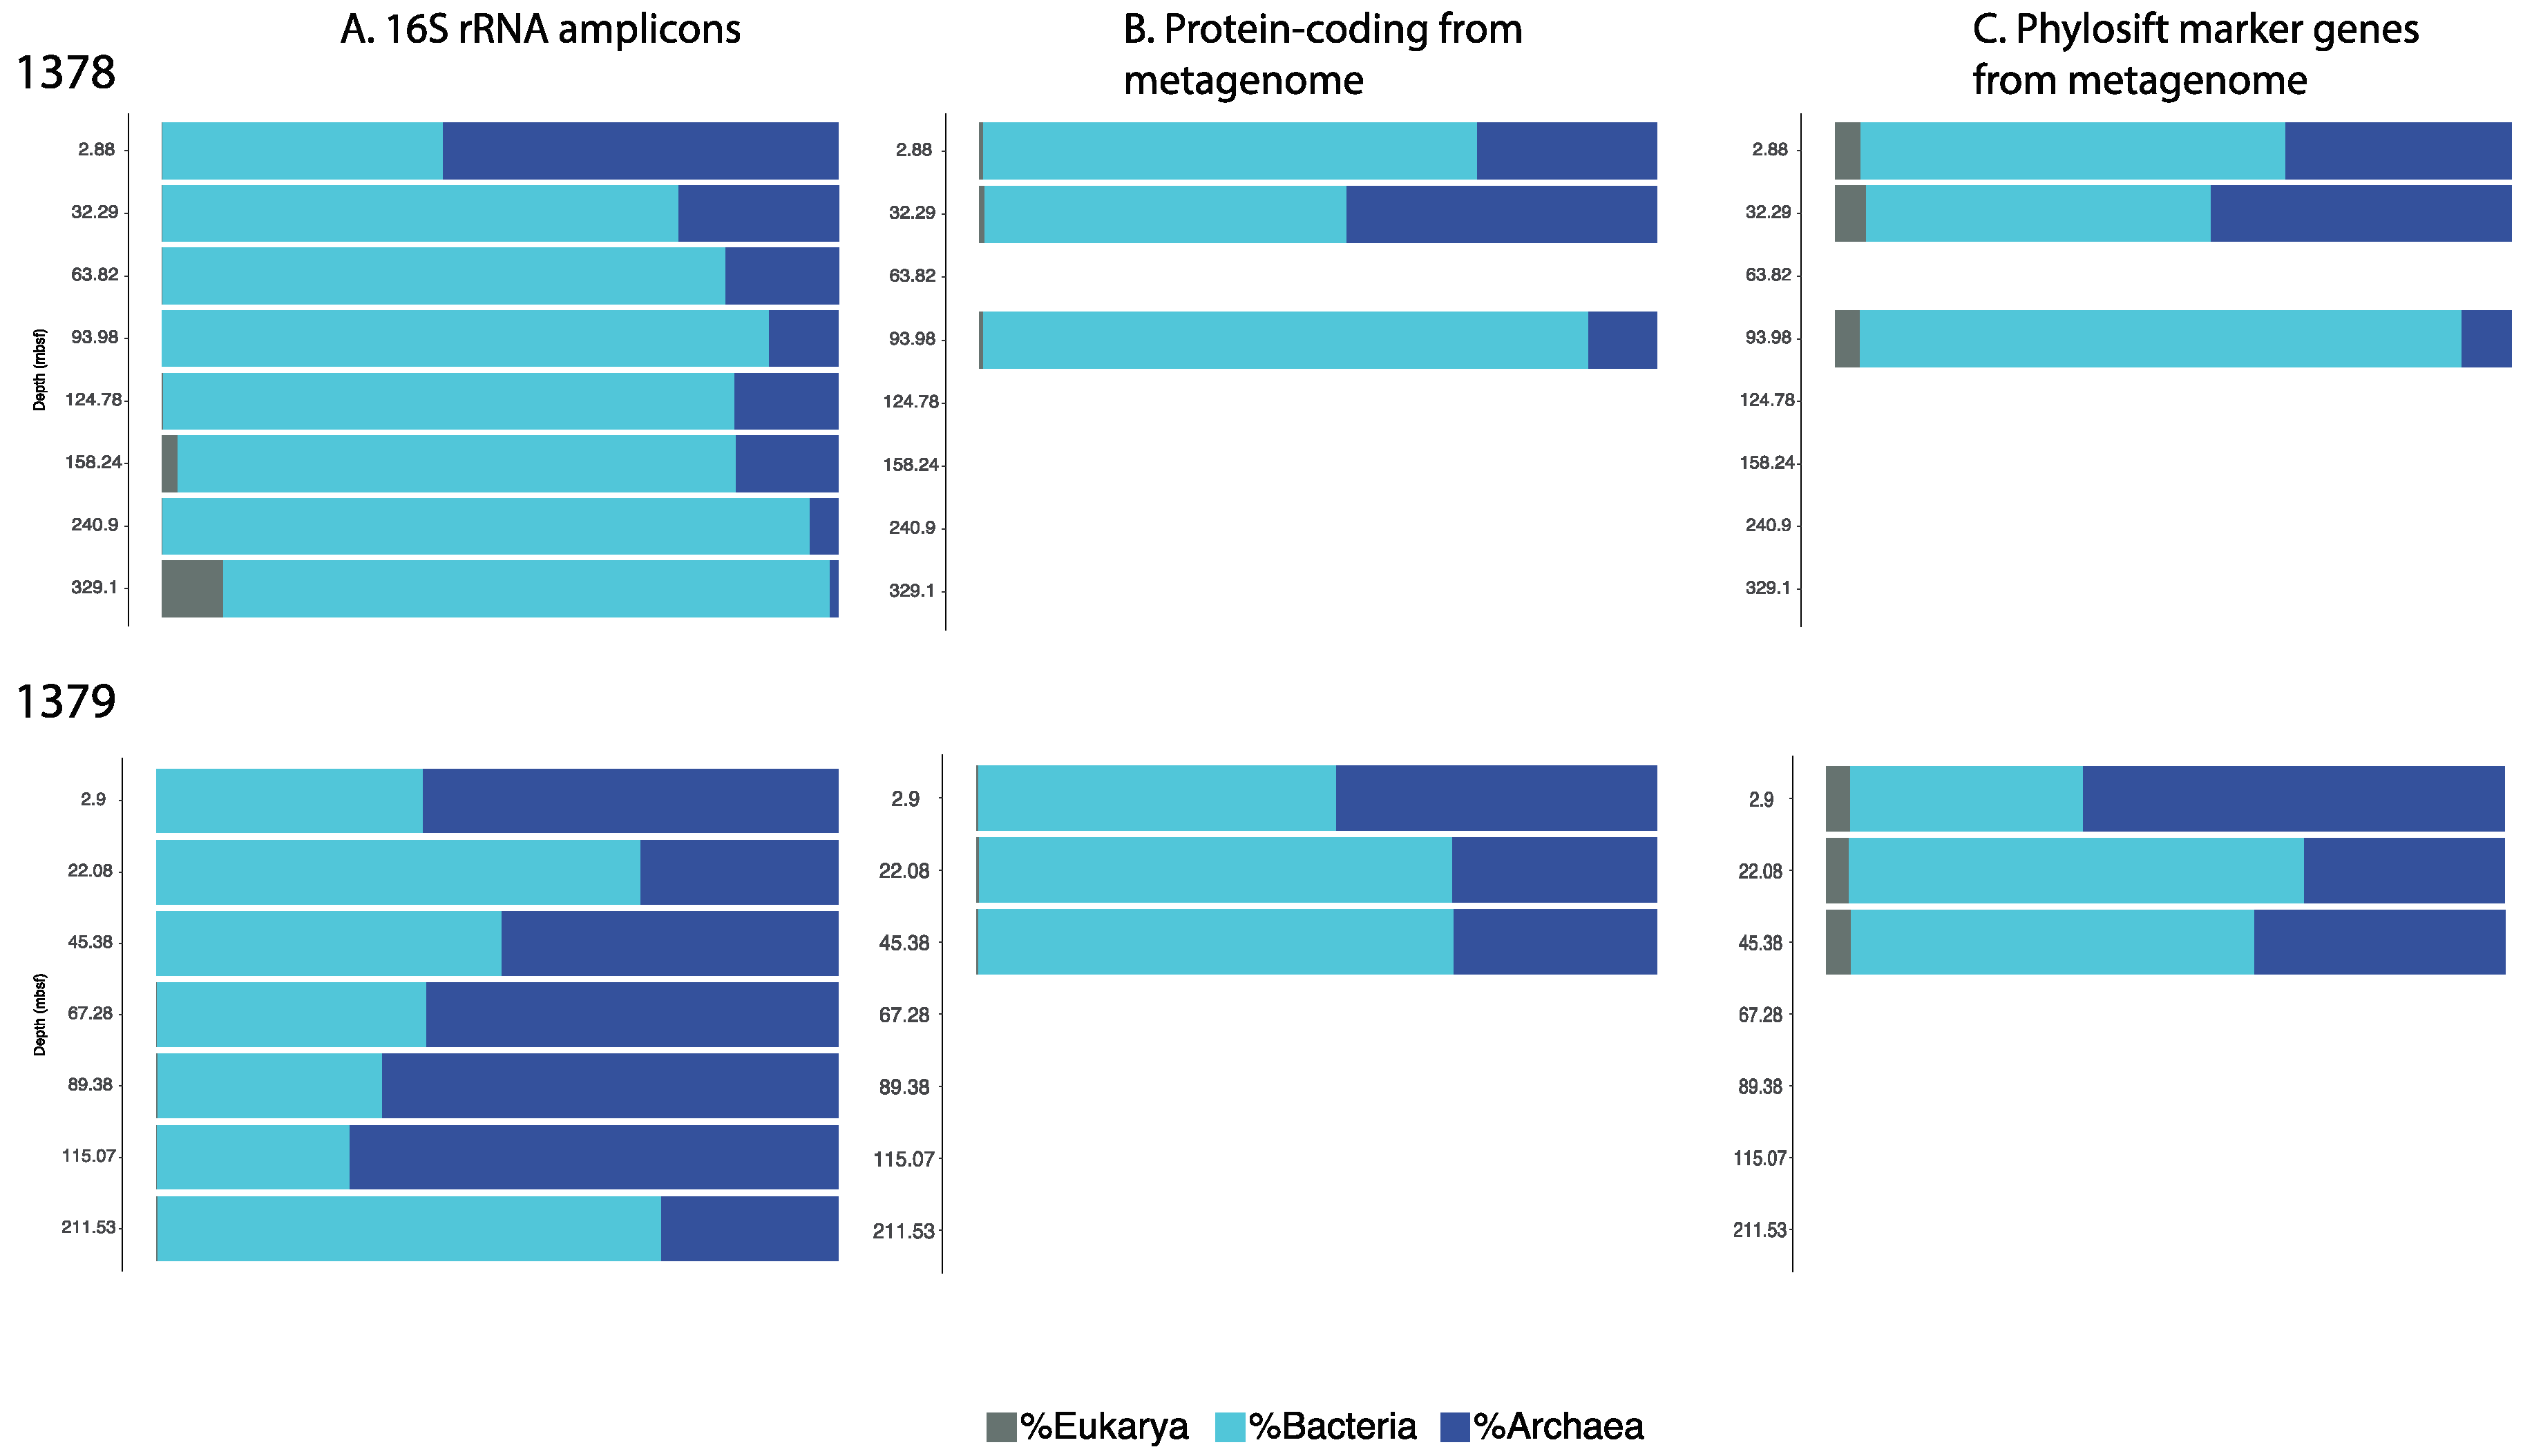
3.1. Microbial Community Analysis Reveals High Proportion Archaea

Eight samples from Site 1378, and seven samples from Site 1379, were used to examine the microbial community composition of the Costa Rica Margin sub-seafloor environment by amplicon sequencing using universal primers. Examining the results of the 16S rRNA data analysis, we found a significant proportion of archaea represented at both sites (Figure 2, Panel A). For Site 1378, the proportion of total classified amplicon sequences identified as Archaea was 58.4% for the shallowest sample examined (2.88 mbsf). The proportion of archaea then declined to 23.7% at 32.29 mbsf, which is no longer greater than bacteria, but a significant portion of the population remaining through 158.24 mbsf. The lowest proportion was then observed at the greatest depth, with only 1.3% of sequences from the 329.1 mbsf sample. At Site 1379, sequences identified as archaea made up 60.9% of classified amplicon sequences for the shallowest sample analyzed (2.90 mbsf), out-numbering bacterial sequences from that depth. However at this site, archaea remained dominant with depth, with more archaeal sequences than bacterial sequences at 3 additional depths: 67.28 mbsf (60.4%), 89.38 mbsf (66.9%), and 115.07 mbsf (71.7%). Of the 3 depths where this was not the case, the lowest that the archaeal proportion dropped was to 26.0% of sequences identified, which occurred in the deepest sample at 211.53 mbsf. It should also be noted that the greatest proportion of archaea at Site 1379 occurred not in the shallowest sample, but rather at 115.07 mbsf (71.7%).
One of the major differences in these sites is sedimentation rate, which would potentially vary the composition of organic matter at depth [5]. More archaea may be at Site 1379, due to its nearly doubled sedimentation rate compared to Site 1378, which suggests more readily available organic matter is delivered to depth. Previous margin work suggests the majority of subsurface archaea are heterotrophic and would be reliant on this organic matter [9,10]. However, detailed measurements on the state of organic matter are not available from this site and beyond the scope of the current study, leaving us with this testable hypothesis for the future.
While the primers were not designed to target Eukaryotes, some matches occurred, and were left in the domain-level analysis, in order to show that there is evidence of a Eukaryotic signature in some locations at these sites (Figure 2; Panel A). Because the primers are not optimized for Eukaryotes, however, it should be cautioned that these data likely do not provide an accurate representation of the abundance or diversity of Eukaryotes. In the domain-level analysis presented, the matches to Eukaryote sequences represented much less than 1% of the total classified sequences for most samples, with exceptions at Site 1378 of 2.3% identified at 158.24 mbsf and 9.1% identified at 329.1 mbsf.
Due to the known bias created by PCR primers, we endeavored to assess the utility of our primer set as “universal” 16S rRNA primers through several confirmation tests. First, we used a second method of analysis on a selection of our Costa Rica Samples to see if any significant discrepancies were observed. We performed metagenomic sequencing on 3 samples from Site 1378 and 3 samples from Site 1379. Metagenomic sequencing does not rely on specific PCR primers, and so bias from primer specificity is not a factor, although other biases still exist. The 6 samples used for metagenomic sequencing were chosen with the aim of getting representation at multiple depths, but limited by the fact that our metagenomic sequencing procedure required a higher concentration of DNA for success, and many of our deeper samples did not produce enough DNA without using whole genome amplification, which would have further biased the results.
The metagenomic sequences were classified using two different methods, again for purposes of comparison, in this case due to possible database bias. The first method was to obtain taxonomic information from all protein-coding sequences using the program Kaiju, which ranged from 8 to 16% of the total data [31] (Figure 2, Panel B), and the second was to use only single-copy phylogenetically informative marker genes using the PhyloSift platform [32] (Figure 2, Panel C). Both methods of metagenomic sequence analysis of the selected samples corroborated the idea that archaea are a significant portion of the microbial community at these two sub-seafloor locations. The proportions of archaea to bacteria differed in some samples compared to the amplicon analysis however, so the true trend of archaeal abundance with depth at these sites is difficult to determine from these data.
In addition to the metagenome to amplicon comparison of the Costa Rica sub-seafloor samples, we also assessed the primer set using a similar comparison on three well-characterized environments not directly related to this study, with known, and differing, archaeal proportions. Sequence results from both methods again (amplicon sequencing and metagenomic sequencing) were obtained from a water sample of the Dead Sea (archaeal dominated environment), a Pacific Ocean surface seawater sample (a bacterial dominated environment), and an effluent sample from a laboratory microbial anaerobic digester (bacteria dominated but with a significant number of archaea as well). In all cases, the archaea-to-bacteria ratio remained highly consistent (Figure 3). For the archaeal-dominated Dead Sea, the archaea comprised 95.3% of protein-coding reads from the metagenome, 92.2% of the marker genes from the metagenome, and 98.4% of the amplicon dataset. For the bacterial-dominated sample, Pacific Ocean seawater, archaea comprised 2.9% of the protein-coding reads from the metagenome, 11.8% of the marker genes from the metagenome, and 10.2% of the amplicon dataset. For our second bacterial-dominated sample, anaerobic digester effluent, archaea made up 16.4% of the protein-coding reads from the metagenome, 16.9% of the marker genes from the metagenome, and 14.4% of the amplicon dataset, measured after 25 PCR cycles. For this sample, we also examined the possible changes in bias, due to number of PCR cycles, and thus have data representing the composition at 15, 20, 25, and 30 PCR cycles (Figure 3). While this analysis shows an increase in proportion of archaea with cycle number (6.4%, 8.2%, 14.4%, 19.1%, respectively), that proportion remains well below the proportion of bacteria and still very close to results from the metagenomic analysis. These results show that in these three separate environments, the primer set successfully approximated the expected archaeal ratio when compared to that obtained from metagenomic analysis, and when compared to the ratio expected for these domains in these well-studied environments.

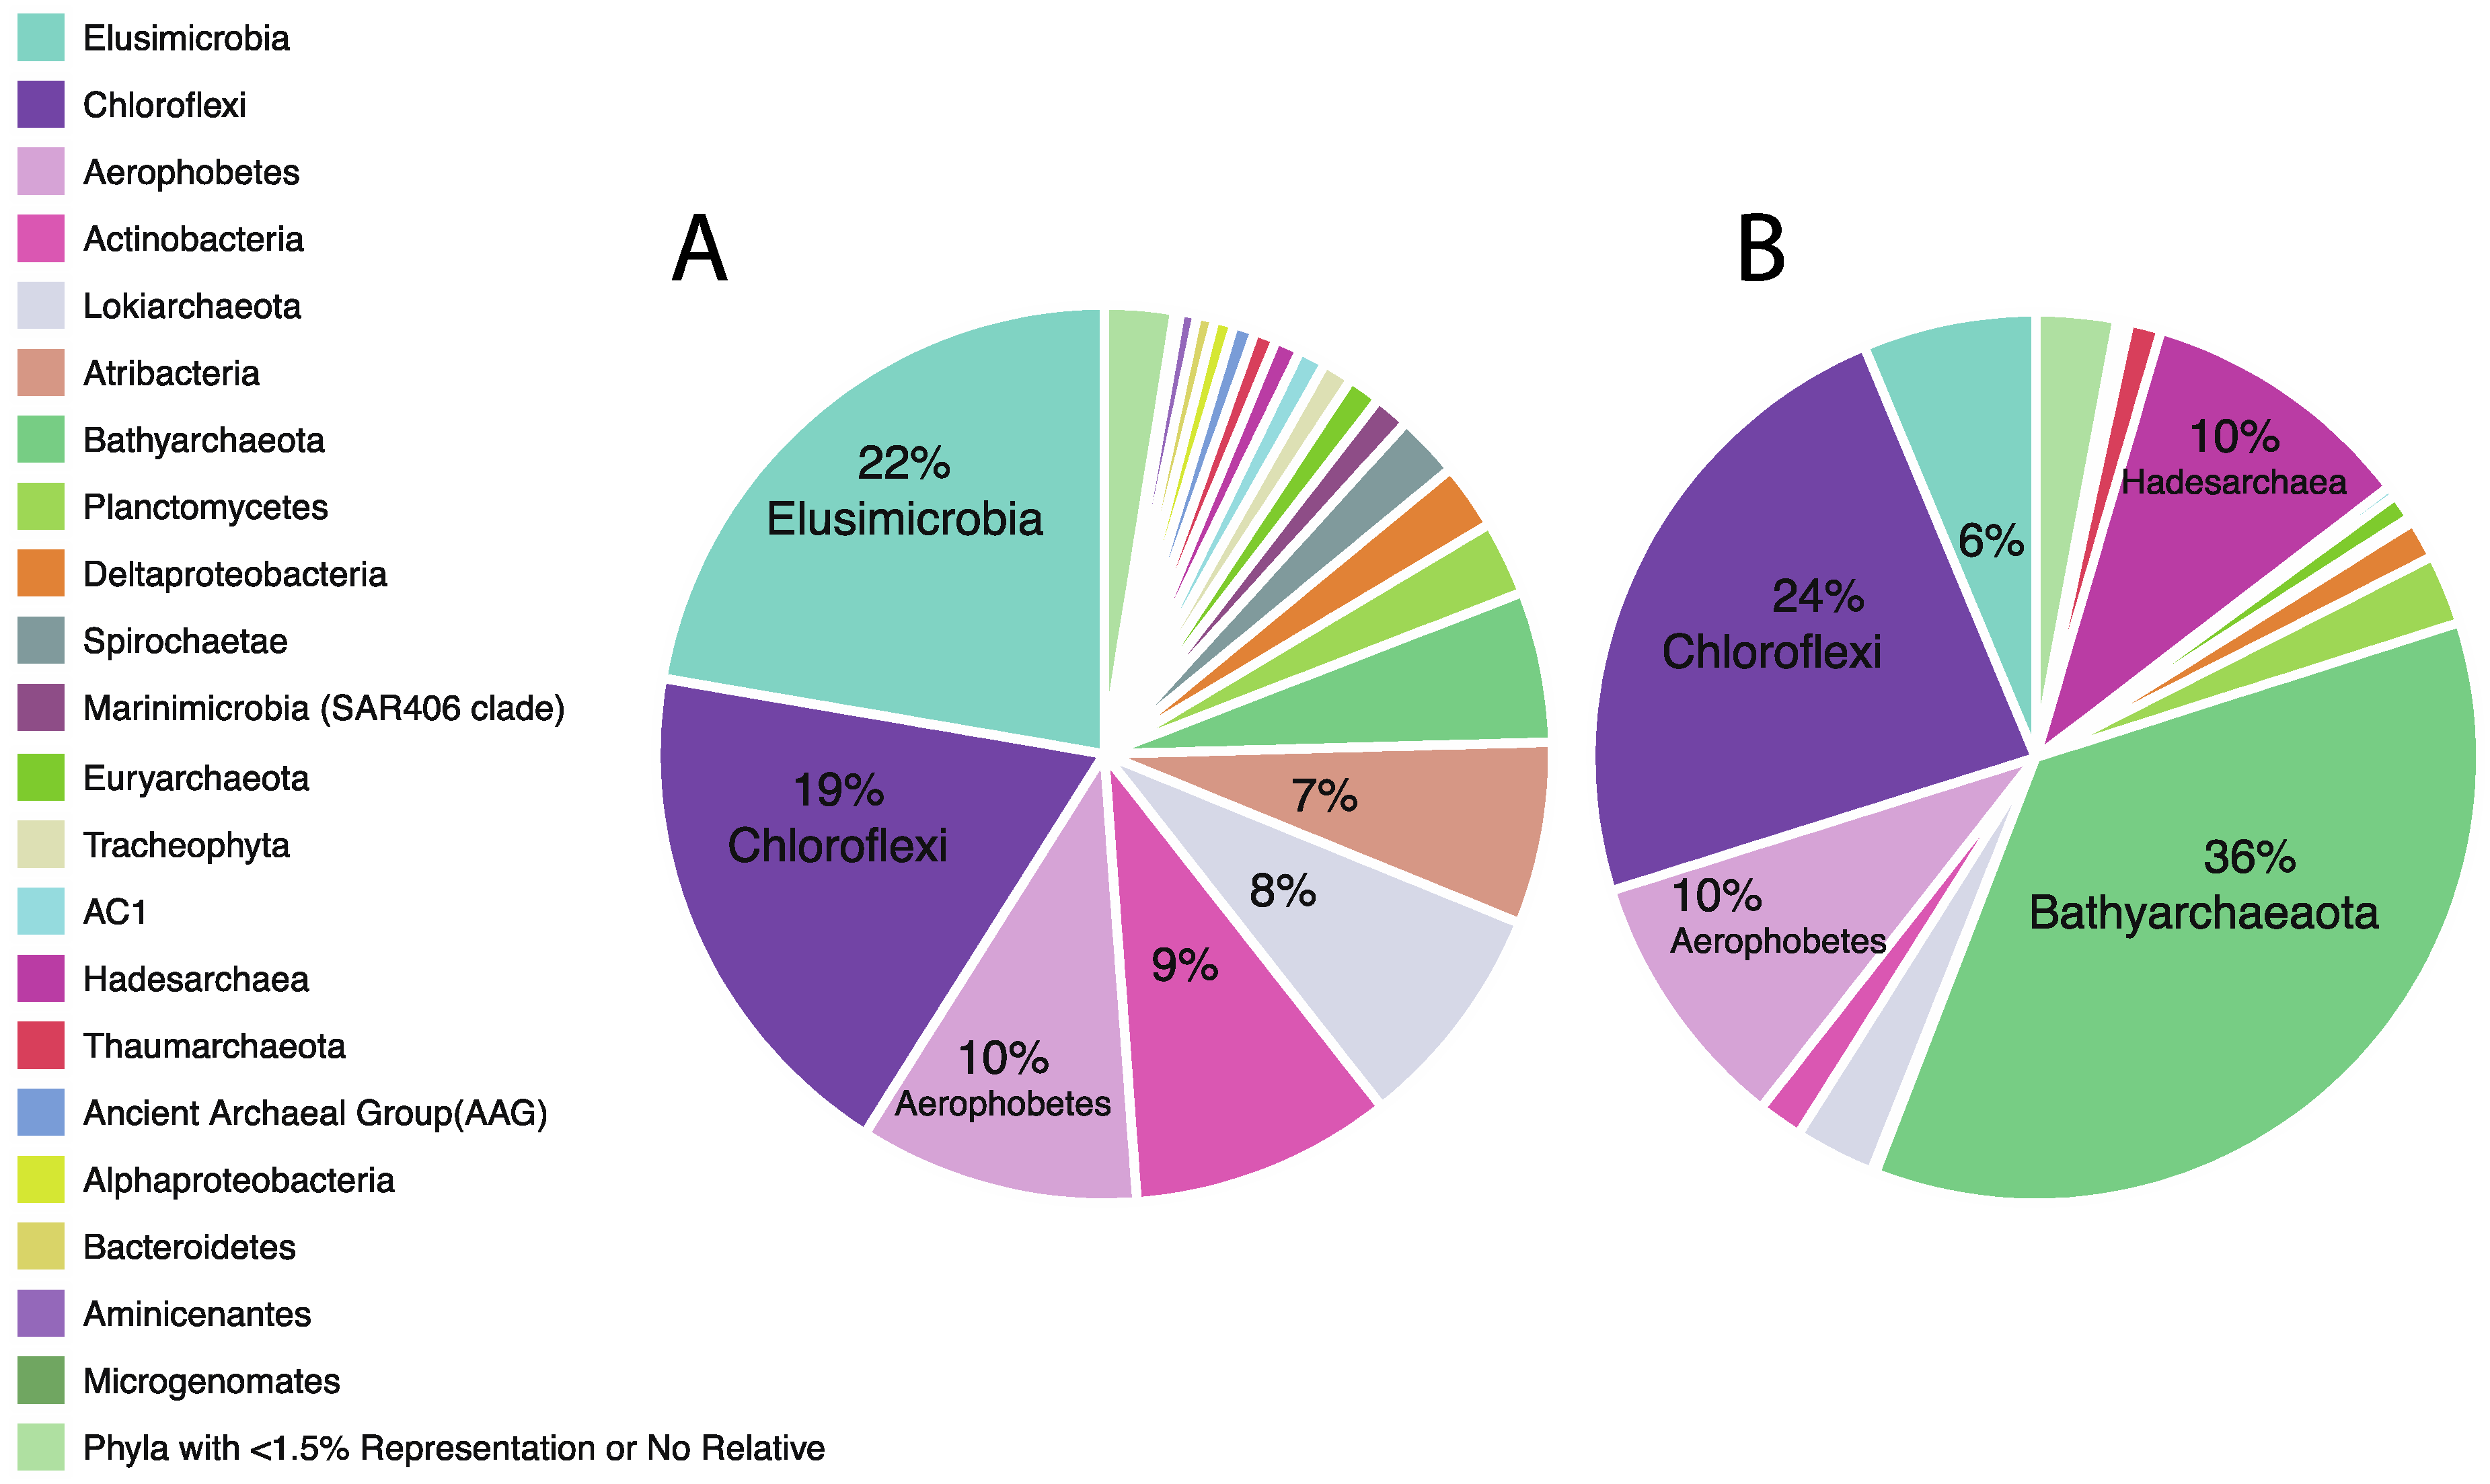
3.2. Taxonomic Analysis Beyond the Domain Level

At the phylum level, when considering each site as a whole (all depths examined together), the dominant phyla identified were Elusimicrobia, Chloroflexi, Aerophobetes, Actinobacteria, Lokiarchaeota, and Atribacteria for Site 1378, and Bathyarchaeota, Chloroflexi, Hadesarchaeota, Aerophobetes, Elusimicrobia, and Lokiarchaeota for Site 1379 (Figure 4). One of the most notable differences in phylum-level composition between the two sites, is the difference in abundance of Bathyarchaeota, being much more abundant at Site 1379. Examining the Bathyarchaeota (formerly known as Miscellaneous Crenarchaeotal Group, MCG) with depth at each site (Table 1), the phylum is present in a high proportion, at both sites, at the most shallow depth examined, 30.54% for Site 1378, and 34.81% for 1379. However, while that proportion remains high and even goes higher at times with depth at Site 1379, it is fairly low at all other depths of Site 1378. Bathyarchaeota have been found to be common and widespread in the sub-seafloor environment, and their metabolic capabilities are very broad, including acetogenesis, methane metabolism, dissimilatory nitrogen and sulfur reduction, and others [36]. In this taxonomic classification, bathyarchaeal sequences were not able to be further sub-classified beyond the phylum level.
When examining which phyla appeared less often in 1379 as compared with 1378, the most notable is the Elusimicrobia, so it may be that Bathyarchaeota is occupying a niche space of Elusimicrobia, at Site 1379, and vice versa. Previously, Bathyarchaeota have been described as anaerobic protein degrading microbes [36], which is similar to the functions given to Elusimicrobia, determined in the termite gut [37]. Examining the trend with depth, at Site 1378 Elusimicrobia are present in low abundance at 2.88 mbsf and 32.39 mbsf, but then are prominent over the next 4 depths examined, from 63.82 mbsf to 158.24 mbsf, dipping some at 240.90 mbsf before soaring to 54.81% at 329.1 mbsf. At Site 1379, Elusimicrobia reach notable proportions at only 2 depths, 45.38 mbsf and 211.53 mbsf, but are still present throughout all samples (Table 1). Other notable taxa that are present in lower abundance at Site 1379 and therefore may be influenced by the dominance of Bathyarchaeota include Actinobacteria, Atribacteria and Lokiarchaeota. Also notable, at Site 1378 when Elusimicrobia dips to only 5% of the sequence reads at 240.90 mbsf, Actinobacteria rises to 44.58% of all sequences for that depth, its highest prominence by far. For that 1378 sample, the rise in Actinobacteria was nearly all due to sequences classified as group “OPB41,” which was also the most common Actinobacteria in numerous other samples as well.
While some taxa seemed to vary greatly between the two sites, others were very similar. Chloroflexi, for example, appeared to have a similar abundance in both Site 1378 and 1379 (Table 1). In addition, the abundance with depth for Chloroflexi was also generally stable, ranging from about 13-28% in most samples. One exception was found in the deepest sample examined at Site 1378 (329.1 mbsf) where the proportion was considerably lower than normal at only 5.52% of all sequences. Within that sample, Elusimicrobia reached its high at 54.81% of all sequences, but Spirochaetae also had a substantial increase, as well as in influx of eukaryal sequences matching to conifers (Tracheophyta; Spermatophyta; Pinophyta; Pinales), likely from either preserved organic remnants or possible contamination. Chloroflexi also went higher than typical in one sample, comprising 47.48% of all sequences at 22.08 mbsf, Site 1379. Within that sample, actinobacterial sequences were also found at their highest proportion for Site 1379 (7.85%), and bathyarchaeal sequenced showed a notable drop (18.21%).
Aerophobetes was another phylum that showed similar abundance in Site 1378 as 1379, however the abundance of this phyla with depth was somewhat less stable (Table 1). At Site 1378, its abundance ranged from 0.38% to 20.05%, with the highest amounts occurring at mid-range depths, while at 1379, it ranged from 2.40% to 8.68% from 2.90 to 115.07 mbsf, but reached 36.96% in the deepest 1379 sample at 211.53 mbsf. Aerophobetes is one of many taxa found in sub-seafloor sediments for which still little is known about its diversity and metabolic capabilities, though some previous work has provided evidence of acetogenic fermentation in at least some members [38]. Aerophobetes sequences could not be classified beyond the phylum level.
Overall, the two sites show a large amount of divergence in their relative compositions. This is surprising, considering that the sites are geographically close (Figure 1), and very similar in lithologies with clay, claystone, silt, siltstone, sand and sandstone, and pore water chemistry profiles, showing sulfate and methane transition zones, with sulfate being removed at 14 mbsf at Site 1378 and 30 mbsf at Site 1379 [5]. As most of the dominant microbial phyla in these sites have very few or no cultured representatives, very little is known about their habitat preferences and possible metabolic strategies [39]. In order to examine possible influences of environmental parameters on community composition at these sites, bivariate correlations were carried out between relative abundance of phyla in the sediment samples and available pore water chemistry variables. Correlations were performed simultaneously for all chemical variables to provide a measure of statistical significance. Significant correlations (<0.05, 2-tailed test) to environmental parameters were found for Bathyarchaeota, Lokiarchaeota, Planctomycetes, Deltaproteobacteria, Elusimicrobia, Atribacteria, and Aerophobetes (Table S2, Figure 5). Many of the chemistry variables also co-varied with depth and with each other, so depth correlations, to the chemistry variables examined, are also given for reference (Table S2). While some correlations were seen with magnesium, lithium, and boron (Table S2), we excluded them from further analysis due to the fact they are typically uninvolved in anaerobic microbial metabolisms (Figure 5).
For Site 1378, significant correlations were observed between available pore water chemistry data and Bathyarchaeota, Lokiarchaeaota, Planctomycetes, Deltaproteobacteria, Elusimicrobia and Atribacteria (Table S2; Figure 5). The presence of many significant correlations, which generally all correlated with depth as well, complicates any interpretation. While co-variance with depth does not preclude any significant relationships to microbial phyla, it is difficult to determine from these data alone, whether or not the trend was due to a direct relationship or a consequence of co-variance. The relationship with sulfate, however, was an exception in that sulfate did not correlate significantly with depth, but did show a significant positive correlation with Bathyarchaeota (0.984). However, Bathyarchaeota are in higher abundance at Site 1379, yet no such relationship with sulfate was seen. Relationships of Bathyarchaeota with sulfate or sulfide may only be able to be seen at individual group levels, which are difficult to determine with the short sequences used in this study [40].
The increase in ammonium, with depth in the sediment column, is generally attributed to the breakdown of organic matter by heterotrophic organisms. At Site 1378, as Bathyarchaeota, Lokiarchaeota, Planctomycetes, and Deltaproteobacteria decline in proportion with depth, they show a negative correlation with ammonium, which is also likely the reason for the Lokiarchaetoa and Deltaproteobacteria to show negative correlations with bromine, which tends to increase at depth. Elusimicrobia and Atribacteria, show a positive relationship with ammonium (0.774 and 0.725, respectively), suggesting that they might be a part of the active heterotrophic community at this site (Figure 5). At Site 1379, candidate phylum Aerophobetes has a similar positive correlation with ammonia (0.759), and additionally has a concurrent positive relationship with bromine (0.871). The Aerophobetes have previously been suggested to be anaerobic autotrophs performing hydrogen oxidation, but more diversity may be found in this group [39]. The correlation in this study could be suggestive of a potential relationship to the degradation of brominated organic matter, a metabolism of interest to the sub-seafloor research community [41,42,43]. Also at Site 1379, Planctomycetes showed a positive correlation with sulfate (0.955), but this is likely due to the decrease in cells with depth, as had been seen for the previous ammonium correlations. Finally at Site 1379, Lokiarchaeota and Bathyarchaeota correlated with ammonia, in opposite trends, with Lokiarchaeaota correlating negatively and Bathyarchaeota correlating positively (Table S2; Figure 5).
While significant correlations between pore water chemistry data and microbial phyla are not strong evidence for microbial metabolisms, some of the relationships seen here hint at possible metabolic causes and can guide current efforts underway to rebuild metabolic profiles from the metagenomics datasets in this study. Geologic parameters may also exert influences, including proximity to the subduction zone as Site 1378 is closer, but this is difficult to precisely constrain for this study [5].

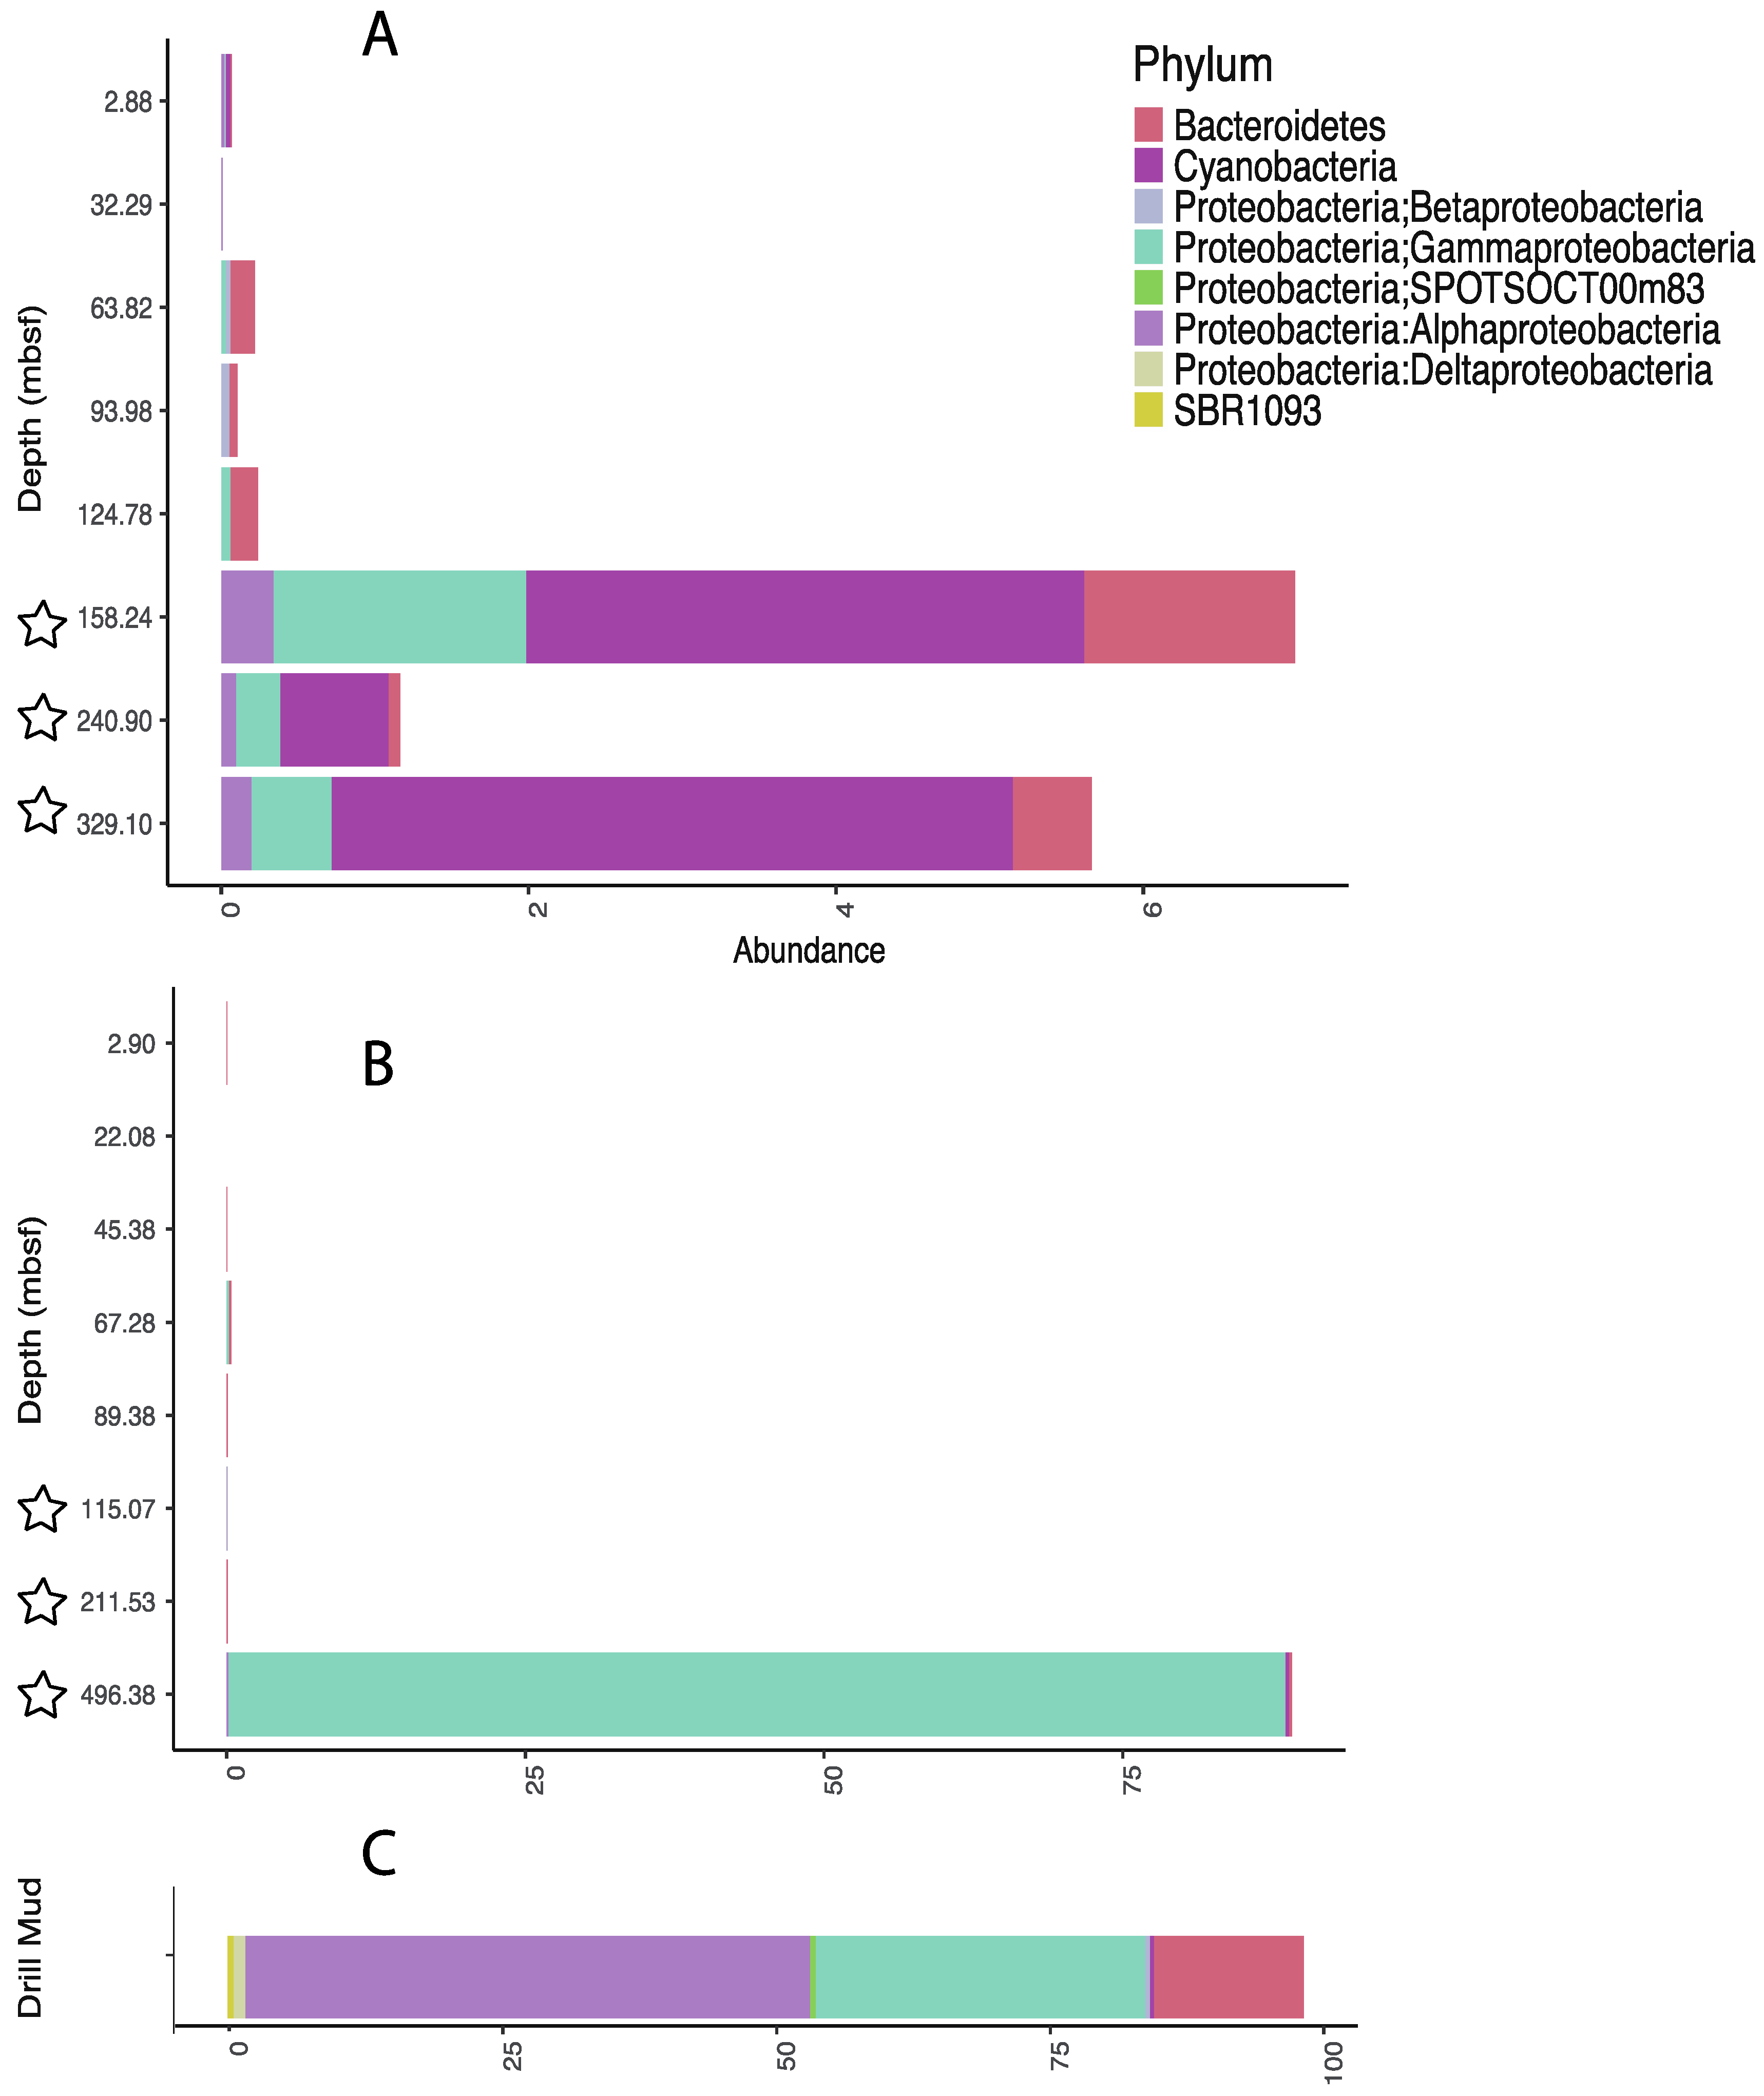
3.3. Influence of Drilling Fluid

A sample of drilling fluid was obtained directly from the supply utilized during drilling operations of IODP Expedition 334, which included seawater, as well as a mineral component. The sample was processed and sequenced in the same manner as sediment samples obtained from Sites 1378 and 1379 drilled during this expedition. The classification of sequences from the drilling fluid was examined, and sequences were found to be primarily from Alphaproteobacteria, Gammaproteobacteria, and Bacteroidetes (for full list of classified sequences see Table S3). The sequences in the drilling fluid were then carefully compared with those in the sediment samples in order to assess the potential influence of drilling fluid on microbial community analysis using universal 16S rRNA amplicon sequencing (Figure 6).
For samples taken by the APC coring system, these sequences made up no more than 0.2% of the total classified reads from Site 1378, and no more than 0.4% of total classified reads from Site 1379. At Site 1378, there was a noticeable increase in the proportion of the potential drilling-fluid-sourced sequences in samples taken with XCB coring (158, 241, and 329 mbsf); however, their percentages were still relatively low with respect to the total identified reads (7.0, 1.2, and 5.7 % respectively). At Site 1379, the proportion of potential drilling-fluid-sourced sequences in samples taken with XCB coring remained as low as the APC cored samples from 115 and 212 mbsf (0.5, and 0.10%, respectively), but was very high (89.2%) in the deepest sample (496 mbsf), due to an unusually high number of sequences in one particular lineage of Gammaproteobacteria, the genus Oceanospirillum (Figure 6).
Significantly, in nearly all samples examined, the contribution of sequences, potentially originating from drilling fluid was relatively small, even in XCB cored samples taken from up to 329 meters below seafloor (where the switchover from APC to XCB occurred at 128 mbsf). There can be exceptions where contamination may coincide with increased drilling difficulty or sediment porosity, potentially seen by the single sample at 496 mbsf that overlapped greatly with potential contaminants (Figure 6). Overall, the results presented here show that, most often, drilling fluid contributes only a minor amount to the community DNA profile, which lends confidence to the conclusions drawn even when it is not possible to remove all ambiguous lineages. Grouping at the level of order, instead of the operational taxonomic unit (OTU), may allow for additional contaminant lineages to be removed even if diversity is not completely determined, without removing many subsurface inhabitants. We suggest that with thorough sampling of contaminating drilling fluid, sediment cores, including the XCB cores of harder sediment packages, can be confidently utilized for biological study with molecular methods.

4. Conclusions

Microbial community analyses of Sites 1378 and 1379 of the Costa Rica margin sub-seafloor show that, at the domain level, both Bacteria and Archaea constitute significant portions of the microbial community—a result confirmed by primer validation efforts and sequencing of metagenomes. Archaea are particularly abundant at Site 1379. Both sites revealed similar proportions of the phyla Chloroflexi and Aerophobetes; Site 1378 had a notably higher proportion of Elusimicrobia, Actinobacteria, Lokiarchaeota and Atribacteria; and Site 1379 had a notably higher proportion of Bathyarchaeota and Hadesarchaeota. Many of the taxonomic lineages identified in this study have been found often in sub-seafloor environments around the globe, but changes in their relative proportions, depending on their specific location, suggest that they may be influenced by variations not yet observed in environmental parameters within the sub-seafloor. Correlations to pore water chemistry, included here, revealed some possible metabolic strategies for sub-seafloor lineages, including the importance of heterotrophic activity on ammonia concentrations, and these relationships are being explored via the continued analysis of metagenomic datasets presented in this study. Finally, we suggest that drilling contamination, while an issue that needs routine monitoring, is not a major hindrance for the molecular analysis of microbial community composition in deep sub-seafloor samples.

Supplementary Materials

The following are available online at https://www.mdpi.com/2076-3263/9/5/218/s1, Supporting methods; Table S1: Sample information; Table S2: Correlation values; Table S3: Drilling fluid composition.

Author Contributions

Conceptualization, A.M. and C.H.H.; methodology, A.M, M.E.R., and R.L.-Z.; data curation, A.M, M.E.R., R.L.-Z., and I.E.-V.; writing—original draft preparation, A.M., R.L.-Z., and J.F.B.; writing—review and editing, A.M. and J.F.B.; funding acquisition, J.F.B. and C.H.H.

Funding

This work was funded by IODP 334 Post Expedition award T334A40, the Penn State Astrobiology Research Center (through the NASA Astrobiology Institute, cooperative agreement #NNA09DA76A), the Pennsylvania Space Grant Consortium (NNX10AK74H), and a postdoctoral fellowship (RLZ) and graduate student fellowship (AJM) from NSF-funded Center for Dark Energy Biosphere investigations.

Acknowledgments

We thank all shipboard scientists on Expedition 334, especially geochemist Evan Solomon for providing refined pore water chemistry data. Illumina sequencing data for Site 1378 were made possible by the Deep Carbon Observatory’s Census of Deep Life, supported by the Alfred P. Sloan Foundation. This Illumina sequencing was performed at the Marine Biological Laboratory (Woods Hole, MA, USA) and we are grateful for the assistance of Mitch Sogin, Susan Huse, Joseph Vineis, Andrew Voorhis, Sharon Grim, and Hilary Morrison at the Marine Biological Laboratory. Illumina sequencing for Site 1379 was carried out by the lab of Stephan Schuster, and we are thankful for the assistance of Lynn Tomsho. Additionally, we thank Glenn Christman for metagenome assembly and bioinformatics assistance. This work is C-DEBI contribution 473.

Conflicts of Interest

The authors declare no conflict of interest. The funders had no role in the design of the study; in the collection, analyses, or interpretation of data; in the writing of the manuscript, or in the decision to publish the results.

References

  1. D’Hondt, S.; Jorgensen, B.B.; Miller, D.J.; Batzke, A.; Blake, R.; Cragg, B.A.; Cypionka, H.; Dickens, G.R.; Ferdelan, T.; Hinrichs, K.U.; et al. Distributions of microbial activities in deep subseafloor sediments. Science 2004, 306, 2216–2221. [Google Scholar] [CrossRef] [PubMed]
  2. Ciobanu, M.C.; Burgaud, G.; Dufresne, A.; Breuker, A.; Redou, V.; Maamar, S.B.; Gaboyer, F.; Vandenabeele-Trambouze, O.; Lipp, J.S.; Schippers, A.; et al. Microorganims persist at record depths in the subseafloor of the Canterbury Basin. ISMEJ 2014, 8, 1370–1380. [Google Scholar] [CrossRef] [PubMed]
  3. Inagaki, F.; Nunoura, T.; Nakagawa, S.; Teske, A.; Lever, M.; Lauer, A.; Suzuki, M.; Takai, K.; Delwiche, M.; Colwell, F.S.; et al. Biogeographical distribution and diversity of microbes in methane hydrate-bearing deep marine sediments on the Pacific Ocean Margin. Proc. Natl. Acad. Sci. USA 2006, 103, 2815–2820. [Google Scholar] [CrossRef] [Green Version]
  4. Bidle, K.A.; Kastner, M.; Bartlett, D.H. A phylogenetic analysis of microbial communities associated with methane hydrate containing marine fluids and sediments in the Cascadia Margin (ODP site 892B). FEMS Microbiol. Lett. 1999, 177, 101–108. [Google Scholar]
  5. Vannucchi, P.; Ujiie, K.; Stroncik, N.; the Expedition 334 Scientists. Proceedings of the Integrated Ocean Drilling Program Volume 334. Available online: http://publications.iodp.org/proceedings/334/334title.htm (accessed on 31 March 2019).
  6. Barry, P.H.; de Moor, J.M.; Giovanelli, D.; Schrenk, M.; Hummer, D.R.; Lopez, T.; Pratt, C.A.; Alpizar Segura, Y.; Battaglia, A.; Beaudry, P.; et al. Forearc carbon sink reduces long-term volatile recycling into the mantle. Nature 2019, 568, 487–492. [Google Scholar] [CrossRef]
  7. Schippers, A.; Neretin, L.N.; Kallmeyer, J.; Ferdelman, T.G.; Cragg, B.A.; Parkes, R.J.; Jørgensen, B.B. Prokaryotic cells of the deep sub-seafloor biosphere identified as living bacteria. Nature 2005, 433, 861–864. [Google Scholar] [CrossRef] [PubMed]
  8. Briggs, B.R.; Inagaki, F.; Morono, Y.; Futagami, T.; Huguet, C.; Rosell-Mele, A.; Lorenson, T.D.; Colwell, F.S. Bacterial dominance in subseafloor sediments characterized by methane hydrates. FEMS Microbiol. Ecol. 2012, 81, 88–98. [Google Scholar] [CrossRef] [PubMed] [Green Version]
  9. Biddle, J.F.; Fitz-Gibbon, S.; Schuster, S.C.; Brenchley, J.E.; House, C.H. Metagenomic signatures of the Peru Margin subseafloor biosphere show a genetically distinct environment. Proc. Natl. Acad. Sci. USA 2008, 105, 10583–10588. [Google Scholar] [CrossRef] [PubMed] [Green Version]
  10. Lipp, J.S.; Morono, Y.; Inagaki, F.; Hinrichs, K.-U. Significant contribution of Archaea to extant biomass in marine subsurface sediments. Nature 2008, 454, 991–994. [Google Scholar]
  11. Smith, D.C.; Spivack, A.J.; Fisk, M.R.; Haveman, S.A.; Staudigel, H.; ODP Leg 185 Shipboard Scientific Party. Methods for Quantifying Potential Microbial Contamination During Deep Ocean Coring. 2000. Available online: http://www-odp.tamu.edu/publications/tnotes/tn28/INDEX.HTM (accessed on 31 March 2019).
  12. Smith, D.C.; Spivack, A.J.; Fisk, M.R.; Haveman, S.A.; Staudigel, H.; ODP Leg 185 Shipboard Scientific Party. Tracer-Based Estimates of Drilling-Induced Microbial Contamination of Deep Sea Crust. Geomicrobiol. J. 2000, 17, 207–219. [Google Scholar]
  13. House, C.H.; Cragg, B.A.; Teske, A. Drilling contamination tests on ODP Leg 201 using chemical and particulate tracers. In Proceedings of the Ocean Drilling Program; Texas A&M University: College Station, TX, USA, 2003; pp. 1–19. [Google Scholar]
  14. Masui, N.; Morono, Y.; Inagaki, F. Microbiological assessment of circulation mud fluids during the first operation of riser drilling by the deep-earth research vessel Chikyu. Geomicrobiol. J. 2008, 25, 274–282. [Google Scholar] [CrossRef]
  15. Santelli, C.M.; Banerjee, N.; Bach, W.; Edwards, K.J. Tapping the subsurface ocean crust biosphere: Low biomass and drilling-related contamination calls for improved quality controls. Geomicrobiol. J. 2010, 27, 158–169. [Google Scholar] [CrossRef]
  16. Fry, J.C.; Parkes, R.J.; Cragg, B.C.; Weightman, A.J.; Webster, G. Prokaryotic biodiversity and activity in the deep subseafloor biosphere. FEMS Microbiol. Ecol. 2008, 66, 181–196. [Google Scholar] [CrossRef] [PubMed] [Green Version]
  17. Orcutt, B.N.; Sylvan, J.B.; Knab, N.J.; Edwards, K.J. Microbial ecology of the dark ocean above, at, and below the seafloor. Microbiol. Mol. Biol. Rev. 2011, 75, 361–422. [Google Scholar] [CrossRef]
  18. Inagaki, F.; Hinrichs, K.-U.; Kubo, Y.; Bowles, M.W.; Heuer, V.B.; Hong, W.-L.; Hoshino, T.; Ijiri, A.; Imachi, H.; Ito, M.; et al. Exploring deep microbial life in coal-bearing sediment down to ~2.5 km below the ocean floor. Science 2015, 349, 420–424. [Google Scholar] [CrossRef] [PubMed]
  19. Yanagawa, K.; Nunoura, T.; McAllister, S.M.; Kirai, M.; Breuker, A.; Brandt, L.; House, C.H.; Moyer, C.L.; Birrien, J.L.; Aoike, K.; et al. The first microbiological contamination assessment by deep-sea drilling and coring by the D/V Chikyu at the Iheya North hydrothermal field in the Mid-Okinawa Trough (IODP Expedition 331). Frontiers Microbiol. 2013, 4, 327. [Google Scholar] [CrossRef] [PubMed]
  20. Stavenhagen, A.U.; Flueh, E.R.; Ranero, C.R.; McIntosh, K.D.; Shipley, T.; Leandro, G.; Schulze, A.; Dañobeitia, J.J. Seismic wide-angle investigations in Costa Rica—A crustal velocity model from the Pacific to the Caribbean. ZBL. Geol. Paläontol. 1998, 1, 393–408. [Google Scholar]
  21. Rhodes, M.E.; Fitz-Gibbon, S.T.; Oren, A.; House, C.H. Amino acid signatures of salinity on an environmental scale with a focus on the Dead Sea. Environ. Microbiol. 2010, 12, 2613–2623. [Google Scholar] [CrossRef] [PubMed]
  22. Schloss, P.D.; Westcott, S.L.; Ryabin, T.; Hall, J.R.; Hartmann, M.; Hollister, E.B.; Lesniewski, R.A.; Oakley, B.B.; Parks, D.H.; Robinson, C.J.; et al. Introducing mothur: Open-source, platform-independent, community-supported software for describing and comparing microbial communities. Appl. Environ. Microbiol. 2009, 75, 7537–7541. [Google Scholar] [CrossRef]
  23. Quast, C.; Pruesse, E.; Yilmaz, P.; Gerken, J.; Schweer, T.; Yarza, P.; Peplies, J.; Glockner, F.O. The SILVA ribosomal RNA gene database project: Improved data processing and web-based tools. Nucleic Acids Res. 2013, 41, 590–596. [Google Scholar] [CrossRef]
  24. Pruesse, E.; Peplies, J.; Glöckner, F.O. SINA: Accurate high-throughput multiple sequence alignment of ribosomal RNA genes. Bioinformatics 2012, 28, 1823–1829. [Google Scholar] [CrossRef] [Green Version]
  25. Li, W.; Godzik, A. Cd-hit: A fast program for clustering and comparing large sets of protein or nucleotide sequences. Bioinformatics 2006, 22, 1658–1659. [Google Scholar] [CrossRef]
  26. Silva. Available online: http://www.arb-silva.de (accessed on 31 March 2019).
  27. BLAST: Basic Local Alignment Search Tool. Available online: http://blast.ncbi.blm.nih.gov/Blast.cgi (accessed on 31 March 2019).
  28. Camacho, C.; Coulouris, G.; Avagyan, V.; Ma, N.; Papadopoulos, J.; Bealer, K.; Madden, T. BLAST+: Architecture and applications. BMC Bioinform. 2009, 10, 421. [Google Scholar] [CrossRef]
  29. Schmieder, R.; Edwards, R. Quality control and preprocessing of metagenomic datasets. Bioinformatics 2011, 27, 863–864. [Google Scholar] [CrossRef] [Green Version]
  30. Bolger, A.M.; Lohse, M.; Usadel, B. Trimmomatic: A flexible trimmer for Illumina sequence data. Bioinformatics 2014, 30, 2114–2120. [Google Scholar] [CrossRef]
  31. Menzel, P.; Ng, K.L.; Krogh, A. Fast and sensitive taxonomic classification for metagenomics with Kaiju. Nature Commun. 2016, 7, 11257. [Google Scholar] [CrossRef] [PubMed] [Green Version]
  32. Darling, A.E.; Jospin, G.; Lowe, E.; Matsen, F.A.; Bik, H.M.; Eisen, J.A. PhyloSift: Phylogenetic analysis of genomes and metagenomes. PeerJ 2014, 9, 2:e243. [Google Scholar] [CrossRef]
  33. Berg, R.; Solomon, E.A. Geochemical constraints on the distribution and rates of debromination in the deep subseafloor biosphere. Geochim. Cosmochim. Acta 2016, 174, 30–41. [Google Scholar] [CrossRef]
  34. Torres, M.E.; Muratli, J.M.; Solomon, E.A. Data Report: Minor Element Concentrations in Pore Fluids from the CRISP-A Transect Drilled During Expedition 334. Available online: http://publications.iodp.org/proceedings/334/201/201_.htm (accessed on 31 March 2019).
  35. Rhodes, M.E.; Oren, A.; House, C.H. Dynamics and persistence of Dead Sea microbial populations as shown by high-throughput sequencing of rRNA. Appl. Environ. Microbiol. 2012, 78, 2489–2492. [Google Scholar] [CrossRef]
  36. Zhou, Z.; Pan, J.; Wang, F.; Gu, J.D.; Li, M. Bathyarchaeota: Globally distributed metabolic generalists in anoxic environments. FEMS Microbiol. Lett. 2018, 42, 639–655. [Google Scholar] [CrossRef]
  37. Geissinger, O.; Herlemann, D.P.R.; Morschel, E.; Maier, U.G.; Brune, A. The ultramicrobacterium “Elusimicrobium minutum” gen. nov., sp. nov., the first cultivated representative of the termite group 1 phylum. Appl. Env. Microbiol. 2009, 75, 2831–2840. [Google Scholar] [CrossRef]
  38. Wang, Q.; Garrity, G.M.; Tiedje, J.M.; Cole, J.R. Native Bayesian classifier for rapid assignment of rRNA sequences into the new bacterial taxonomy. Appl. Environ. Microbiol. 2007, 73, 5261–5267. [Google Scholar] [CrossRef] [PubMed]
  39. Rinke, C.; Schwientek, P.; Sczyrba, A.; Ivanova, N.N.; Anderson, I.J.; Cheng, J.-F.; Darling, A.; Malfatti, S.; Swan, B.K.; Gies, E.A.; et al. Insights into the phylogeny and coding potential of microbial dark matter. Nature 2013, 499, 431–437. [Google Scholar] [CrossRef] [Green Version]
  40. Lazar, C.S.; Biddle, J.F.; Meador, T.B.; Blair, N.; Hinrichs, K.-U.; Teske, A.P. Environmental controls on intragroup diversity of the uncultured benthic archaea of the miscellaneous Crenarchaeotal group lineage naturally enriched in anoxic sediments of the White Oak River estuary (North Caroline, USA). Env. Microbiol. 2015, 17, 2228–2238. [Google Scholar] [CrossRef] [PubMed]
  41. Futagami, T.; Morono, Y.; Terada, T.; Kaksonen, A.H.; Inagaki, F. Dehalogenation activities and distribution of reductive dehalogenase homologous genes in marine subsurface sediments. Appl. Environ. Microbiol. 2009, 75, 6905–6909. [Google Scholar] [CrossRef] [PubMed]
  42. Futagami, T.; Morono, Y.; Terada, T.; Kaksonen, A.H.; Inagaki, F. Distribution of dehalogenation activity in subseafloor sediments of the Nankai Trough subduction zone. Philos. Trans. R Soc. Lond. B Biol. Sci. 2013, 368, 20120249. [Google Scholar] [CrossRef] [PubMed]
  43. Kawai, M.; Futagami, T.; Toyoda, A.; Takaki, Y.; Nishi, S.; Hori, S.; Arai, W.; Tsubouchi, T.; Morono, Y.; Uchiyama, I.; et al. High frequency of phylogenetically diverse reductive dehalogenase-homologous genes in deep subseafloor sedimentary metagenomes. Front. Microbiol. 2014, 5. [Google Scholar] [CrossRef] [PubMed]
Figure 1. Wide-angle seismic section showing locations and depths of sites drilled during International Ocean Discovery Program (IODP) Expedition 334. Stars indicate sites utilized in current study [5,20].
Geosciences 09 00218 g001
Figure 2. Relative proportions of Bacteria, Archaea and Eukaryotes for Sites 1378 and 1379 assessed using 3 methods. Shown are the percentages of total classified reads for each method. A. 16S rRNA amplicons produced via PCR with universal primers were classified with the SILVAngs pipeline. B. Protein-coding genes from metagenomic sequences were classified using Kaiju. C. A set of phylogenetic marker genes from the metagenomic sequences were classified using Phylosift.
Geosciences 09 00218 g002
Figure 3. Taxonomy calls based on protein coding genes from metagenome (left), phylogeny from marker genes in metagenomes (center) and 16S rRNA amplicon reads using universal primers (right) on additional samples to show universal primer effectiveness. (A) Data from the Dead Sea; (B) Data from seawater; (C) Data from an anaerobic digester, with additional investigations into the robustness of PCR cycles for amplicon data. Archaea are indicated by white and bacteria are indicated by gray, all samples shown as percentage abundances.
Geosciences 09 00218 g003
Figure 4. Detailed taxonomic breakdown of overall 16S rRNA amplicon sequences at (A) Site 1378 and (B) Site 1379. Data shown by percentage abundance.
Geosciences 09 00218 g004
Figure 5. Taxon abundances with depth and their correlated geochemistry for Sites (A) 1378 and (B) 1379. Significant Pearson correlation values are shown.
Geosciences 09 00218 g005aGeosciences 09 00218 g005b
Figure 6. Proportion of classified sequences from each sediment sample that matched those present in the drilling fluid at the taxonomic level of “order.” The matched sequences for each order taxon were totaled for each phylum/subphylum depicted above. (A) Sequences from Site 1378; (B) Sequences from Site 1379; (C) Sequences from the drilling mud. Stars represent samples taken from XCB cores. All other were retrieved from APC coring.
Geosciences 09 00218 g006
Table 1. Detailed taxonomic percent abundances by depth of 16S rRNA amplicon sequencing.
13781379
Sample Depth (mbsf):2.8832.2963.8293.98124.78158.24240.90329.102.9022.0845.3867.2889.38115.07211.53
Archaea:
Bathyarchaeota30.541.880.000.884.293.662.080.2434.8118.2128.5750.8651.5946.3020.04
Lokiarchaeota16.6514.4614.293.468.226.001.761.057.513.815.270.460.040.013.39
Thaumarchaeota4.000.910.480.210.570.330.020.001.771.741.031.591.140.690.14
Euryarchaeota1.940.780.004.641.181.010.030.002.541.042.230.320.370.010.00
Hadesarchaea1.341.140.120.000.524.160.160.0011.303.6911.565.5312.8424.231.22
Ancient Archaeal Group (AAG)0.044.231.710.000.270.000.000.000.000.000.000.000.000.000.00
Bacteria:
Chloroflexi20.6127.2913.1919.8314.5225.3023.645.5222.1847.4822.3028.0016.9313.0914.71
Planctomycetes5.833.531.480.891.434.713.740.006.002.962.301.871.361.402.05
Deltaproteobacteria5.073.563.594.250.821.320.380.122.532.691.610.610.090.062.31
Aminicenantes2.090.771.610.100.000.260.010.000.340.230.370.500.190.130.10
Microgenomates1.630.000.000.000.000.000.000.001.010.000.000.110.000.000.00
Aerophobetes1.3210.3514.7220.0510.6619.084.460.382.404.185.062.568.687.1436.96
AC10.682.132.241.750.850.260.060.000.140.350.750.920.130.030.39
Spirochaetae0.640.612.370.901.200.610.4411.560.230.200.270.000.000.000.00
Elusimicrobia0.403.0723.6529.7242.6019.165.0354.811.961.9514.661.752.894.9915.98
Atribacteria0.379.343.658.398.123.109.3510.220.080.280.070.120.040.030.53
Marinimicrobia (SAR406 clade)0.322.172.700.580.380.911.581.610.130.080.320.080.030.050.00
Actinobacteria0.2310.1712.530.512.174.9444.580.510.207.851.440.400.590.930.00
Bacteroidetes0.051.601.090.120.340.230.710.930.050.020.080.020.000.020.06
Alphaproteobacteria0.000.000.000.060.061.970.573.000.000.000.000.000.010.090.00
Eukaryota:
Tracheophyta0.000.000.000.000.000.000.008.610.000.000.000.000.000.000.00
Phyla with <1.5% Representation or No Relative6.251.980.583.691.792.981.421.444.813.232.124.313.080.792.11

