Article

Influence of Climate on Stable Nitrogen Isotopic Values of Contemporary Greek Samples: Implications for Isotopic Studies of Human Remains from Neolithic to Late Bronze Age Greece

by
Elissavet Dotsika
and
Georgios Diamantopoulos
*
Stable Isotope Unit, Institute of Nanoscience and nanotechnology, National Center of Scientific Research “Demokritos”, GR15310 Ag. Paraskevi Attikis, Greece
*
Author to whom correspondence should be addressed.
Geosciences 2019, 9(5), 217; https://doi.org/10.3390/geosciences9050217
Submission received: 3 April 2019 / Revised: 9 May 2019 / Accepted: 11 May 2019 / Published: 13 May 2019
(This article belongs to the Special Issue Isotope Geochemistry)

Abstract

:
In this paper, we study δ15N enrichment as an indicator not only of marine protein diet, but also of climate change. The slope of the variation of δ15N with precipitation was calculated equal to 0.38/100 mm of precipitation for Greek plants, 0.38/100 mm of precipitation for herbivores, and 0.32/100 mm of precipitation for the Greek human population (hair samples). As a case study, the slope was used to re-evaluate the published mean δ15N human bone collagen values from the Early Neolithic to Late Bronze Age for 22 archaeological sites. The results indicate that climate has a significant impact on the final δ15N values of plant and animal tissues. Furthermore, for the same sites, we investigated the intra-site diet patterns, while taking into account the environmental effect on the observed δ15N human bone collagen values.

1. Introduction

Dietary reconstruction using stable nitrogen isotope analysis of bone collagen reproduces the trophic level or the position of an individual in the food chain. The δ15N values of herbivores are approximately 3 mUr (we follow the notation of (mUr), which corresponds to (‰) [1]) higher than the plants they consume [2,3], while carnivores have δ15N values that are approximately 3 mUr higher than the herbivores that they consume [2,3].
The δ15N value of human bone collagen is consequently about 3 mUr higher than the δ15N value of the protein that the human has consumed [2,3,4]. Humans who obtain the majority of their dietary protein from marine species have δ15N values ranging from about 12 to 22 mUr [5,6], while those who consume only terrestrial protein sources have δ15N between 5 and 12 mUr.
Climate may also affect the δ13C and δ15N values of terrestrial animals through its effect on the δ13C of plants and on the δ15N of soil, at the base of the food chain. A decrease in the total amount of precipitation and/or relative humidity causes an enrichment of δ15N [7]. In general, the total soil δ15N varies considerably, from about −7 to about +18 mUr. This range of values probably arises from the climatologically-sensitive processes of bacterial N2 fixation, nitrification, and de-nitrification [8,9,10].
Furthermore, climate may also directly affect the δ15N of terrestrial animals. δ15N of bone collagen was found to become more positive with decreasing precipitation [11], and this may be related to water conservation in animals in arid areas and excretion of δ15N-depleted urine [12,13].
More negative δ15N values of soils and plants were observed with the decrease in mean annual temperature in modern ecosystems, and this could lead to the reported temperature associated variations in the δ15N values of herbivores [14]. Seasonality (and/or root depth), soil age, topographic position, concentration of N in soils, and perturbations by agriculture and different fertilization practices [15] and/or fire are quoted among the different environmental parameters that influence the δ15N of herbivore tissues [7,14,16]. Finally, trees show lower δ15N values compared with herbaceous forms. Plants (both C3 and C4) growing on acid soils are δI5N depleted, their δI5N values being as low as −5% [10].
In the first part, this paper examines the effect of precipitation on δ15N values of modern plants and animal tissues in Greece. The measured δ15N values of plants, herbivores, and humans from various locations of Greece are correlated with precipitation data, and a general relation between δ15N values and precipitation is calculated. We argue that this slope derived from plants (−0.38/100 mm) can be considered in paleoclimate studies of Greece (we do not use the slopes derived for the herbivore tissues or humans hair because their diet is not restrained to local foods, and especially for humans, it may include protein of marine origin). As a case study, we present a re-evaluation of the δ15N published results of human bones from 22 archaeological sites dating from Early Neolithic to Late Bronze Age. The assumptions that we used for this study are: (a) the slope of the δ15N versus precipitation can be considered the same throughout the studied temporal periods, and (b) although no paleo-precipitation data are available, a comparative study of the 22 sites can be conducted using the above slope.
In the second part of the paper, we conduct an intra-site analysis of the δ15N human bone collagen values of the 22 archaeological sites. We attempt to detect diet differences related to social or cultural status within each site by excluding the influence of the environmental parameter from the δ15N human bone collagen values. The reported ranges in the δ15N human bone collagen values, for each site, are divided by the calculated slope (0.0038), and the corresponding precipitation ranges for each site are calculated. We assume that only a ±100-mm difference in precipitation can be considered during the existence of each site, and that translates to ±0.4 δ mUr in the δ15N human bone collagen values. As a result, any intra-site differences of the δ15N human bone collagen values greater that ±0.4 can safely be related to social and cultural differences.
In general, the objectives of this study was to investigate the effect of climate on the δ15N values and determine a threshold above which the change in δ15N of human bone collagen values from the studied sites can be considered solely as an indicator of diet differences (consumption or not of marine protein) and not as a consequence of environmental factors.

2. Materials and Methods

In this study, we consider selected samples of C3 plants, herbivore animals, and human hair from our previous work [17]. The selected C3 plant samples belong to species that were not subject to fertilization processes and from remote areas in order to eliminate possible contamination of the δ15N isotopic values. The herbivore samples were either sheep or cows. The isotopic analysis (δ13C and δ15N) was conducted in the Stable Isotope Unit of NCSR “Demokritos”. The mean isotopic values for all the samples considered in this study are presented in Table 1. For the δ13C and δ15N isotopic values of the human hair samples, a fractionation value equal to 1.41 mUr and 0.86 mUr was added to the hair isotopic values respectively in order to reflect the expected bone values [18].
For the Greek human samples, hairs were clipped from each subject, rinsed twice in distilled water for about 20 min each time. These samples were then dried overnight at 65 °C and ground to a fine powder (to be homogenized) before analysis.
The plant samples were ground to a fine homogeneous powder (<250 μm in size) under liquid nitrogen.
For the herbivore samples, extraction of collagen from bone was based on that of Ambrose [19], which can be summarized as follows (see also [20]). Solid bone samples were first placed in 0.1 M NaOH to remove contaminants, followed by demineralization with 2% HCl, a second treatment with 0.1 M NaOH, and finally, a 2:1:0.8 defatting mixture of CH3OH, CHCl3, and water. The dried and weighed samples were then analyzed with a FlashEA/IRMS for δ13C and δ15N.
The isotopic ratios ((R = 15N/14N or 13C/12C reported as δ15Ν or δ13C, where δ = ((Rsample − Rstandard)/Rstandard)) were measured versus atmospheric N2(AIR) and PDB (a marine carbonate) for nitrogen and carbon, respectively. The reported values were the means of two or more consistent measurements of each sample. The standard deviation of the measurements ranged on average between ± 0.1 and ± 0.2 mUr (2σ), for both 15Ν and 13C isotopes.
The slopes from C3 plants, herbivore, and human samples versus precipitation were calculated. We used the slope calculated from C3 plants for our analysis since the slopes of herbivore and human samples were possibly affected by diet.
The precipitation data were the average values from years 1971–2000 and can be found at the Hellenic National Meteorological Service [21].
As a case study on the effect of environment on δ15N values, we re-evaluate a total of 363 human bone collagen samples from 22 archaeological sites across Greece as obtained from the literature [22,23,24,25,26,27,28,29,30,31,32,33,34]. Figure 1 shows the spatial distribution of the sites and the number of samples for each one of them (solid circles). In Figure 1, we also present the spatial distribution of the plant samples (red dots).
In order to calculate the climate correction on the δ15N human bone collagen values from the 22 archaeological sites considered in this study, a reference site was selected. The selection of the most appropriate reference site was dictated by low consumption of protein of marine origin since otherwise, it would distort the analysis of the climate effect on the δ15Ν values. The criteria for the selection of the reference site were: (a) more negative mean δ15N values of the bone collagen of humans, (b) high elevation and with more mean annual precipitation, (c) no archaeological evidence of excess fish consumption (recovered fish bones, nets), and (d) no proximity to freshwater, rivers or lakes.
After the selection of the reference site, we calculated the differences of the mean precipitation of the remaining 21 sites with the reference site. These precipitation differences were then multiplied by the calculated slope from the C3 plants samples versus precipitation. The results represent the climate effect on the δ15N human bone collagen values of the 21 sites with respect to the reference site (see Section 3.2 for a more detailed explanation).

3. Results and Discussion

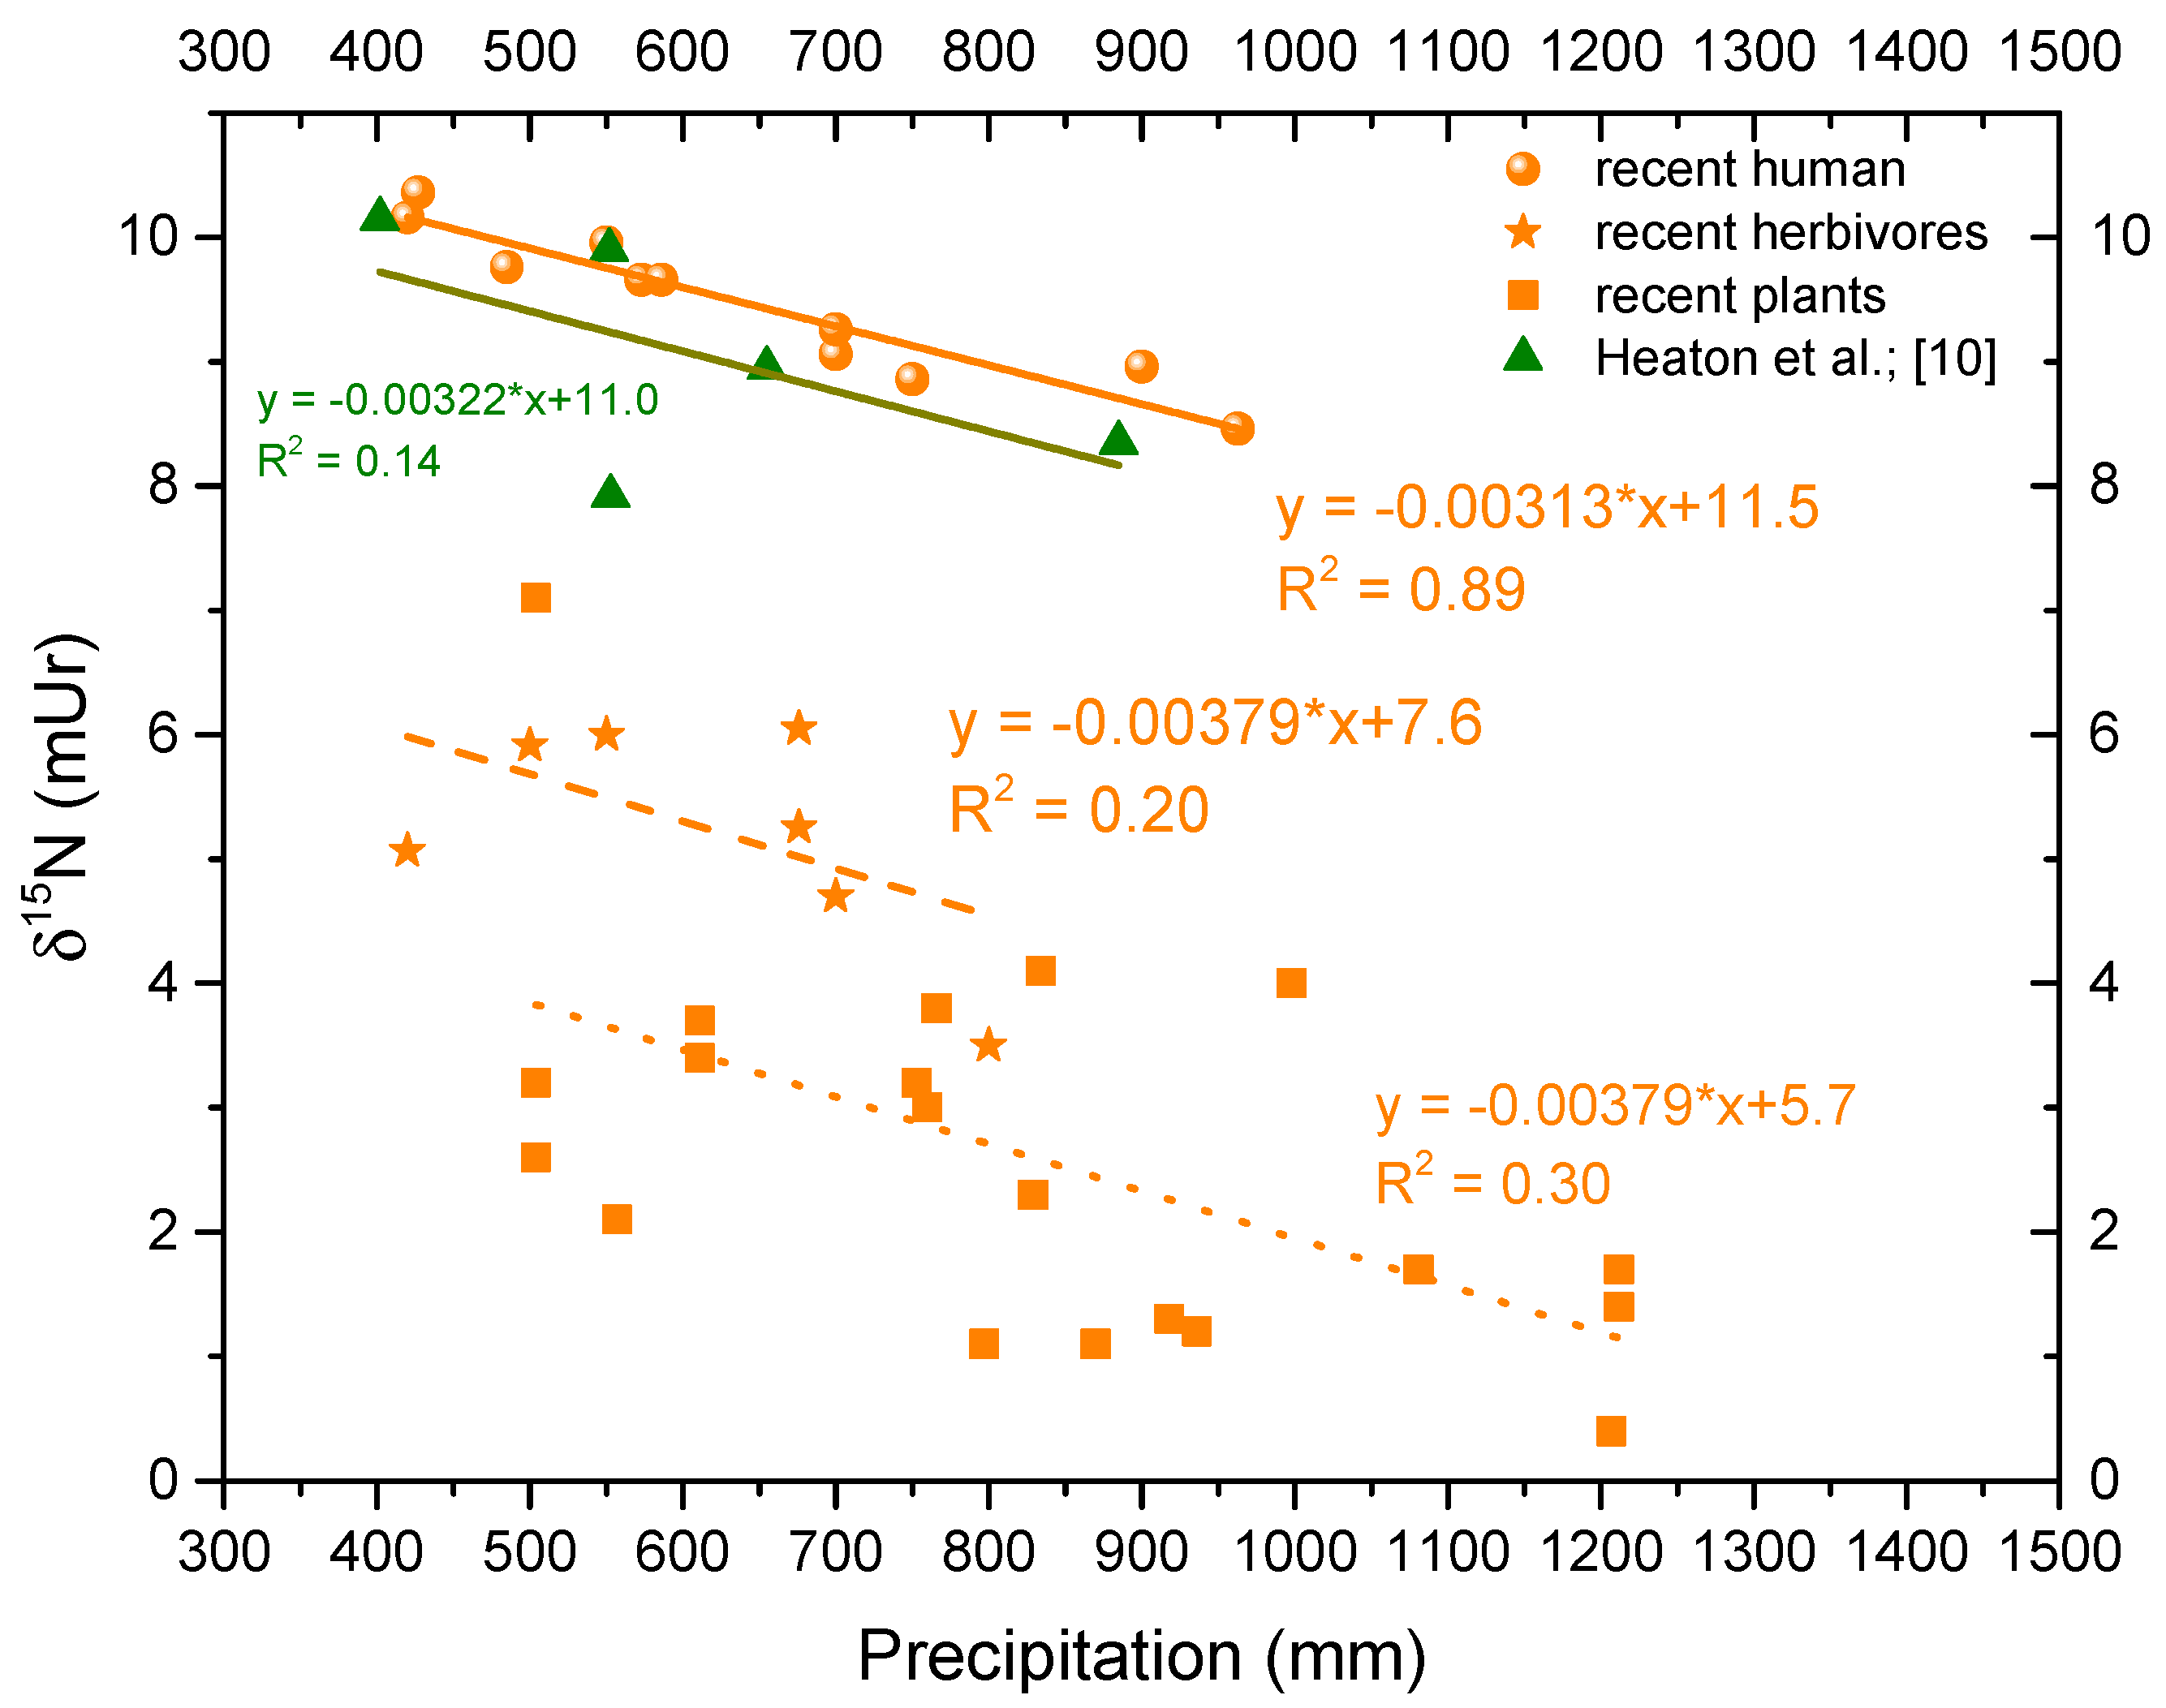
3.1. Relation of δ15N versus Precipitation for Greece

Heaton et al. [11,35] showed that the δ15N of animals, plants, and human bones from southern Africa exhibit a marked negative correlation with rainfall. Schwarcz et al. [36] calculated the slope for the human bones equal to (−1.11 ± 0.11) mUr/100 mm; however, this covered a range of annual precipitations from 84 to 885 mm. Narrowing this range to match the precipitation regime of Greece, that is >400 mm per year, the Heaton curve gave a slope of (−0.32 ± 0.25) mUr/100 mm. From the same study, the slope for the plants was calculated as equal to (−0.38 ± 0.13) mUr/100 mm [35], while for the herbivores equal to (−0.38 ± 0.11) mUr/100 mm [36]. In our study, we also observed a similar trend for plants, animals, and humans from the same region, but enriched accordingly in δ15N by the appropriate fractionation. In Figure 2, we present the δ15N isotopic values of Table 1 versus the corresponding precipitation data. The calculated slopes for the C3 plants, herbivore animals, and humans were almost the same and equal to (−0.38 ± 0.21) mUr/100 mm, (−0.38 ± 0.23) mUr/100 mm, and (−0.31 ± 0.03) mUr/100 mm, respectively. Herbivore animals exhibited about 2 mUr fractionation compared to C3 plants, and humans exhibited about 4 mUr fractionation compared to herbivores in their δ15N isotopic values. These results support the hypothesis that the relationship for C3 plants δ15N = (5.7 ± 1.2) + (−0.00379 ± 0.0021)p, where p is precipitation in mm with r2 = 0.30, is applicable over a wide range of geographic settings. Practically, the slope of this relation states that every for 100 mm of rainfall, the δ15N isotopic values will suffer about 0.4 mUr in value. We selected the slope derived from the C3 plants over the slope from the herbivores since recent domesticated herbivores are usually on feed mix that can include non-local plants. The same was done for the slope of humans since the human diet is complex and can include protein of marine origin. We argue that the slope for C3 plants will remain the same from Early Neolithic to Late Bronze Age in Greece, since it is mainly affected by the elevation and geomorphology, and thus, it can be used for comparative paleodiet studies during these periods.

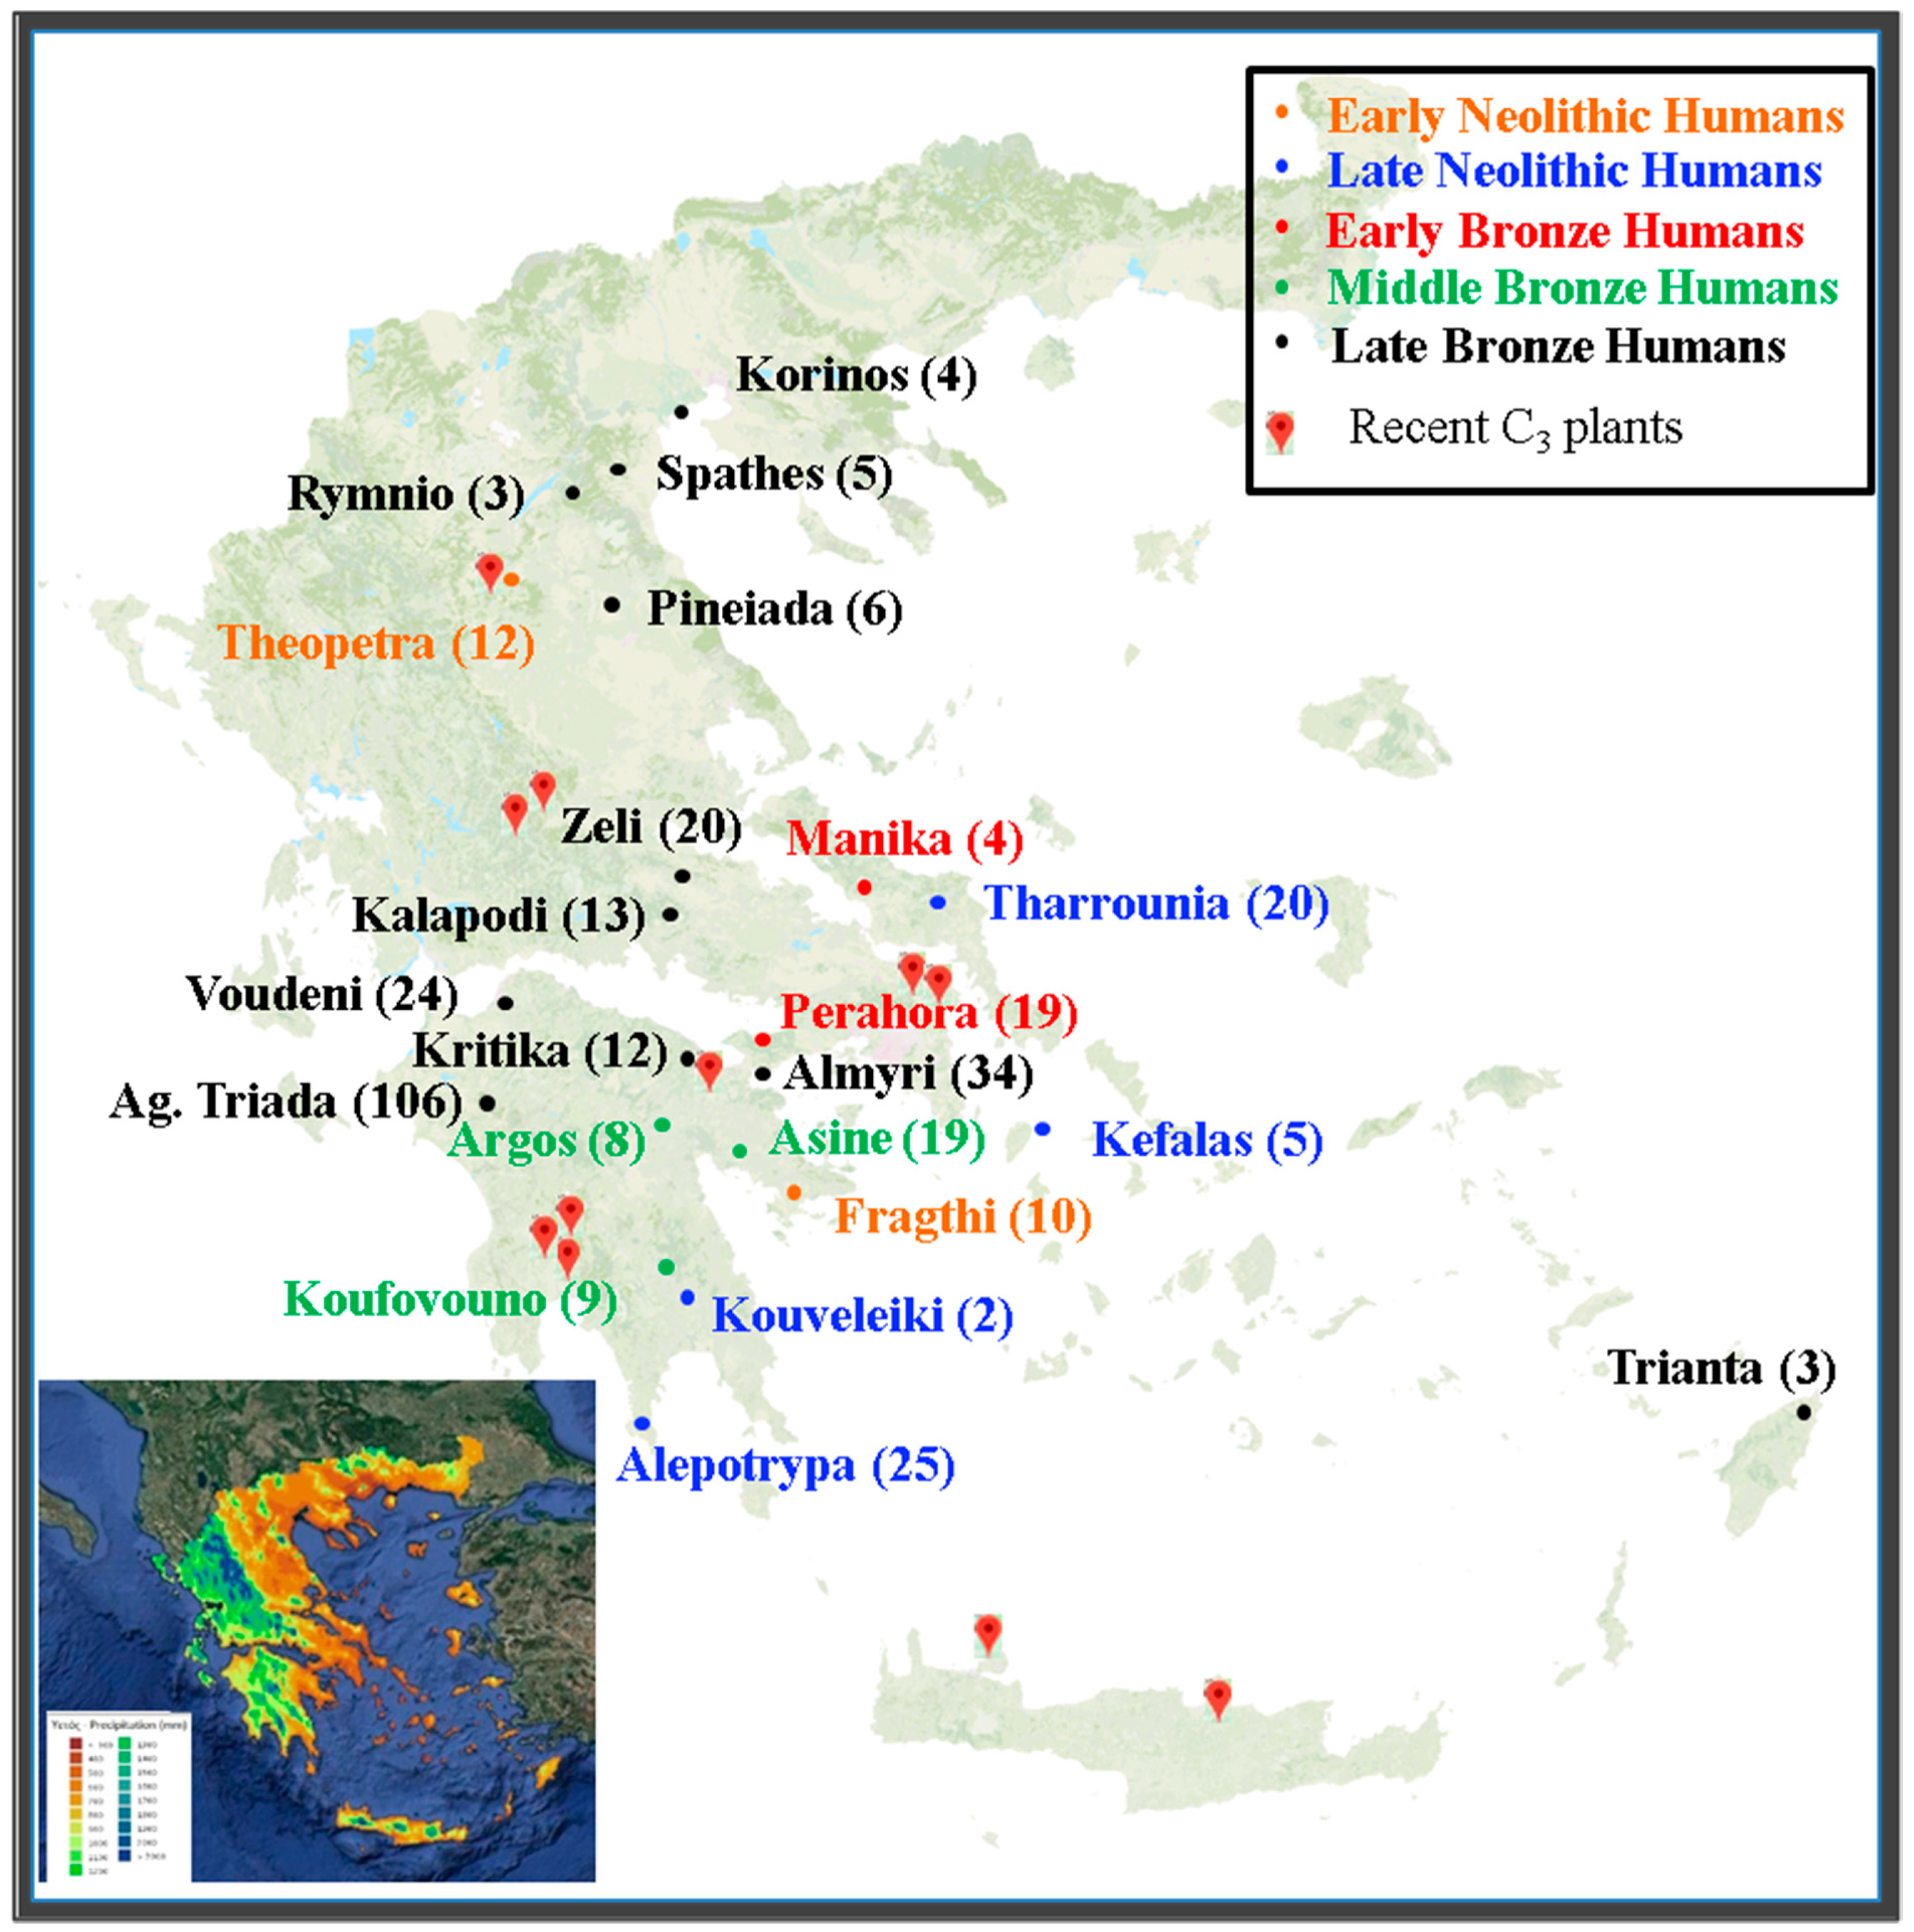
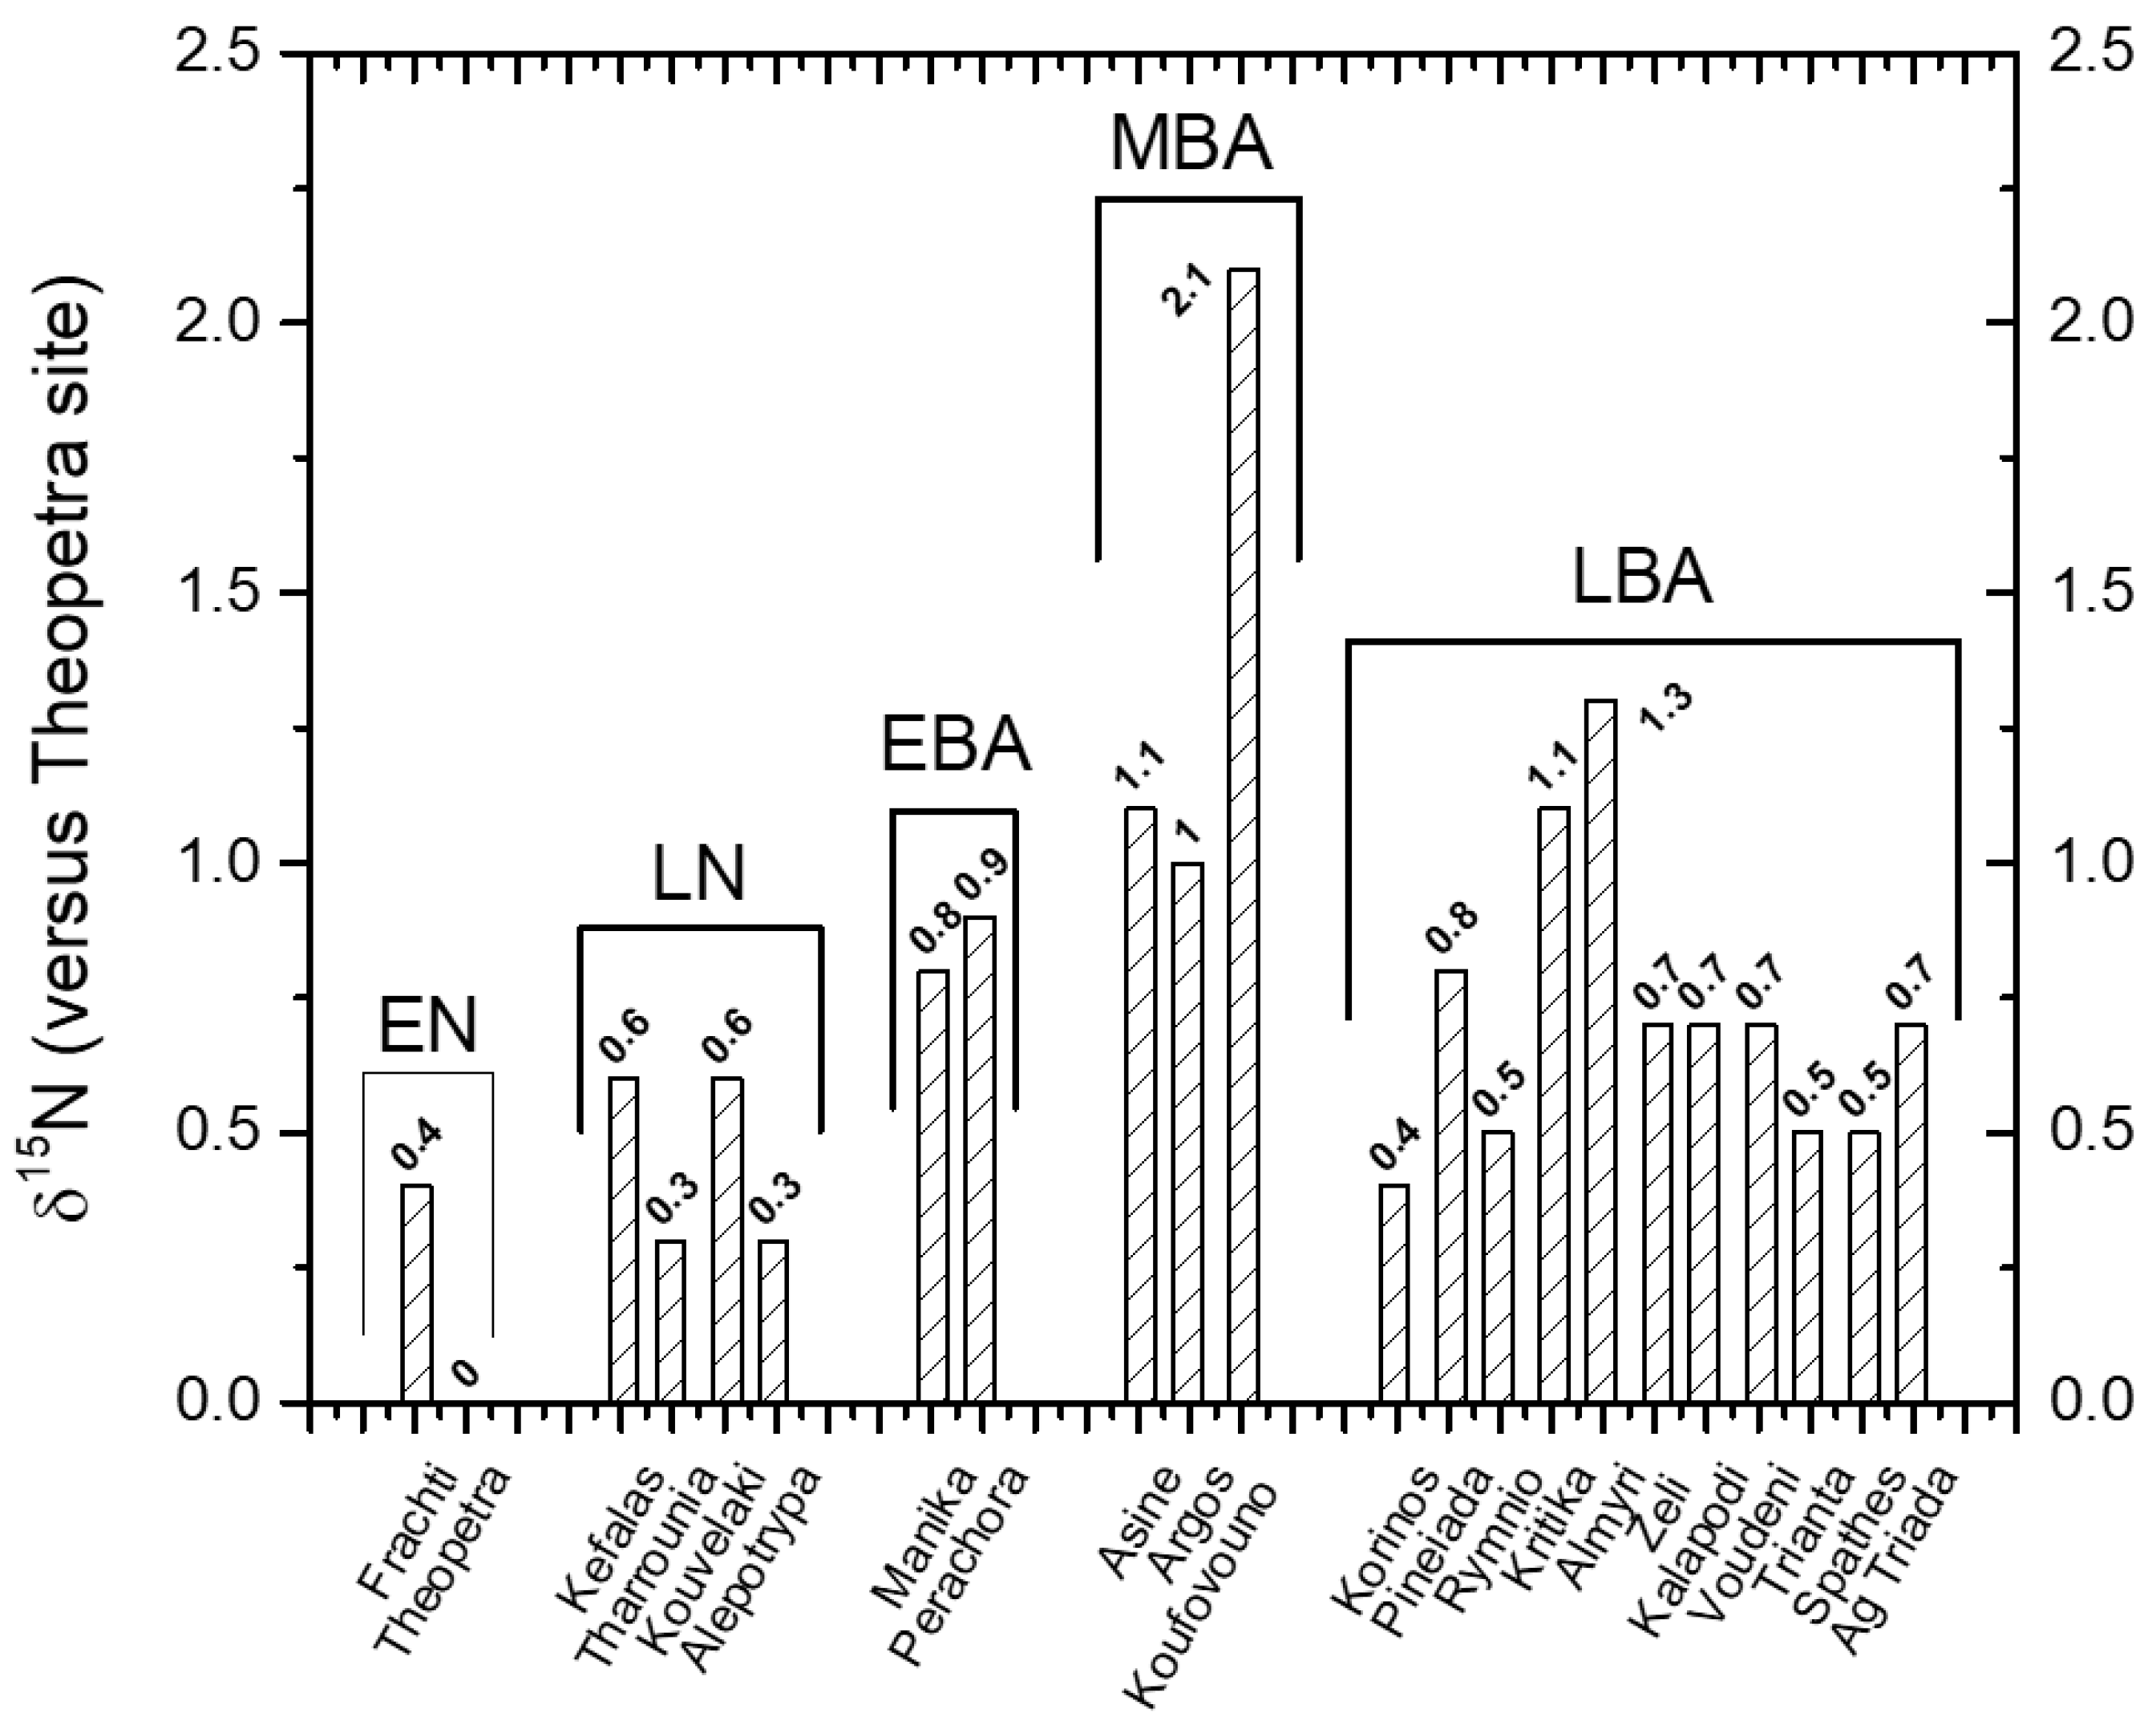
3.2. Case Study: Inter Comparison of δ15N Values of Human Bones of 22 Archeological Sites
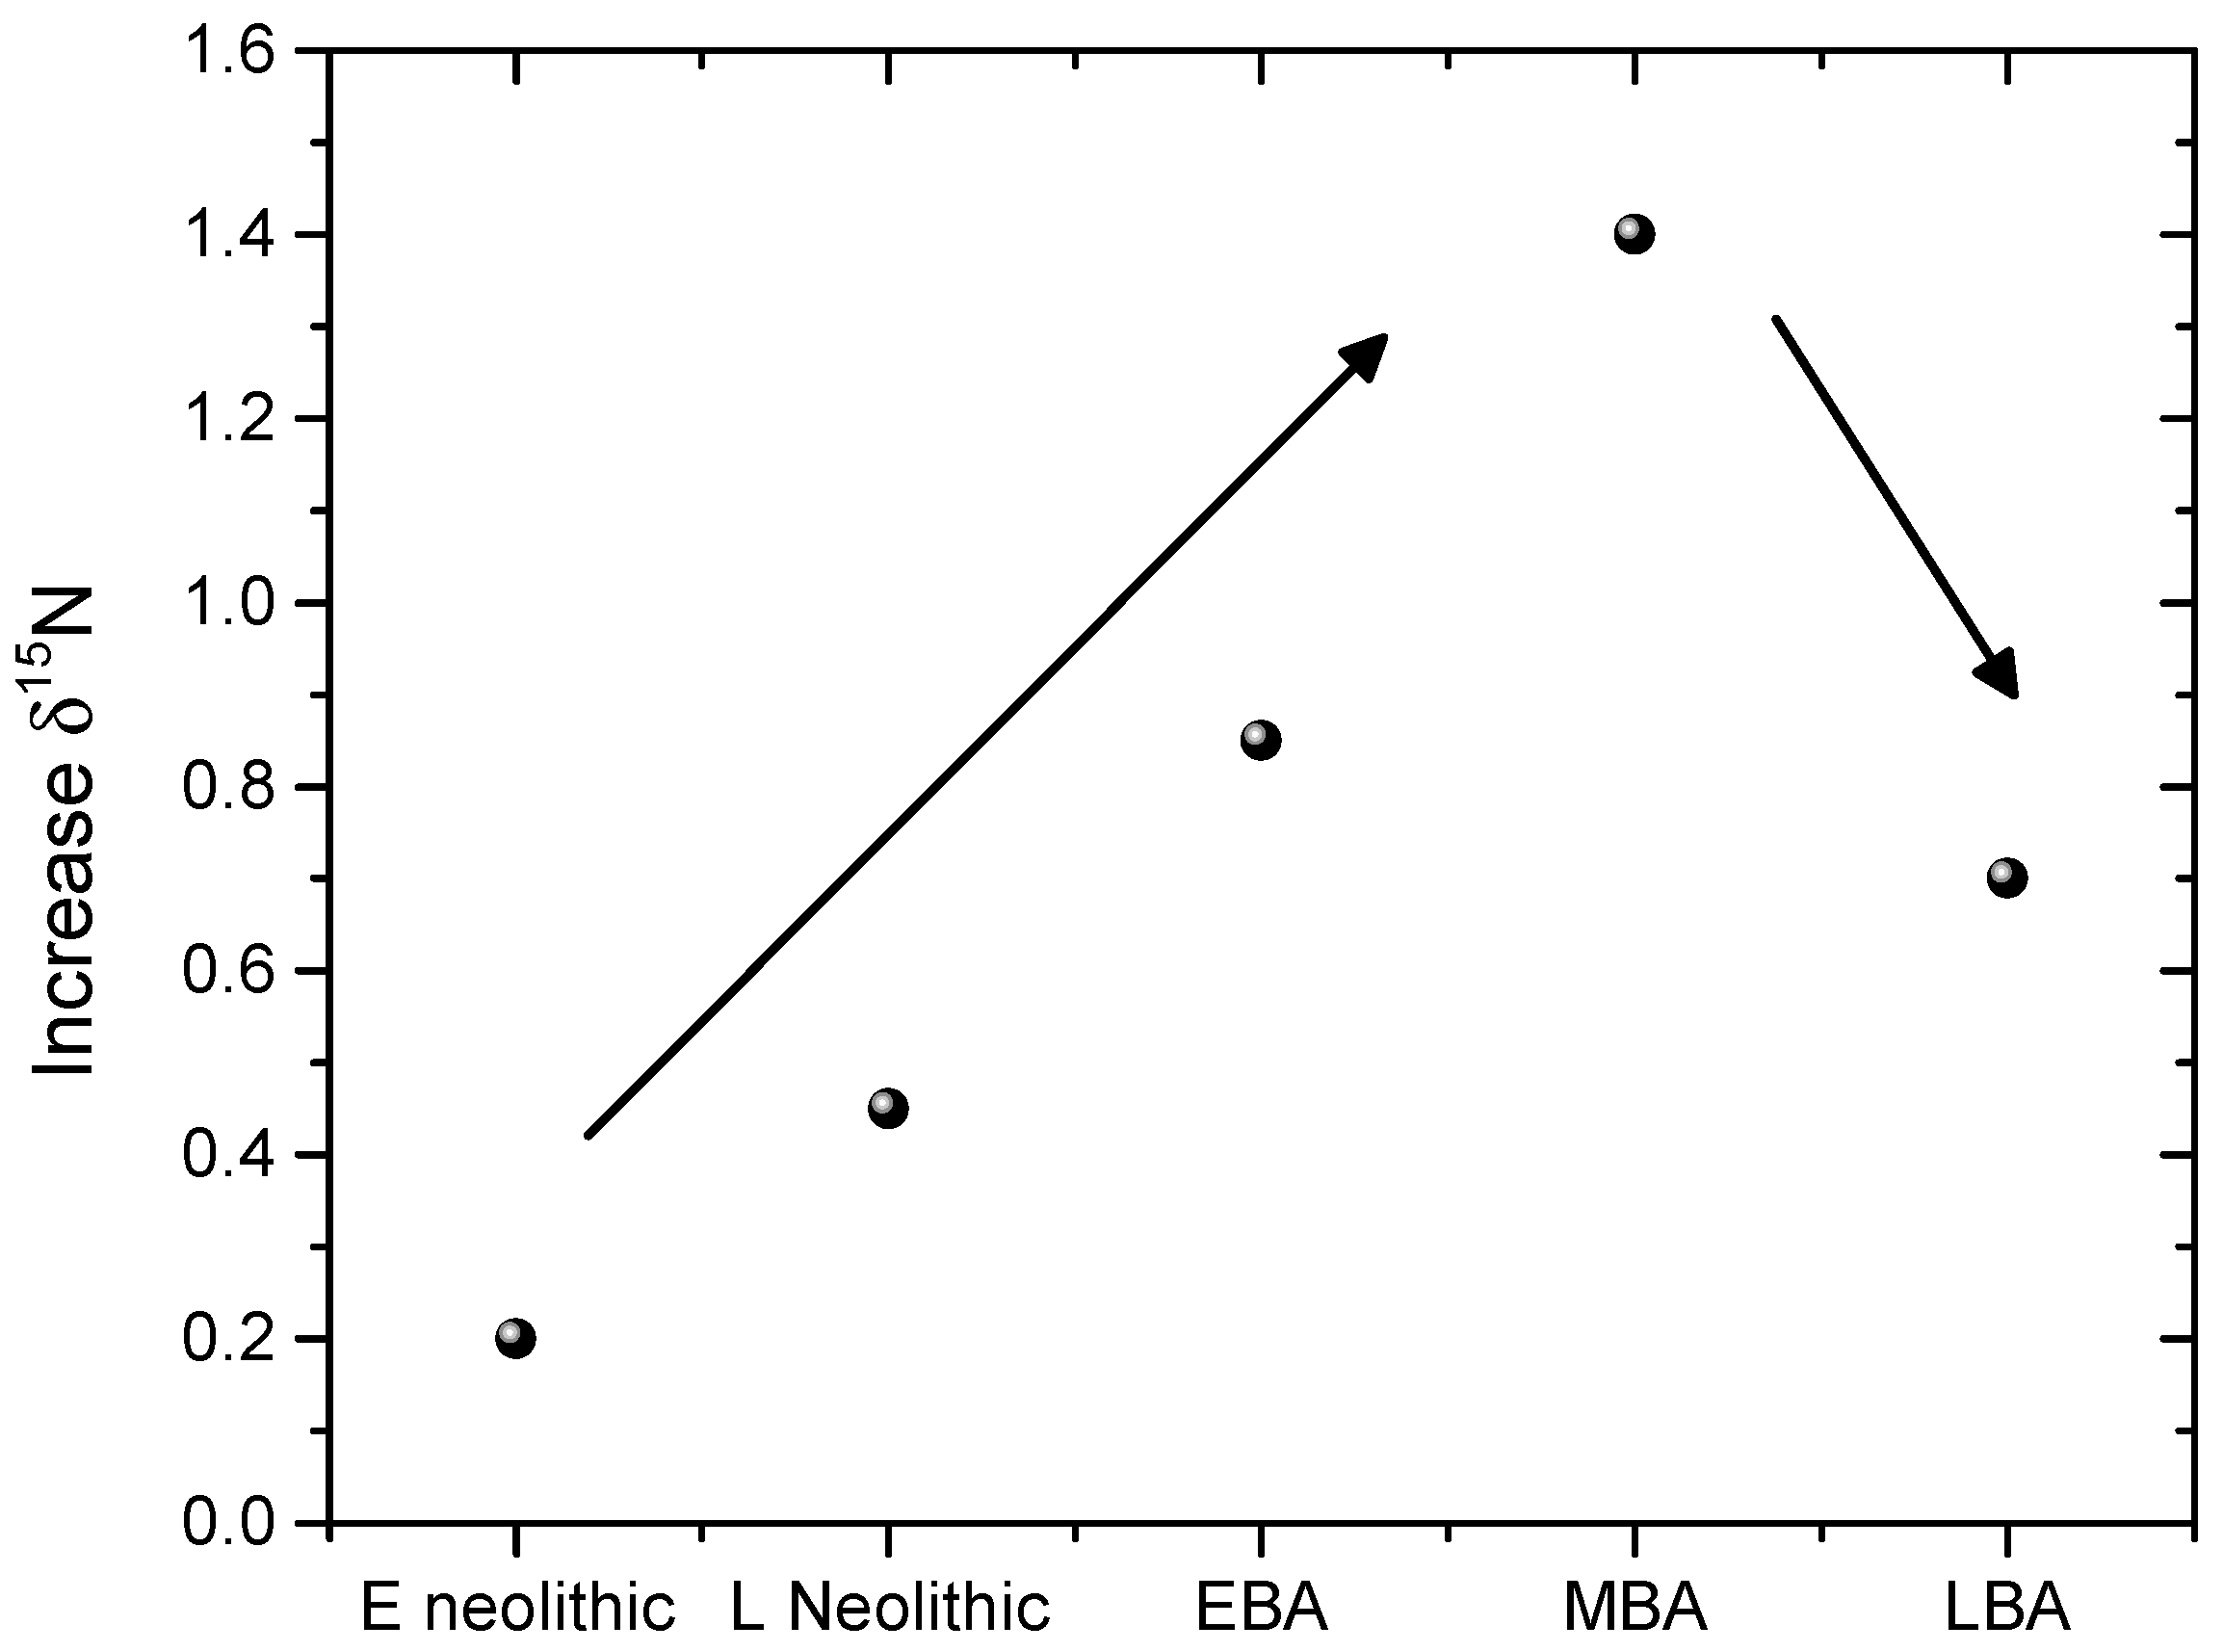
In Table 2, we provide the mean human bone collagen 15N and 13C values of 22 archeological sites of Greece from Early Neolithic to Late Bronze Age, as derived from the literature. In the same table, the elevation of the archaeological sites and the average precipitation of 1973–2000 are also provided. While the absolute precipitation values cannot be considered as constant during the studied periods, their relative differences can be assumed to be constant since the topology and elevation of the sites was not altered during these periods. Therefore, by assuming one site as a reference and calculating all the differences in precipitation, we can calculate from the slope (−0.38 mUr) the comparative effect of precipitation on the δ15N values. The correct choice of a reference site is crucial in order to determine the effect of the climate in the δ15N values correctly. If the reference site is chosen from a population that was consuming marine protein, then the results will be distorted. The most promising candidates are obviously the sites with more negative mean δ15N values of the bone collagen of humans. Among these sites, we will also take into account the elevation and the average precipitation (the higher the better) and of course any archeological evidence related to the sites (if there were fish bones recovered, nets, or if there was proximity to freshwater, rivers or lakes). After thoroughly considering all the above, we concluded the site of Theopetra as the most promising for reference, being the site with the least marine protein consumption. Nevertheless, we did all the possible combinations in choosing a reference site, and Theopetra was indeed the site with better results, while the site of Koufovouno showed the most enriched δ15N value.
In Figure 3 and in Table 2, we present the results of this analysis. By considering Theopetra as the reference site, we calculated the differences in precipitation of all the other sites (Table 2, Column 6). These precipitation differences were then converted to δ15N differences (climatic correction) by using the calculated slope (−0.38 mUr)/100 mm (Table 2, Column 7). For example, the precipitation difference of Frachti versus Theopetra was 428 − 604 mm = −176 mm. This difference was then multiplied by the slope, and the result was −0.7 mUr. That means that the Fracthi mean δ15N value would be 0.7 mUr less (8.0 mUr instead of 8.7 mUr) if it had the same precipitation as Theopetra. The calculated 0.7 mUr was the climatic effect caused by the difference in precipitation between Fracthi and Theopetra. Then, the difference of the δ15N values between Fracthi and Theopetra was 8.0 − 7.6 mUr = 0.4 mUr (last column of Table 2), and that difference can only be related to diet.
From Figure 3, we calculated the mean values for each period (EN, LN, EBA, MBA. and LBA), and the results are presented in Figure 4. The isotopic values of δ15N increased from Early Neolithic to Late Neolithic following Early Bronze Age (EBA) and reaching the maximum value at Middle Bronze Age (MBA). At LBA, a sharp drop was observed. This rise of the δ15N isotopic value can be correlated to the increase of marine protein consumption. The fall during the Late Bronze Age (LBA) period might be related to the onset of war where marine-related activities were probably abandoned or hindered.

3.3. Discussion

The application of this climate “correction” to the measured δ15N values of collagen of human bones from the 22 archeological sites of Greece from the Early Neolithic to Late Bronze Age had an immense impact on the interpretations of the isotopic values. In Figure 5, we present the differences of the δ15Ν values in reference to the site of Theopetra without applying the climate “correction” and with applying it (Columns 8 and 9 of Table 2, respectively). As we can observe from Figure 5, the differences actually altered the picture of what we consider as marine protein consumption during the studied periods.

3.3.1. For the EN

The Frachti site without the climate correction had over a 1 δ higher δ15N value (Column 8) compared to the site of Theopetra, thus indicating a considerable difference in marine protein consumption. By applying the climate effect on the δ15N values, the site of Frachti showed only a 0.4 δ increase in the 15N values (Column 9), which cannot be considered as a drastic deviation on the palaeodiet of the EN period.

3.3.2. For the LN

The sites of Kefalas and Alepotrypa were mostly effected by the climate “correction” on their δ15N values. For Kefalas, which had over 1.5 δ higher δ15N values in relation to the Theopetra site after the climate correction, its δ15N value lied within the mean values for the LN period. For the site of Alepotrypa, which was considered having none/minimum marine protein consumption after the climate correction, it showed a pattern similar to the Tharounia site. This is consistent with the fish and shellfish remains recovered at the site of Alepotrypa [37].

3.3.3. For the EBA

Manika and Perachora sites showed increased marine protein consumption in relation to the Theopetra site, but not at the extent that was considered without the climate correction.

3.3.4. For the MBA

The marine protein consumption of Asine and Argos were still observable, but lower. The site of Koufovouno differed significantly. Without the climate correction, the palaeodiet analysis of the site was inconclusive and most probably leaning towards a terrestrial C3 diet with minimal marine protein contribution [31]. After applying the climate correction, we observed the maximum difference in δ15Ν compared to the Theopetra site. This result changes the perspective for the site and may be related to low trophic level marine foodstuff such as sardines and anchovies, which fall below the detection threshold of the methods used [17,38,39].

3.3.5. For the LBA

In the majority of the LBA sites, the marine protein consumption was reduced after the application of the climate correction, especially for the sites of Korinos and Pineiada. On the contrary, the sites of Spathes and Ag. Triada showed an increase in marine protein consumption. Again, this result changes the perspective and may be related to consumption of shellfish or low level fish that fall below the detection threshold of the methods used [17,38,39].
The above analysis is based on the assumption that the site of Theopetra was consuming no (or the least) marine protein. All the above conclusions were in comparison to the Theopetra site and do not explicitly imply that the elevated δ15N values (compared to Theopetra) were solely from marine origin. The elevated values may arise from marine protein (low level fish), consumption of birds, or even freshwater food elements, or a combination of all the above, and variations in the bone collagen δ13C values must also be considered. This is a comparative analysis with the aim to “eliminate” the climate effect on the δ15N values of the human bone collagen and rectify misconceptions that the lower δ15N value automatically means less marine protein diet without taking into account the elevation and precipitation of the sites. This is evident in Figure 5, where the sites of Alepotrypa and Ag. Triada had the lowest mean 15N value, but after applying the climate “correction”, both sites had average δ15N values. Furthermore, archeological findings like fishing tackles, shellfish, and fish bones indicate that a fishing technology was available even from the Neolithic period [40,41].
As a final note, the calculated slope for the δ15N versus precipitation can be applied to other sites of Greece from different periods (from the Iron to Late Byzantine period), but it is outside the scope of the current publication, as is any study of the effect of climate on the associated δ13C isotopic values. Nevertheless, we calculated the slopes of the δ13C versus precipitation for the samples of Table 1, and the effect of climate on the values of δ13C was found significantly less profound (see Supplementary Figure S1). We also tried to investigate the role of temperature as an environmental factor for the δ15N human bone collagen values. Unfortunately, no conclusive relation was derived due to the small temperature range that was available (see Supplementary Figure S2).

3.4. Intra-Site Considerations

The mean value of the δ15N of the human bone collagen of each site is useful in order to have an estimation of the general diet habits of the population. Deviations from the mean value are expected if the individuals are on different diets (due to social status) or are foreigners (travelers, prisoners/slaves). Another possibility is that the individuals lived in different periods during the lifetime of each site, and during this period, the climate difference can account for the deviations in the δ15N bone collagen values. In order to test this possibility, we assumed that a total change in precipitation ±100 mm can be considered as maximum (since the climate of Greece during the studied periods did not change drastically [42,43,44], and that would lead to ±0.4 δ (the calculated rate of change for every 100 mm of precipitation) in the values of the δ15N bone collagen. In Table 3, we present only the sites with 10 or more samples (Column 4). In Table 3, we calculated the percentage (last column of Table 3) of the samples that were outside this ±0.4 δ range (estimated climatic effect) from the mean value of each site (Column 3). For example, the mean δ15N bone collagen value for the site of Fragthi was 8.7 mUr. The range of the climatic effect (±0.4 δ) was then calculated as 9.1 mUr and 8.3 mUr. In the last column, we calculated the % of the samples that were outside the 9.1−8.3 mUr range, which in the case of Fragthi were seven out of 10 samples, thus 70%.
For the sites of Frachti, Alepotrypa, Asine, and Kalopodi, more than 50% of the samples were outside the estimated climate range, indicating intense diet differences probably related to social status.

4. Conclusions

Slopes of δ15N values of contemporary C3 plants, herbivores, and humans from Greece versus precipitation were calculated. The slopes calculated for Greece were quite comparable to the literature [11,35,36], supporting the hypothesis that this relationship is applicable over a wide range of geographic settings and indicating that diet and climate have opposing influences on the final value of δ 15N. The relation between precipitation and 15N, as derived from the C3 plants (−0.38 mUr/100 mm), can be considered as constant for the Greek territory (since it depends on the elevation and the general geomorphology) and formulates the effect of the climate on the δ15N values in the general area of Greece. As a case study, we applied this slope to published human bone collagen δ15N values from 22 archeological sites (Early Neolithic to Late Bronze Age) of Greece. This analysis is a comparative study that aims to eliminate the climate effect on the δ15N collagen values and allow a more accurate interpretation of the published isotopic data. The application of the climate correction drastically altered the values of the δ15N isotopic data and hopefully will shed new light on the paleodiet of the studied periods. Finally, for the observed intra-site variations of δ15Ν, we assumed a ±100-mm change in precipitation during the lifetime of each site, which led to a ±0.4 δ variation on the measured δ15N values due to the climate effect. In our opinion, a threshold equal to 0.8 δ in the variation of δ15N exists, under which it is not safe to discuss the different dietary habits (like increased consumption of marine protein).

Supplementary Materials

The following are available online at https://www.mdpi.com/2076-3263/9/5/217/s1, Figure S1: δ13C values of C3 plant, Herbivores and human samples versus precipitation, Figure S2. δ15N values of C3 plants samples versus temperature.

Author Contributions

Conceptualization, data curation, formal analysis, methodology, and writing, E.D. and G.D.; funding acquisition, E.D.

Funding

This research received no external funding.

Conflicts of Interest

The authors declare no conflict of interest.

References

  1. Brand, W.A.; Coplen, T.B. Stable isotope deltas: Tiny, yet robust signatures in nature. Isotopes Environ. Health Stud. 2012, 48, 393–409. [Google Scholar] [CrossRef]
  2. DeNiro, M.J.; Epstein, S. Influence of diet on the distribution of nitrogen isotopes in animals. Geochim. Cosmochim. Acta 1981, 45, 341–351. [Google Scholar] [CrossRef]
  3. Schwarcz, H.P.; Schoeninger, M.J. Stable isotope analyses in human nutritional ecology. Am. J. Phys. Anthropol. 1991, 34, 283–321. [Google Scholar] [CrossRef]
  4. Ambrose, S.H. Isotopic Analysis of Palaeodiets: Methodological and Interpretive Consideration. 1993. Available online: http://agris.fao.org/agris-search/search.do?recordID=US9514697 (accessed on 3 April 2019).
  5. Schoeninger, M.J.; DeNiro, M.J. Nitrogen and carbon isotopic composition of bone collagen from marine and terrestrial animals. Geochim. Cosmochim. Acta 1984, 48, 625–639. [Google Scholar] [CrossRef]
  6. Lubell, D.; Jackes, M.; Schwarcz, H.; Knyf, M.; Meiklejohn, C. The Mesolithic-Neolithic transition in Portugal: Isotopic and dental evidence of diet. J. Archaeol. Sci. 1994, 21, 201–216. [Google Scholar] [CrossRef]
  7. Iacumin, P.; Bocherens, H.; Delgado Huertas, A.; Mariottoi, A.; Longinelli, A. A stable isotope study of fossil mammal remains from the Paglicci cave, Southern Italy. N and C as palaeoenvironmental indicators. Earth Planet. Sci. Lett. 1997, 148, 349–357. [Google Scholar] [CrossRef]
  8. Wada, E.; Kadonaga, T.; Matsuo, S. 15N abundance in nitrogen of naturally occurring substances and global assessment of denitrification from isotopic viewpoint. Geochem. J. 1975, 9, 139–148. [Google Scholar] [CrossRef]
  9. Cheng, H.; Bremner, J.; Edwards, A. Variations of nitrogen-15 abundance in soils. Science 1964, 146, 1574–1575. [Google Scholar] [CrossRef]
  10. Mariotti, A.; Pierre, D.; Vedy, J.C.; Guillemot, J. The abundance of natural nitrogen 15 in the organic matter of soils along an altitudinal gradient (Chablais, Haute Savoie, France). CATENA 1980, 7, 293–300. [Google Scholar] [CrossRef]
  11. Heaton, T.H.; Vogel, J.C.; von la Chevallerie, G.; Collett, G. Climatic influence on the isotopic composition of bone nitrogen. Nature 1986, 322, 822. [Google Scholar] [CrossRef]
  12. Ambrose, S.H.; DeNiro, M.J. Climate and habitat reconstruction using stable carbon and nitrogen isotope ratios of collagen in prehistoric herbivore teeth from Kenya. Quat. Res. 1989, 31, 407–422. [Google Scholar] [CrossRef]
  13. Sealy, J.C.; van der Merwe, N.; Lee, J.A.; Lanham, J.L. Nitrogen isotopic ecology in southern Africa: Implications for environmental and dietary tracing. Geochim. Cosmochim. Acta 1987, 51, 2707–2717. [Google Scholar] [CrossRef]
  14. Drucker, D.; Bocherens, H.; Bridault, A.; Billiou, D. Carbon and nitrogen isotopic composition of red deer (Cervus elaphus) collagen as a tool for tracking palaeoenvironmental change during the Late-Glacial and Early Holocene in the northern Jura (France). Palaeogeogr. Palaeoclimatol. Palaeoecol. 2003, 195, 375–388. [Google Scholar] [CrossRef]
  15. Bogaard, A.; Heayon, T.H.E.; Poulton, P.; Merbach, I. The impact of manuring on nitrogen isotope ratios in cereals: Archaeological implications for reconstruction of diet and crop management practices. J. Archaeol. Sci. 2007, 34, 335–343. [Google Scholar] [CrossRef]
  16. Kreitler, C.W.; Jones, D.C. Natural soil nitrate: The cause of the nitrate contamination of ground water in Runnels County, Texas. Groundwater 1975, 13, 53–62. [Google Scholar] [CrossRef]
  17. Dotsika, E.; Diamantopoulos, G.; Lykoudis, S.; Gougoura, S.; Kranioti, E.; Karalis, P.; Michael, D.; Samartzidou, E.; Palaigeorgiou, E. Establishment of a Greek Food Database for Palaeodiet Reconstruction: Case Study of Human and Fauna Remains from Neolithic to Late Bronze Age from Greece. Geosciences 2019, 9, 165. [Google Scholar] [CrossRef]
  18. O’Connell, T.C.; Hedges, R.E.M.; Healey, M.A.; Simpson, A.H.R.W. Isotopic comparison of hair, nail and bone: Modern analyses. J. Archaeol. Sci. 2001, 28, 1247–1255. [Google Scholar] [CrossRef]
  19. Ambrose, S.H. Preparation and characterization of bone and tooth collagen for isotopic analysis. J. Archaeol. Sci. 1990, 17, 431–451. [Google Scholar] [CrossRef]
  20. Tykot, R.H. Stable Isotopes and Diet: You Are What You Eat. Available online: http://luna.cas.usf.edu/~rtykot/PR39%20-%20Enrico%20Fermi%20isotopes.pdf (accessed on 3 April 2019).
  21. Service, H.N.M. Climatic Atlas of Greece, 1971–2000. Available online: http://climatlas.hnms.gr/sdi/?lang=EN (accessed on 3 April 2019).
  22. Triantaphyllou, S. A Bioarchaeological Approach to Prehistoric Cemetery Populations from Central and Western Greek Macedonia. 2001. Available online: http://etheses.whiterose.ac.uk/14790/1/312328.pdf (accessed on 3 April 2019).
  23. Triantaphyllou, S.; Richards, M.P.; Zerner, C.; Voutsaki, S. Isotopic dietary reconstruction of humans from Middle Bronze age Lerna, Argolid, Greece. J. Archaeol. Sci. 2008, 35, 3028–3034. [Google Scholar] [CrossRef]
  24. Analyses of Middle Helladic Skeletal Material from Aspis, Argos, 2. Stable Isotope Analysis of Human Remains. Available online: https://www.persee.fr/doc/bch_0007-4217_2006_num_130_2_7430 (accessed on 3 April 2019).
  25. Papathanasiou, A. A Bioarchaeological Analysis of Neolithic Alepotrypa Cave, Greece; British Archaeological Reports Ltd.: Oxford, UK, 2001; Volume 961. [Google Scholar]
  26. Petroutsa, E.I.; Manolis, S.K. Reconstructing Late Bronze Age diet in mainland Greece using stable isotope analysis. J. Archaeol. Sci. 2010, 37, 614–620. [Google Scholar] [CrossRef]
  27. Petroutsa, E.I. An Investigation in the Nuitrition of Bronze Age Poplulations in Greece (in Greek); National University of Athens: Athens, Greece, 2007. [Google Scholar]
  28. Ingvarsson-Sundström, A.; Richards, M.P.; Voutsaki, S. Stable isotope analysis of the Middle Helladic population from two cemeteries at Asine: Barbouna and the east cemetery. Mediterr. Archaeol. Archaeometry 2009, 9, 1–14. [Google Scholar]
  29. Papathanasiou, A. Stable isotope analysis in Neolithic Greece and possible implications on human health. Int. J. Osteoarchaeol. 2003, 13, 314–324. [Google Scholar] [CrossRef]
  30. Kontopoulos, I.; Sampson, A. Prehistoric diet on the island of Euboea, Greece: An isotopic investigation. Mediterr. Archaeol. Archaeom. 2015, 15, 97–111. [Google Scholar]
  31. Lagia, A.; Petroutsa, E.; Manolis, S. Health and Diet During the MBA in the Peloponnese: The Site of Kouphovouno. In Cooking Up the Past: Food and Culinary Practices in the Neolithic and Bronze Age Aegean; Oxbow: Oxford, UK, 2007; pp. 313–328. [Google Scholar]
  32. Petroutsa, E.I.; Richards, M.P.; Manolis, S.K. Stable isotope analysis of human remains from the Early Helladic site of Perachora, Korinth, Greece. In Cooking Up the Past; Oxbow: Oxford, UK, 2007; pp. 290–296. [Google Scholar]
  33. Petroutsa, E.I.; Richards, M.P.; Kolonas, L.; Manolis, S.K. Isotope Paleodietary Analysis of Humans and Fauna from the Late Bronze Age Site of Voudeni; The American School of Classical Studies at Athens: Athina, Greece, 2009. [Google Scholar]
  34. Vika, E. From Diet to Society: Stable Isotope Analysis and Its Cultural Context in Bronze Age Peloponnese, Greece. Ph.D Thesis, University of Bradford, Bradford, UK, 2002. [Google Scholar]
  35. Heaton, T.H. The 15 N/14 N ratios of plants in South Africa and Namibia: Relationship to climate and coastal/saline environments. Oecologia 1987, 74, 236–246. [Google Scholar] [CrossRef]
  36. Schwarcz, H.P.; Dupras, T.L.; Fairgrieve, S.I. 15N enrichment in the Sahara: In search of a global relationship. J. Archaeol. Sci. 1999, 26, 629–636. [Google Scholar] [CrossRef]
  37. Papathanasopoulos, G.A.; Goulandre, H.N.P.; Technes, M.K. Neolithic Culture in Greece; Goulandris Foundation: Athens, Greece, 1996. [Google Scholar]
  38. Vika, E.; Theodoropoulou, T. Re-investigating fish consumption in Greek antiquity: Results from δ13C and δ15N analysis from fish bone collagen. J. Archaeol. Sci. 2012, 39, 1618–1627. [Google Scholar] [CrossRef]
  39. Garvie-Lok, S.J. Loaves and Fishes: A Stable Isotope Reconstruction of Diet in Medieval Greece; University of Calgary: Alberta, Canada, 2001. [Google Scholar]
  40. Moundrea-Agrafioti, A. Mesolithic Fish Hooks from the Cave of Cyclope, Youra; British School at Athens Studies: Athina, Greece, 2003; pp. 131–141. [Google Scholar]
  41. Farrand, W.R. Depositional Environments and Site Formation During the Mesolithic Occupations of Franchthi Cave, Peloponnesos, Greece; British School at Athens Studies: Athina, Greece, 2003; pp. 69–78. [Google Scholar]
  42. Psomiadis, D.; Dotsika, E.; Albanakis, K.; Ghaleb, B.; Hillaire-Marcel, C. Speleothem record of climatic changes in the northern Aegean region (Greece) from the Bronze Age to the collapse of the Roman Empire. Palaeogeogr. Palaeoclimatol. Palaeoecol. 2018, 489, 272–283. [Google Scholar] [CrossRef]
  43. Geraga, M.; Ioakim, C.; Lykousis, V.; Tsaila-Monopolis, S.; Mylona, G. The high-resolution palaeoclimatic and palaeoceanographic history of the last 24,000 years in the central Aegean Sea, Greece. Palaeogeogr. Palaeoclimatol. Palaeoecol. 2010, 287, 101–115. [Google Scholar] [CrossRef]
  44. Frogley, M.R.; Griffiths, H.I.; Heaton, T.H. Historical biogeography and Late Quaternary environmental change of Lake Pamvotis, Ioannina (north-western Greece): Evidence from ostracods. J. Biogeogr. 2001, 28, 745–756. [Google Scholar] [CrossRef]
Figure 1. Spatial distribution of human sites. The numbers in parenthesis denote the number of human samples at each site. The red dots are the sites of recent C3 plants. The insert is precipitation data (1971–2000) from the site of the Hellenic National Meteorological Service [21].
Geosciences 09 00217 g001
Figure 2. Slopes for the variation of δ15N versus precipitation for Greek C3 plants, herbivores, and humans (data from Dotsika et al. [17] and Table 1). The slope of human bones from Schwarcz et al. [35] for the same range of precipitation is also provided. We follow the notation of (mUr), which corresponds to (‰) [1].
Geosciences 09 00217 g002
Figure 3. Difference of human bone collagen δ15Ν values of the 22 archaeological sites considered in this study compared to the site of Theopetra. EN = Early Neolithic, LN = Late Neolithic, EBA = Early Bronze Age, MBA = Middle Bronze Age, LBA = Late Bronze Age.
Geosciences 09 00217 g003
Figure 4. The mean differences of the human bone collagen δ15Ν values (in reference to Theopetra) for each studied period. An almost linear increase in the marine protein consumption is observed from EN up to MBA. A drop during the LBA is observed.
Geosciences 09 00217 g004
Figure 5. Difference of human bone collagen δ15Ν values of the 22 archaeological sites considered in this study compared to the site of Theopetra with the climate correction (white columns) and without (red columns).
Geosciences 09 00217 g005
Table 1. Mean isotopic values of contemporary humans, herbivores, and C3 plants of Greece.
SpeciesnLocationCoordinatesMean Annual Precipitation (mm) δ13Cδ15N
Humans
4Naxos-Damarionas37.05, 25.47550−21.110.0
2Imathia-Alexandria 40.62, 22.44485−20.39.8
2Corinthia-Manna 37.98, 22.51963−21.48.5
1Corinthia-Kamari 38.09, 22.57573−21.19.7
1Xios 38.38, 26.04427−20.110.4
4Messenia-Kopanaki 37.28, 21.81700−21.89.1
1Messenia-Manesis37.08, 21.89750−20.78.9
1Messenia-Avramiou 37.67, 21.46700−20.59.3
2Halkidiki-Polygyros40.37, 23.44586−20.59.7
1Aetolia-Acarnania Chrisovitsa 38.57, 21.70900−21.89.0
1Attiki-Athens37.98, 23.73420−21.210.2
Herbivores
Sheep, Ovis aries7Crete, Heraklion35.34, 25.14500−20.65.9
Sheep, Ovis aries5Sparta37.08, 22.43700−23.54.7
Sheep, Ovis aries6Chalkidiki40.51, 23.63550−21.46.0
Sheep, Ovis aries4Karditsa39.37, 21.93676−20.76.1
Cow, Bos taurus3Attiki37.92, 23.86420−21.25.1
Cow, Bos taurus7Karditsa39.37, 21.93676−21.45.3
Cow, Bos taurus3Sparta mountain37.08, 22.33800−23.03.5
C3 plants
Cercis6Parnitha38.13, 23.81504−27.43.2
Platanus orientalis7Parnitha38.13, 23.81504−28.52.6
Quercus sp.6Domnista38.58, 21.851207−28.40.4
Olea europaea3Parnitha38.13, 23.81504−26.27.1
Juglans regia2Karpenisi38.92, 21.781212−28.21.7
Corylus avellana2Karpenisi38.92, 21.781212−27.91.4
Picea abies1Attiki37.98, 23.73611−30.23.4
Pinus Pinea1Attiki37.98, 23.73611−27.13.7
Olea europaea2Criti, Chania35.52, 24.02557−28.32.1
Olea europaea2Analipsi, Messinia37.02, 21.97766−29.53.8
Olea europaea1Vasilada, Messinia37.09, 21.94936−30.11.2
Olea europaea1Velika, Messinia37.01, 21.93870−29.21.1
Olea europaea1Diodia, Messinia37.08, 21.861081−28.91.7
Olea europaea2Lykotrafos, Messinia37.05, 21.95829−292.3
Olea europaea1Madena, Messinia37.04, 21.96797−29.41.1
Olea europaea2Neochori, Messinia37.03, 21.92918−29.61.3
Olea europaea1Pilalistra, Messinia37.07, 21.97834−28.64.1
Olea europaea1Polylofos, Messinia37.09, 21.91998−29.84
Olea europaea3Avramio, Messinia37.03, 22.03760−28.93
Olea europaea1Messini, Messinia37.05, 22.01753−29.63.2
Table 2. Differences of the δ15N values of human bone collagen of the 22 studied sites with respect of the Theopetra site (in bold). E = Elevation, P = Precipitation, ΔP = Precipitation difference, Δ(δ15N) = δ15N difference.
SitePeriodE (m)P (mm)δ15NΔ P (mm)Climatic CorrectionΔ (δ15N)Δ (δ15N) with Climatic Correction
FrachtiEN294288.7−176−0.71.10.4
TheopetraEN2366047.600.00.00.0
KefalasLN633509.2−254−1.01.50.6
TharrouniaLN3995928.0−120.00.40.3
KouvelakiLN3506608.1560.20.40.6
AlepotrypaLN257917.31870.7−0.40.3
ManikaEBA44519.0−153−0.61.40.8
PerachoraEBA2554609.0−144−0.51.40.9
AsineMBA1104119.5−193−0.71.81.1
ArgosMBA494869.1−118−0.41.51.0
Koufovouno MBA27110917.94871.80.22.1
KorinosLBA184088.7−196−0.71.10.4
PineiadaLBA904239.1−181−0.71.40.8
RymnioLBA3304268.9−178−0.71.20.5
KritikaLBA1184449.3−160−0.61.71.1
AlmyriLBA185109.3−94−0.41.71.3
Zeli LBA1795738.4−31−0.10.80.7
KalapodiLBA3605738.5−31−0.10.80.7
VoudeniLBA2136168.3120.00.70.7
TriantaLBA146408.0360.10.40.5
SpathesLBA10807337.61290.50.00.5
Ag TriadaLBA4919047.23001.1−0.40.7
Table 3. Percentage of samples outside the climate effect range.
SitePeriodδ15NNumber of Samples% of Samples outside the ±0.4 δ Range
FrachtiEN8.71070.0
TheopetraEN7.61233.3
TharrouniaLN8.02050.0
AlepotrypaLN7.32560.0
PerachoraEBA9.01926.3
AsineMBA9.51957.9
KritikaLBA9.31225.0
AlmyriLBA9.33417.6
Zeli LBA8.42040.0
KalapodiLBA8.51369.2
VoudeniLBA8.32445.8
Ag TriadaLBA7.210632.1

