Role of Trapped Air on the Tsunami-Induced Transient Loads and Response of Coastal Bridges


Abstract
:1. Introduction
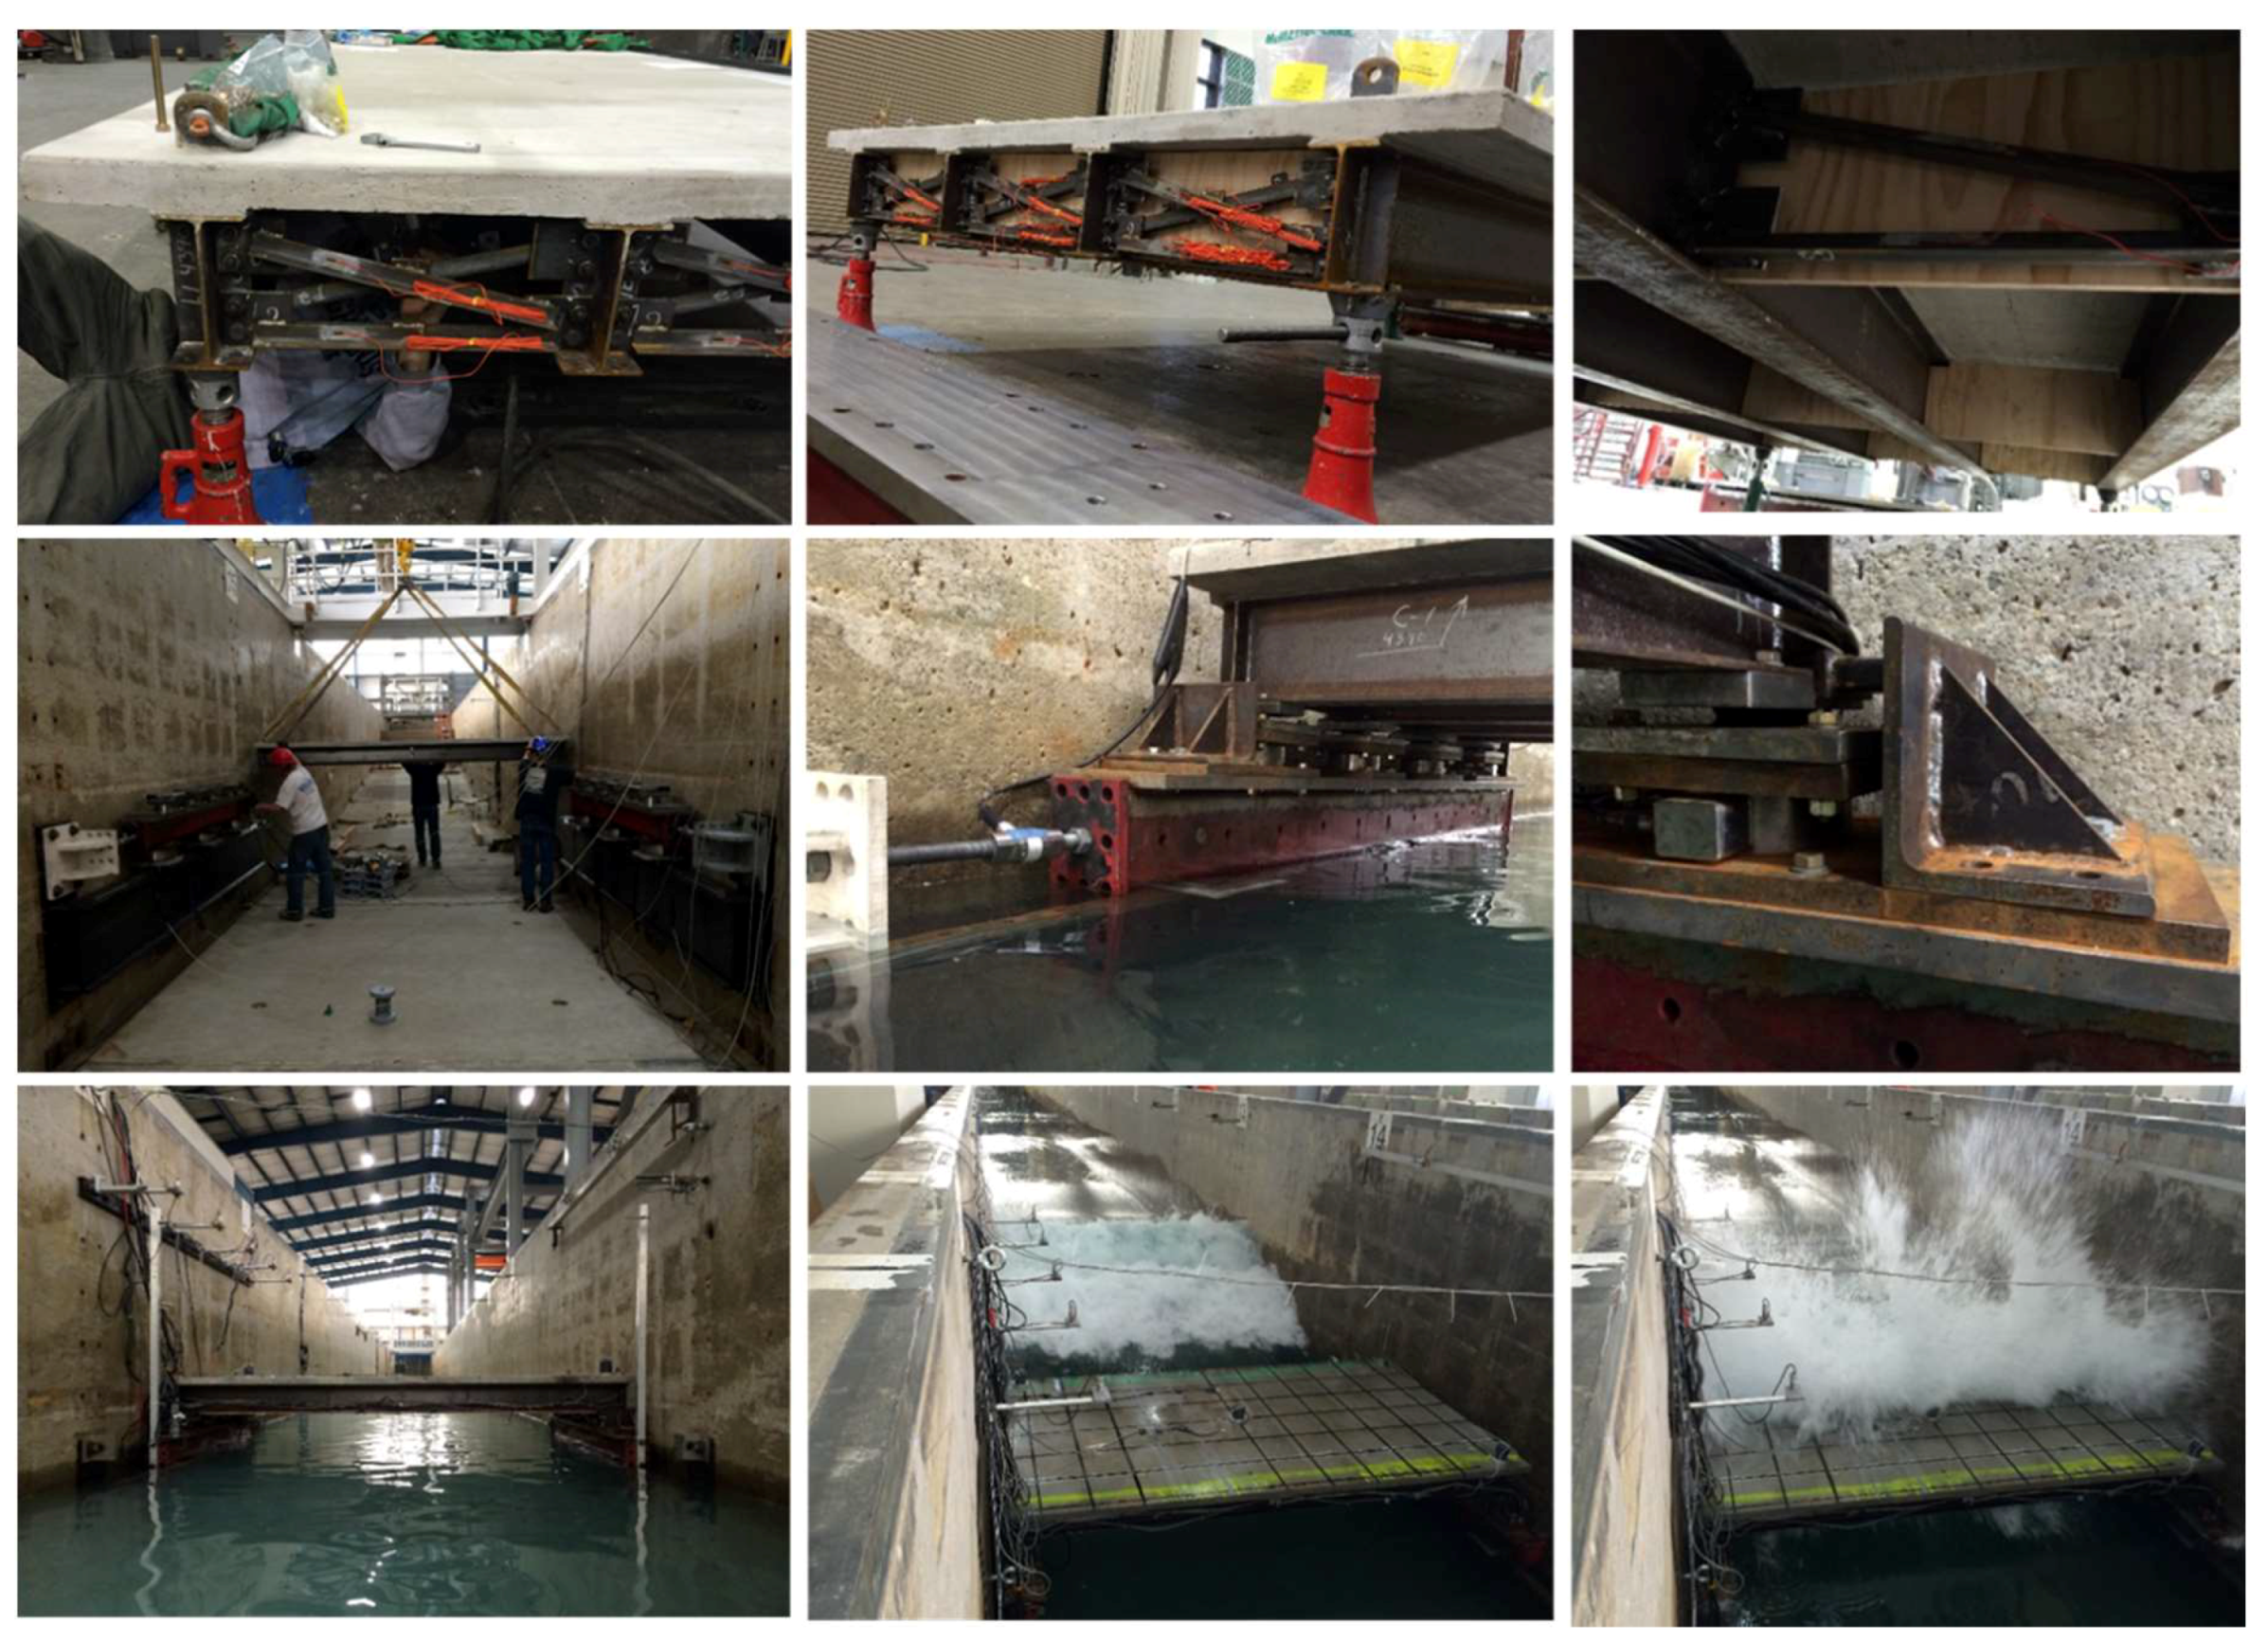
- Large scale (1:5) of the experiments, which enabled the physical modeling of a realistic bridge deck with structural components used in current practice, such as a reinforced concrete deck, steel girders, cross-frames, shear-keys, etc;
- Flexible elastomeric bearings that allowed the deck to move vertically and rotate along the longitudinal axis, simulating; therefore, the wave–structure interaction during the tsunami inundation; and
- Experimental setup, which permitted the measurement of not only the total horizontal and uplift forces but the demand in individual bearings, columns, shear keys, and bent cap.
2. Experimental Program
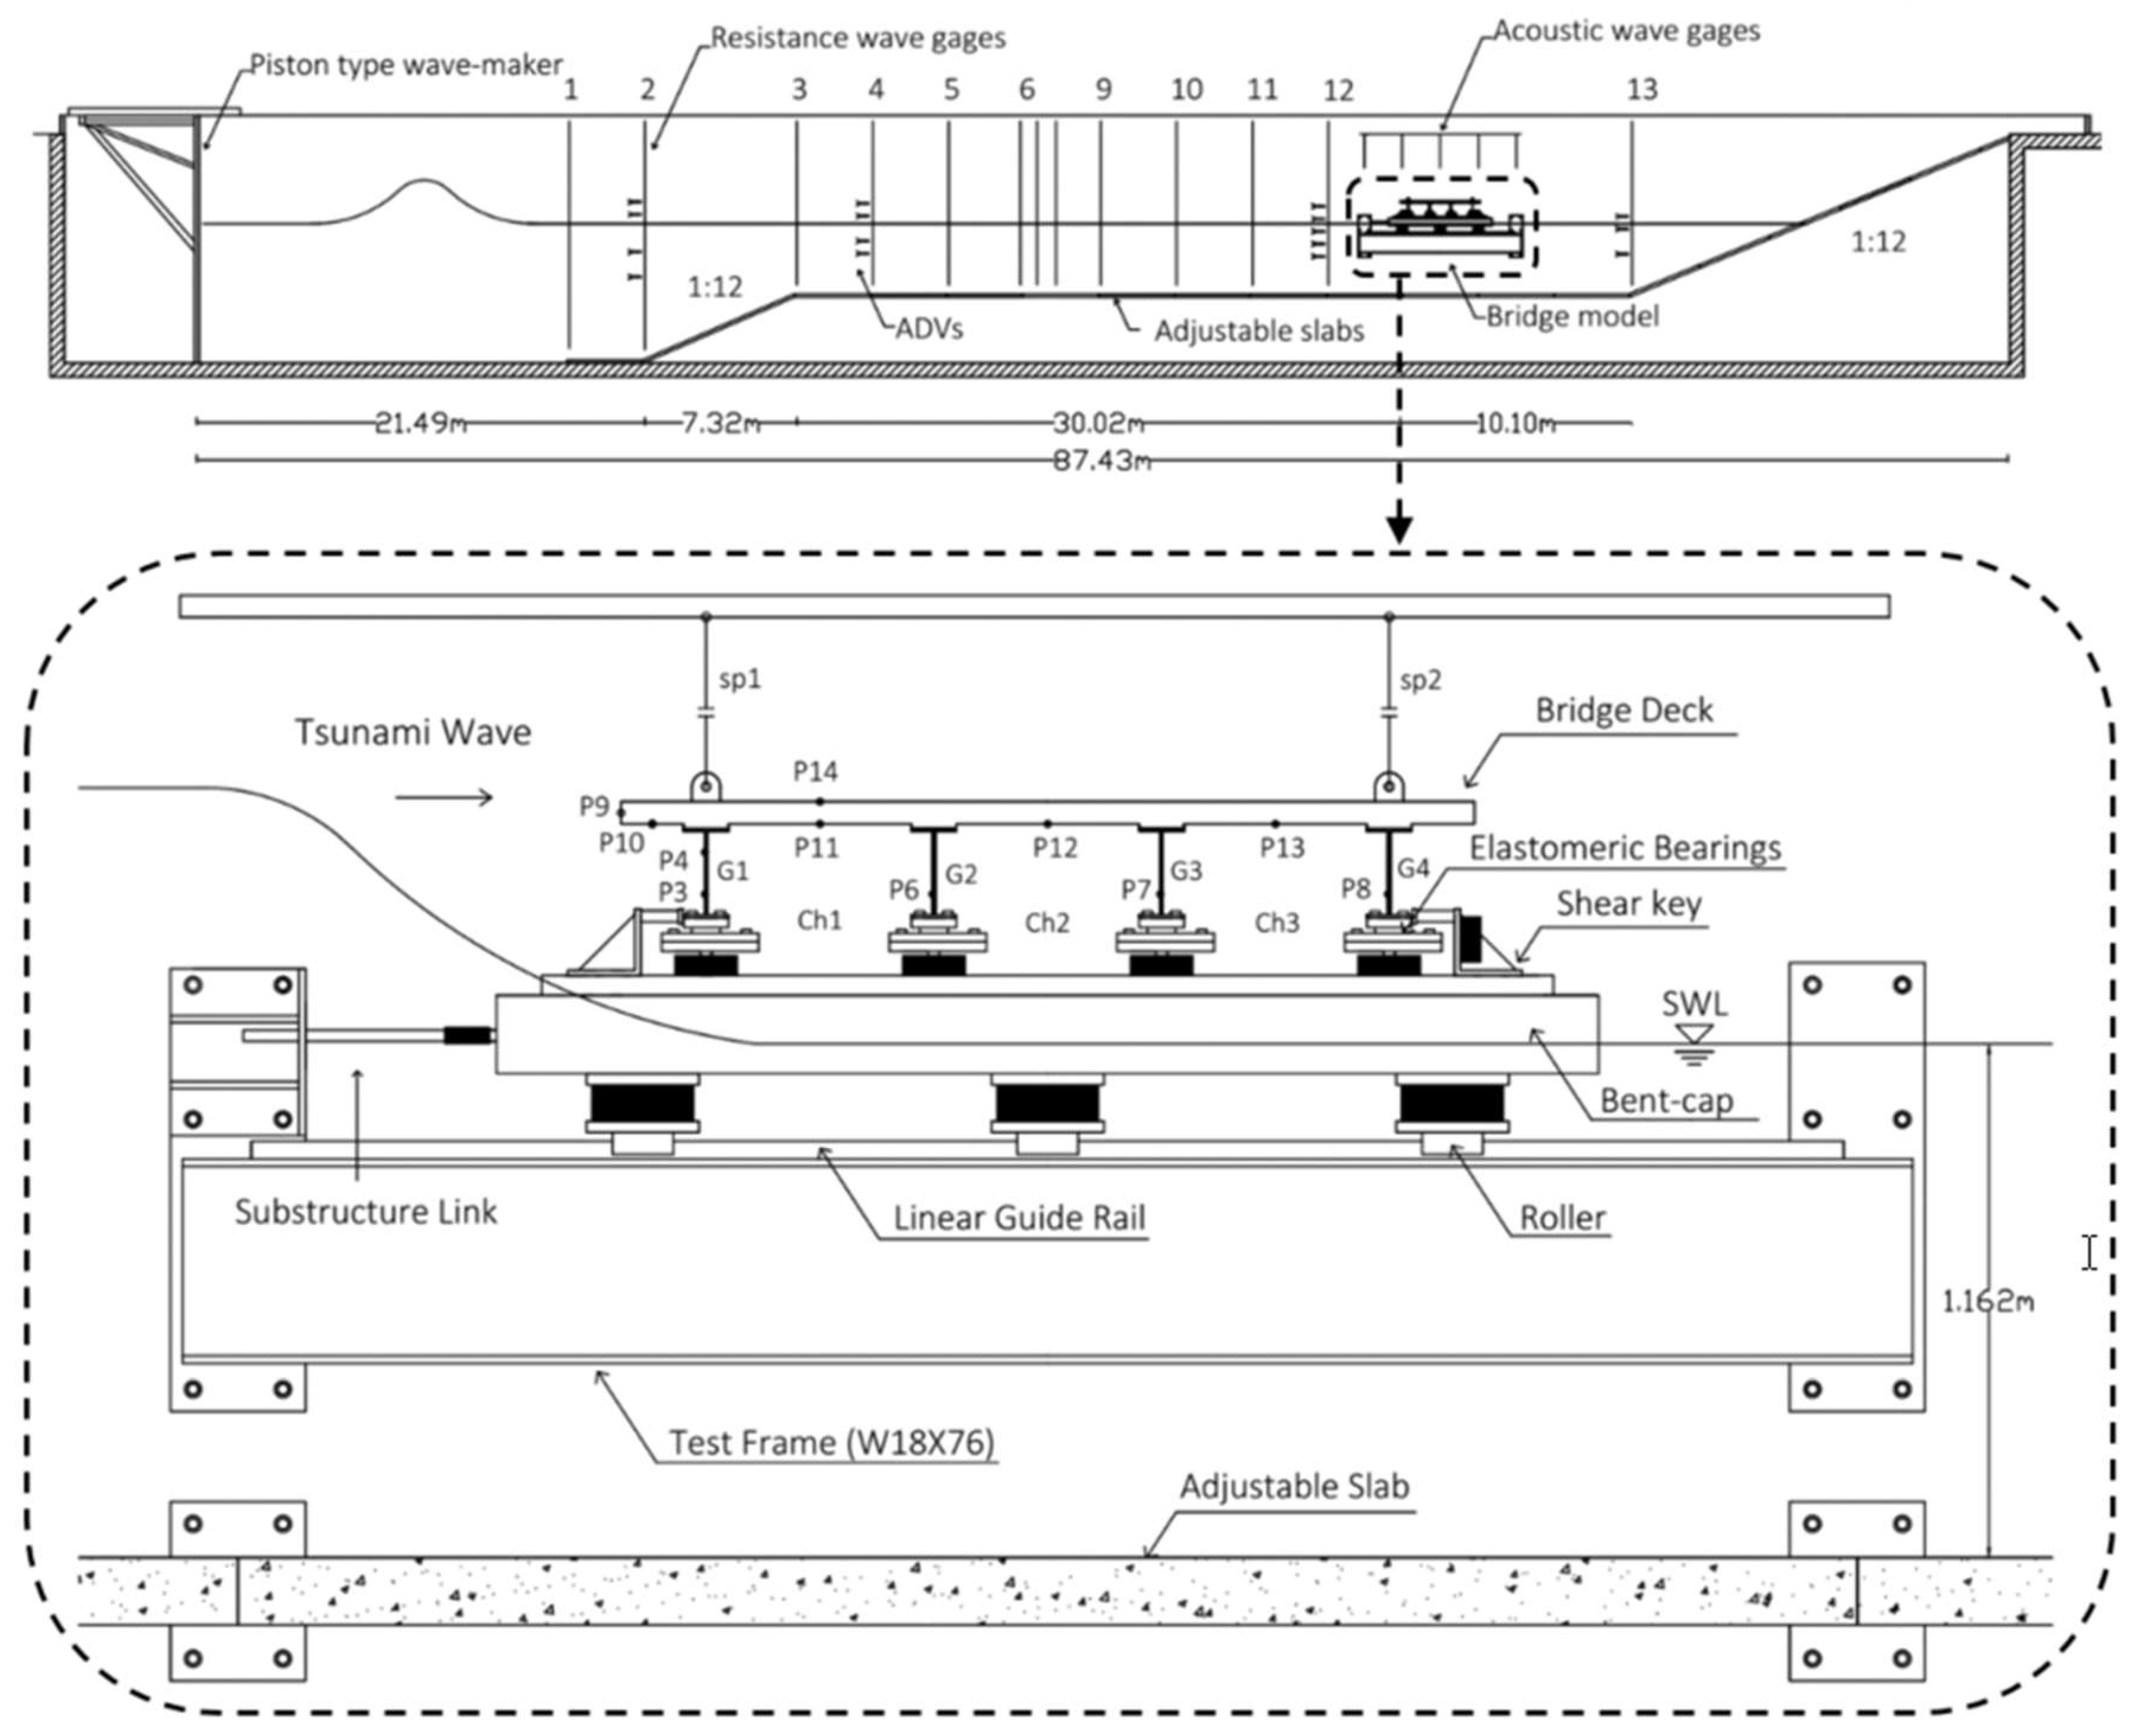
2.1. Facility and Flume Bathymetry
2.2. Bridge Description and Experimental Setup
2.3. Wave Matrix
2.4. Instrumentation and Calculated Quantities
3. Results: Deck with Cross-Frames
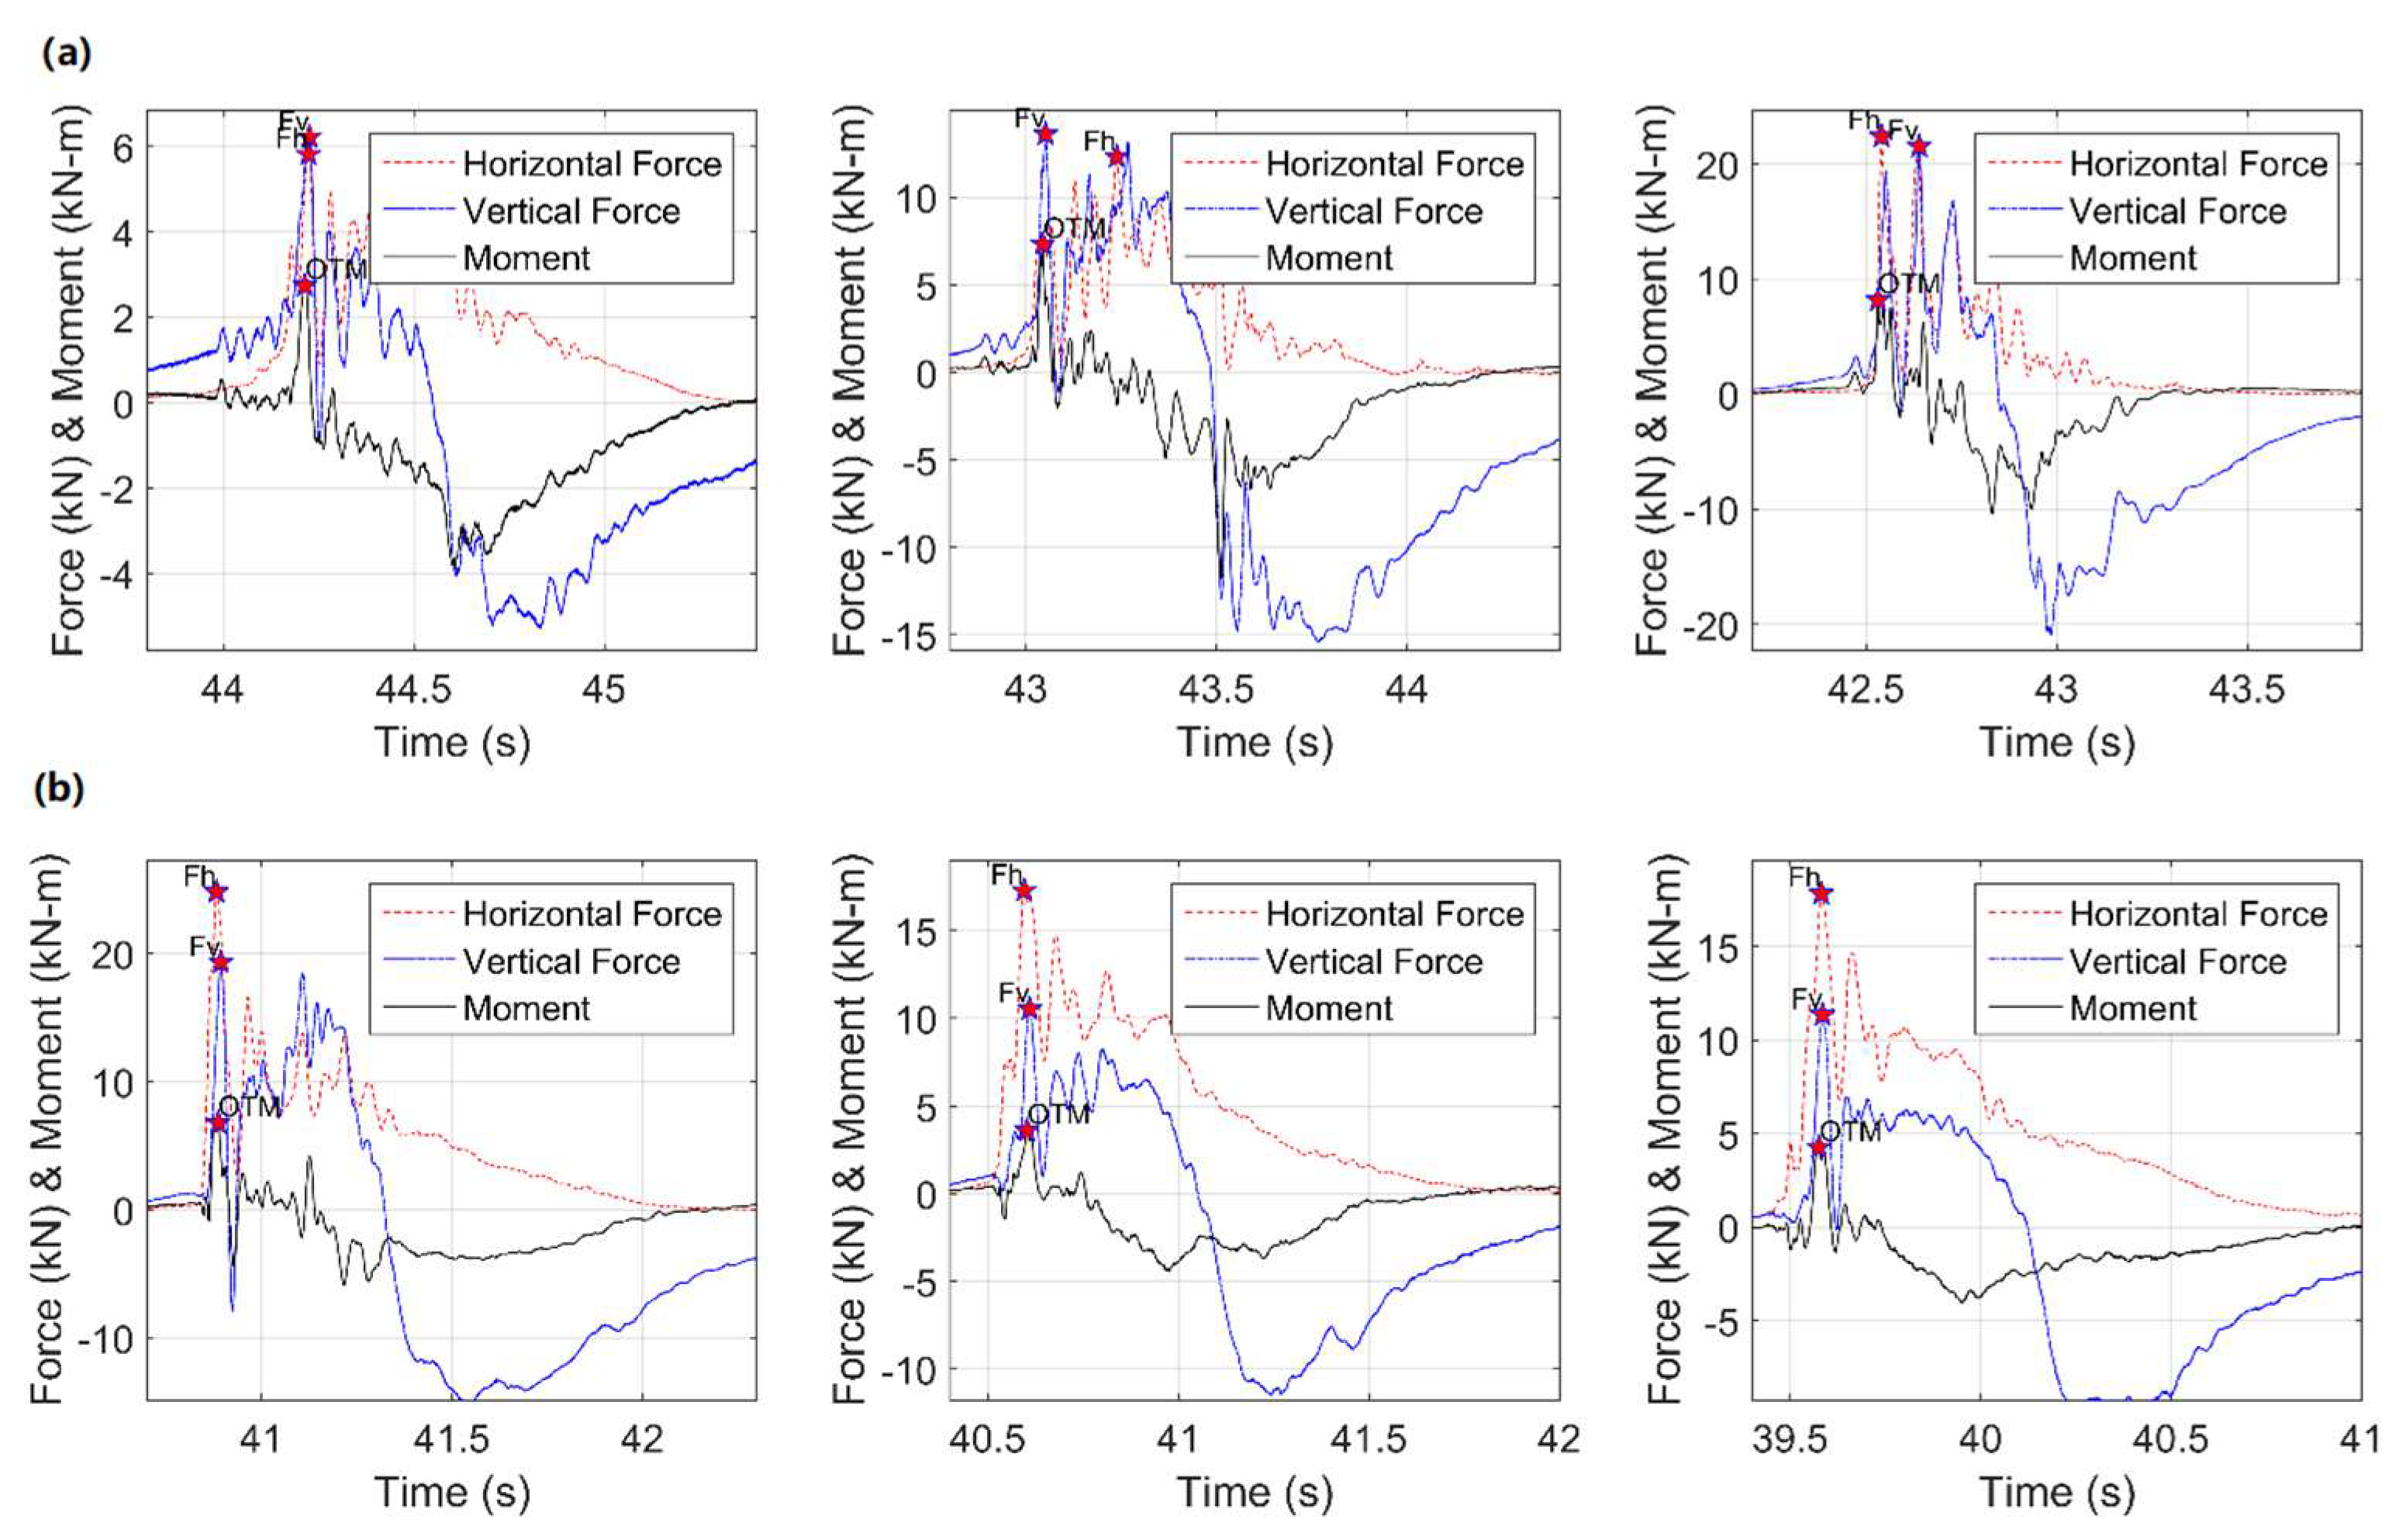
3.1. Total Forces and Moments
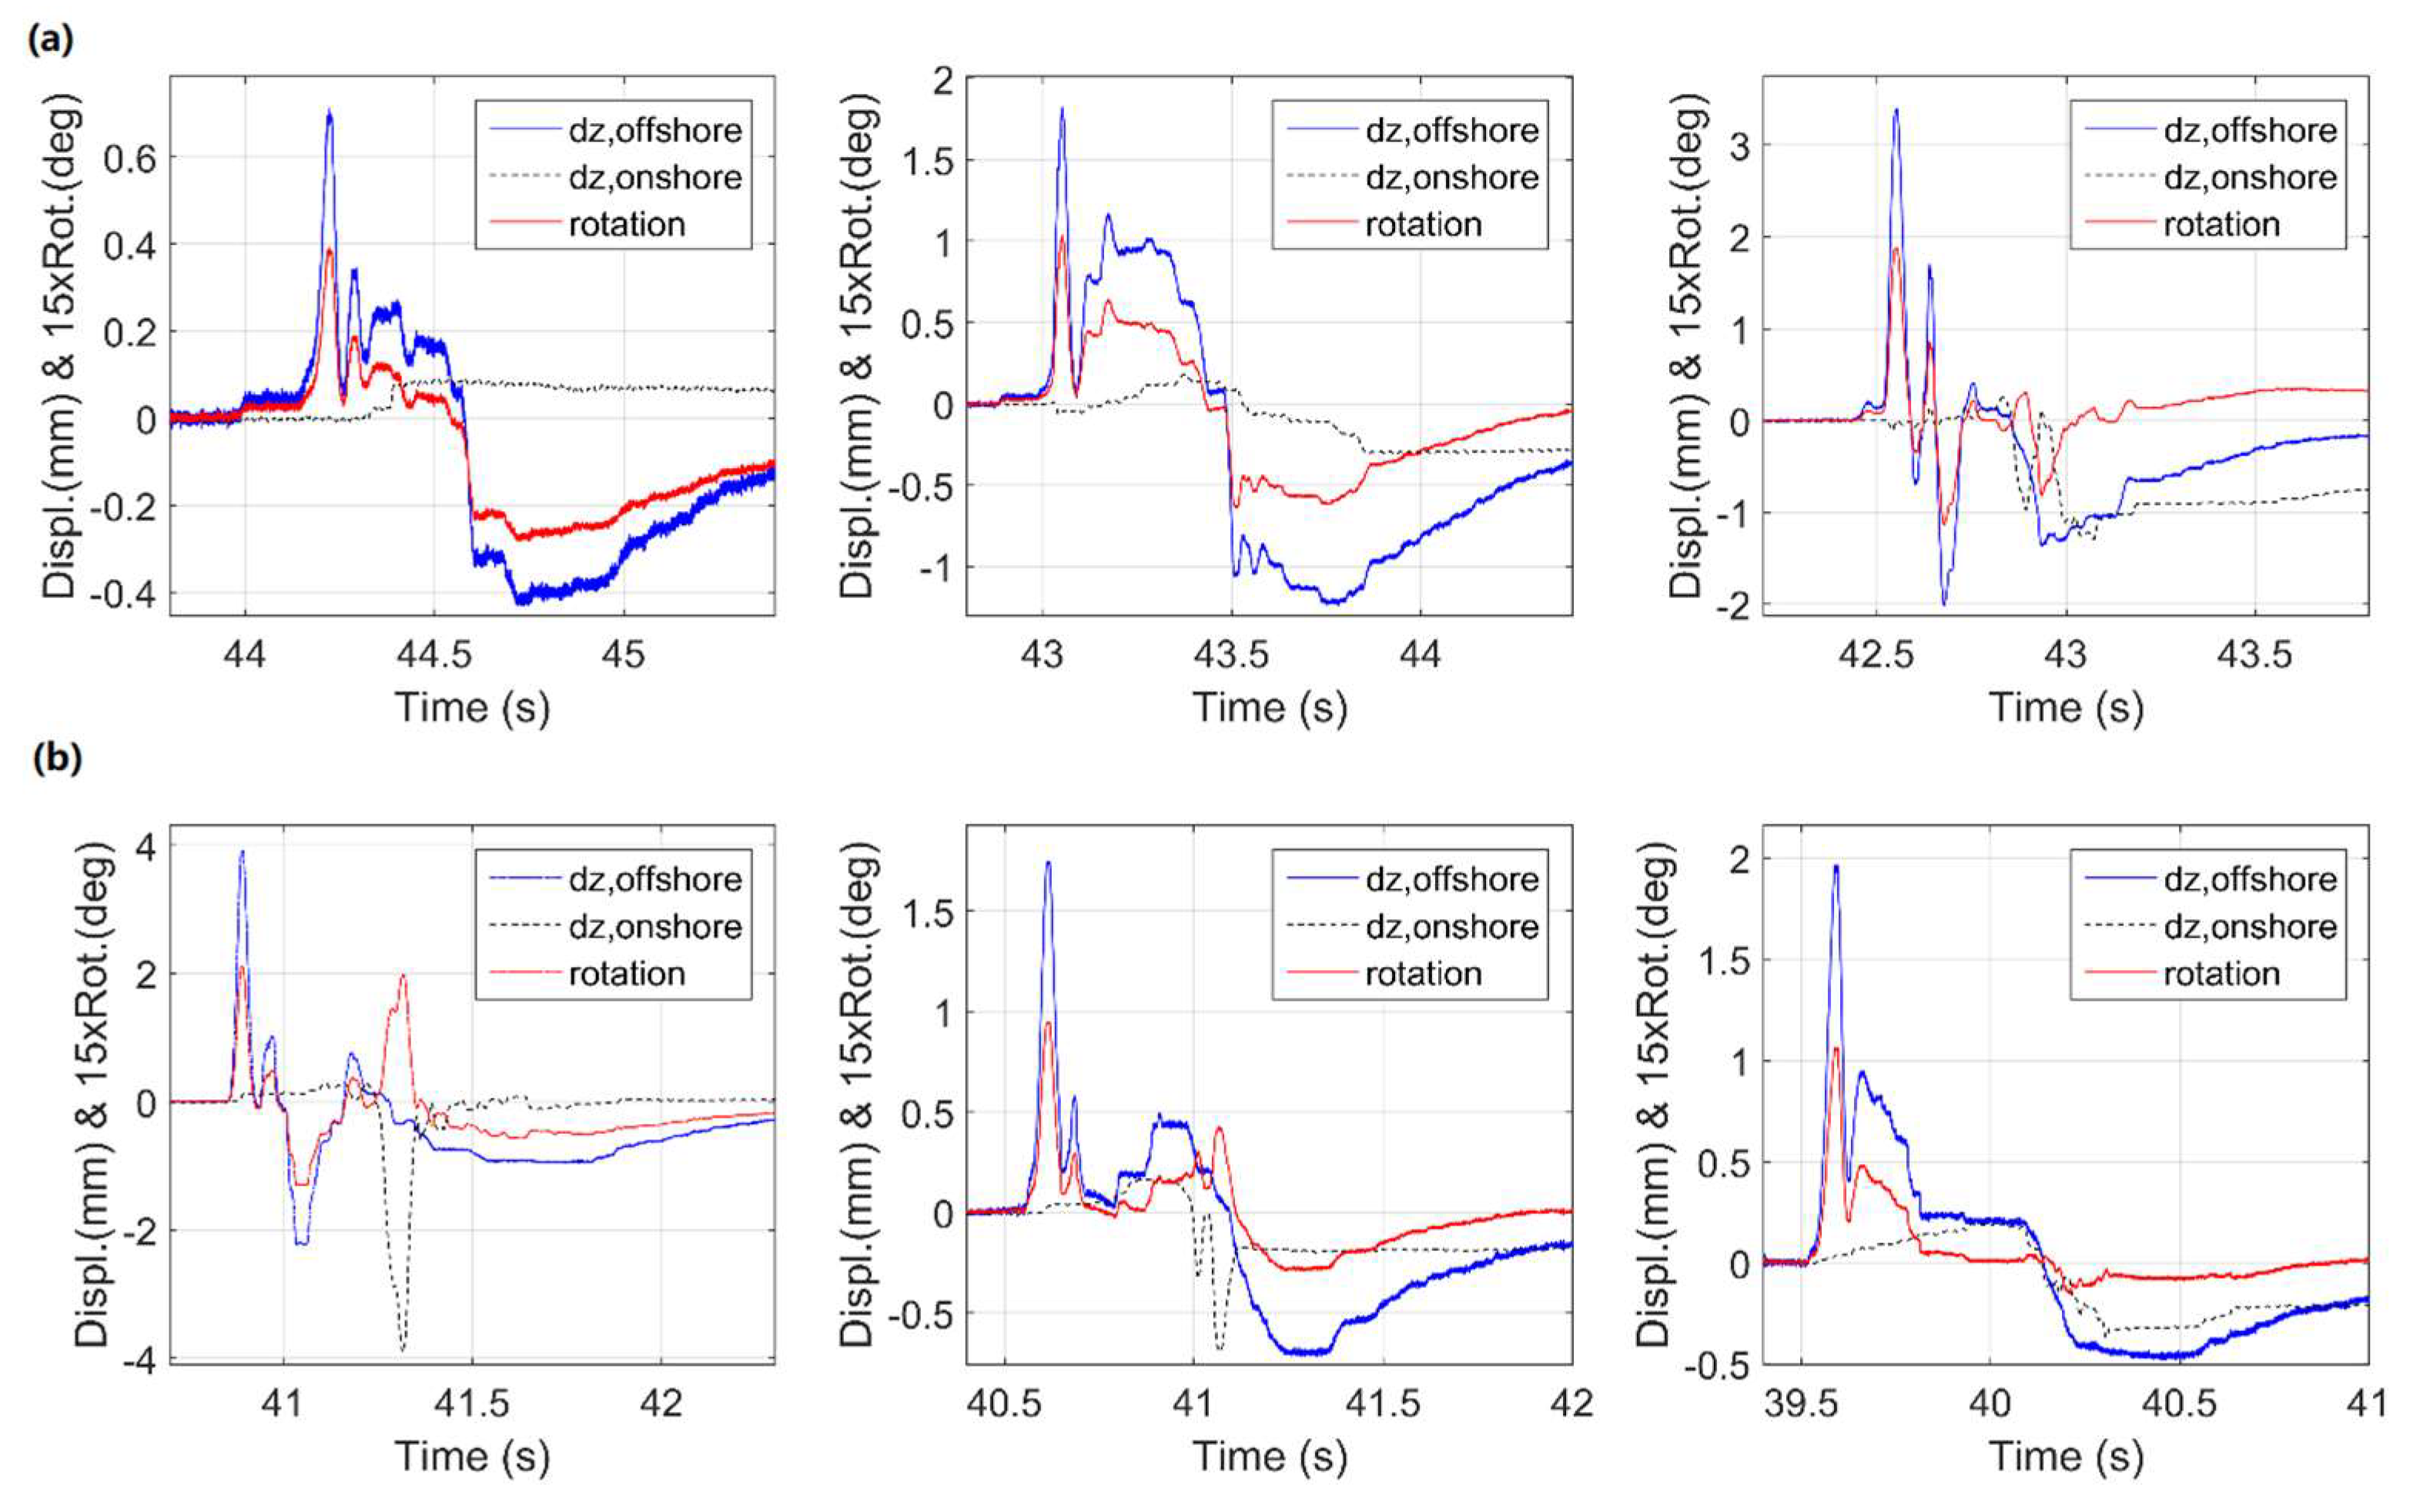
3.2. Structural Response
3.3. Member Forces and Resistance Mechanism
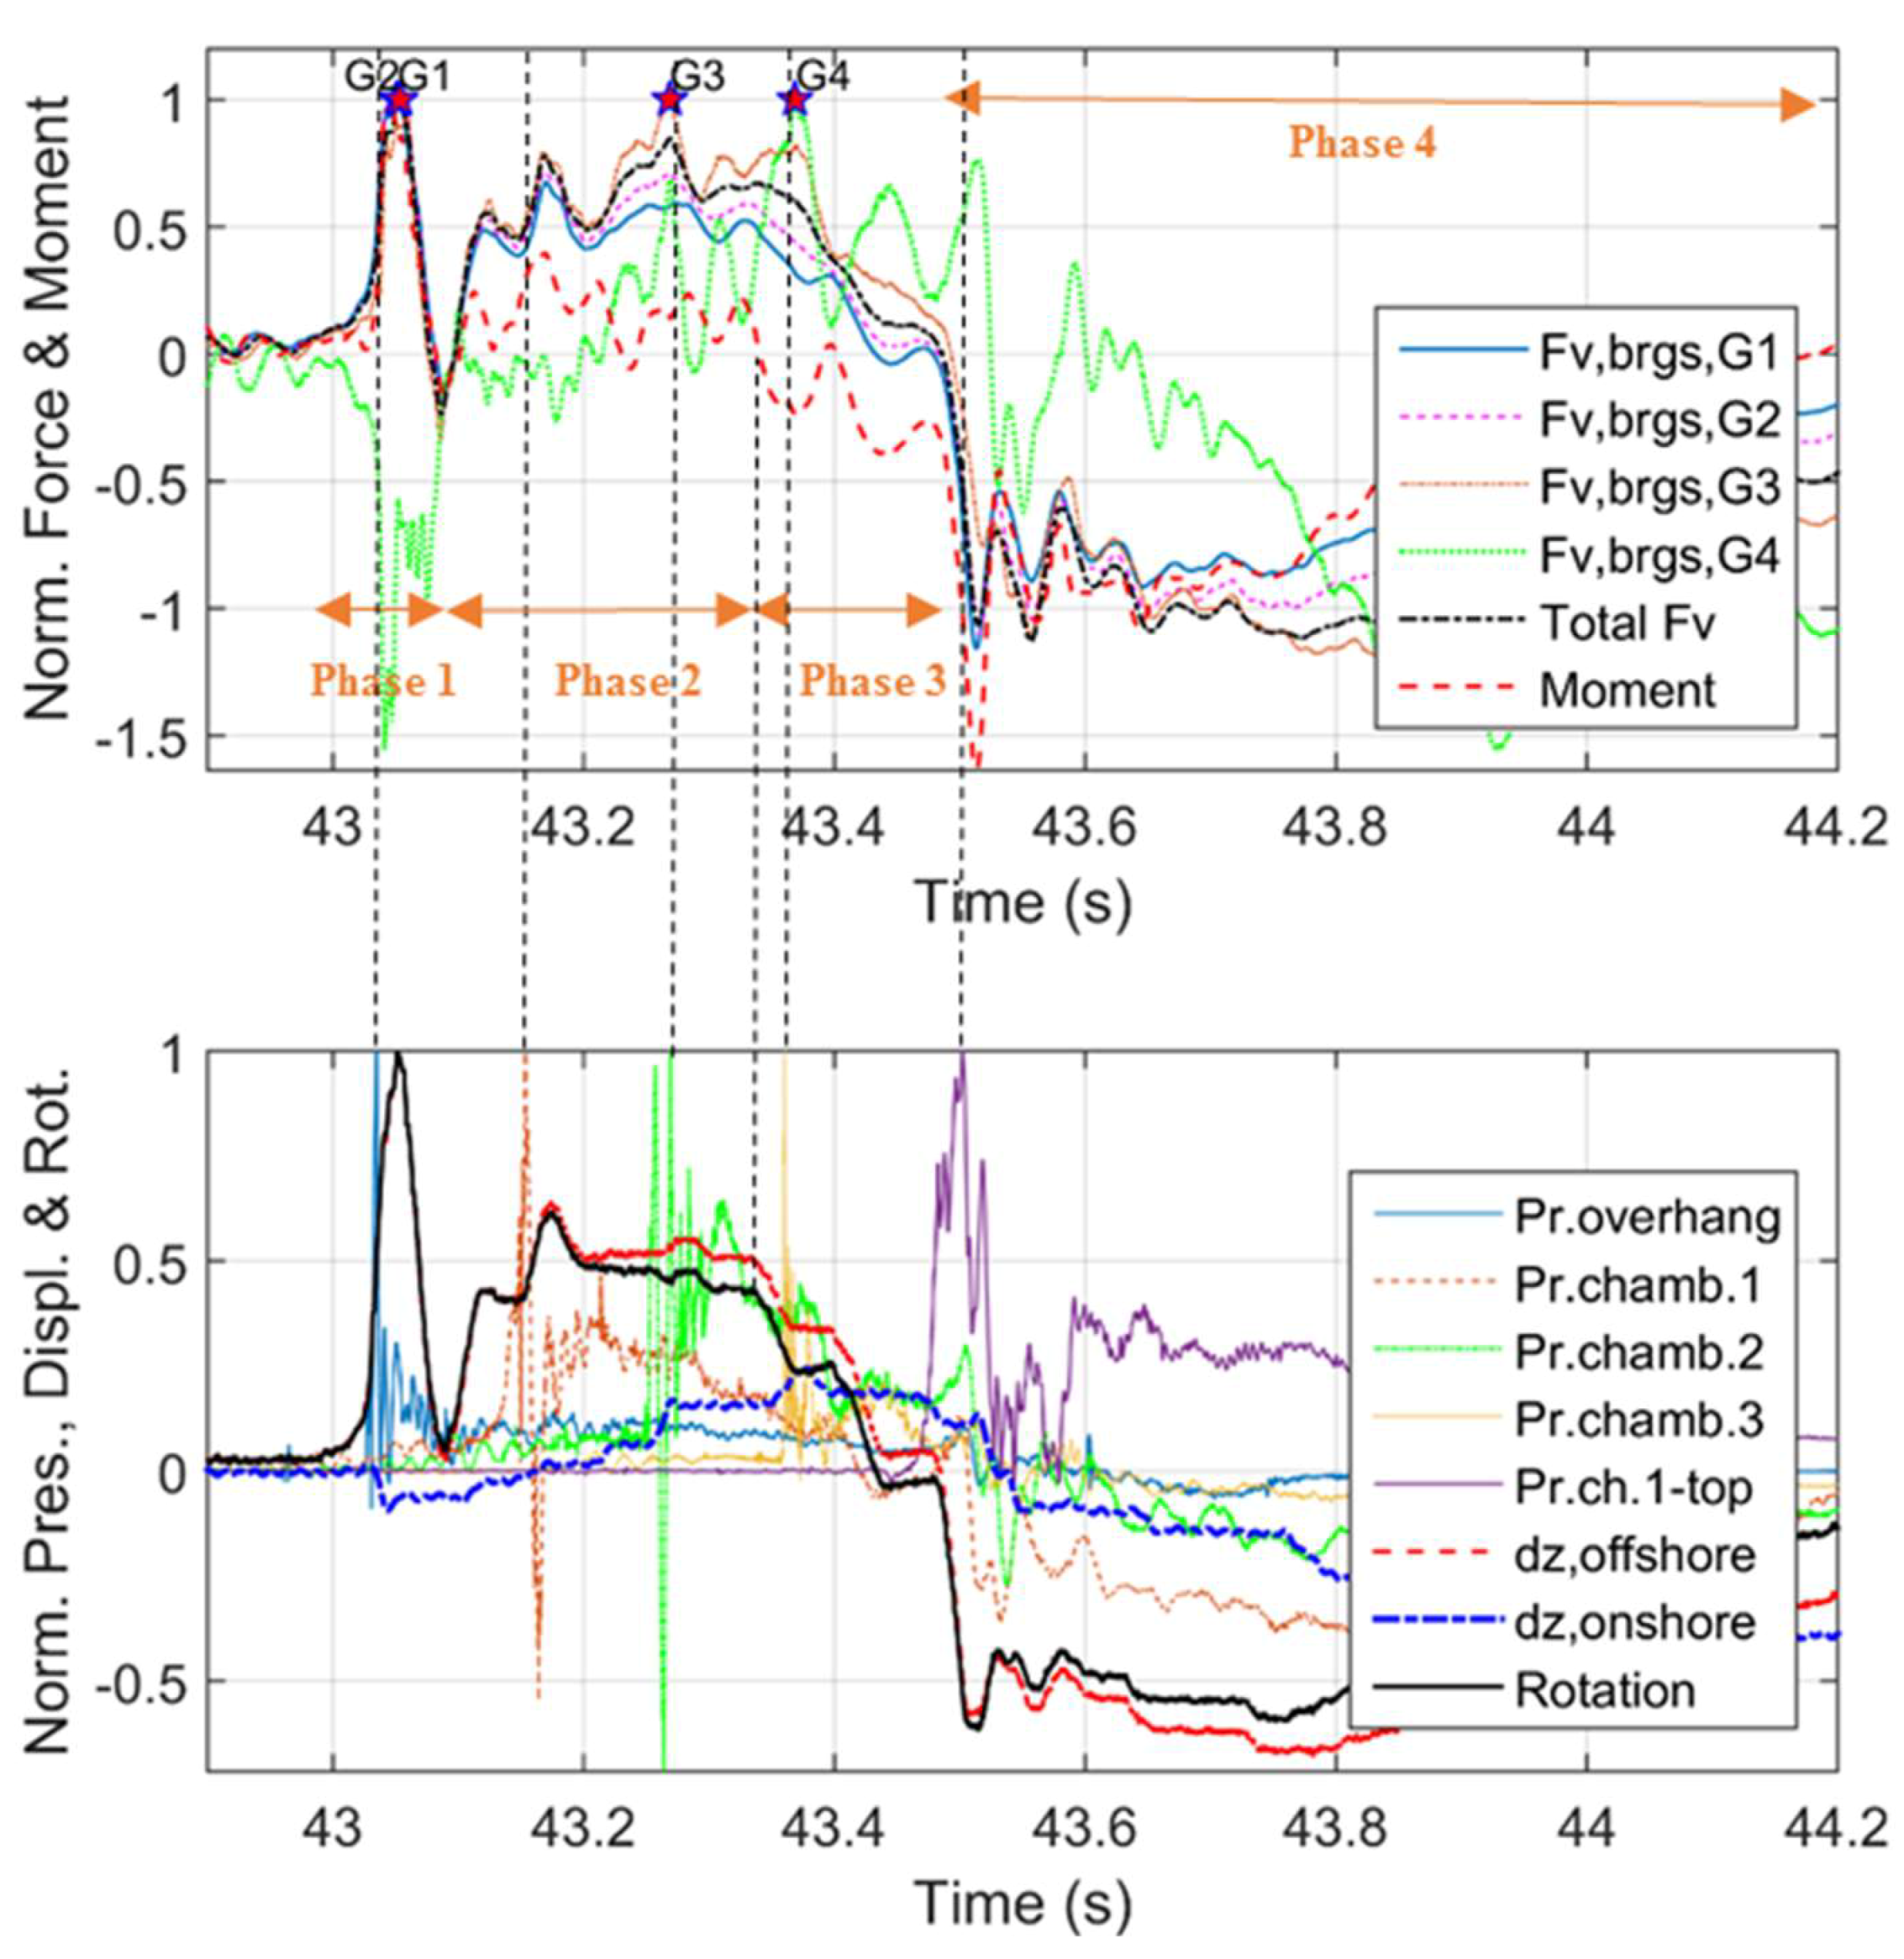
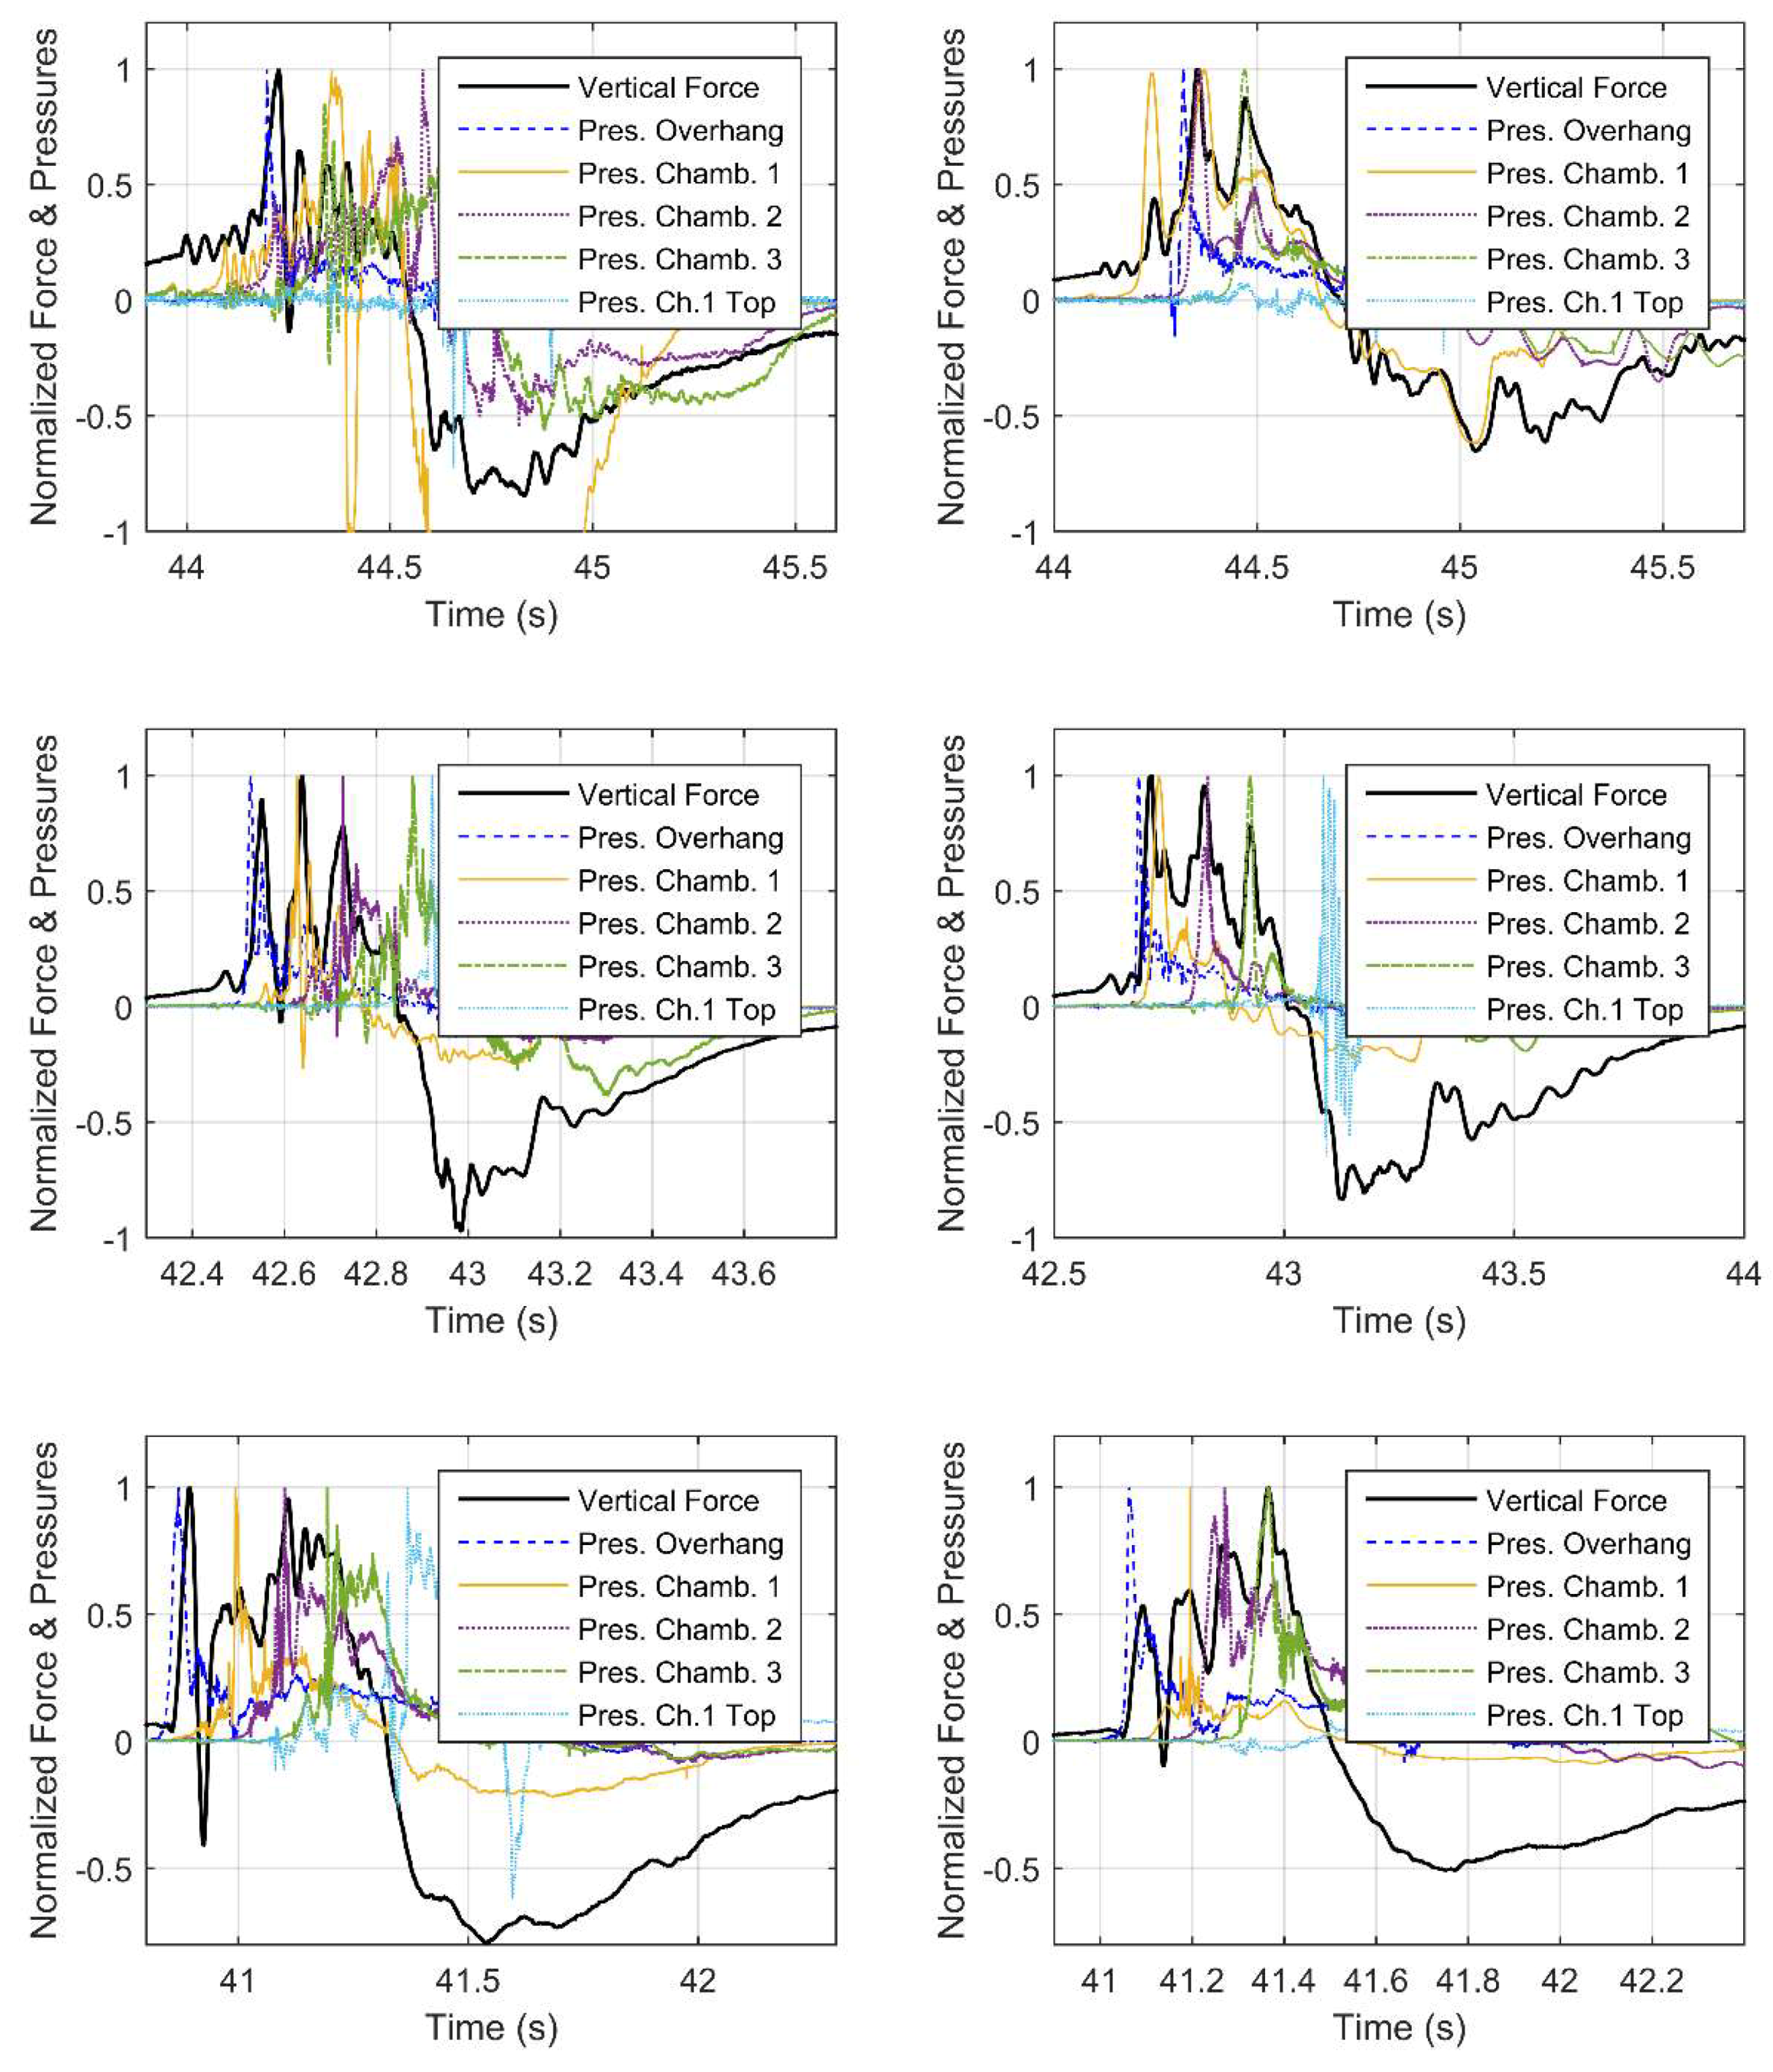
- Phase 1: This phase starts at the time of the first wave impact on the offshore side of the deck, at which point the impulsive (slamming) uplift and horizontal forces together with the overturning moment are maximized. This short-duration loading introduces significant upward movement of the deck and the maximum clockwise rotation, which translates into uplift of several offshore structural components (bearings and columns) and compression of the onshore ones. In this phase the tsunami demand is resisted mainly by bearings G1 and G2, and partially by G3, which explains why this phase creates the worst-case scenario for the former members. Following the impulsive uplift, the downward pressure on the top side of the bottom flange of the I-girder and the dynamic structural effects are reducing the deck uplift force down to zero (can even become negative) and are causing a counter-clockwise rotation that tends to bring the deck close to its initial position, before the wave impacts chamber 1.
- Phase 2: As the wave propagates and reaches chamber 1 (“Ch1” in Figure 1), the uplift force and clockwise moment and rotation start increasing again. The increase of the uplift force continues until the wave reaches chamber 2; however, the moment decreases significantly since the wave is approaching the center of gravity (C.G.) and the point of rotation (moment arm goes down), and that is why the bridge does not rotate much in this phase. This demonstrates that the structural response of the bridge is governed by a translational mode in the vertical direction, which tends to uplift the whole deck and introduce the maximum uplift demand in the members close to the C.G. of the bridge (e.g., bearings G3 and col. 2).
- Phase 3: In this phase the wave reaches the onshore chamber (Ch3), applying significant uplift on the deck and a counter-clockwise moment (negative value). This moment introduces counter-clockwise rotation of the deck, which is evidenced in Figure 5 by the reduction of the φ angle, which continues until the deck is perfectly leveled again. This phase is significant because it generates the maximum uplift in the onshore bearings. The phase ends when the wave has flooded all the chambers and it starts overtopping the deck.
- Phase 4: The last phase occurs when the wave slams the top surface of the deck and gradually overtops and inundates the whole deck. At the instant of the wave slamming (close to P14 in Figure 1) a localized maximum downward force peak with a significant counter-clockwise moment and deck rotation is introduced by most waves. The phase introduces the maximum downward force on the deck and puts all bearings and columns in compression.
4. Solid Diaphragms vs. Cross-Frames
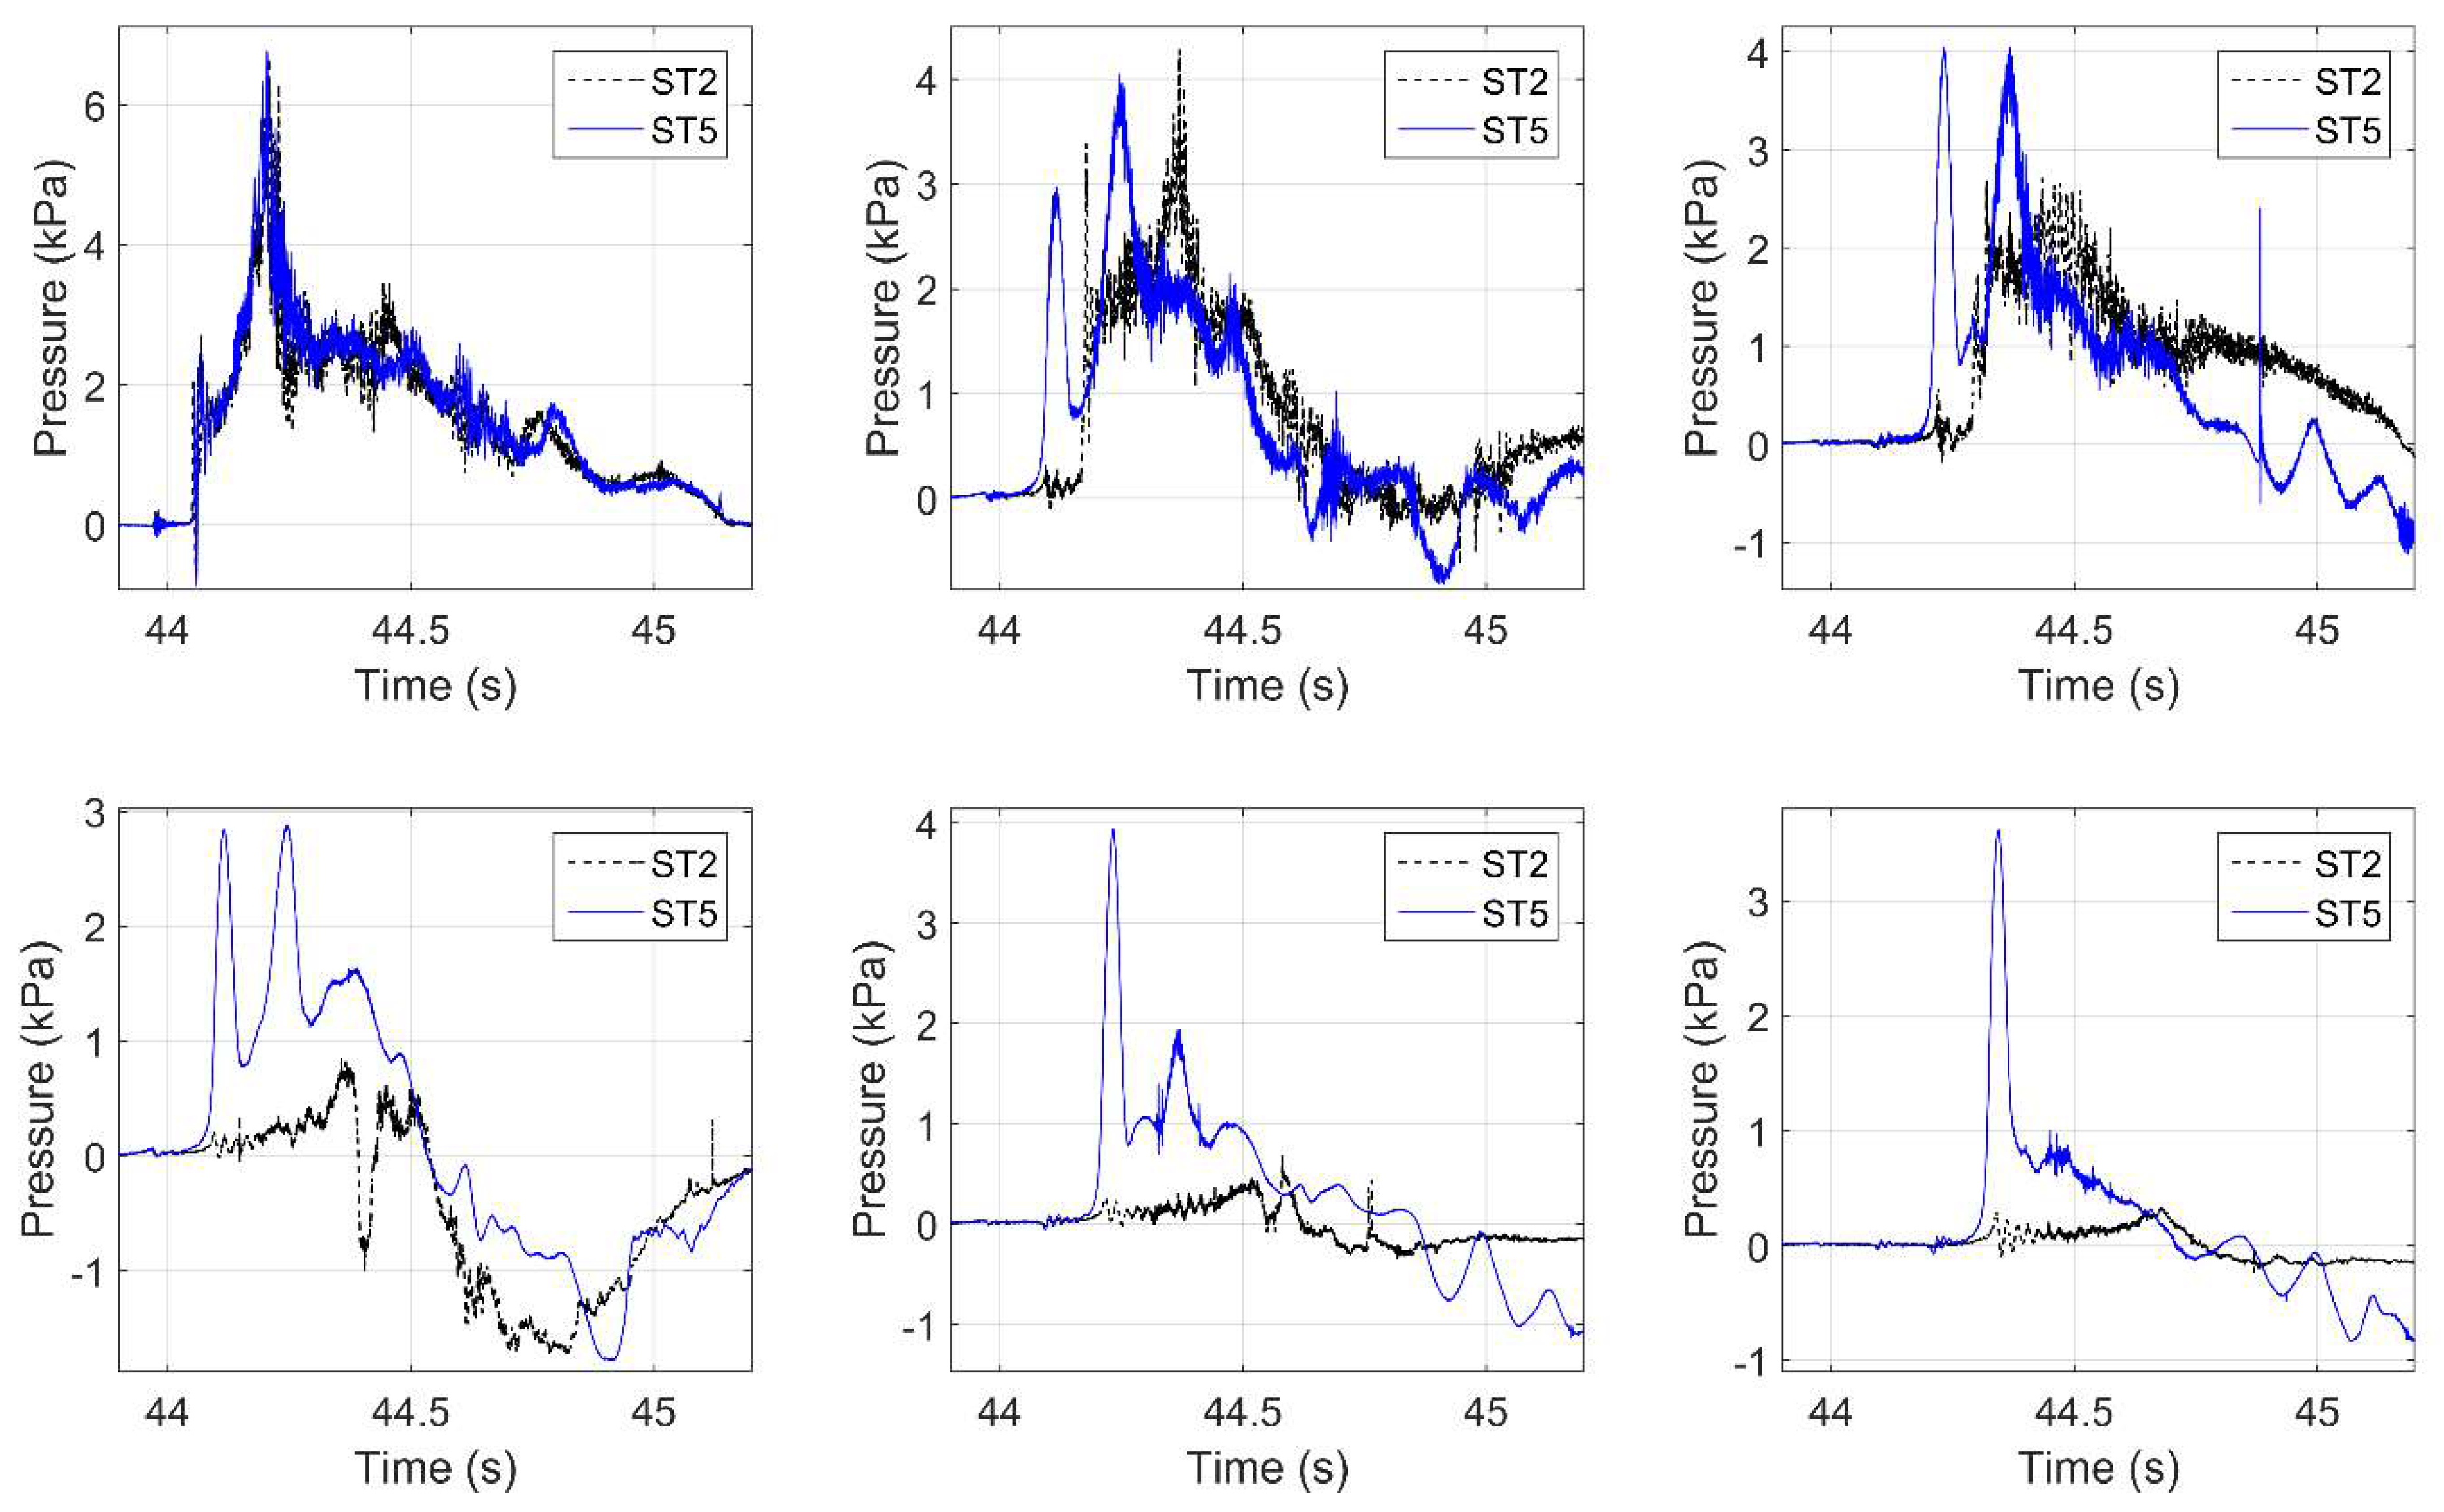
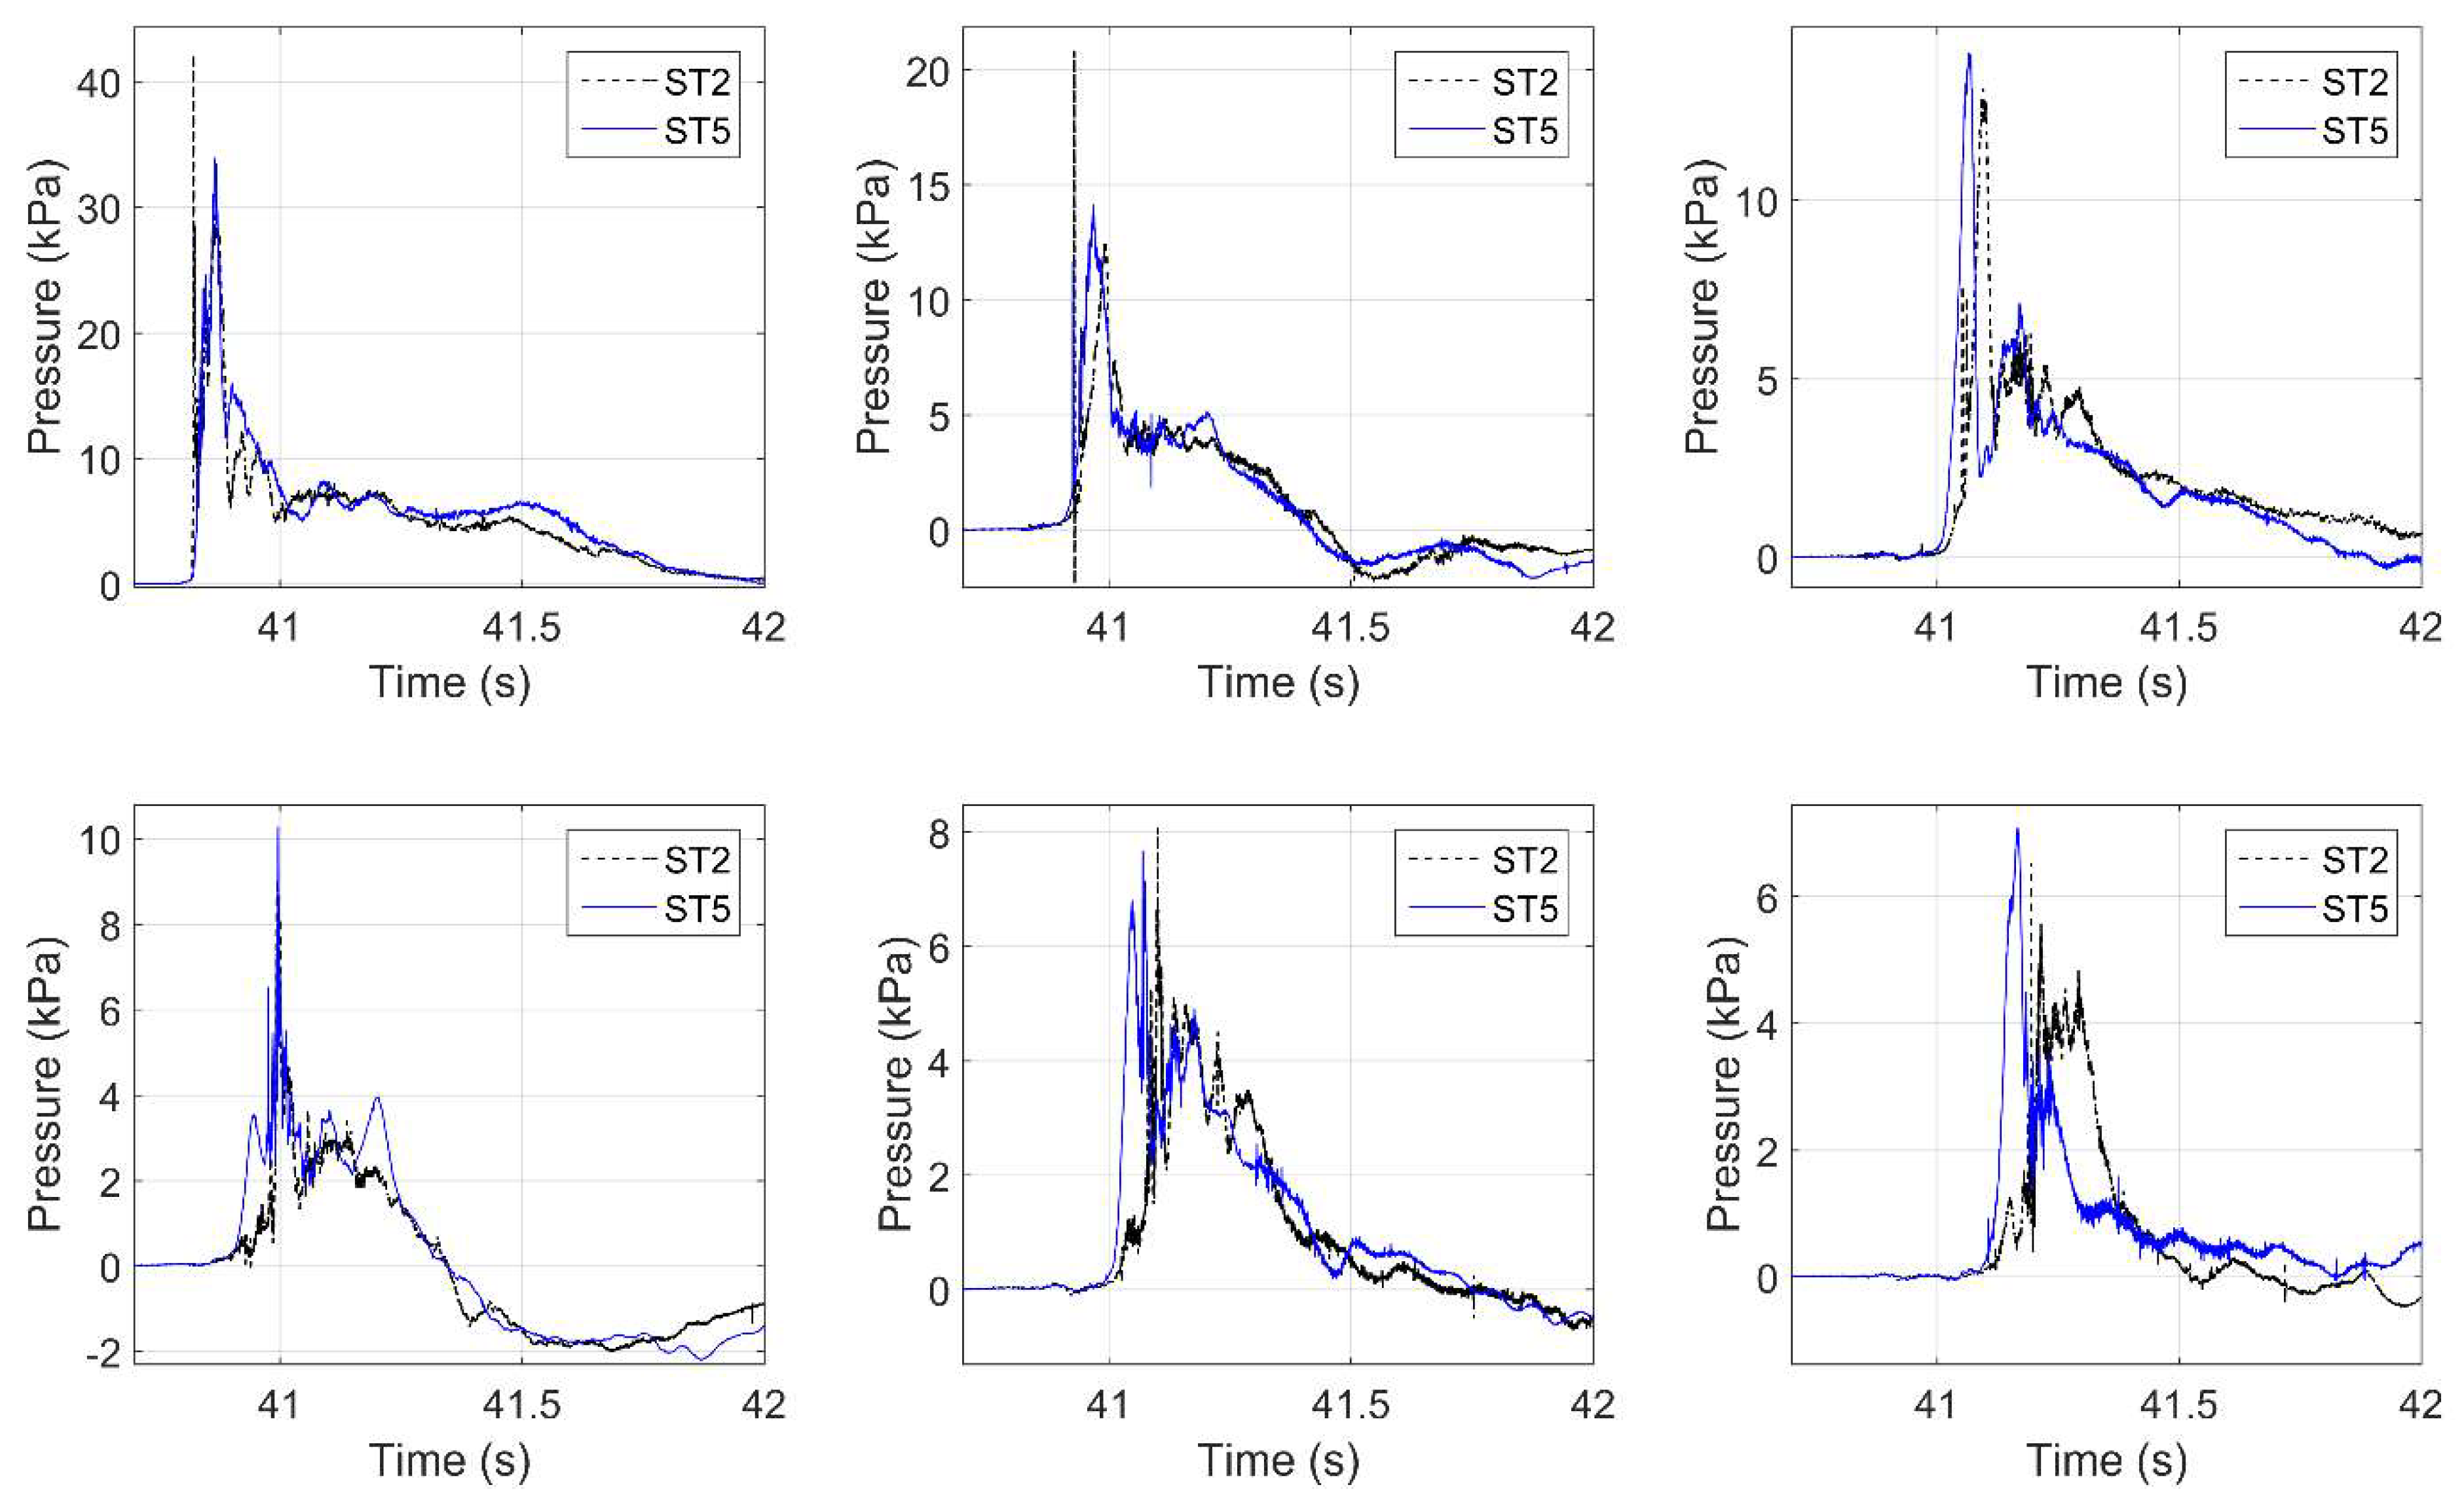
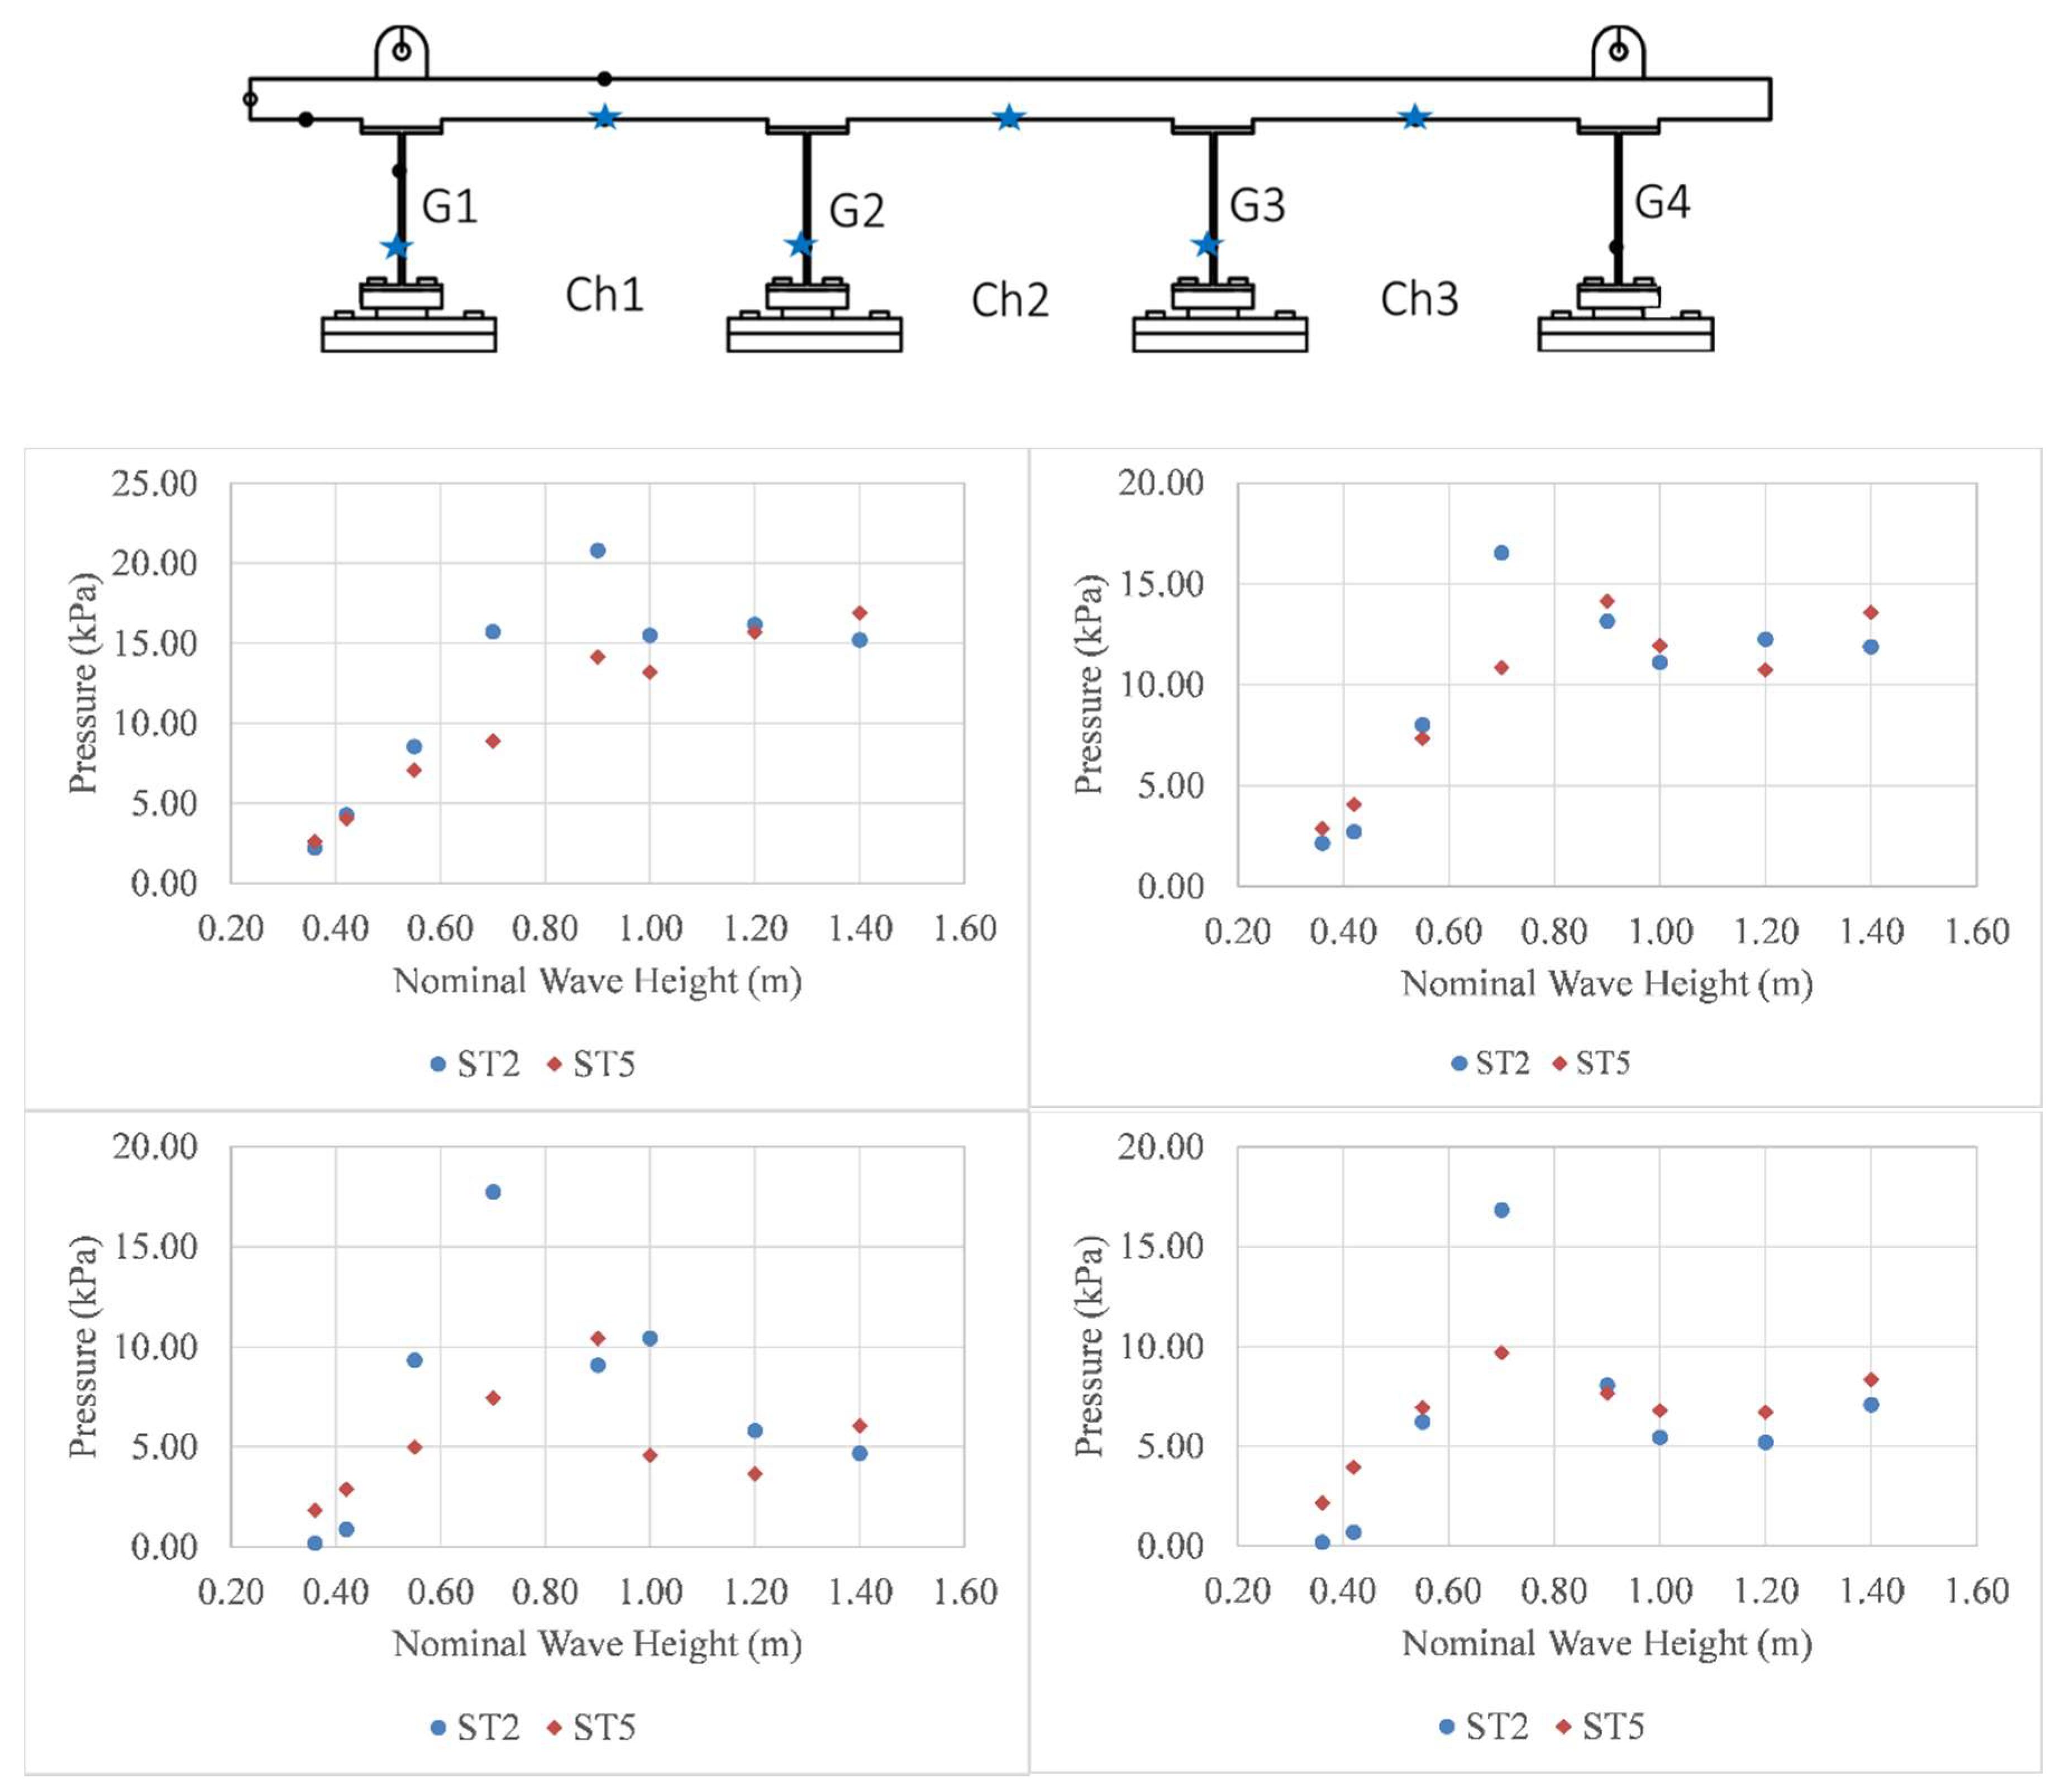
4.1. Pressures on Girders and Below the Deck
4.2. Total Forces and Moments
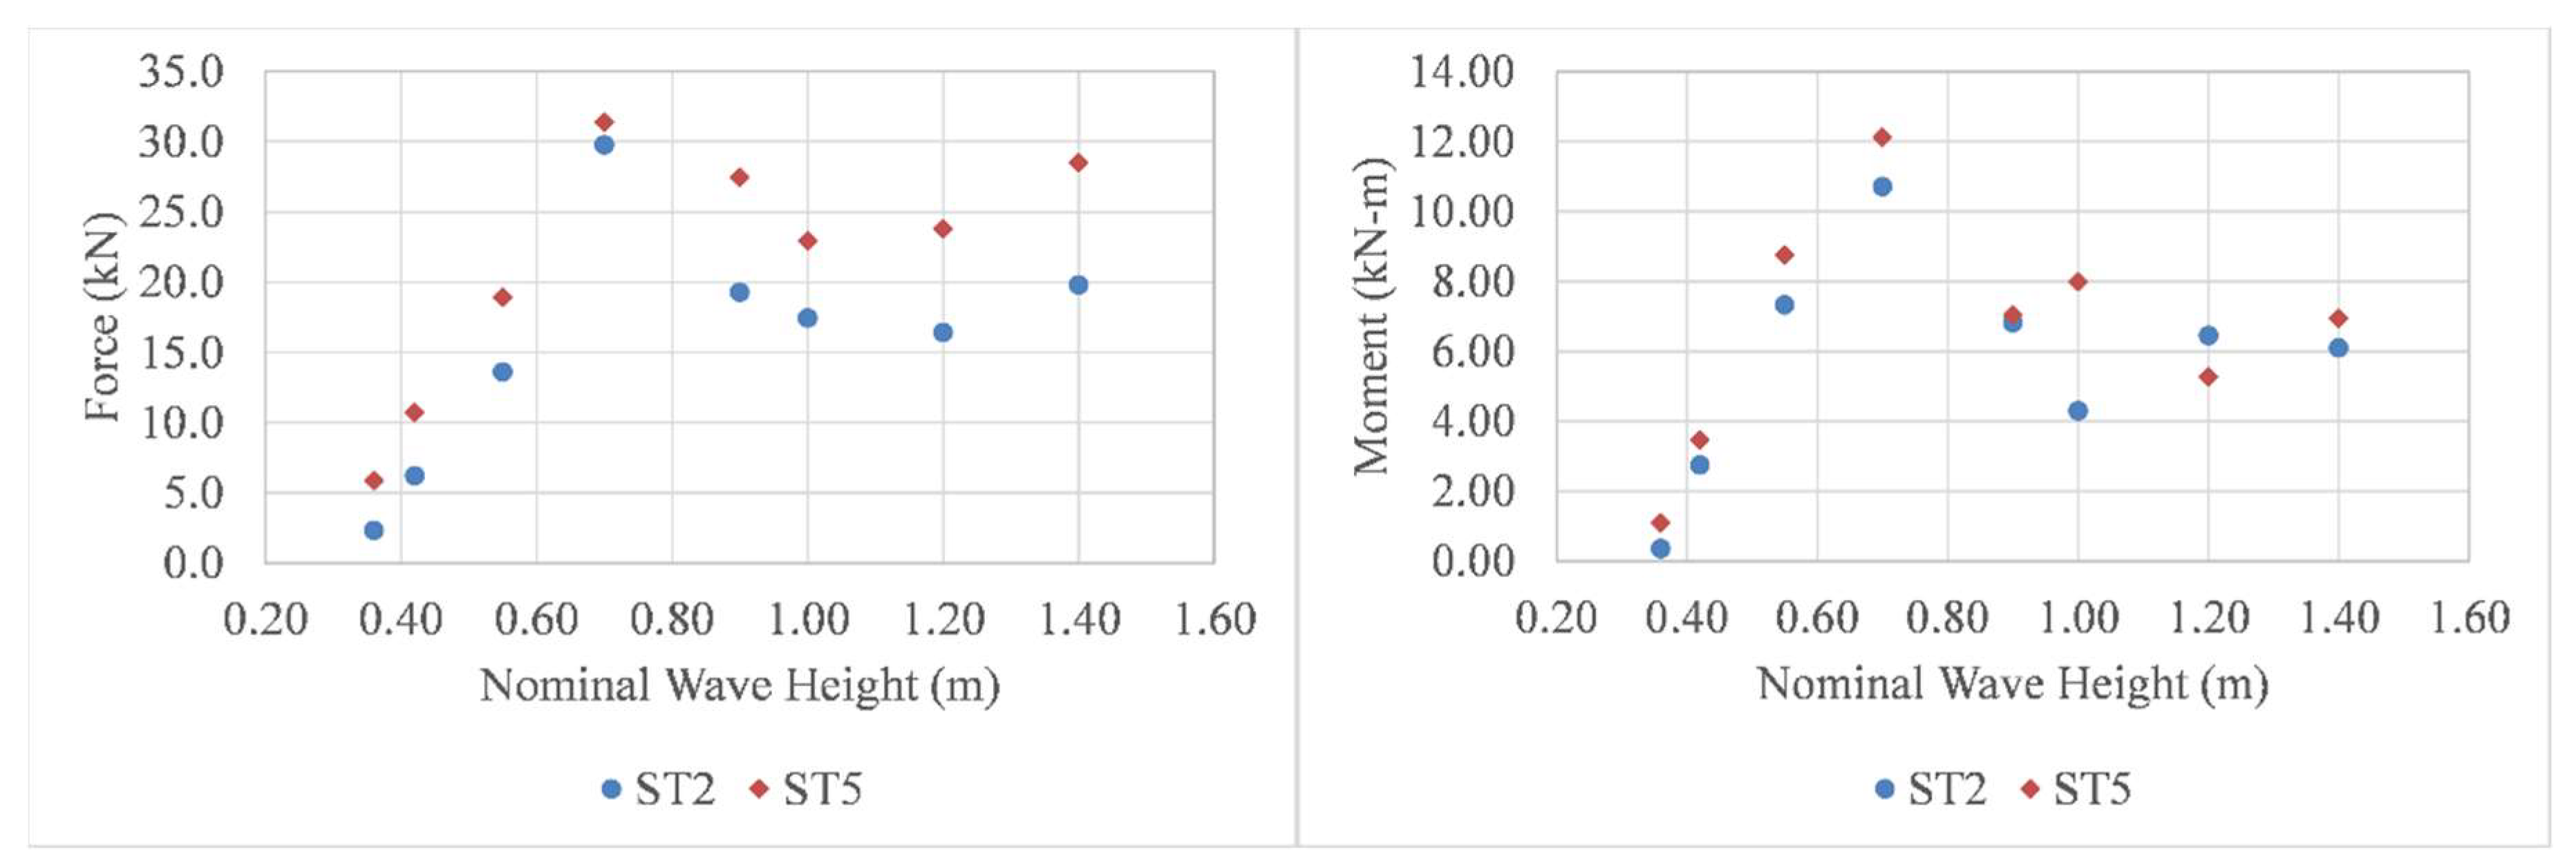
- For both bridge specimens for certain waves the maximum uplift force occurs in Phase 1, where the slamming (impulsive) force on the overhang is governing and the air trapped in the chambers is not affecting the results (true for H = 0.46 m);
- For other waves the maximum uplift for ST2 occurs in Phase 1, while for ST5 it occurs in Phase 3 (true for H = 1.0 m, d = 1.90 m) where the quasi-static component is governing, making it hard to decipher the underlying physics by just examining the maximum values of the uplift force.
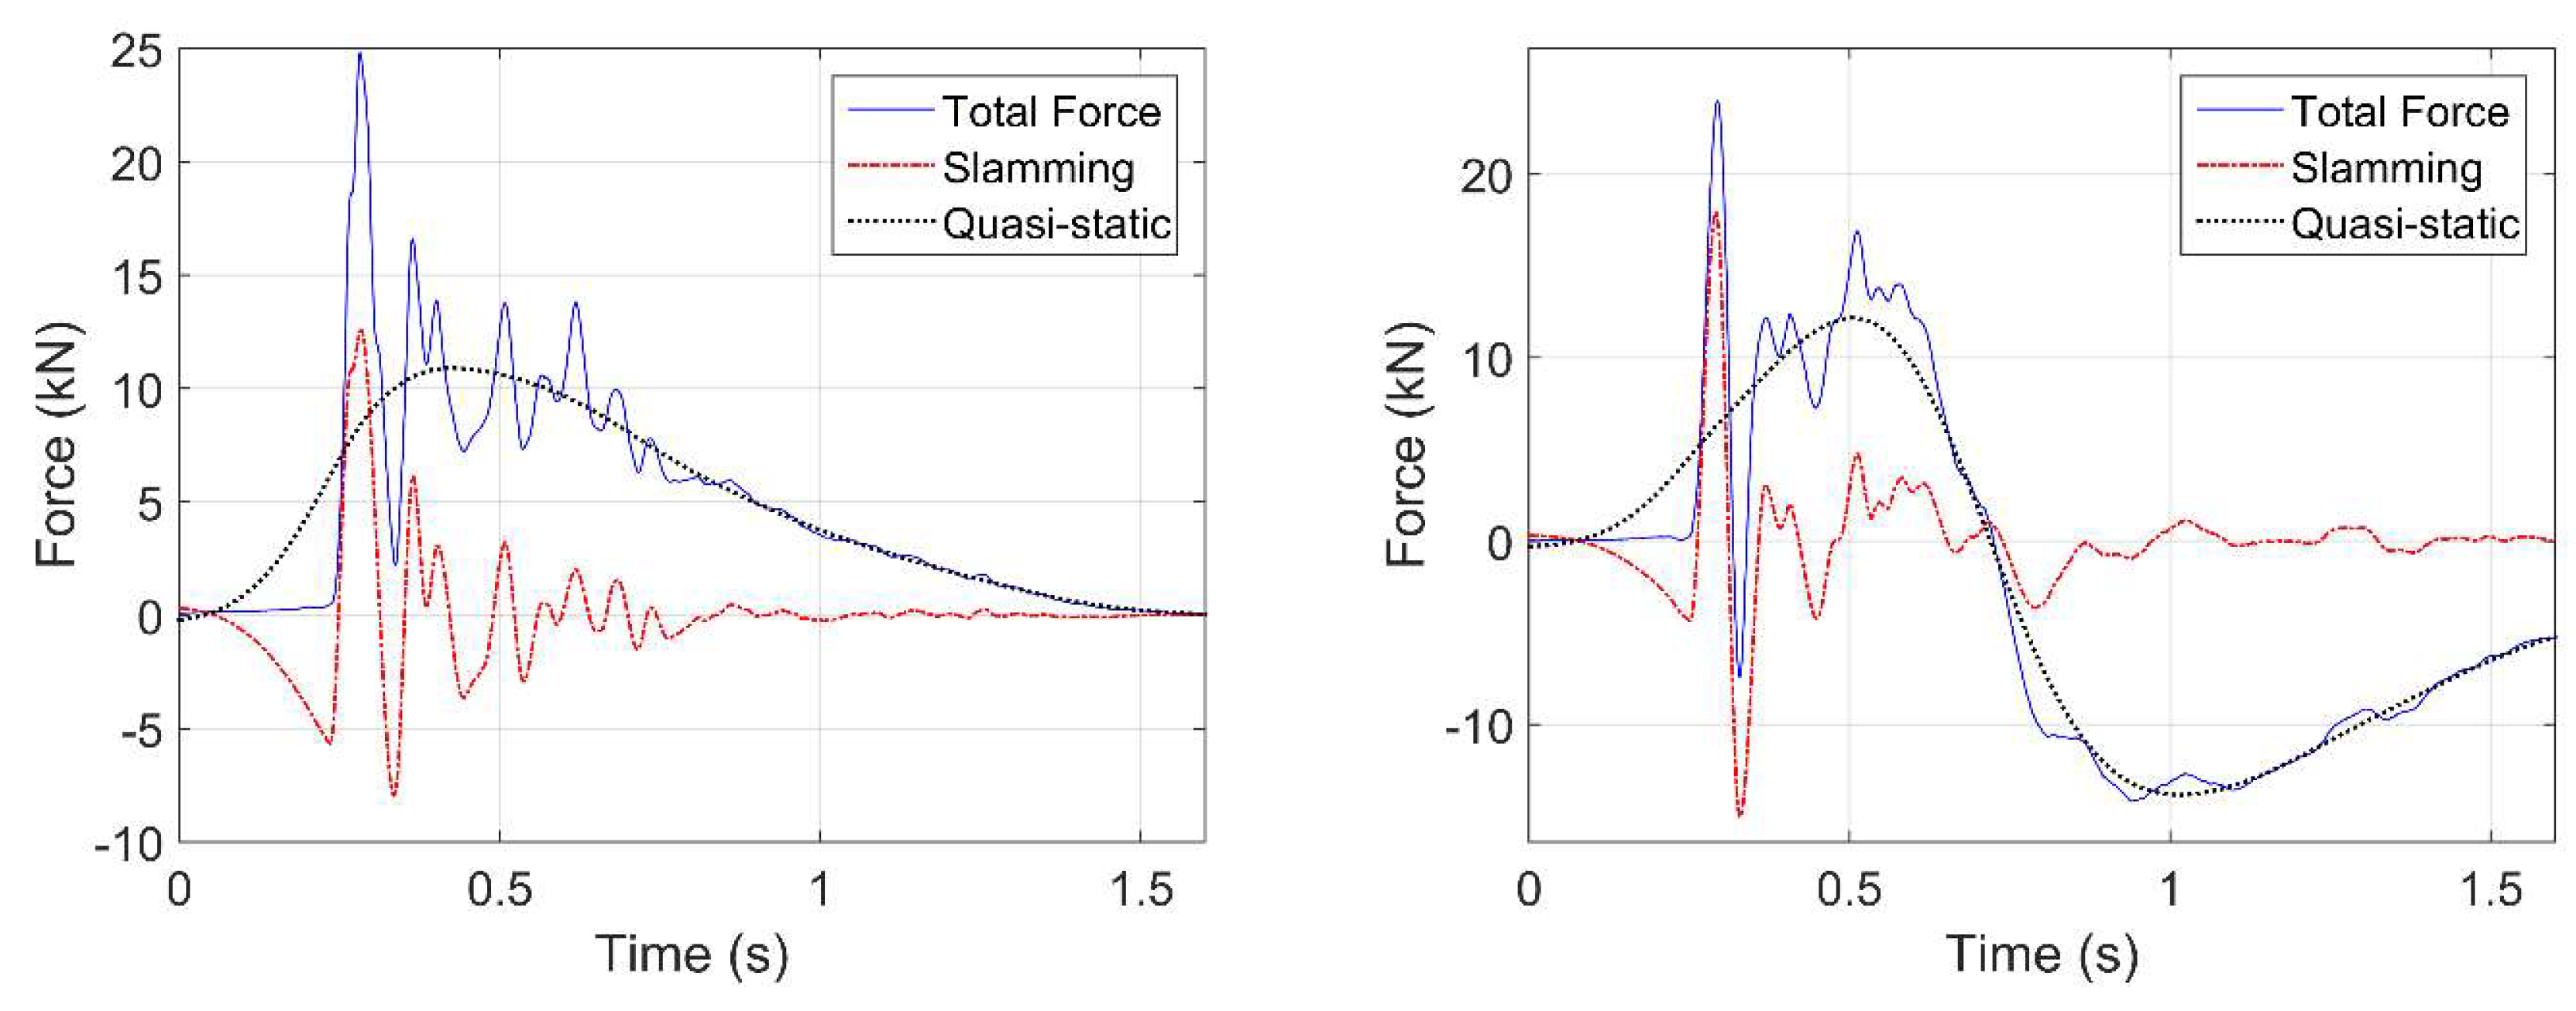
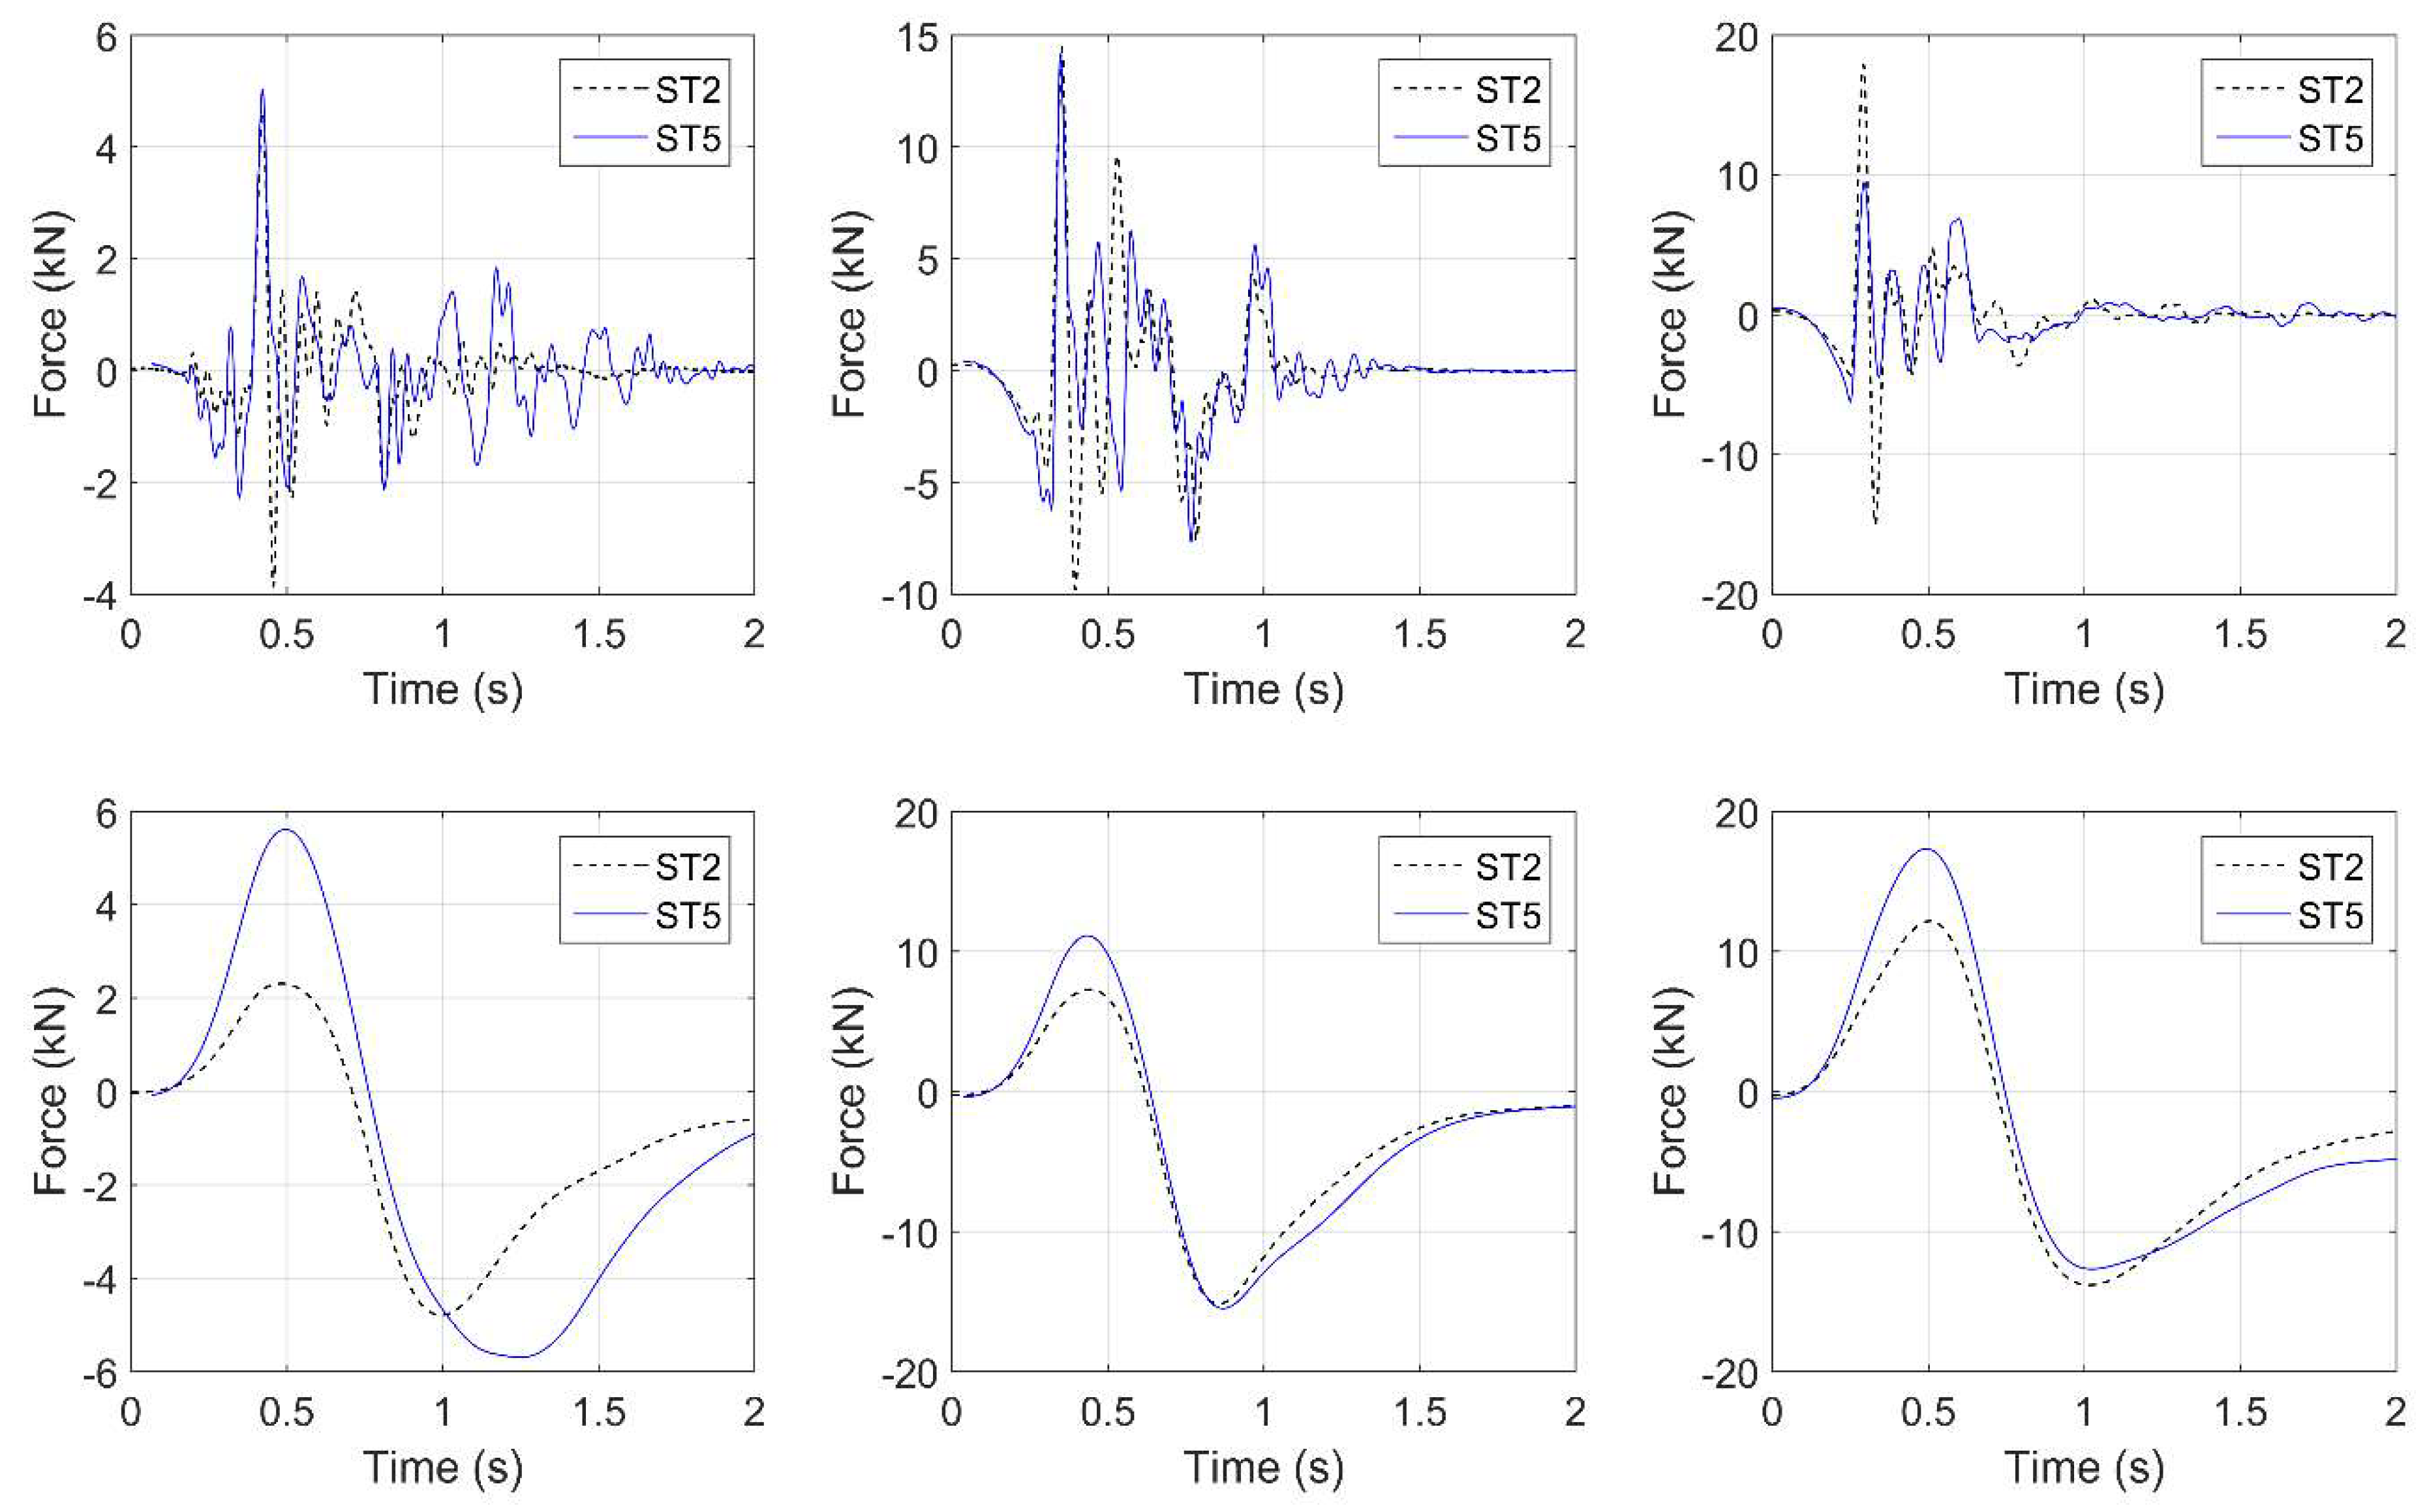
4.3. Slamming and Quasi-Static Forces
- The maximum total uplift force can occur in any of the three uplift phases, so when this happens in phase 1, then there is practically no effect from the trapped air. The quasi-static uplift component is maximized though in either phase 2 or 3, which occur when the wave floods the chambers and, consequently, the induced uplift is affected by the trapped air.
- The maximum total uplift force is affected by the slamming and the quasi-static components, which are maximized at different instants of the bridge inundation process. Moreover, although the effect of trapped air on the quasi-static component is consistent, this is not true for the slamming component. Therefore, depending on whether the trapped air increases or reduces the slamming uplift peaks and how close they are in time with the maximum quasi-static uplift, which always increases, the air can result in a significant increase of the total uplift or a negligible effect, respectively.
4.4. Vertical Forces in Bearings and Columns
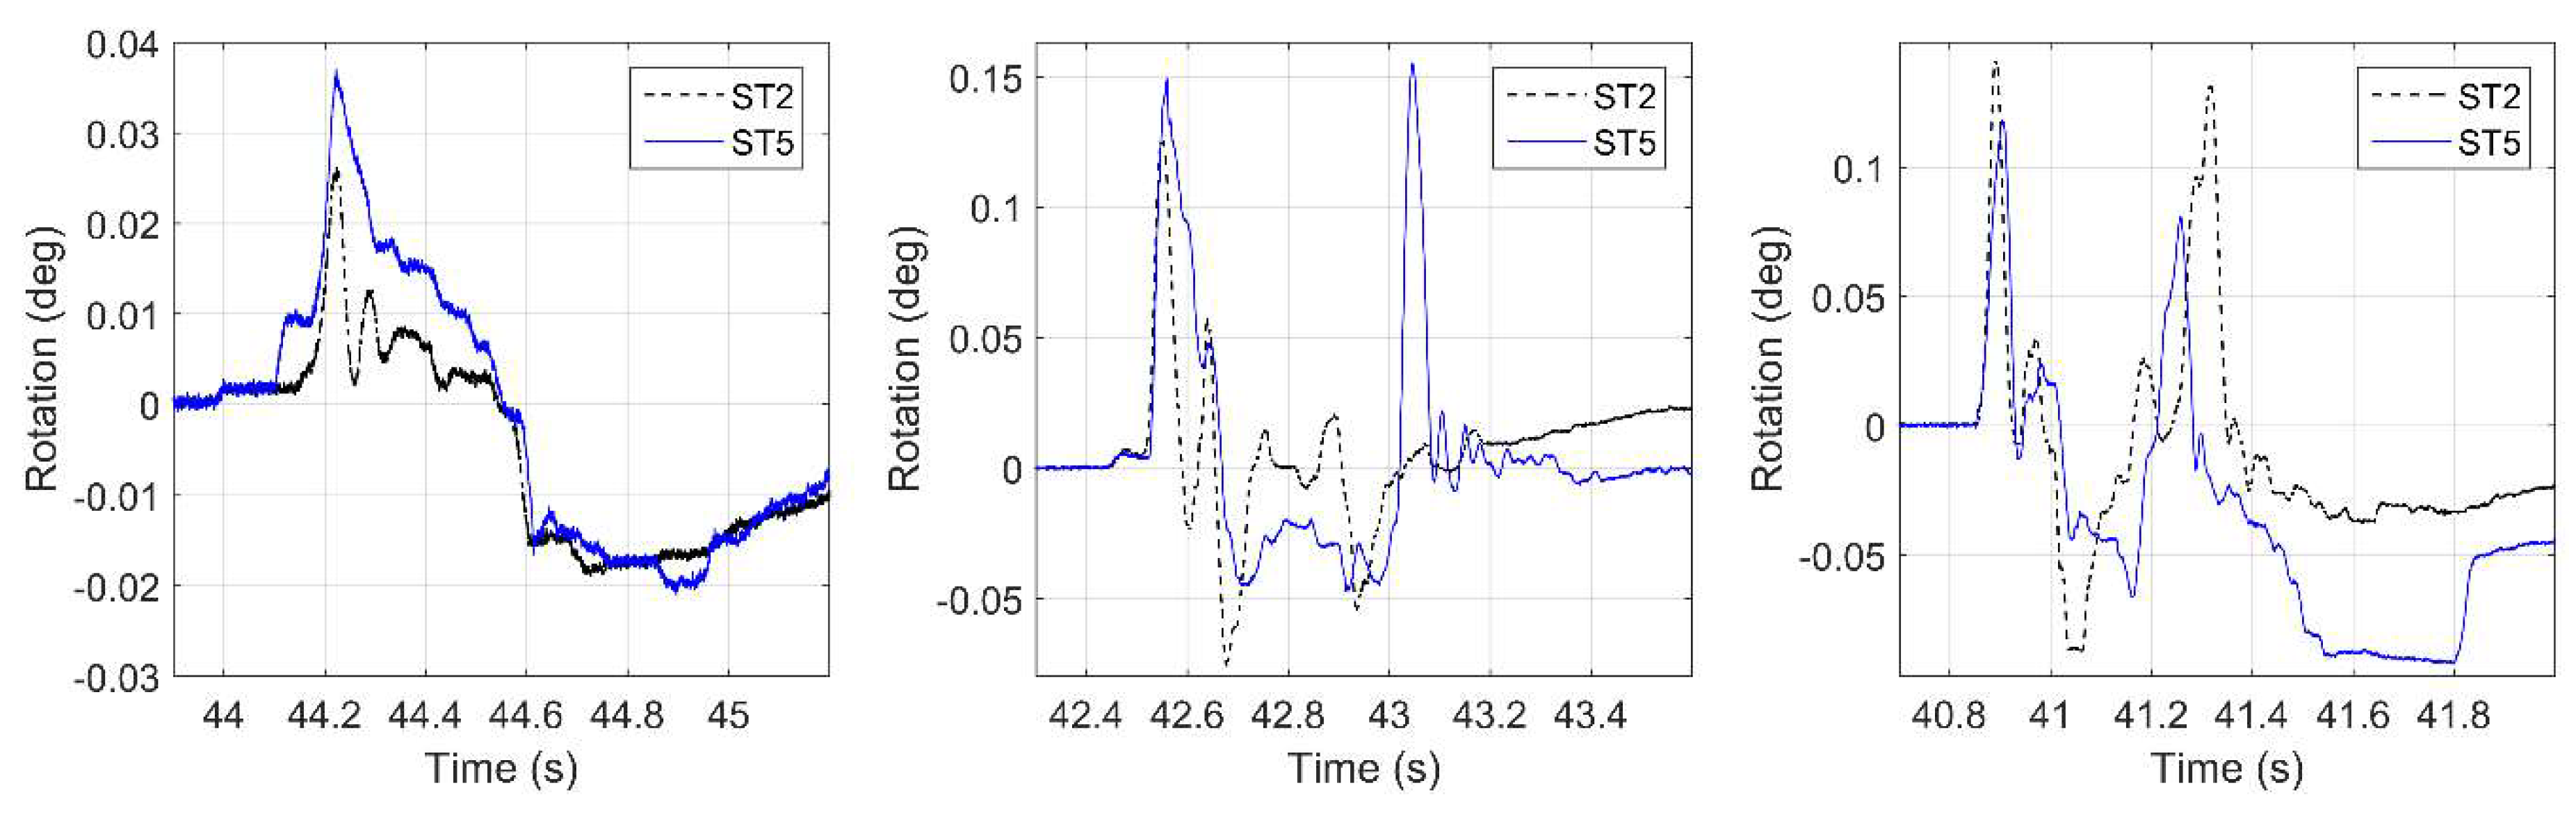
4.5. Structural Response-Deck Rotations
5. Measured Uplift Forces vs. Buoyancy
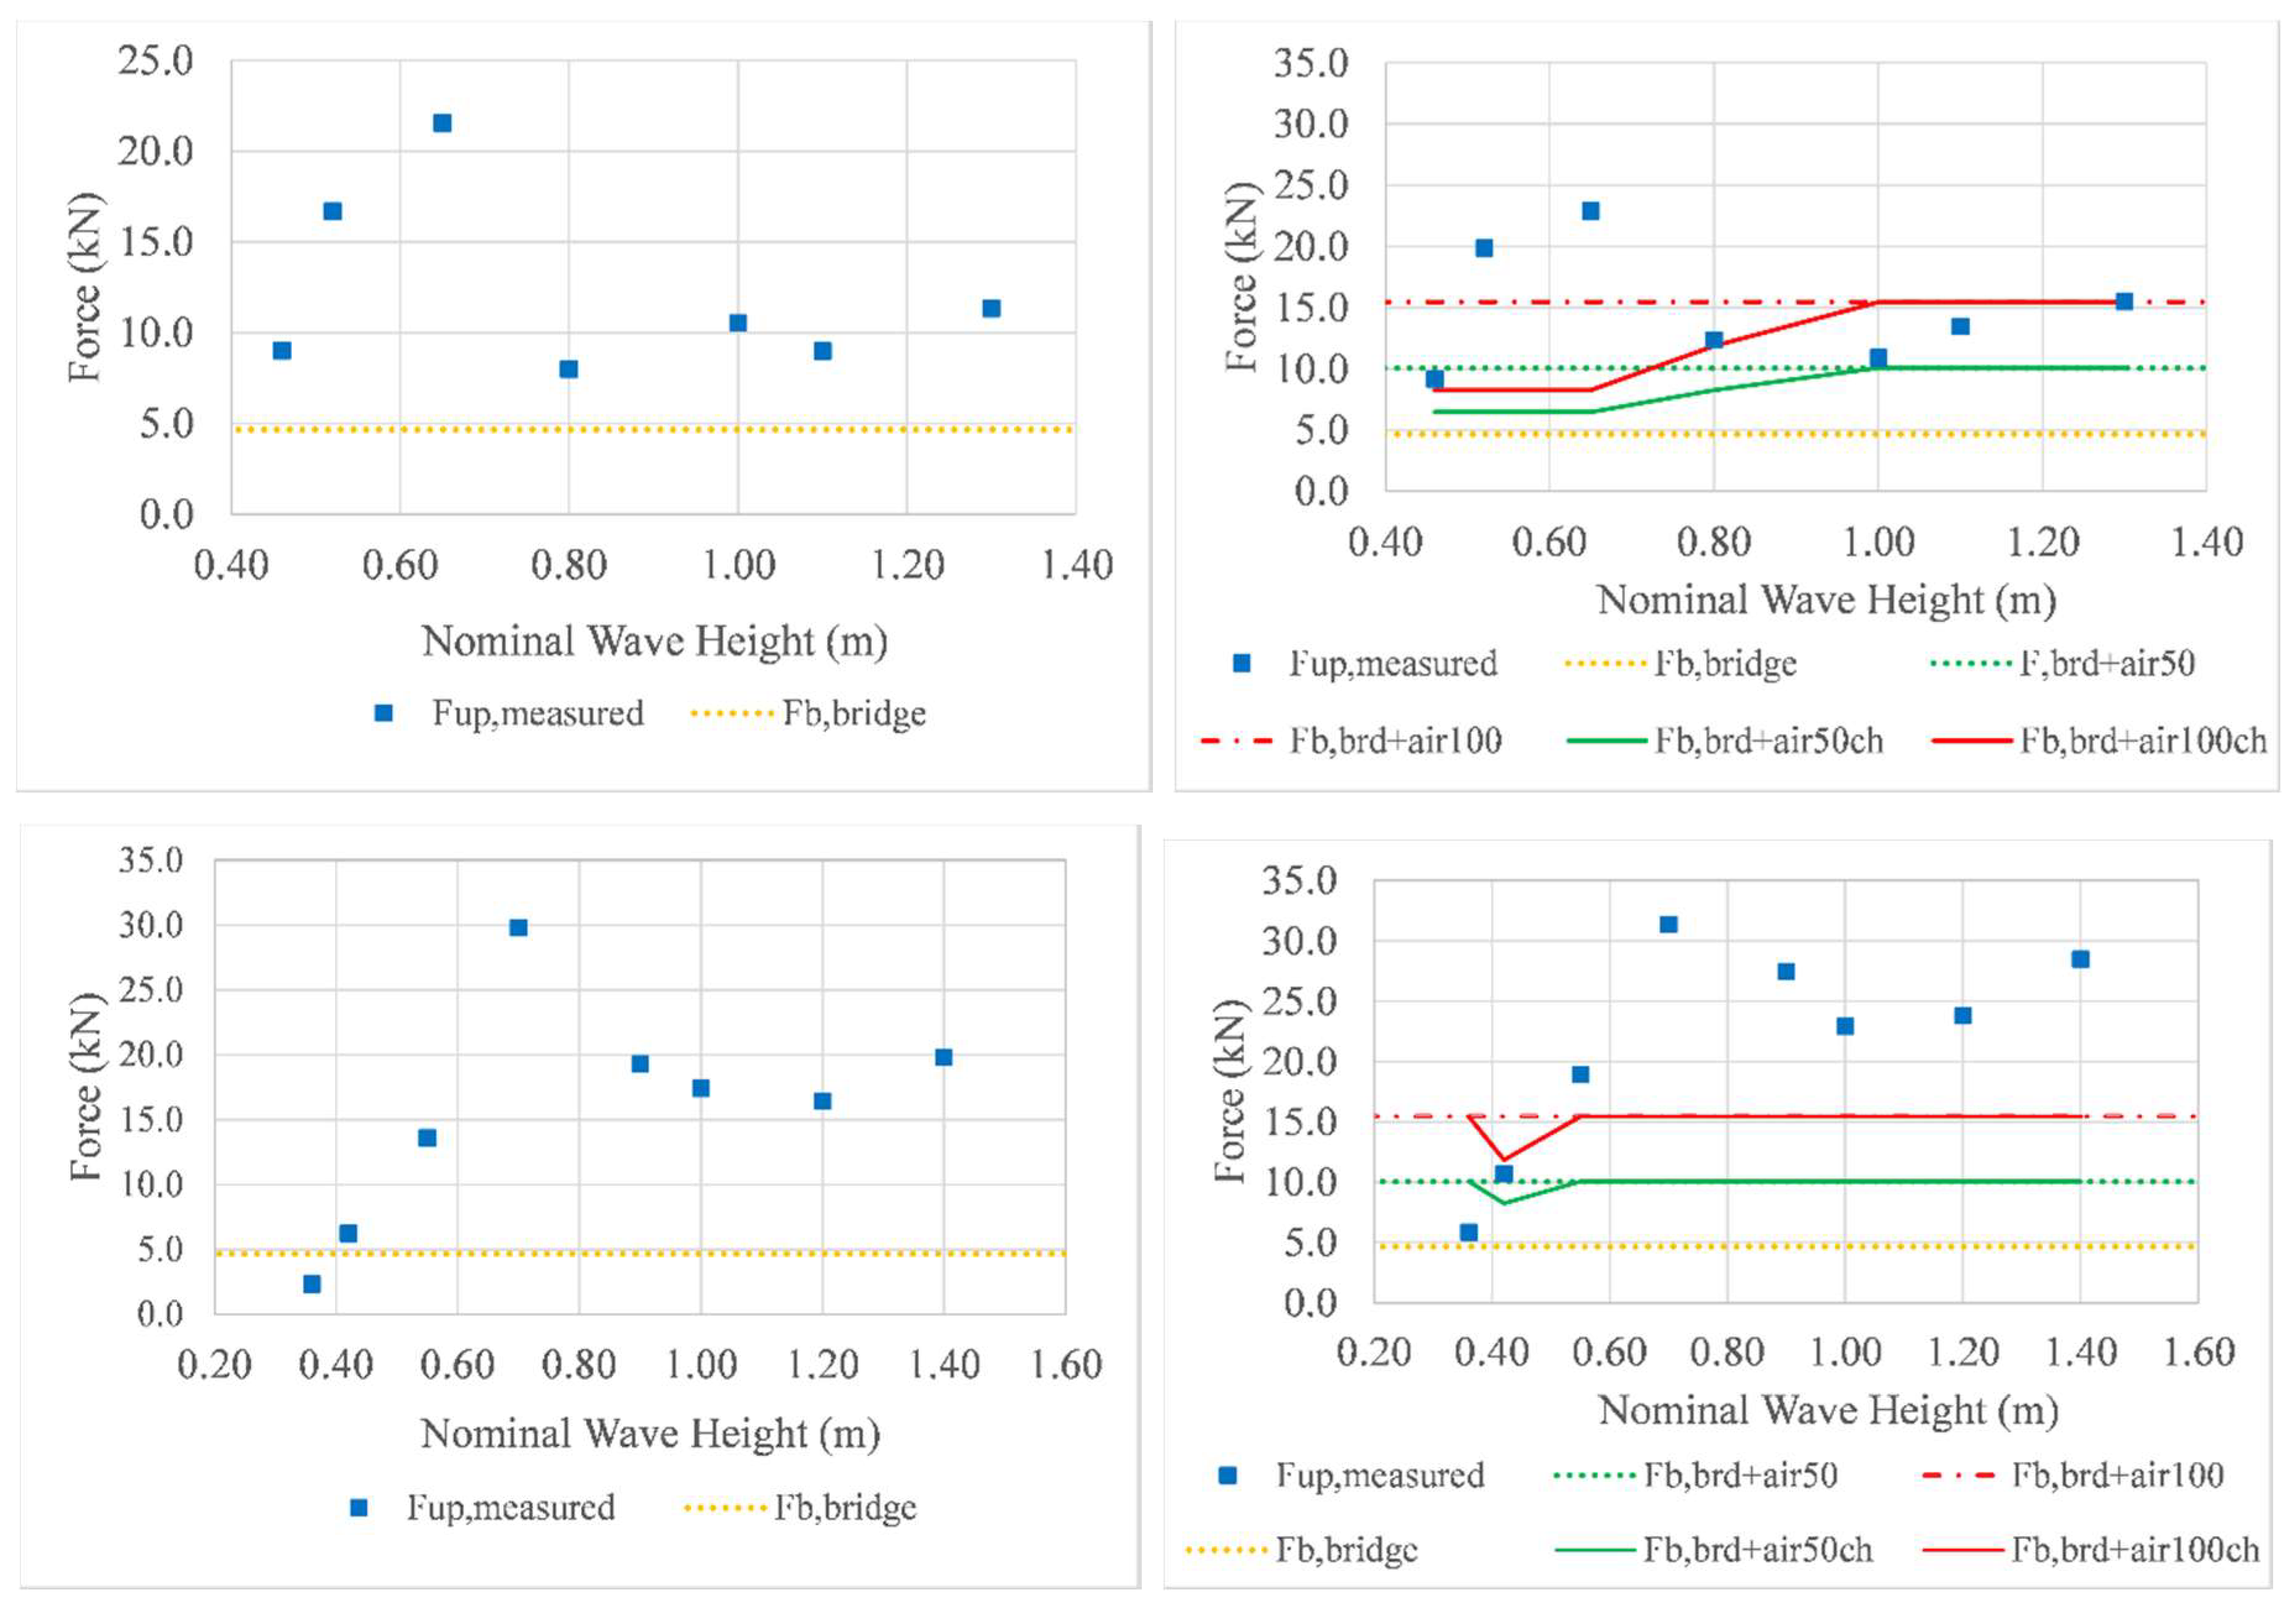
5.1. Total Forces vs. Buoyancy
- Only the buoyancy of the bridge Fb,bridge, which considers the buoyancy of the deck and connecting elements, assuming that all the trapped air has escaped from underneath the deck;
- The buoyancy of the bridge and the buoyancy of the trapped air, assuming that 50% (Fb,brd+air50) or 100% (Fb,brd+air100) of the volume of all three chambers is filled with air; and
- The buoyancy of the bridge and the buoyancy of the trapped air assuming that 50% (Fb,brd+air50ch) or 100% (Fb,brd+air100ch) of the volume of the actual number of flooded chambers is filled with air. This is expected to be a more accurate representation because the previous section revealed that, due to the complex temporal and spatial variation of the wave loading, the maximum uplift can occur anytime during the inundation process (any phase) (e.g., when one chamber is flooded or when several chambers are flooded).
5.2. Increase of Uplift Forces vs. Buoyancy of Trapped Air
- Assuming that 50% of the volume of the chambers is trapped with air gives a better estimation of the increase of both the total uplift and the quasi-static one witnessed by the deck with solid diaphragms, than the 100% hypothesis. This is true irrespective of whether all three chambers or the actual number of flooded chambers at the time of maximum uplift are considered in the calculation of the buoyancy. The mean value (without the outliers) of the ratios of the uplift increase (in ST5) to the buoyancy generated by the trapped air (Fup,ST5-Fup,ST2/Fb,air) is 1.61 and 3.22 for the 50% and 100% assumption, respectively.
- Using the actual numbers of the inundated chambers (at the instant that the maximum uplift occurs) in the calculation of the additional buoyancy gives closer results to the measured values than using all three chambers. Switching from the total to the actual number of chambers reduced the mean values from 1.61 to 1.26 and from 3.22 to 2.52 for the 50% and 100% hypotheses, respectively. For the quasi-static uplift, the respective reductions were from 1.63 to 1.37 and from 3.26 to 2.75.
- The increase of the quasi-static force (Fup,qs) is better predicted than the increase of the total uplift by the buoyancy generated from the trapped air, with the mean values (that consider the outliers) being 1.75 and 3.49 for Fup,qs and 4.72 and 9.45 for Fup, for the 50% and 100% assumption, respectively, and all the chambers inundated. If the two outliers are removed then the Fup and Fup,qs have very similar mean values, with the former showing even smaller mean values than the latter one. However, even in this case the correlation of the increase of Fup,qs with the buoyancy of the trapped air is better because than the one of Fup, because the coefficient of variation is 30.3% in the former case and 75.1% in the latter one. The reason behind this behavior is the fact that, as discussed in previous sections, although the buoyancy of the trapped air increases, consistently, the quasi-static component of the uplift force, this is not always reflected in the total uplift, because it is also affected by the slamming component, which is not affected by the air-entrapment in a consistent way (can either increase or decrease).
6. Practical Recommendations for Engineering Design
6.1. Total Deck Uplift
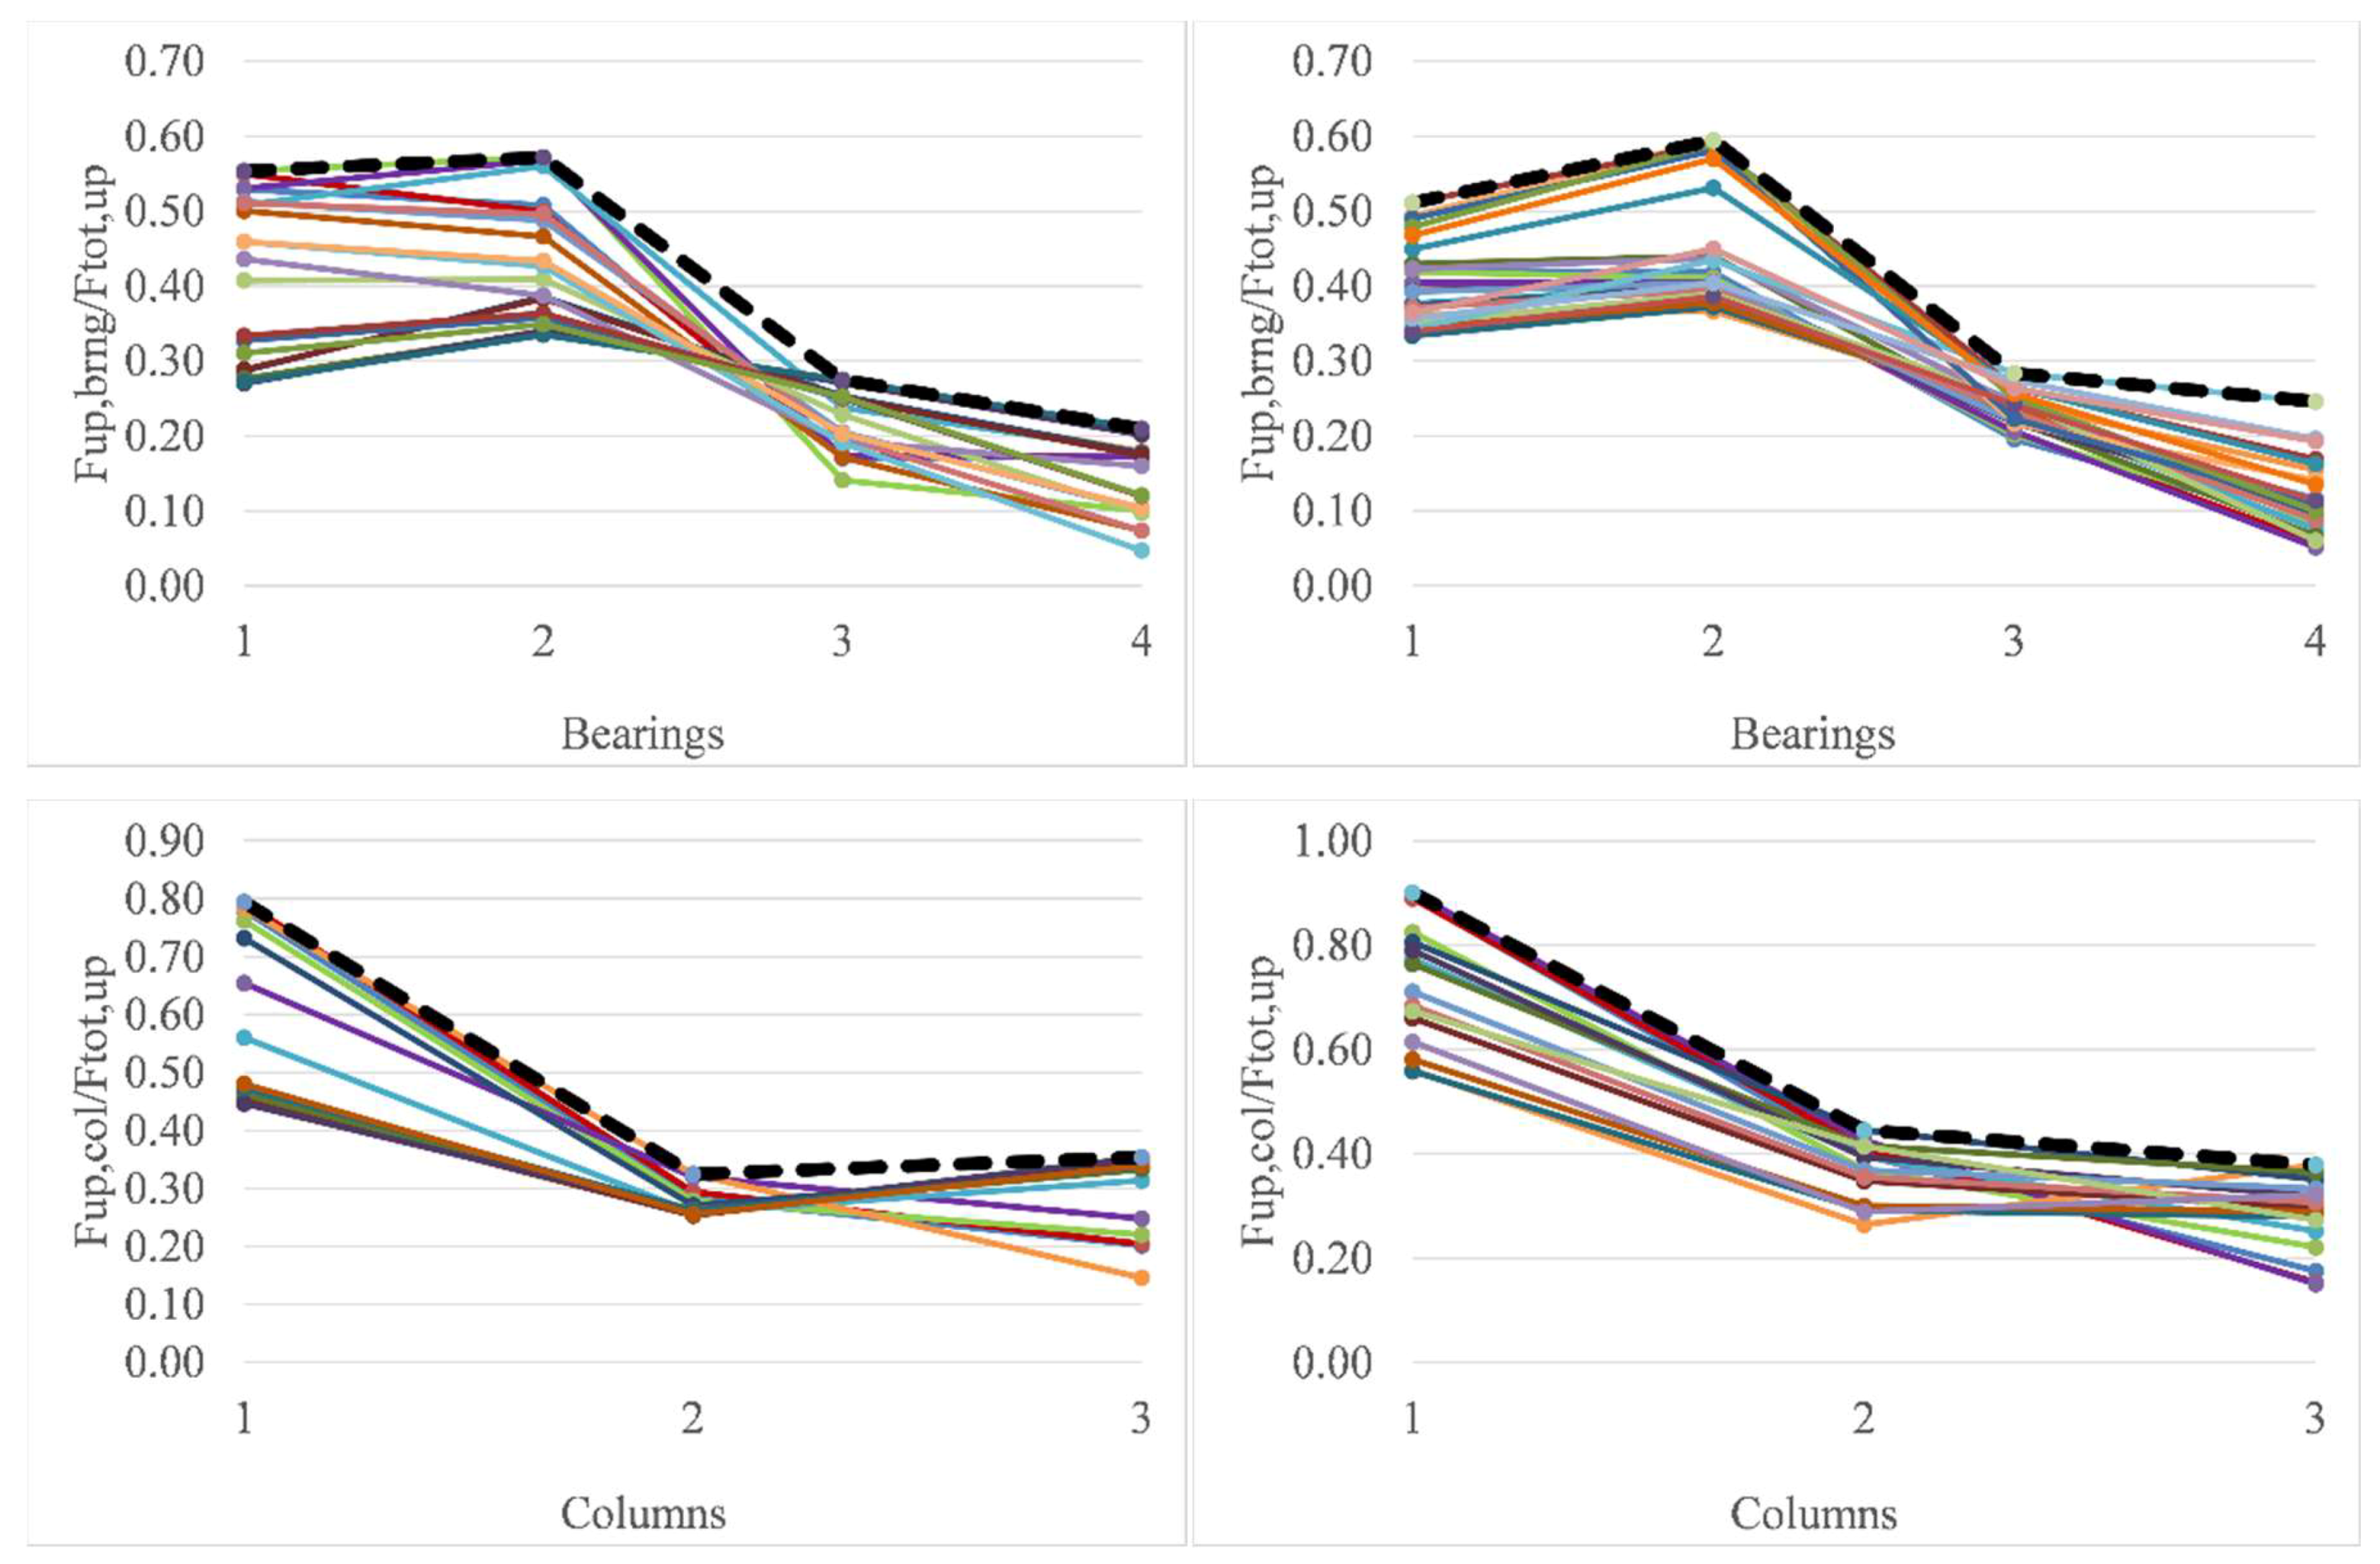
6.2. Non-Dimensional Uplift Curves for Bearings and Connections
6.3. Limitations and Future Work
- Elastomeric bearings. For other type of bearings (e.g., steel bearings) the readers can use the information provided in [28].
- Bridges with four or more girders. Although in the experiments the deck had four girders, the non-dimensional curves can be used for a larger number of girders, since in this case the actual ratios are expected to be smaller.
- Decks with similar dimensions and dimension ratios (girder height to deck width, overhang width to deck width) as the one tested in the experiments, and without rails. For example, if a deck has a larger girder height or the same height but solid rails, then the moment arm of the horizontal force (Fh) will increase, which would consequently increase the overturning moment resulting in increased uplift in the offshore bearings and other structural components.
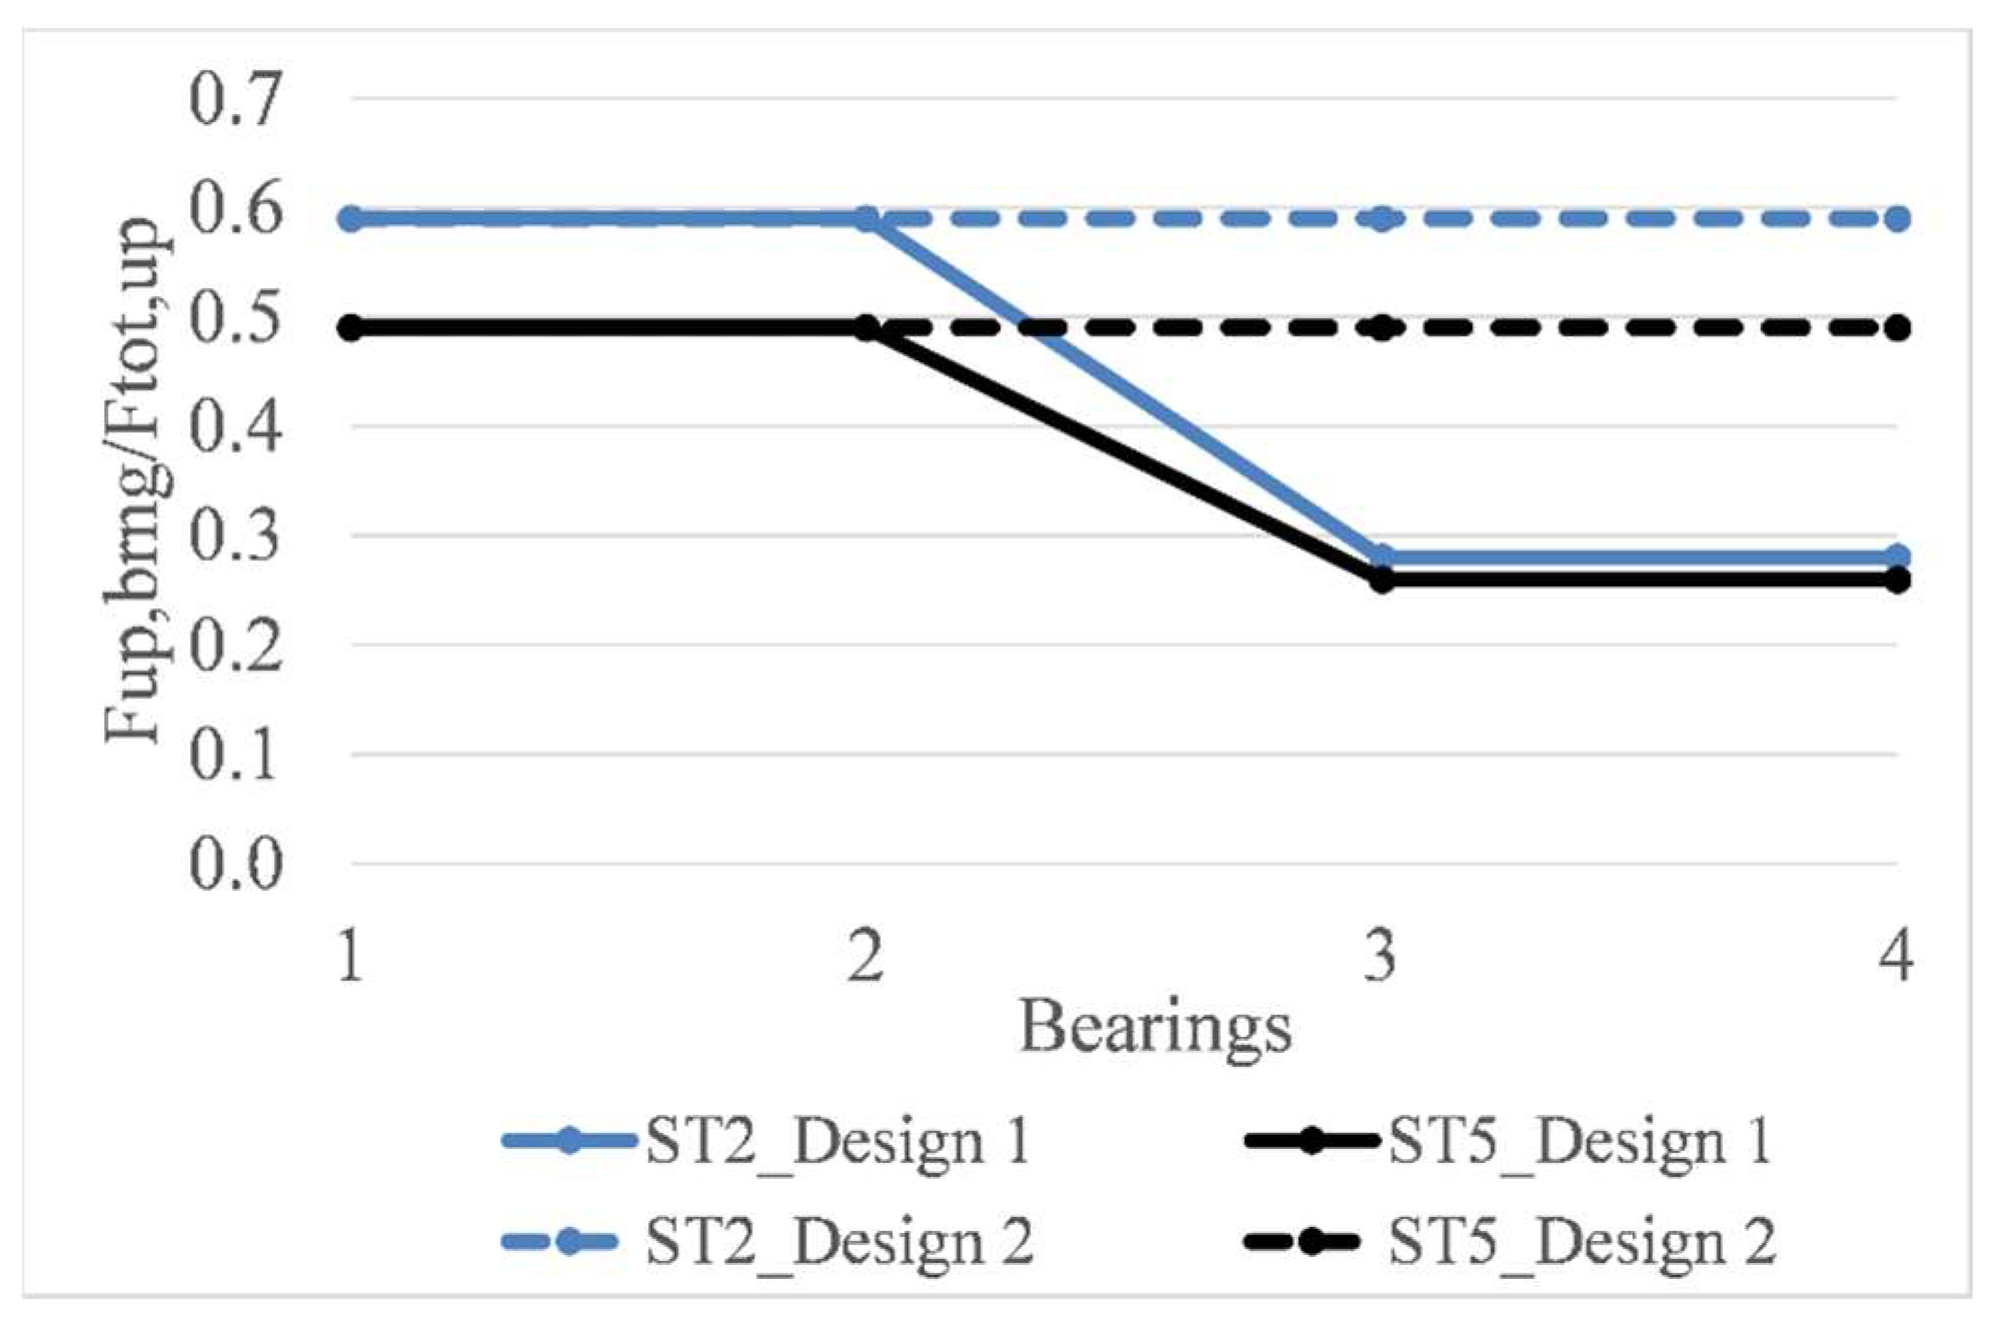
- The curves of the design alternative 1 presented in Figure 19, which show reduced design values for all the bearings on the onshore side of the deck C.G. have been developed for the scenario in which the tsunami flows only in one direction. In reality though, the tsunami will flow in two directions, one direction when it initially impacts and inundates the coast, and the opposite direction when the tsunami retracts back to the ocean. This means that during the reverse flow the onshore bearings will witness larger uplift forces than the offshore ones, but it is unclear if they will be larger than the 28% of the Ftot,up applied during the first impact of the bore on the offshore side of the deck. Therefore, future research should examine the effects of the reverse flow, especially given the fact that, in such a case, significant debris can accumulate on the onshore side of the deck.
7. Summary and Conclusions
- Modifies significantly the wave flow in the chambers and introduces a different pattern of pressures on the girders and below the deck. However, the exact effect depends on the wave type. In the case of solitary waves, the pressure histories consistently (i) reach their maximum values before the wave reaches the girder and the deck, due to the fact that the wave pressure is transferred to the bridge through the compressed air; and (ii) have two characteristic peaks, smoother and with a longer duration than the case without trapped air, due to the nonlinear wave–air interaction and the cushioning effect. However, these effects are not always observed in the case of bores, revealing the existence of a more complex dynamic interaction between the air and the tsunami-like bores than in the case of simplified solitary waves.
- Can increase the pressures below the deck by up to a factor of 16.8; however, this effect is not consistent for all wave heights and in all chambers or girders. Some chambers witness reduced pressures due to the presence of air, which means that these pressures are not purely hydrostatic ones, but there is a significant hydrodynamic component undergoing a complex interaction with the trapped air. Moreover, the different effect on the pressures in consecutive chambers and on the girders indicates that the wave is being affected by the interaction with the air in the first chamber, resulting in the modification of the flow and the induced pressures in the rest of the chambers.
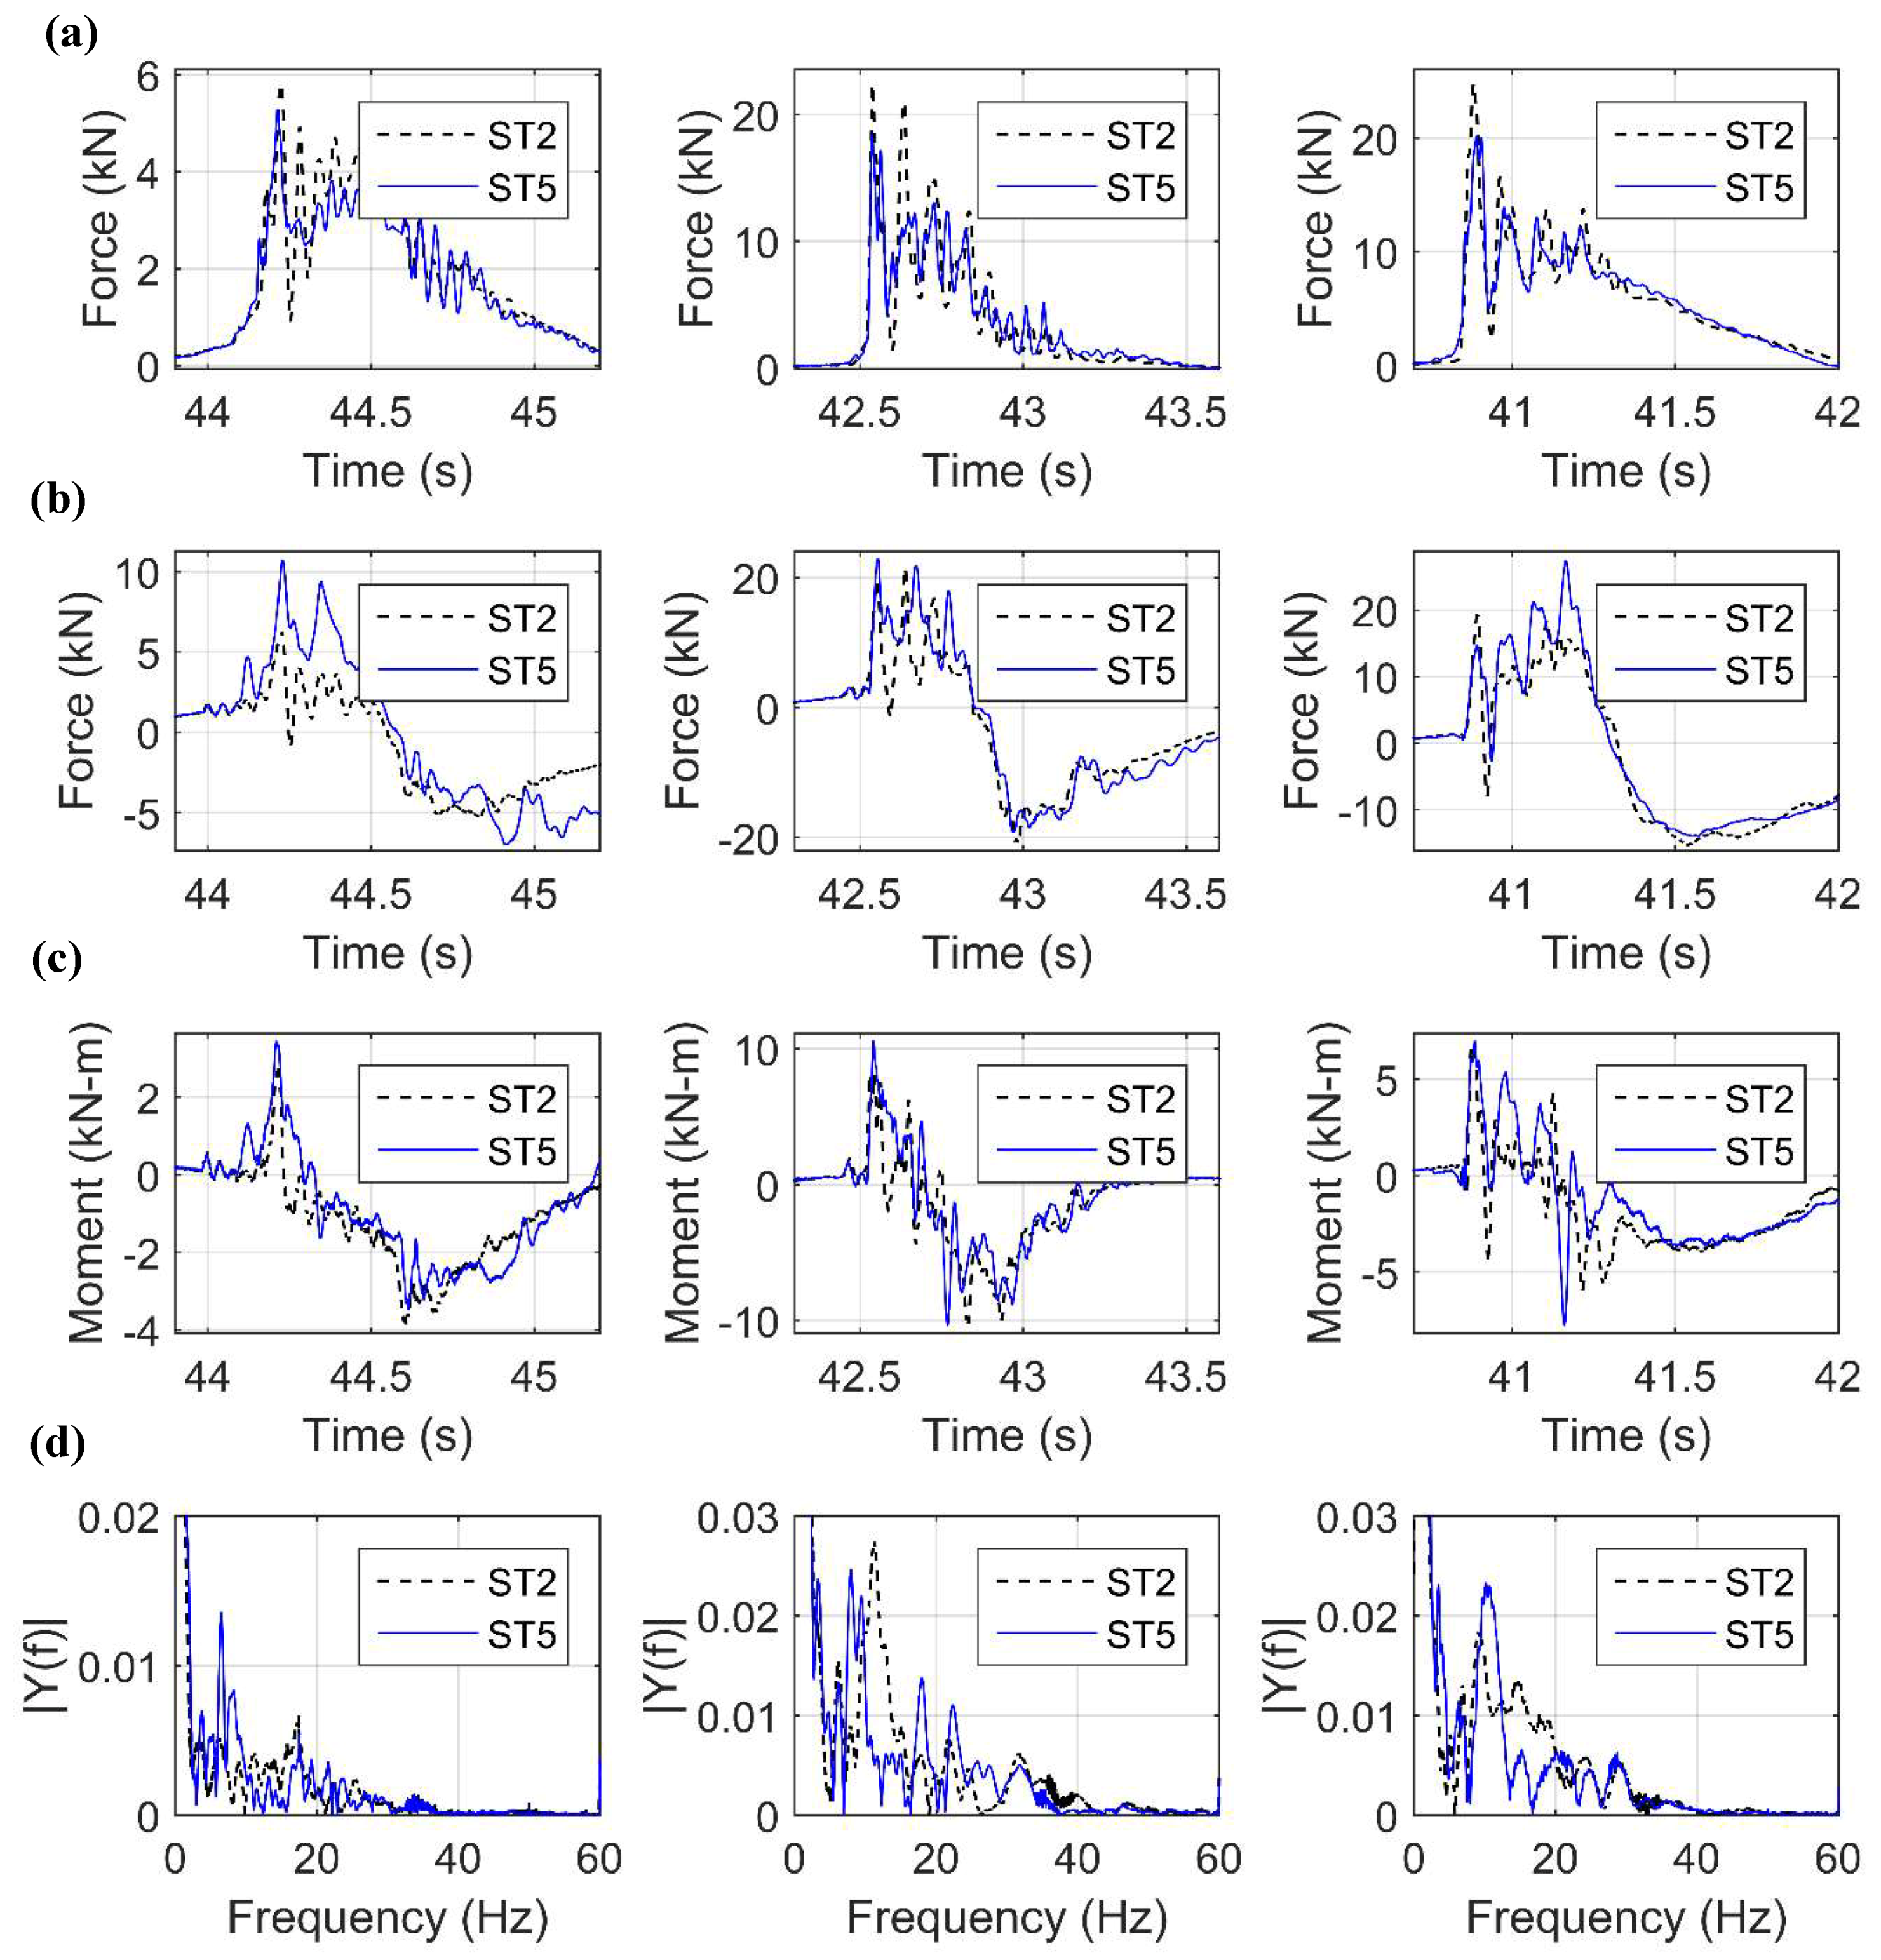
- Has a small or negligible effect on the maximum horizontal forces for most waves, since the maximum value tends to occur at the initial impact of the waves on the offshore girder (true for all bores and several solitary waves). However, after the initial peak, the horizontal forces have different patterns, with the deck with diaphragms witnessing smoother peaks than the deck with cross-frames due to the existence of the compressible air.
- Affects the uplift forces more than the horizontal ones, by increasing the duration and magnitude of most uplift peaks observed in the time-histories. The exact increase in the uplift forces depends on the wave height and wave type, and in the current experimental work the average increase of the total uplift force was 39% and the maximum increase was 148%.
Author Contributions
Funding
Acknowledgments
Conflicts of Interest
References
- Unjoh, S. Bridge damage caused by tsunami. Jpn. Assoc. Earthq. Eng. 2007, 6, 6–28. [Google Scholar]
- Maruyama, K.; Tanaka, Y.; Kosa, K.; Hosoda, A.; Arikawa, T.; Mizutani, N.; Nakamura, T. Evaluation of tsunami force acting on bridge girders. In Proceedings of the Thirteenth East Asia-Pacific Conference on Structural Engineering and Construction (EASEC-13), Sapporo, Japan, 11–13 September 2013. [Google Scholar]
- Kosa, K. Damage analysis of bridges affected by tsunami due to Great East Japan Earthquake. In Proceedings of the Symposium on Engineering Lessons Learned from the 2011 Great East Japan Earthquake, Tokyo, Japan, 1–4 March 2012. [Google Scholar]
- Kawashima, K. Damage of bridges due to the 2011 Great East Japan Earthquake. In Proceedings of the International Symposium on Engineering Lessons Learned from the 2011 Great East Japan Earthquake, Tokyo, Japan, 1–4 March 2012.
- Kasano, H.; Oka, J.; Sakurai, J.; Kodama, N.; Yoda, T. Investigative research on bridges subjected to tsunami disaster in 2011 off the pacific coast of Tohoku earthquake. In Australasian Structural Engineering Conference 2012: The Past, Present and Future of Structural Engineering; Engineers Australia: Barton, Australia, 2012; p. 51. [Google Scholar]
- Hayashi, H. Study on tsunami wave force acting on a bridge superstructure. In Proceedings of the 29th US-Japan Bridge Engineering Workshop, Tsukuba, Japan, 11–13 November 2013. [Google Scholar]
- Lau, T.L.; Ohmachi, T.; Inoue, S.; Lukkunaprasit, P. Experimental and numerical modeling of tsunami force on bridge decks. In Tsunami—A Growing Disaster; InTech: London, UK, 2011. [Google Scholar] [CrossRef]
- Seiffert, B.; Hayatdavoodi, M.; Ertekin, R.C. Experiments and computations of solitary-wave forces on a coastal-bridge deck. Part I: Flat plate. Coast. Eng. 2014, 88, 194–209. [Google Scholar] [CrossRef]
- Mazinani, I.; Ismail, Z.; Hashim, A.M.; Saba, A. Experimental investigation on tsunami acting on bridges. Int. J. Civ. Archit. Struct. Constr. Eng. 2014, 8, 1040–1043. [Google Scholar]
- Rahman, S.; Akib, S.; Shirazi, S.M. Experimental investigation on the stability of bride girder against tsunami forces. Sci. China Technol. Sci. 2014, 57, 2028–2036. [Google Scholar] [CrossRef]
- Bricker, J.D.; Nakayama, A. Contribution of trapped air, deck superelevation, and nearby structures to bridge deck failure during a tsunami. J. Hydraul. Eng. 2014, 140, 05014002. [Google Scholar] [CrossRef]
- Kataoka, S.; Kaneko, M. Estimation of Wave Force Acting on Bridge Superstructures due to the 2011 Tohoku Tsunami. J. Disaster Res. 2013, 8, 605–611. [Google Scholar] [CrossRef]
- Nakao, H.; Zhang, G.; Sumimura, T.; Hoshikuma, J. Numerical assessment of tsunami-induced effect on bridge behavior. In Proceedings of the 29th US-Japan Bridge Engineering Workshop, Tsukuba, Japan, 11–13 November 2013; pp. 11–13. [Google Scholar]
- Azadbakht, M.; Yim, S.C. Simulation and estimation of tsunami loads on bridge superstructures. J. Waterw. Port Coast. Ocean Eng. 2014, 141, 04014031. [Google Scholar] [CrossRef]
- Istrati, D.; Buckle, I.G. Effect of fluid-structure interaction on connection forces in bridges due to tsunami loads. In Proc 30th US—Japan Bridge Engineering Workshop; Department of Transportation’s Federal Highway Administration: Washington, DC, USA, 2014. [Google Scholar]
- Wei, Z.; Dalrymple, R.A. Numerical study on mitigating tsunami force on bridges by an SPH model. J. Ocean Eng. Mar. Energy 2016, 2, 365–380. [Google Scholar] [CrossRef] [Green Version]
- Hoshikuma, J.; Zhang, G.; Nakao, H.; Sumimura, T. Tsunami-induced effects on girder bridges. In Proceedings of the International Symposium for Bridge Earthquake Engineering in Honor of Retirement of Professor Kazuhiko Kawashima, Tokyo, Japan, 15 March 2013. [Google Scholar]
- McPherson, R.L. Hurricane Induced Wave and Surge Forces on Bridge Decks. Ph.D. Thesis, Texas A&M University, College Station, TX, USA, 2008. [Google Scholar]
- Hayatdavoodi, M.; Seiffert, B.; Ertekin, R.C. Experiments and computations of solitary-wave forces on a coastal-bridge deck. Part II: Deck with girders. Coast. Eng. 2014, 88, 210–228. [Google Scholar] [CrossRef]
- Cuomo, G.; Shimosako, K.I.; Takahashi, S. Wave-in-deck loads on coastal bridges and the role of air. Coast. Eng. 2014, 56, 793–809. [Google Scholar] [CrossRef]
- Seiffert, B.R.; Cengiz Ertekin, R.; Robertson, I.N. Effect of entrapped air on solitary wave forces on a coastal bridge deck with girders. J. Bridg. Eng. 2015, 21, 04015036. [Google Scholar] [CrossRef]
- Bozorgnia, M.; Lee, J.J.; Raichlen, F. Wave structure interaction: Role of entrapped air on wave impact and uplift forces. Coast. Eng. Proc. 2011, 1, 57. [Google Scholar] [CrossRef]
- Xu, G.; Cai, C.S.; Chen, Q. Countermeasure of Air Venting Holes in the Bridge Deck–Wave Interaction under Solitary Waves. J. Perform. Constr. Facil. 2016, 31, 04016071. [Google Scholar] [CrossRef]
- Qu, K.; Tang, H.S.; Agrawal, A.; Cai, Y. Hydrodynamic effects of solitary waves impinging on a bridge deck with air vents. J. Bridg. Eng. 2017, 22, 04017024. [Google Scholar] [CrossRef]
- Madsen, A.; Fuhrman, D.R.; Schäffer, H.A. On the solitary wave paradigm for tsunamis. J. Geophys. Res. 2008, 113, 286–292. [Google Scholar] [CrossRef]
- Chan, I.C.; Liu, L.F. On the run-up of long waves on a plane beach. J. Geophys. Res. 2012, 117, 72–82. [Google Scholar] [CrossRef]
- Leschka, S.; Oumeraci, H. Solitary waves and bores passing three cylinders-effect of distance and arrangement. Coast. Eng. Proc. 2014, 1, 39. [Google Scholar] [CrossRef]
- Istrati, D.; Buckle, I.; Lomonaco, P.; Yim, S. Deciphering the Tsunami Wave Impact and Associated Connection Forces in Open-Girder Coastal Bridges. J. Mar. Sci. Eng. 2018, 6, 148. [Google Scholar] [CrossRef]
- Bradner, C.; Schumacher, T.; Cox, D.; Higgins, C. Experimental setup for a large-scale bridge superstructure model subjected to waves. J. Waterw. Port Coast. Ocean Eng. 2010, 137, 3–11. [Google Scholar] [CrossRef]
- Istrati, D.; Buckle, I.; Lomonaco, P.; Yim, S.; Itani, A. Large-scale experiments of tsunami impact forces on bridges: The role of fluid-structure interaction and air-venting. In Proceedings of the 26th International Ocean and Polar Engineering Conference, Rhodes, Greece, 26 June–2 July 2016. [Google Scholar]
- AASHTO LRFD Bridge Design Specifications; American Association of State Highway and Transportation Officials: Washington, DC, USA, 2012.
- Ghosh, S.; Reins, G.; Koo, B.; Wang, Z.; Yang, J.; Stern, F. Plunging wave breaking: EFD and CFD. In International Conference on Violent Flows; National University: Fukuoka, Japan, 2007. [Google Scholar]
- Istrati, D. Large-Scale Experiments of Tsunami Inundation of Bridges including Fluid-Structure-Interactio. Ph.D. Thesis, University of Nevada, Reno, Nevada, 2017. [Google Scholar]
- Peregrine, D.H.; Bredmose, H.; Bullock, G.B.; Obhrai, C.; Wolters, G.; Muller, G. Violent water wave impact on walls and the role of air. In Proceedings of the 29th International Conference on Coastal Engineering, Lisbon, Portugal, 19–24 September 2004; pp. 4005–4017. [Google Scholar]
- Robertson, I.N.; Riggs, H.R.; Mohamed, A. Experimental results of tsunami bore forces on structures. In Proceedings of the ASME 2008 27th International Conference on Offshore Mechanics and Arctic Engineering, Estoril, Portugal, 15–20 June 2018; American Society of Mechanical Engineers: New York, NY, USA, 2008; pp. 509–517. [Google Scholar]
- Jose, J.; Podrazka, O.; Obhrai, C.; Gudmestad, O.T.; Cieslikiewicz, W. Methods for Analysing Wave Slamming Loads on Truss Structures Used in Offshore Wind Applications Based on Experimental Data. Int. J. Offshore Polar Eng. 2016, 26, 100–108. [Google Scholar] [CrossRef]
- Huang, N.E.; Shen, Z.; Long, S.R. A new view of nonlinear water waves: The Hilbert Spectrum 1. Annu. Rev. Fluid Mech. 1999, 31, 417–457. [Google Scholar] [CrossRef]
- Douglass, S.L.; Chen, Q.; Olsen, J.M.; Edge, B.L.; Brown, D. Final Report Prepared for U.S. Department of Transportation and Federal Highway Administration Office of Bridge Technology. In Wave Forces on Bridge Decks; Federal Highway Administration: Washington, DC, USA, 2006. [Google Scholar]


| Wave Type | Nominal Wave Height (m) | Water Depth (m) |
|---|---|---|
| Unbroken Solitary Wave | 0.46, 0.52, 0.65 | 1.90 (1.06) |
| 0.36, 0.42, 0.50, 0.55, 0.62, 0.70 | 2.00 (1.16) | |
| Bore | 0.80, 1.00, 1.10, 1.30 | 1.90 (1.06) |
| 0.80, 0.90, 1.00, 1.20, 1.40 | 2.00 (1.16) |
| d (m) | H (m) | ST2 | ST5 | Ratios ST5/ST2 | ||||||
|---|---|---|---|---|---|---|---|---|---|---|
| Hwg2 | Hwg12 | Huswg1 | Hwg2 | Hwg12 | Huswg1 | Hwg2 | Hwg12 | Huswg1 | ||
| (m) | (m) | (m) | (m) | (m) | (m) | |||||
| 1.90 | 0.46 | 0.48 | 0.58 | 0.60 | 0.46 | 0.55 | 0.60 | 0.96 | 0.95 | 1.00 |
| 0.52 | 0.54 | 0.67 | 0.71 | 0.54 | 0.66 | 0.68 | 1.00 | 0.99 | 0.96 | |
| 0.65 | 0.66 | 0.91 | 0.91 | 0.67 | 0.89 | 0.91 | 1.02 | 0.98 | 1.00 | |
| 0.80 | 0.80 | 0.72 | 0.65 | 0.80 | 0.82 | 0.77 | 1.00 | 1.13 | 1.19 | |
| 1.00 | 0.99 | 0.69 | 0.74 | 0.99 | 0.75 | 0.69 | 0.99 | 1.08 | 0.94 | |
| 1.10 | 1.09 | 0.77 | - | 1.07 | 0.72 | 0.75 | 0.98 | 0.94 | - | |
| 1.30 | 1.29 | 0.61 | 0.66 | 1.31 | 0.74 | 0.78 | 1.02 | 1.22 | 1.19 | |
| 2.00 | 0.36 | 0.37 | 0.41 | 0.43 | 0.38 | 0.42 | 0.43 | 1.02 | 1.01 | 1.00 |
| 0.42 | 0.43 | 0.49 | 0.52 | 0.44 | 0.50 | 0.51 | 1.02 | 1.01 | 1.00 | |
| 0.55 | 0.55 | 0.66 | 0.72 | 0.56 | 0.68 | 0.70 | 1.00 | 1.02 | 0.97 | |
| 0.70 | 0.69 | 0.90 | 0.97 | 0.70 | 0.91 | 0.97 | 1.02 | 1.01 | 1.00 | |
| 0.90 | 0.87 | 0.96 | 0.87 | 0.88 | 0.88 | 0.88 | 1.01 | 0.92 | 1.00 | |
| 1.00 | 0.94 | 0.78 | 0.83 | 0.98 | 0.80 | 0.80 | 1.04 | 1.03 | 0.97 | |
| 1.20 | 1.14 | 0.82 | 0.79 | 1.16 | 0.75 | 0.84 | 1.02 | 0.92 | 1.07 | |
| 1.40 | 1.35 | 0.73 | 0.82 | 1.37 | 0.79 | 0.83 | 1.02 | 1.07 | 1.01 | |
| Mean | 1.01 | 1.02 | 1.02 | |||||||
| SD | 0.02 | 0.08 | 0.07 | |||||||
| CV (%) | 1.78 | 7.75 | 7.23 | |||||||
| All Tested Wave Heights | Three Smallest Wave Heights Removed | |||||||
|---|---|---|---|---|---|---|---|---|
| Girder2 | Girder3 | Chamb.1 | Chamb.2 | Girder2 | Girder3 | Chamb.1 | Chamb.2 | |
| Max | 1.55 | 1.93 | 10.65 | 16.8 | 1.55 | 1.93 | 3.36 | 3.78 |
| Min | 0.57 | 0.49 | 0.42 | 0.54 | 0.57 | 0.49 | 0.42 | 0.54 |
| Mean | 0.96 | 1.19 | 2.35 | 3.53 | 0.94 | 1.10 | 1.16 | 1.6 |
| H (m) | Phase of Max Fup | Total Uplift Forces Fup | Quasi-static Uplift Forces Fup,qs | |||||||
|---|---|---|---|---|---|---|---|---|---|---|
| ST2 | ST5 | ST2 | ST5 | ST5/ ST2 | ST5- ST2 | ST2 | ST5 | ST5/ ST2 | ST5- ST2 | |
| (kN) | (kN) | (kN) | (kN) | |||||||
| 0.46 | A | A/B | 9.02 | 9.18 | 1.02 | 0.16 | 3.15 | 4.94 | 1.57 | 1.79 |
| 0.52 | A | A/B | 16.69 | 19.88 | 1.19 | 3.18 | 4.55 | 7.59 | 1.67 | 3.04 |
| 0.65 | B | A/B | 21.55 | 22.91 | 1.06 | 1.36 | 9.00 | 13.10 | 1.46 | 4.10 |
| 0.80 | B | B | 7.98 | 12.36 | 1.55 | 4.38 | 6.64 | 8.94 | 1.35 | 2.30 |
| 1.00 | A | B | 10.54 | 10.89 | 1.03 | 0.36 | 6.82 | 9.55 | 1.40 | 2.73 |
| 1.10 | B | B | 9.00 | 13.49 | 1.50 | 4.48 | 7.56 | 10.02 | 1.32 | 2.46 |
| 1.30 | A | B | 11.34 | 15.52 | 1.37 | 4.18 | 6.24 | 12.26 | 1.97 | 6.03 |
| 0.36 | B | B | 2.37 | 5.87 | 2.48 | 3.50 | 1.62 | 3.93 | 2.42 | 2.30 |
| 0.42 | A | A/B | 6.13 | 10.74 | 1.75 | 4.61 | 2.97 | 6.52 | 2.19 | 3.55 |
| 0.55 | A | B | 13.45 | 18.93 | 1.41 | 5.48 | 9.33 | 12.93 | 1.39 | 3.60 |
| 0.70 | B | B | 30.25 | 31.39 | 1.04 | 1.14 | 17.87 | 20.16 | 1.13 | 2.29 |
| 0.90 | A | B | 19.29 | 27.48 | 1.42 | 8.19 | 12.81 | 16.97 | 1.32 | 4.16 |
| 1.00 | B | B | 17.48 | 22.95 | 1.31 | 5.47 | 12.44 | 16.62 | 1.34 | 4.18 |
| 1.20 | A,B | B | 17.55 | 23.79 | 1.36 | 6.25 | 12.19 | 16.98 | 1.39 | 4.78 |
| 1.40 | A,B | B | 19.88 | 28.49 | 1.43 | 8.61 | 14.50 | 18.83 | 1.30 | 4.33 |
| Mean | 1.39 | 4.09 | - | - | 1.55 | 3.44 | ||||
| SD | 0.36 | 2.49 | - | - | 0.35 | 1.13 | ||||
| CV | 26% | 61% | - | - | 23% | 33% | ||||
| H (m) | Total Fup | OTM | Brgs, G1 | Brgs, G2 | Brgs, G3 | Brgs, G4 | Col. 1 | Col. 2 | Col. 3 |
|---|---|---|---|---|---|---|---|---|---|
| 0.46 | 1.02 | 0.96 | 0.98 | 1.02 | 1.24 | 1.29 | 0.98 | 1.39 | 1.89 |
| 0.52 | 1.19 | 1.06 | - | - | - | - | 0.97 | 1.42 | 1.50 |
| 0.65 | 1.06 | 1.30 | 1.08 | 1.15 | 1.14 | 1.54 | 1.04 | 1.20 | 1.72 |
| 0.80 | 1.55 | 1.76 | 1.51 | 1.56 | 1.77 | 1.29 | 1.51 | 2.00 | 2.51 |
| 1.00 | 1.03 | 1.28 | 0.85 | 0.88 | 0.89 | 1.06 | 0.90 | 1.17 | 1.90 |
| 1.10 | 1.50 | 0.87 | 0.82 | 0.94 | 1.19 | 1.33 | 0.84 | 1.23 | 1.94 |
| 1.30 | 1.37 | 1.05 | 0.90 | 0.92 | 0.97 | 1.64 | 0.91 | 1.15 | 2.61 |
| 0.36 | 2.48 | 3.12 | - | - | - | - | 2.11 | 2.51 | 3.20 |
| 0.42 | 1.75 | 1.26 | 1.25 | 1.42 | 1.72 | 2.91 | 1.22 | 1.64 | 3.92 |
| 0.55 | 1.41 | 1.20 | - | - | - | - | 1.02 | 1.38 | 1.57 |
| 0.70 | 1.04 | 1.13 | 1.16 | 1.12 | 0.99 | 0.61 | 1.11 | 1.08 | 1.08 |
| 0.90 | 1.42 | 1.03 | 0.84 | 0.85 | 1.04 | 2.22 | 0.84 | 0.96 | 2.33 |
| 1.00 | 1.31 | 1.86 | - | - | - | - | 1.60 | 2.27 | 1.24 |
| 1.20 | 1.36 | 0.82 | 0.81 | 0.86 | 0.99 | 1.17 | 0.87 | 1.01 | 1.52 |
| 1.40 | 1.46 | 1.14 | 1.09 | 1.11 | 1.20 | 1.75 | 1.07 | 1.29 | 1.77 |
| Mean | 1.39 | 1.32 | 1.02 | 1.07 | 1.19 | 1.53 | 1.13 | 1.45 | 2.05 |
| H (m) | Fup ST5-ST2 | Buoyancy, Fb | (Fup,ST5-Fup,ST2)/Fb | (Fup,qs,ST5-Fup,qs,ST2)/Fb | |||||||
|---|---|---|---|---|---|---|---|---|---|---|---|
| Actual chamb. | All chamb. | Actual chamb. | All chamb. | Actual chamb. | |||||||
| Fb,50 | Fb,100 | Fb,50 | Fb,100 | Fb,50 | Fb,100 | Fb,50 | Fb,100 | Fb,50 | Fb,100 | ||
| (kN) | (kN) | ||||||||||
| 0.46 | 0.16 | 1.80 | 3.60 | 34.76 | 69.53 | 11.59 | 23.18 | 3.01 | 6.03 | 1.00 | 2.01 |
| 0.52 | 3.18 | 1.80 | 3.60 | 1.70 | 3.39 | 0.57 | 1.13 | 1.78 | 3.56 | 0.59 | 1.19 |
| 0.65 | 1.36 | 1.80 | 3.60 | 3.97 | 7.93 | 1.32 | 2.64 | 1.32 | 2.63 | 0.44 | 0.88 |
| 0.80 | 4.38 | 3.60 | 7.19 | 1.23 | 2.46 | 0.82 | 1.64 | 2.35 | 4.70 | 1.57 | 3.13 |
| 1.00 | 0.36 | 5.40 | 10.79 | 15.16 | 30.31 | 15.16 | 30.31 | 1.98 | 3.96 | 1.98 | 3.96 |
| 1.10 | 4.48 | 5.40 | 10.79 | 1.20 | 2.41 | 1.20 | 2.41 | 2.20 | 4.39 | 2.20 | 4.39 |
| 1.30 | 4.18 | 5.40 | 10.79 | 1.29 | 2.58 | 1.29 | 2.58 | 0.90 | 1.79 | 0.90 | 1.79 |
| 0.36 | 3.50 | 5.40 | 10.79 | 1.54 | 3.08 | 1.54 | 3.08 | 2.34 | 4.68 | 2.34 | 4.68 |
| 0.42 | 4.61 | 3.60 | 7.19 | 1.17 | 2.34 | 0.78 | 1.56 | 1.52 | 3.04 | 1.01 | 2.03 |
| 0.55 | 5.48 | 5.40 | 10.79 | 0.98 | 1.97 | 0.98 | 1.97 | 1.50 | 3.00 | 1.50 | 3.00 |
| 0.70 | 1.14 | 5.40 | 10.79 | 4.71 | 9.43 | 4.71 | 9.43 | 2.35 | 4.71 | 2.35 | 4.71 |
| 0.90 | 8.19 | 5.40 | 10.79 | 0.66 | 1.32 | 0.66 | 1.32 | 1.30 | 2.59 | 1.30 | 2.59 |
| 1.00 | 5.47 | 5.40 | 10.79 | 0.99 | 1.97 | 0.99 | 1.97 | 1.29 | 2.58 | 1.29 | 2.58 |
| 1.20 | 6.25 | 5.40 | 10.79 | 0.86 | 1.73 | 0.86 | 1.73 | 1.13 | 2.26 | 1.13 | 2.26 |
| 1.40 | 8.61 | 5.40 | 10.79 | 0.63 | 1.25 | 0.63 | 1.25 | 1.25 | 2.49 | 1.25 | 2.49 |
| Mean | 4.72 | 9.45 | 2.87 | 5.75 | 1.75 | 3.49 | 1.39 | 2.78 | |||
| Mean2 | 1.61 | 3.22 | 1.26 | 2.52 | 1.63 | 3.26 | 1.37 | 2.75 | |||
| SD | 1.21 | 2.42 | 1.04 | 2.08 | 0.49 | 0.99 | 0.59 | 1.18 | |||
| CV(%) | 75.1 | 75.1 | 82.5 | 82.5 | 30.3 | 30.3 | 43.1 | 43.1 | |||
© 2019 by the authors. Licensee MDPI, Basel, Switzerland. This article is an open access article distributed under the terms and conditions of the Creative Commons Attribution (CC BY) license (http://creativecommons.org/licenses/by/4.0/).
Share and Cite
Istrati, D.; Buckle, I. Role of Trapped Air on the Tsunami-Induced Transient Loads and Response of Coastal Bridges. Geosciences 2019, 9, 191. https://doi.org/10.3390/geosciences9040191
Istrati D, Buckle I. Role of Trapped Air on the Tsunami-Induced Transient Loads and Response of Coastal Bridges. Geosciences. 2019; 9(4):191. https://doi.org/10.3390/geosciences9040191
Chicago/Turabian StyleIstrati, Denis, and Ian Buckle. 2019. "Role of Trapped Air on the Tsunami-Induced Transient Loads and Response of Coastal Bridges" Geosciences 9, no. 4: 191. https://doi.org/10.3390/geosciences9040191
APA StyleIstrati, D., & Buckle, I. (2019). Role of Trapped Air on the Tsunami-Induced Transient Loads and Response of Coastal Bridges. Geosciences, 9(4), 191. https://doi.org/10.3390/geosciences9040191