Abstract
Cave ice samples collected within karstic terrain have major ion and nutrient concentrations showing that the ice originates from local precipitation modified by the addition of Ca2+ and HCO3− from the dissolution of the local bedrock. Isotopic profiles of Paradana Cave ice are similar to those described in other ice caves in central and eastern Europe, where the profiles are developed through the freezing of cave pool or “lake” waters from the top downward during the onset of the cold portion of the year. Stable isotope data suggest future studies may yield a long-term paleo-environmental record for this location.
1. Introduction
Ice caves occur in numerous regions globally [1] and have been described as the smallest portion of the terrestrial cryosphere [2]. They have been defined as caves in bedrock containing perennial ice [3] and a karstic feature that accumulates stratified ice from either snow or freezing of incoming water [4]. They are geomorphic features that have a relationship both to karst and to glacial and periglacial processes [5]. The combination of winter temperatures and precipitation regime is thought to be important in maintaining ice in caves [6]. Ice caves typically occur at lower elevations than do glaciers and concern exists that as the global climate continues to warm, these features, especially the ones in temperate latitudes, will be lost [2,7]. Some have suggested that the ice bodies could contain important climatic and other environmental records much as glacier ice does [2]. There have been some studies that have analyzed cave ice for their water isotope composition e.g., [8,9]. To date, there have been few attempts to develop geochemical records from cave ice. There have been investigations of cave ice in central and eastern Europe [10,11,12,13] and most recently in Idaho, USA [14]. We present herein isotopic, major element, and nutrient data from two accessible ice cave locations in Slovenia. These data provide information on the source of these solutes to the ice, explain how the ice is formed and suggest the usefulness of these features as potential proxy records of environmental change.
2. Materials and Methods
2.1. Field Area and Sample Collection
Karst covers 44% of Slovenia and it is estimated that there are ~550 caves with permanent ice in them [15]. Most of these caves are at elevations with mean annual temperatures greater than 0 °C and 28 of them are below 1000 m above sea level. It is thought that ice is formed both in the entrances from the conversion of snow to ice and in the inner portions of the cave from the freezing of infiltrating water [3,15].
Paradana Cave (Velika ledena jama v Paradani), situated at 1135 m above sea level in the high Dinaric Karst Plateau, Trnovski gozd, is one of the best-known ice caves in Slovenia (Figure 1). Ice formation there is attributed to the circulation of air within the 7311 m long and 858 m deep cave, with an inflow of cold air in the winter and outflow of cold air in summer as described by Mihevc [15,16]. The coldest temperatures are always at the entrance where the ice accumulates [15] and there is an estimated 8000 m3 of ice at a depth of about 100 meters below the entrance (Figure 2 and Figure 3) [15]. There have been documented gains and losses of ice since 1950, with an increased loss since 1986 [15].
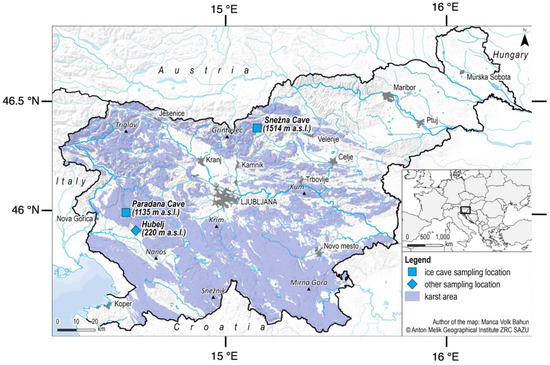
Figure 1.
Map showing the location of studied ice caves in Slovenia.
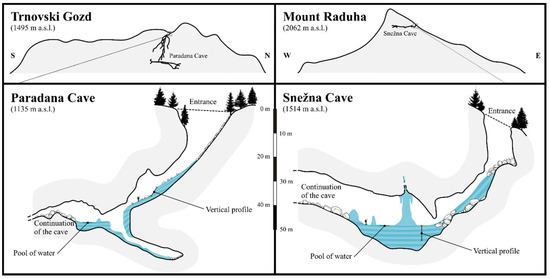
Figure 2.
Cross sections of the studied caves showing the location of the ice in the entrance part of the Paradana Cave and Snežna Cave and the location of vertical profiles and pools of water where sampling took place are shown on the upper figures. Cross sections of the entire caves and position within the topography of Trnovski Gozd karst plateau and Mount Raduha and boxes indicating the location of the profiles are shown in the upper figures (cartography by Jure Tičar).
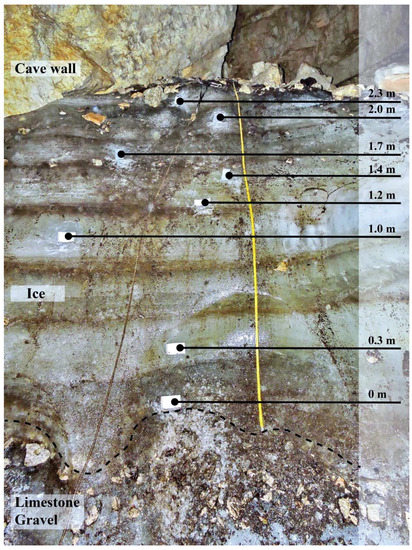
Figure 3.
Vertical profile of ice in the Paradana cave. Black dots present the sampling micro-location within the profile (photo by Matija Zorn).
Snežna Cave (Snežna jama na planini Arto) (Figure 1) is in the Southern Calcareous Alps with an entrance at 1514 m above sea level and, unlike other caves in the region, which are mostly vertical, is a 1327 m long and 75 m deep horizontal cave [15]. The sediment in the cave has been dated at >5 Ma [17]. In winter a strong flow of air runs through the cave, helping to maintain the perennial ice that forms from snow that enters in the winter at the entrance and from inflowing water that enters from a chimney above (Figure 2) [15]. The chimney input water forms large columns of ice and a deep (10 m) flat lying ice surface or “lake” that has been estimated to be 4000 m3 [15]. Unlike Paradana Cave, Snežna Cave has only been investigated since 1980 when ice at the entrance melted and revealed the passage to the inner parts of the cave [15]. Thus long-term observations in both caves indicate substantial ice loss since the late 1970s and 1980s [15].
Ice samples were collected along a vertical front of ice in both caves. In Paradana Cave, the vertical front (Figure 3) was above the flat, horizontal surface at the entrance of the cave. The lowest sample was taken approximately 10 cm above the gravel cave floor to ensure collection of ice only and the highest sample was collected about 10 cm below the top, a rubble-covered layer of the ice, also to ensure the sample was only ice. The measurements were made along the length of the slope of the ice face which was nearly vertical but its angle from the vertical was not determined. Most samples were collected while standing in front of the ice face by personnel wearing crampons to stabilize themselves. The highest sample was collected by descending via a rope that was attached to rock above the ice. In Snežna Cave, samples were obtained by descending via a rope that was affixed with ice screws to the ice block approximately 5 m above the ice floor. The face of the ice profile was nearly vertical there. Photography of the ice face was precluded by the narrow space through which JT descended to collect the ice. That nearly vertical surface was below the horizontal entrance and probably represents a profile of the ice body described by Mihevc [15]. Additional samples were collected from pools of water which had formed on horizontal ice on the cave floor. In both cases, the ice body surfaces had been cleared before sampling by scraping and chipping away the exposed surface using a clean ice axe. After the surface was cleaned, chips of ice were obtained using the ice axe and chipped directly into clean polyethylene bags. The individual taking the samples wore clean nitrile gloves.
2.2. Sample Processing and Analysis
Within 24 h of collection, the samples were melted in the collection bags and filtered through 0.45 μm pore size Whatman polypropylene filters with clean polyethylene/nylon syringes. Aliquots of filtered water were placed into one LDPE bottle for major cations and major anions, a second for nutrients, and a third for δ18O and δD of water. The sample containers had been cleaned using the methods described by Welch et al. [18]. Sample containers were then capped and stored at 4 °C for less than 7 days before shipping to the lab at The Ohio State University. Major cations and anions were analyzed using ion chromatography [19], nutrients (i.e., NO3−, NH4+, PO43−, and H4SiO4) by a Skalar SAN++ nutrient analyzer using methods provided by the manufacturer, and δ18O and δD using a Picarro liquid water isotope analyzer. The bicarbonate concentrations were determined by balancing the measured anion equivalents with the measured cation equivalents as demonstrated by Welch et al. [19].
Samples were analyzed for δ18O and δD using a Picarro Wavelength Scanned-Cavity Ring Down Spectroscopy Analyzer for Isotopic Water-Model L1102-i for δ18O and δD. Samples were pipetted into 2 mL vials and 2 μL were extracted to determine the isotopic δ18O and δD composition of each sample. Seven injections were made for each sample and an average of the last four analyses was calculated to determine isotopic composition to avoid memory effects of previous samples. Duplicates were run for every tenth sample to ensure machine accuracy. Samples were compared to international and internal standards as a means of correcting raw data. Rotating selected standards were run every fifth sample. Standards included VSMOW (δ18O = 0‰; δD = 0‰), and rainfall from Colorado (δ18O = −16.53‰; δD = −126.3‰), Nevada (δ18O = −14.20‰; δD = −104.80‰), Ohio (δ18O = −8.99‰; δD = −61.80‰), and Florida (δ18O = −2.09‰; δD = −9.69‰).
Following raw data collection, the four final injections of each sample were averaged and corrected based on the equation of the trend line of measured standards to known values. Measured standard values were checked for accuracy in comparison to known standard values to ensure accuracy in data measurements (2‰ for δ18O and 10‰ for δD). Values were then recorded as per mil values (‰) for the precipitation’s isotopic signature. Duplicate measurements of three ice samples yielded a mean error of 0.06‰ for δ18O and 0.3‰ for δD.
Blanks for ions and nutrients were created by the addition of our best quality deionized water (18 MΩ) into the same kind of plastic bags used for sample location and melting in order to ascertain if there were any sample contamination during storage and filtration. All blanks were below the detections limits of the methods. Details on the accuracy and precision of our analyses are in Appendix A.
3. Results
The glaciochemical data from the vertical profiles of both Paradana and Snežna Caves are shown in Table 1. Some general statements can be made regarding these data. In Paradana Cave the following trends were observed: for anions, HCO3− >> Cl− = SO42−; for cations, Ca2+ >> Na+ = Mg2+ = K+; H4SiO4 < 1.0 μM; DIN (NO3− + NH4+):PO43− = 104:1; average δ18O = −10.1‰, and the range was −8.5 to −13.4‰. For Snežna Cave the following trends were observed: for anions, HCO3− >> SO42− ≥ Cl; for cations, Ca2+ >> Na+ = Mg2+ > K+; H4SiO4 ≤ 1.1 μM; DIN (NO3− + NH4+):PO43− = 115:1; average δ18O = −10.1‰, and the range was −10.5 to −9.9‰.

Table 1.
Measured concentrations of major ions in Paradana Cave and Snežna Cave ice cave samples in μM. Values in green represent values calculated using model described in the text.
We have plotted the ion data against one another (Figure 4). In general, the Cl− and K+ follow the Na+, and the Mg2+ follows the Ca+, but the relationships are not consistent and the relationships also show much scatter. There are no relationships observed between Ca+ and Na+ nor between NO3− and Cl−. Three of the ice samples have NO3− concentrations > 40 μM but why these are higher than the others is unclear. Perhaps the precipitation entered the caves during a time when nitrate is more mobile.
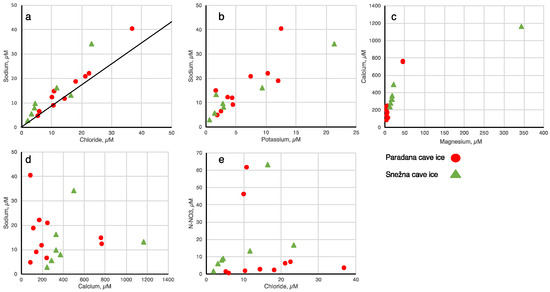
Figure 4.
Scatter plots of major ions in cave ice. The Paradana ice samples are shown as red circles and the Snežna ice samples are shown as green triangles. In a, the line shown is the Na:Cl ratio for seawater. (a) sodium versus chloride, (b) sodium versus potassium, (c) calcium versus magnesium, (d) sodium versus calcium, (e) nitrate versus chloride.
Vertical profiles of δ18O in the ice caves are shown in Figure 5. Vertical profiles of deuterium in the samples are similar to the δ18O profiles plotted. The error bars for the samples are smaller than the symbol size.
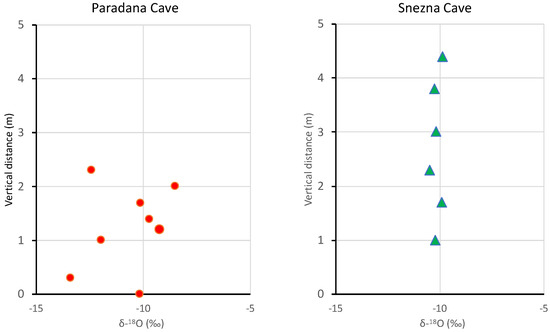
Figure 5.
Vertical profiles of δ18O in cave ice in Paradana Cave and Snežna Cave. The error bars for the samples are smaller than the symbol size.
The δD and δ18O of all ice samples fall close to the regional meteoric water line (Figure 6). If the one point from the Snežna Cave ice falling farthest below the line is ignored, a line of slightly shallower slope could be produced. This may suggest a small evaporative loss of lighter isotopes may have occurred. The regional meteoric water line shown in the figure was developed from analyses of deuterium and oxygen-18 from 449 GNIP samples that had been collected during 1981–2010 at Ljubljana [20], during 2000–2006 in Portorož [21], and during 2000–2003 in Kozina [22]. The regional meteoric water line is described by the equation of δD = 7.9*δ18O + 9 (r2 = 0.97) and is very similar to the global meteoric water line of δD = 8*δ18O + 10 [23]. Isotope data measured in Sava River runoff at high elevations in Slovenia have measured values of −63 to −69‰ and −9.7 to −10.4‰ for δD and 18O, respectively [24].
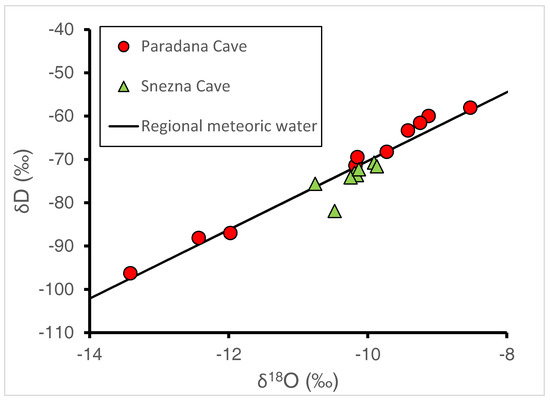
Figure 6.
Plot of δD and δ18O of ice samples from Paradana Cave and Snežna Cave plotted with the regional meteoric water line developed from GNIP samples collected in Ljubljana [20], Portorož [21], and Kozina [22].
4. Discussion
Of the other investigations of the major element glaciochemistry of cave ice, all have Ca2+ as the major cation and where measured, have Na:Cl ratios close to marine aerosol derived values [12,13,14], reflecting the importance of CaCO3 dissolution and the importance of the initial precipitation chemistry in its chemical evolution. Kern and Persoiu [2] posited that the geochemistry of cave ice should reflect the chemistry of the initial precipitation and the addition of chemical weathering products, and other material (probably biological in origin) leached from the vadose zone or transported by surface sediment and water flows, suggesting perhaps that annual and even seasonal signals might be recorded in the ice. Previous work on the glaciochemistry of ice caves has demonstrated that the ice can form in numerous ways, including the conversion of snow directly to ice, the freezing of infiltrated water, the refreezing of previous melt, and even from the freezing of cave water vapor [8,14,25]. The geochemistry of the ice in these caves clearly demonstrates the addition of some constituents above the composition of the primary precipitation in the region. This is particularly true for the Ca2+ and K+ where the mean precipitation values at Rateče in NW Slovenia are 7.4 and 0.9 μM, respectively [24]. All of the cave ice samples have at least double, if not much higher, (67×) the amount of Ca2+ than the precipitation. Only one ice sample has a K+ concentration similar to that of the precipitation (Table 1). There is a long record of precipitation chemistry for the region [25] from data for 2003–2011 in Rateče, a town in the Julian Alps north of Paradana Cave, west of Snežna. The data are from wet deposition only and are volume-weighted. We have utilized the mean concentrations over that time period in our discussion, even though for most constituents there has been a downward trend in concentrations over the time period [26]. The other potential source of the excess Ca2+ and K+ in this ice is from the input of “dust” directly into the ice or to the original snow before it was converted to ice. So an alternate hypothesis to the one we put forward here is that snow has been converted to ice without going through a melting stage with a large addition of CaCO3 to the snow as it resides within the cave.
We have developed a conceptual model to test this idea. We are assuming in this model that the ice was formed from the re-freezing of the infiltrating water. We have assumed that all the Cl− present in the ice samples is from precipitation and for any values above the mean precipitation value of Cl− we assume that the Cl− has been concentrated by evaporation or plant transpiration. Those concentration factors (Cl−ice:Cl−precip) can be used to calculate what the concentration of the other major constituents of the ice should be by multiplying the mean precipitation value by the concentration factor of each solute. These expected values can then be compared to the actual values that we determine for each ice samples. All these are shown in Table 1.
With the exceptions of Ca2+ and HCO3−, it is extraordinary how well this simple model predicts the ice concentrations of the major ions. In fact, the predicted values for Na+ and Mg2+ in Paradana Cave are essentially the same as the measured values. The very low H4SiO4 in the ice also probably reflects the local precipitation, as the landscapes are dominated by limestones. Paradana Cave shows lower concentrations of SO42− relative to the model, while some samples in Snežna Cave show slight variations but the predicted values are very similar to the measured ones. For a few samples, the model predicts slightly higher K+ values compared to those observed; there is a loss of the fixed nitrogen compounds, NO3− and NH4+, compared to the model predictions. We attribute the K+ increases over model predictions and the ΣDIN losses to biological processes occurring in the vadose zone. Clearly, the much greater measured Ca2+ (and HCO3−) compared to model predictions are due to the dissolution of CaCO3 minerals in the unsaturated zone. The important conclusion from this exercise is that the wall ice sampled does indeed represent the local mean precipitation but with the loss of nitrogen and the gain of Ca2+ and HCO3− through the neutralization of the low pH precipitation along with the subsequent dissolution of CaCO3. The closeness of nearly all the isotopic analyses for the ice samples to the regional meteoric water line supports this conclusion that the ice represents the local mean precipitation, too.
In addition to the glaciochemistry presented in Table 1, we also analyzed the chemistry of small pools of water that were produced, in part, by water dripping onto the horizontal ice which serves as the floor of the cave. These pools lay in small-volume indentations suggesting that the water sampled was probably a combination of water dripping from the ceiling of the caves with some ice melted from the floor. The Cl−, SO42−, NH4+, Na+, and K+ data (Table 1) are similar to the vertical ice samples from each cave, respectively. However, the Ca2+ and HCO3− values were all higher than one sample, suggesting more direct interaction with the vadose zone materials than the ice bodies. The NO3− concentrations were also higher, perhaps indicating that during the warm parts of the year (when these samples were collected), the flow of karst water through the ceiling of the cave system is more active in chemical weathering and allows for the saturation of the biological system with fixed N so there is more N present in the vadose zone. If these assumptions are true, the horizontal ice may represent formation during these months, rather than direct deposition of winter snow. An alternate interpretation is that in the winter, as these drip-water ponds freeze, CaCO3 precipitates due to the lower pCO2 concentrations in the cave air as observed by Huang et al. [27] in caves in Italy. Calcium carbonate minerals could also form by freezing of drip pond water, thereby concentrating solutes in the remaining liquid until precipitation occurs [28]. Although we cannot rule out these mechanisms a priori, it would seem that in the case of these ice deposits, the precipitated CaCO3 would be preserved in the ice as particulate material. Upon the thawing of the ice, it is possible that such particles could be removed via our filtration if the particles were larger than 0.45 μm in size; however, some or all could be re-dissolved as the ice is melted. We did not directly observe calcium carbonate in any of the ice samples. This particular issue requires more research as it has great bearing on the relationship of the melt pools to the vertical ice walls and an interpretation of singular or multiple processes of ice formation.
The Hubelj Spring (elevation 220 m; Figure 1) represents an integration of the karst region that drains Paradana Cave and it has d-excess of ~2.7‰ higher than the cave ice (Table 2). These more enriched d-excesses probably indicate some refreezing of the original precipitation, as noted in several other ice cave studies (e.g., [2,8,26]). The δ18O profiles of the vertical ice are different for the two caves. Paradana Cave shows a distinct sawtooth variation while Snežna Cave ice is essentially iso-isotopic at −10.15‰ ± 0.22‰ (Figure 5). This mean value is very similar to the value from the uppermost 2–3 cm of the cave’s horizontal floor of −10.15‰, while the melt pool on the floor was slightly more depleted, at −10.76‰. This uniform pattern of isotopic composition is a bit perplexing but it could indicate that the entire profile originated from a water mass of relatively constant isotopic composition or at least one whose composition was modified in a similar manner. Given this similar isotopic and glaciochemical signal, it is difficult to assess the age and paleoclimatic value of the profile.
Table 2.
δ18O and d-excess from our samples and from published data.
The sawtooth pattern observed in Paradana Cave is similar to what Persoiu and others [8] noted in Scărisoara Cave ice in Romania where they described an alternation of the primary isotopic signal during a season of the freezing process. Their results are consistent with downward freezing of water to ice in a pool, whereas the most depleted δ18O values represent the last freezing of what Persoiu et al. [8] term “lake ice”, and the enriched value in the sawtooth pattern represents “floor ice”. So, this profile forms a series of seasonal signals with lake ice forming in the autumn after the accumulation of water in the summer and floor ice forming during the winter [30]. If this interpretation is correct, the Paradana Cave 2.5-m ice profile (Figure 3) represents at least four years. However, because of our sampling interval, we may have missed years, resulting in a discontinuous record. Thus this 4 years is a conservative age estimate at best. Clearly, there is potential to reconstruct environmental records going back in time as suggested for other ice caves around the world [9,11,14,26].
5. Conclusions
We have analyzed the glaciochemistry of two ice cave profiles in Slovenia: in Paradana and Snežna Caves. This is one of the very few studies of high-mountain karst cave ice where major cations, anions, and nutrients have all been determined. The major ion and nutrient concentrations strongly suggest that the ice originates from local precipitation that has been modified by the addition of Ca2+ and HCO3− either from the dissolution of the local karst bedrock or the input of CaCO3-rich dust into the original snow. However, the loss of ΣDIN suggests that water moved through the vadose zone. The isotopic profiles of the Paradana Cave ice are similar to what has been previously described in other ice caves in central and eastern Europe, where the profiles are developed through the freezing of cave pool or “lake” waters from the top downward during the onset of the cold portion of the year [30]. Given the extent of the Paradana Cave ice, further work could possibly yield a long-term paleo-environmental record for this location.
Author Contributions
Writing–original draft, writing–review & editing, A.C.; project administration, M.Z.; investigation, J.T. and M.L.; supervision, B.K.; data curation and formal analysis, S.W. and D.S.; writing—original draft and funding acquisition, W.L.
Funding
The Ohio State University’s Slovene Research Initiative provided partial support to A.C. and W.L. to visit Slovenia. Support for acquisition of laboratory instrumentation used for geochemical analyses came from NSF GEO EAR IF 0744166, 0930016, and 1342632. Partial support for the fieldwork came from research program no. P6-0101 of the Slovenian Research Agency.
Acknowledgments
We thank Manca Volk Bahun for producing the map of the sampling areas.
Conflicts of Interest
The authors declare no conflict of interest. The funders had no role in the design of the study; in the collection, analyses, or interpretation of data; in the writing of the manuscript, or in the decision to publish the results.
Appendix A
Accuracy and precision data for the Slovenia Ice Cave Samples
Accuracy and precision of IC analysis are routinely checked by comparison to a USGS inter-laboratory check sample and Spex CertiPrep IC Instrument check standards that have been diluted 100-fold before analysis and by analysis of replicate samples and standards within the same run. Precision was determined from the percent difference for replicate standards and samples analyzed within the same run. In general precision for replicates is within 5%, often within 1%, although variability can be larger for ion concentrations close to the detection limits or when there is an incomplete separation of peaks within the chromatograms.
Table A1.
Comparison of most probably values for a USGS inter laboratory sample with our calculated values based on SPEX standards.
Table A1.
Comparison of most probably values for a USGS inter laboratory sample with our calculated values based on SPEX standards.
| USGS | SPEX | % Difference | |
|---|---|---|---|
| F | −4.50 | 3.86 | 0.2–3 |
| Cl | −1.99 | 1.26 | 0.2–0.9 |
| Br | n/a | −0.21 | 1.4–4 |
| N-NO3 | n/a | −6.88 | 1.3–5 |
| SO4 | 4.38 | 0.19 | 1–6.4 |
| Na | −6.75 | 1.33 | 3.9–5.4 |
| K | −5.00 | 4.09 | 3.0–3.9 |
| Mg | −5.02 | −8.70 | 2.1–9.5 |
| Ca | 1.02 | −4.89 | 2.7–8.8 |
n/a means not analyzed.
Accuracy and precision for nutrient analysis were determined by comparing concentrations from standards made from different stock solutions and by comparing replicate analysis for samples and standards analyzed within the same run. Differences between replicates or standards ranged from 0.8 to 1.1% for Si, 0.5 to 0.8% for NO2− + NO3−, 0.2 to 7.7% for PO43−, and 2.0 to 9.1% for NH4+.
References
- Perşoiu, A.; Lauritzen, S.-E. (Eds.) ICE Caves; Elsevier: Amsterdam, The Netherlands, 2018; ISBN 978-0-12-811739-2. [Google Scholar]
- Kern, Z.; Persiou, A. Cave ice—The imminent loss of untapped mid-latitude cryospheric palæoenvironmental archives. Quat. Sci. Rev. 2013, 67, 1–7. [Google Scholar] [CrossRef]
- Perşoiu, A.; Onac, B.P. Ice in Caves. In Encyclopedia of Caves; White, W.B., Culver, D.C., Eds.; Academic Press: Waltham, MA, USA, 2012; pp. 399–404. ISBN 978-0-12-383832-2. [Google Scholar]
- Gómez-Lende, M.; Serrano, E.; Bordehore, L.J.; Sandoval, S. The role of GPR techniques in determining cave properties: Peña castil ice cave, Picos de Europa. Earth Surf. Proc. Landf. 2016, 41, 2177–2190. [Google Scholar] [CrossRef]
- Dobinski, W. Permafrost. Earth Sci. Rev. 2011, 108, 158–169. [Google Scholar] [CrossRef]
- Luetscher, M.; Jeannin, P.-Y.; Haeberli, W. Ice caves as an indicator of winter climate evolution: A case study from the Jura Mountains. Holocene 2005, 15, 982–993. [Google Scholar] [CrossRef]
- Colucci, R.R.; Fontana, D.; Forte, E.; Potleca, M.; Gugliemin, M. Response of ice caves to weather extremes in the southeastern Alps, Europe. Geomorphology 2016, 261, 1–11. [Google Scholar] [CrossRef]
- Perşoiu, A.; Onac, B.P.; Wynn, J.; Bojar, A.-V.; Holmgren, K. Stable isotope behavior during cave ice formation by water freezing in Scarisoara Ice Cave, Romania. J. Geophys. Res. 2011, 116, 1–8. [Google Scholar] [CrossRef]
- Kern, Z.; Fórizs, I.; Pavuza, R.; Molnár, M.; Nagy, B. Isotope hydrological studies of the perennial ice deposit of Saarhalle, Mammuthöle, Dachstein Mts., Austria. Cryosphere 2011, 5, 291–298. [Google Scholar] [CrossRef]
- Kern, Z.; Széles, E.; Horvatinčić, N.; Fórizs, I.; Bočić, N.; Nagy, B. Glaciochemical investigations of the ice deposit of Vukušić Ice Cave, Velebit Mountain, Croatia. Cryosphere 2011, 5, 485–494. [Google Scholar] [CrossRef]
- Citterio, M.; Turri, S.; Bini, A.; Maggi, V. Observed trends in the chemical composition, δ18O and crystal sizes vs. depth in the first ice core from the LoLc 1650 “Abisso sul Marine dell’Alto Bregai” ice cave (Lecco, Italy). Theor. Appl. Karstol. 2004, 17, 45–50. [Google Scholar]
- Citterio, M.; Turri, S.; Bini, A.; Maggi, V.; Pelfini, M.; Pini, R.; Ravazzi, C.; Santilli, M.; Stenni, B.; Udisti, R. Multidisciplinary approach to the study of the Lo Lc 1650 “Abisso sul Margin dell’Alto Bregai” ice cave (Lecco, Italy). Theor. Appl. Karstol. 2004, 17, 27–44. [Google Scholar]
- Clausen, H.B.; Hansen, S.B.; Laresen, L.B.; Siggaard-Andersen, M.L.; Sjolte, J.; Lundholm, S.C.; Vrana, K.; Baker, J. Continental ice body in Dobsina Ice Cave (Slovakia)—Part II—Results of chemical and isotopic study. In Proceedings of the 2nd International Workshop on Ice Caves, Demänovská Dolina, Slovak, 8–12 May 2006; Zelinka, J., Ed.; Knižné Centrum: Žilina, Slovakia, 2007; pp. 29–37. [Google Scholar]
- Munroe, J.S.; O’Keefe, S.S.; Gorin, A.L. Chronology, stable isotopes, and glaciochemistry of perennial ice in Strickler Cavern, Idaho, USA. GSA Bull. 2018, 130, 175–192. [Google Scholar] [CrossRef]
- Mihevc, A. Ice caves in Slovenia. In ICE Caves; Perşoiu, A., Lauritzen, S.-E., Eds.; Elsevier: Amsterdam, The Netherlands, 2018; pp. 691–703. [Google Scholar] [CrossRef]
- Mihevc, A. Distribution and characteristics of ice caves in Slovenia. In Proceedings of the 3rd International Workshop on Ice Caves, Berchtesgaden, Germany, 11 November 2007; Turri, S., Ed.; State University: Perm, Russia, 2008; pp. 61–64. [Google Scholar]
- Hauselmann, P.; Mihevc, A.; Pruner, P.; Horáček, I.; Čermák, S.; Hercman, H.; Sahy, D.; Fiebig, M.; Zupan Hajna, N.; Bosak, P. Snežna jama (Slovenia): Interdisciplinary dating of cave sediments and implication for landscape evolution. Geomorphology 2015, 247, 10–24. [Google Scholar] [CrossRef] [PubMed]
- Welch, K.A.; Lyons, W.B.; Graham, E.; Neumann, K.; Thomas, J.M.; Mikesell, D. Determination of major element chemistry in terrestrial waters from Antarctica by ion chromatography. J. Chromatogr. A 1996, 739, 257–265. [Google Scholar] [CrossRef]
- Welch, K.A.; Lyons, W.B.; Whisner, C.; Gardner, C.B.; Gooseff, M.N.; McKnight, D.M.; Priscu, J.C. Spatial variations in the geochemistry of glacial meltwater streams in the Taylor Valley, Antarctica. Antarc. Sci. 2010, 22, 662–672. [Google Scholar] [CrossRef]
- Vreča, P.; Krajcar Bronić, I.; Leis, A.; Demšar, M. Isotopic composition of precipitation at the station Ljubljana (Reaktor), Slovenia-period 2007–2010. Geologija 2014, 57, 217–230. [Google Scholar] [CrossRef]
- Vreča, P.; Krajcar Bronić, I.; Leis, A. Isotopic composition of precipitation in Portorož (Slovenia). Geologija 2011, 54, 129–138. [Google Scholar] [CrossRef]
- Vreča, P.; Brenčič, M.; Leis, A. Comparison of monthly and daily isotopic composition of precipitation in the coastal area of Slovenia. Isotopes Environ. Health Stud. 2007, 43, 307–321. [Google Scholar] [CrossRef]
- Craig, H. Isotopic variations in meteoric waters. Science 1961, 133, 1702–1703. [Google Scholar] [CrossRef]
- Ogrinc, N.; Kanduč, T.; Stichler, W.; Vreča, P. Spatial and seasonal variations in δ18O and δD values in the River Sava in Slovenia. J. Hydrol. 2008, 359, 303–312. [Google Scholar] [CrossRef]
- Yonge, C.J.; MacDonald, W.D. The potential of perennial cave ice in isotope palaeoclimatology. Boreas 1999, 28, 357–362. [Google Scholar] [CrossRef]
- Muri, G. Atmospheric deposition chemistry in a subalpine area of the Julian Alps, North-West Slovenia. J. Limnol. 2013, 72, 291–300. [Google Scholar] [CrossRef]
- Huang, U.; Fairchild, I.J.; Borsato, A.; Frisia, S.; Cassidy, N.J.; McDermott, F.; Hawkesworth, C.J. Seasonal variations in Sr, Mg, and P in modern speleothems (Grotta di Ernesto, Italy). Chem. Geol. 2001, 175, 429–448. [Google Scholar] [CrossRef]
- Žák, K.; Onac, B.P.; Kadebskaya, O.I.; Filippi, M.; Dublyansky, Y.; Luetscher, M. Cryogenic mineral formation in caves. In ICE Caves; Elsevier: Amsterdam, The Netherlands, 2018; pp. 123–162. [Google Scholar] [CrossRef]
- Vreča, P.; Malenšek, N. Slovenian network of isotopes in precipitation (SLONIP)—A review of activities in the period 1981–2015. Geologija 2016, 59, 67–84. [Google Scholar] [CrossRef]
- Perşoiu, A.; Pazdur, A. Ice genesis and its long-term mass balance and dynamics in Scarisoara Ice Cave, Romania. Cryosphere 2011, 5, 45–53. [Google Scholar] [CrossRef]


© 2019 by the authors. Licensee MDPI, Basel, Switzerland. This article is an open access article distributed under the terms and conditions of the Creative Commons Attribution (CC BY) license (http://creativecommons.org/licenses/by/4.0/).