Abstract
The Viimsi peninsula is located north-east of Tallinn, capital of Estonia. The Cambrian-Vendian (Cm-V) aquifer system is a sole source of drinking water in the area. Historically, the groundwater exploitation has led to freshening of groundwater in the peninsula, but in recent years an increase in chloride concentrations and enrichment in δ18O values has been detected, but in recent years hydrochemical parameters indicate an increasing influence of a saline water source. The exact origin of this saline water has remained unclear. The aim of the current study is to elucidate whether the increase in Cl− concentrations is related to seawater intrusion or to the infiltration of saline water from the underlying crystalline basement. To identify the source of salinity, chemical composition of the groundwater and the isotope tracers (e.g., δ18O and radium isotopes) were studied in the Viimsi peninsula in the period from 1987 to 2018. Our results show that chemical composition of Cm-V groundwater in the peninsula is clearly controlled by three-component mixing between glacial palaeogroundwater, saline water from the underling crystalline basement and modern meteoric water. The concentrations of Ra are also significantly affected by the mixing, but the spatial variation of radium isotopes (226Ra and 228Ra) suggests the widespread occurrence of the U in the surrounding sedimentary sequence. Our hypothesis is that, in addition to U originating from the crystalline basement, some U could be associated with secondary U deposits in sedimentary rocks. The formation of these secondary U deposits could be related to glacial meltwater intrusion in the Pleistocene. Although the results suggest that the infiltration of saline groundwater from the underlying crystalline basement as the main source of salinity in the study area, the risk of seawater intrusion in the future cannot be ruled out. It needs to be highlighted that the present groundwater monitoring networks may not be precise enough to detect the potential seawater intrusion and subsequent changes in water quality of the Cm-V aquifer system in the Viimsi peninsula.
1. Introduction
The growing urbanisation in coastal areas rises the demand for water; an increase in groundwater abstraction can lead to a subsequent lowering of groundwater levels and deterioration in groundwater quality. One of the reasons for decline in water quality is groundwater salinisation through intrusion of seawater or relict saline groundwater from adjacent aquifers [1,2,3,4,5,6]. These processes could initiate chemical reactions between the aquifer-forming rocks and groundwater, when the composition of groundwater is changed by mixing between the intruding saltwater and fresh groundwater originally occupying a coastal aquifer [6,7,8]. The geochemical properties of rocks could determine the dominant chemical processes during mixing [6,9,10,11]. Clay minerals and organic matter can adsorb/desorb cations while dissolution/precipitation processes can occur in case carbonate minerals are present in the aquifer matrix [2,12,13,14,15,16,17].
Although Viimsi peninsula is next to an urbanised area, local infrastructure has stayed relatively isolated and the community uses groundwater for water supply. During the last decade, that population has tripled, due to active real estate development and is now 19,000 with a prospect of soon reaching 30,000 inhabitants. For its drinking water, the region relies on just one aquifer system, the Cambrian-Vendian (Cm-V). The groundwater from the Cm-V aquifer system in North Estonia is typically strongly depleted in 18O (δ18O= −18 to −23‰) [18] with respect to local shallow groundwater (−11 to −12.5‰) [19]. The Cm-V groundwater originates from glacial meltwater of the Scandinavian Ice Sheet that covered the territory of Estonia during the Pleistocene [20,21]. Thus, the aquifer system contains groundwater that is essentially non-renewable on a human timescale and the quality of which can be strongly altered during groundwater abstraction.
In the past 60 years, the Cm-V aquifer system has extensively been used for public water supply on the Viimsi peninsula. Such groundwater exploitation led to the drawdown of hydraulic heads about 15 metres below the pre-development levels [22,23] and caused freshening of groundwater in the south-western part of the peninsula, where an ancient buried valley cuts through the aquitard confining the aquifer system. Modern meteoric waters can enter the Cm-V aquifer system through this pathway once groundwater abstraction reduces the piezometric levels in the aquifer system. In the past 25 years, the groundwater consumption has decreased and piezometric levels have slowly recovered, but the recent rapid increase in population on the peninsula has once again raised groundwater consumption. The new decrease in the piezometric levels has led to an increase in salinity in the deeper part of the aquifer system. This is exemplified by the rise in chloride concentrations and enrichment in stable oxygen isotope composition [24]. The exact origin of the saline water entering the aquifer system has remained unclear. Suursoo et al. [24] suggested three possible origins for the increased salinity in the aquifer system: (1) Seawater intrusion through the aquifer’s discharge area in the Gulf of Finland; (2) intrusion of relict saline water from the underlying crystalline aquifer and (3) combination of the former two.
Suursoo et al. [24] also observed that changes in salinity were related to changes in the activity of Ra isotopes in groundwater. Radium activity in the Cm-V aquifer system has been attributed to the prolonged contact with radioactive rocks of the crystalline basement [25,26,27], where higher concentrations of Ra precursors, U and Th have been observed. However, several studies [28,29,30] have indicated that the behaviour of Ra is complicated and affected not only by the content of U and Th in the aquifer-forming rocks, but also by geochemical processes in the vicinity of Ra sources. Radium forms bivalent cations (Ra2+) in natural environments under low salinity conditions that behave similarly to other divalent alkaline-earth cations, such as Ca2+ and Mg2+ [31]. Thus, adsorption/desorption processes are significant mobility controllers of Ra isotopes in groundwater, because Ra has to compete for adsorption sites with other divalent cations, known as the “competing ion effect” [30,32,33,34,35]. Furthermore, Ra may form low-solubility complexes with sulphates and carbonates, and thus be precipitate from the solution [28,36,37,38].
The previous study on the same topic by Suursoo et al. [24] was based on a limited number of samples from the central part of the Viimsi peninsula. This contribution relies on a broader dataset have been collected from a much wider area of the peninsula. In our analysis, both previously published and unpublished data collected in the period from 1987 to 2018 have been used. This enabled us to study the effects that previous increases in groundwater abstraction have had on the chemical and isotopic composition of groundwater in the study area. Our main aim was to elucidate whether the current increase in Cl− concentration observed in the peninsula at present was related to seawater intrusion or rather to the intrusion of saline water from the underlying crystalline basement. The study also looked more specifically at the mechanisms of Ra mobilisation in the aquifer system. The aim was to clarify whether the Ra isotope activities could offer further insights into processes that have influenced the changes in groundwater quality in the Viimsi peninsula.
2. Geology and Hydrogeological Setting
The Viimsi peninsula is in northern Estonia, next to the republic’s capital, Tallinn (Figure 1a). The surface area of the peninsula is about 50 km2. The landscape is flat, covered with glacial and marine deposits from the Quaternary Period. Except for the southern part of the peninsula that is underlain by Ordovician carbonate rocks, Quaternary deposits lie directly on Lower Cambrian clays and clay stones (the Lükati-Lontova regional aquitard) with a thickness of ~40 m (Figure 1b). This formation confines the underlying Cm-V aquifer system, which is the only major aquifer system in the study area. The Cm-V aquifer system contains groundwater with low TDS that has the most depleted isotopic composition recorded in Europe (δ18O values from −18.5‰ to −23%), whereas the δ18O values of the modern groundwater range from −11 to −12.5‰ [18,19,20].
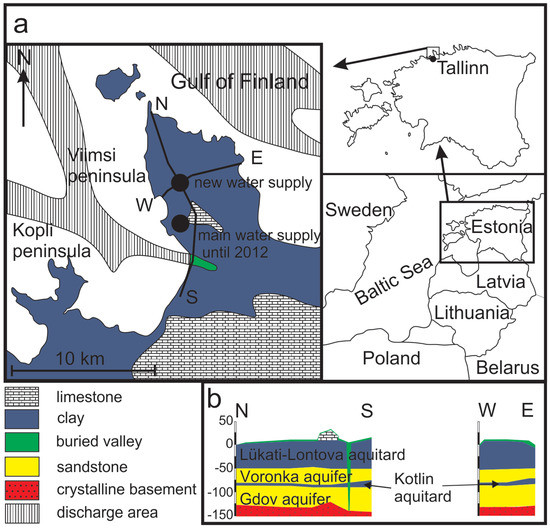
Figure 1.
Geological scheme and location of the Viimsi peninsula in Estonia (a), the west-east and the north–south cross-sections of the peninsula (b) (modified after Suursoo et al. [24]).
The water-bearing rocks of the Cm-V aquifer consist of ~70 m thick formation of silt- and sandstones of the Ediacaran age. These formations outcrop 1 to 3 km north of the peninsula coastline, at the bottom of the Gulf of Finland (Figure 1). Although the aquifer system is well confined from the intrusion of modern meteoric water and surface pollution by the 40 m thick Lontova-Lükati aquitard, the latter is cut through by deep pre-Quaternary buried valley filled with Quaternary sediments in the south-western margin of the peninsula. Here, the aquifer system is exposed to groundwater recharge from the modern meteoric water (Figure 1).
Although a clear aquitard layer is lacking inside the Cm-V aquifer system in the peninsula, it is possible to distinguish between two stipulated aquifers–the upper Voronka (V2vr) and the lower Gdov aquifer (V2gd) (Figure 1b). Lenses of a metre or two thick siltstones of low permeability inside the aquifer-forming rocks could be considered a conditional aquitard (the Kotlin aquitard) between the two aquifers. The Voronka aquifer is in the sandstones of the Lower-Cambrian (Lontova Formation) and Ediacaran ages. The Gdov aquifer is hosted by underlying sand- and siltstones of the Ediacaran age. Transmissivity between the aquifers varies, being from 40 to 1,950 m2·d−1 in the Gdov and only from 26 to 330 m2·d−1 in the Voronka aquifer [39].
The aquifers have a similar hydraulic head, but the chemical composition of the deeper and shallower parts of the aquifer system are fundamentally different. Groundwater in the Gdov aquifer is typically more saline than groundwater in the upper Voronka aquifer (TDS concentrations of 700 mg·L−1 and 200 mg·L−1, respectively) [24]. Variability in δ18O values is from −12 to −22.5‰ in the Gdov and ‒20 ± 0.5‰ in the Voronka aquifer. Additionally, elevated radionuclide contents (mainly 226Ra activity) have been detected in the Gdov aquifer [24].
The Cm-V aquifer system lies on the weathered and fractured crystalline basement, which is composed of metamorphosed mafic rocks and alumino-gneisses [40,41], and forms the so-called crystalline basement aquifer. The information about the water in this aquifer is scarce, but available data show that it contains Na-Cl or Ca-Cl type brackish and saline groundwater with electrical conductivity from 2 to 20 mS·cm−1 [25,42]. Several studies [21,24,42] have shown that the Cm-V aquifer system and the underlying crystalline basement aquifer are hydraulically connected and the hydrochemistry in the deeper Gdov aquifer system is influenced by saline water in the crystalline basement aquifer.
Groundwater abstraction on the Viimsi peninsula started in the early 1960s and groundwater consumption increased constantly until the beginning of 1990s. By 1991, the piezometric heads in the Cm-V aquifer system had decreased to −7 to −8 m b.s.l. and in the southern part of the peninsula occasionally even to −16 m b.s.l. Since 1994, when groundwater consumption started to decrease, and the hydraulic heads slowly recovered. This process proceeded more swiftly in the deeper-lying Gdov aquifer [43]. During the period after 1994, the groundwater was pumped from the wells which were scattered mainly over the south-western part of the peninsula. In 2012, a new water-supply station was opened, and the groundwater consumption was concentrated to 11 wells in the central part of the peninsula (Figure 1).
3. Material and Methods
In total, 91 groundwater samples were collected from 53 private and municipal water supply wells in 2011 and 2016 (Table 1) to be analysed for hydrochemical composition and for stable isotopes of water and radium. The wells in the main groundwater intake were sampled only in their active production stage to ensure that the wells were pumped at least 2 to 3 volumes before sampling.

Table 1.
Chemical composition of the Cm-V groundwaters in the Viimsi peninsula. Bdl-below detection limit. Previously published data is referred to as: 1—Yezhova et al. [46]; 2—Savitskaja et al. [47]; 3—Savitskaja and Viigand [25]; 4—Vaikmäe et al. [20]; 5—Raidla et al. [18]; 6—Raidla et al. [21]; 7—Raidla et al. [48]; 8—Suursoo et al. [24].
Samples for hydrochemical analysis were filtered through a 0.45-μm filter and cation samples were acidified to pH ∼2 to 3 using nitric acid. Major and minor ion concentrations were measured using DIONEX ICS-1100 ion chromatograph (manufacturer Thermo Fisher Scientific, USA) in Tallinn University of Technology (TalTech). The analytical precision for major and minor ionic components was ±0.5 to 2.6% and ±1.3 to 4.3%, for cations and anions, respectively.
For Ra measurements, groundwater from a tap was taken directly into a 5 L plastic canister. Immediately after sampling, water was acidified with concentrated HNO3− to pH 1 to 2. Measurements were performed at the University of Tartu. Radium was co-precipitated with Ba(SO4)2 and then the precipitate was put into an aluminium vessel and homogenised with 5 g of epoxy resin. Epoxy was added to minimise radon (222Rn and 220Rn) leakage from the sample [44]. The samples were measured after at least 3 weeks from sample collection on a high purity germanium gamma spectrometer (coaxial type detector GEM 35200 (manufacturer E&G Ortec, USA), coaxial GCD 50200 or planar GPD 50400 (manufacturer BSI– Baltic Scientific Instruments, Latvia). The typical measurement time was about one day. 226Ra was determined according to its daughter nuclide 214Pb (gamma peaks 242.00, 295.22, 351.93 keV). 228Ra was analysed via the gamma peaks of 228Ac (338.32, 911.20, 968.96 keV). A calibration was performed with certified reference materials RGU-1 and RGTh-1 (IAEA–International Atomic Energy Agency). For that, calibration sources with similar geometry (a few grams of the reference material mixed with 5 g of epoxy resin in an aluminium vessel) were prepared and measured. Minimum detectable activity concentrations were 15 mBq·L−1 and 20 mBq·L−1 for 226Ra and 228Ra, respectively.
The unfiltered samples for stable isotope analyses were poured into 15 mL HDPE bottles and stored in a cold, dark environment. Stable hydrogen and oxygen isotope measurements were performed at the Institute for Geological and Geochemical Research in Budapest (Hungary) using the liquid water isotope analyser (LWIA), manufactured by Los Gatos Research Ltd. (LWIA-24d) and in the laboratory of mass-spectrometry in the TalTech Department of Geology using a Picarro L2120-i Isotopic Water Analyser. The δ2H and δ18O values were determined simultaneously and expressed relative to VSMOW standard in ‰. Standardisation was conducted using international and laboratory standard water samples. The precisions were better than ±1.0‰ and ±0.15‰ for hydrogen and oxygen, respectively, for samples measured in Budapest and better than ±1.0‰ and ±0.1‰ for samples measured in Tallinn.
Noble gas samples were collected into copper tubes fixed on aluminium racks [45] during two fieldwork campaigns in 2013 and 2015. These copper tubes contained about 20 g of water and were closed vacuum tight by stainless steel clamps. Noble gas contents were determined at the Institute of Environmental Physics at Heidelberg University with a GV Instruments MM 5400 mass spectrometer.
4. Results and Discussion
4.1. Mixing
The data for the isotopic, major cation and anion compositions of the sampled groundwater in the Cm-V aquifer system in the Viimsi peninsula are given in Table 1. The δ18O and δ2H values of groundwater vary from −11.7 to −22.8‰ and from −84 to −170‰, respectively, and plot close to the Global Meteoric Water Line (GMWL) (Figure 2). Chemical and isotopic composition varies both laterally and with depth. The δ18O values and Cl− concentrations of the lower Gdov aquifer are from −12 to −22.5 and 10 to 730 mg·L−1, respectively. The isotopic composition of groundwater is more uniform in the upper Voronka aquifer (δ18O ≈ −20.5‰) and Cl− content there is no higher than 80 mg·L−1.
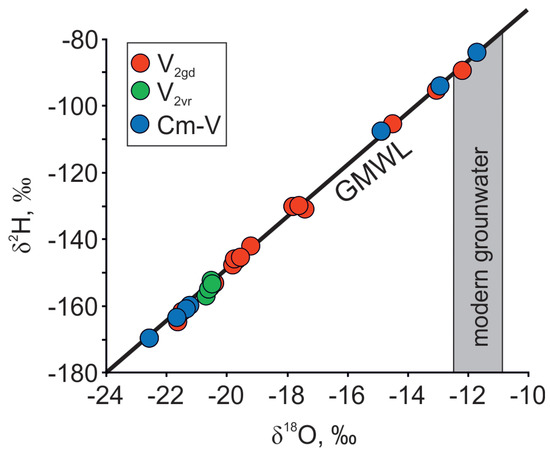
Figure 2.
δ18O and δ2H isotopic compositions of groundwater in the Cm-V aquifer system in the Viimsi peninsula. Shallow groundwater data are from Raidla et al. [19].
The changes of groundwater quality (Figure 3) in the past have been most drastic in the deeper Gdov aquifer (Figure 4). However, the changes in the isotopic composition of groundwater resulting from the changes in groundwater abstraction on the peninsula have not been similar. The spatial distribution of δ18O values from the period 1987 to 1992 (Figure 4a), when water consumption was at its maximum, is similar to the situation observed in the period from 2005 to 2009 (Figure 4c). In those periods groundwater with an isotopic composition markedly different from the baseline values of Cm-V aquifer system (δ18O values from −18.5‰ to −23%) are only observed on the south-western part of the peninsula near the deep buried valley. The spatial distribution of δ18O values in the period from 2013 to 2016 shows that the area, where the isotopic composition of groundwater has drastically changed, has grown much wider towards the central part of the peninsula, where the main groundwater intake constructed in 2012 is situated (Figure 4a–c). The main trend observed in the isotopic composition of groundwater is the increase of δ18O values in wells located closer to the buried valley in the south-western part of the peninsula (Figure 4a). Thus, the changes in the isotopic composition of groundwater could primarily be related to the recharge of modern meteoric water into the Cm-V aquifer system from the Quaternary aquifer in the buried valley. This, in turn, would lead to mixing between the intruding modern groundwater and glacial paleo-groundwater in the aquifer system.
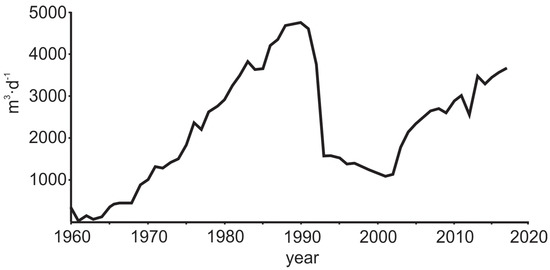
Figure 3.
Groundwater abstraction in the Viimsi peninsula from 1960 to the present.
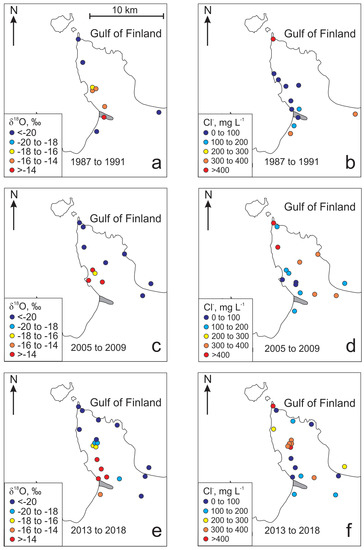
Figure 4.
Variations of δ18O and Cl− in the Gdov aquifer in the Viimsi peninsula in different periods of time.
In 1987 to 1992, a significant increase in HCO3− and SO42− concentrations is observed together with enrichment in isotopic composition (Table 1; Figure 4a). However, in recent years (from 2013 to 2016), changes in isotopic composition are mainly accompanied by increased concentration of Cl− (Table 1; Figure 4b,d,f). The increase in Cl− concentrations is accompanied by an increase in Na+ and Ca2+ concentrations and the decrease in HCO3− concentrations (Figure 5).
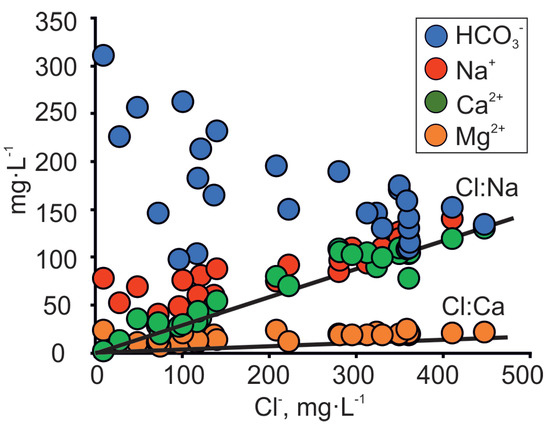
Figure 5.
Co-variance between major ions and Cl− concentration in the Cm-V groundwater of the Viimsi peninsula. Lines Cl:Na and Cl:Ca on the figure denote seawater dilution lines.
Conservative geochemical tracers, such as δ18O and Cl− indicate the mixing trend between three components (Figure 6), which is somewhat similar to the three-component mixing model proposed by Raidla et al. [18] for the Cm-V aquifer system on a regional scale. According to this model, the mixing in the Cm-V aquifer system has occurred between water originating from modern recharge, glacial meltwater that infiltrated in the Pleistocene and saline formation water. The mixing between fresh meteoric water and groundwater of glacial origin is clearly detectable, but the water with strongly depleted δ18O values has a wide variability in Cl− concentrations and the exact origin of this endmember is not clear at present. Suursoo et al. [24] proposed two sources for Cl−: The intrusion of seawater, or inflow of saline water from the underlying crystalline basement.
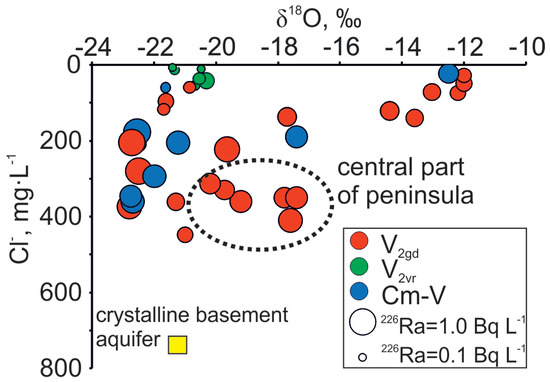
Figure 6.
Co-variance between δ18O and Cl− relation with 226Ra variations in Cm-V groundwaters of the Viimsi peninsula.
The rocks forming the Gdov aquifer outcrop under the Baltic Sea and the Na/Cl ratios of groundwater follow the seawater dilution/evaporation line (Figure 5). This makes seawater intrusion a plausible source of salinity. However, since similar Na/Cl ratios have been detected in palaeo-groundwater all over the Cm-V aquifer system [18], this is not a definite indicator of seawater intrusion in the area. Several lines of evidence suggest that the seawater intrusion cannot explain the changes observed in the chemical and isotopic composition of groundwater in the study area.
Firstly, the location of salinisation and freshening zones in the study area are uncharacteristic to seawater intrusion. Freshwater with heavier isotopic composition is found on the south-western coast of the peninsula, where the buried valley is located, but the recent rise in Cl− concentrations is observed in the central part of the peninsula, and not on the coast (Figure 4f).
Secondly, the rising salinity is accompanied by an increase in Ca2+ concentrations, but the latter are low in seawater, which is dominated by Na+ and Mg2+ [49]. The covariation between Cl− and Ca2+ values in groundwater on the Viimsi peninsula (Figure 5) suggests that the salinity increase is related to the underlying crystalline basement as the groundwater plots away from the seawater dilution line (SDL) of the Baltic Sea [50]. A similar trend in the Cl− and Ca2+ relation has been observed in the Kopli peninsula (Figure 1a), where isotopic signatures of δ18O and 14C revealed the increase in salinity by palaeogroundwater of glacial origin, which had intruded from the underlying crystalline basement [42].
It can be proposed that the three-component mixing observed in the Gdov aquifer has occurred in two stages. In natural conditions, the piezometric levels of the Cm-V aquifer system in the Viimsi area were above seawater level [51] and the aquifer contained glacial palaeogroundwater (Figure 7a). The groundwater abstraction that started in the 1960s (Figure 3) lowered the hydraulic head by several metres, the strongest impact occurring first (in 1960 to 1992) close to the buried valley, where infiltration of modern meteoric water had become the main compensation mechanism for the lowered hydraulic heads (Figure 7b). The influx of groundwater containing O2 and having higher CO2 partial pressure resulted in atypically high HCO3−, SO42− and NO3− concentrations in the Cm-V groundwater in the period from 1987 to 1991 (Table 1). In 2012, the new groundwater intake started to operate in the central part of the peninsula and the main groundwater abstraction shifted to this area (Figure 7c). The buried valley lay too far for the abstraction to be directly compensated by infiltration of modern groundwater. Thus, the upwelling of saline groundwater from the underlying crystalline basement became the dominating hydraulic head compensation mechanism, which was accompanied by an abrupt rise in Cl− and Ca2+ concentrations in groundwater. The deterioration of groundwater quality in the newly founded intake led to reopening of wells in the southern part of the peninsula. This new situation has decreased the inflow from the underlying crystalline basement aquifer and has supported the flow of modern groundwater from the buried valley to the more central parts of the peninsula (Figure 7d). Chemical and isotopic compositions of groundwater suggest that at present, the front of modern groundwater has almost reached the new groundwater intake and the wells receive groundwater from both the crystalline basement and the buried valley. As a result, Cl− concentrations have stabilised or even decreased a little and the water’s stable oxygen isotope composition has become enriched with respect to glacial palaeogroundwater which occupied the aquifer system in natural conditions. According to this reasoning, the mixing of three different water types (glacial palaeogroundwater, brackish/saline groundwater from the crystalline basement aquifer and fresh modern groundwater from the buried valley) induced by groundwater abstraction explains the changes in groundwater quality and isotopic composition observed on the Viimsi peninsula (Figure 7d).
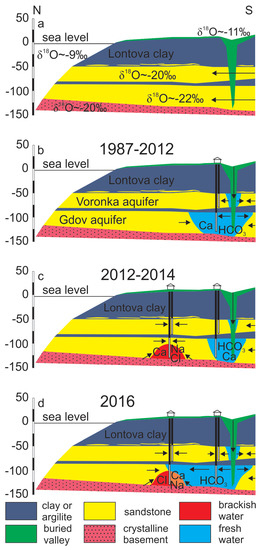
Figure 7.
A conceptual model for the formation of chemical composition of groundwater in the Cm-V aquifer system of the Viimsi peninsula.
4.2. Spatial Distribution and the Origin of Radium in Groundwater
One of the important issues that has occurred with increased abstraction and subsequent changes in the chemical composition of the groundwater in the Gdov aquifer is the rise in radium activity [24]. Activities of 226Ra and 228Ra in the Gdov aquifer of the Viimsi peninsula vary from 0.1 to 2.14 Bq·L−1 and from 0.1 to 1.12 Bq·L−1, respectively. The rise in Clˉ concentrations on the peninsula are caused by the inflow of water from the crystalline basement, as shown in the previous section. This water is brackish or saline, and typically has a higher content of radionuclides [25], because of U and Th present in the crystalline basement [52,53]. The gamma radiation well-logs also support this understanding (Appendix A). Our results show the covariance between Cl− and Ra, although the correlation with Cl− is better for 228Ra than for 226Ra (Figure 8). This observation indicates that the source of Clˉ must lie close to the sampling wells, due to relatively short half-life of 228Ra (5.75 years). By contrast, 226Ra (half-life is 1,600 years) has a wider spread from the mixing line of Ra and Cl−. This could indicate that the 226Ra origins from several sources or it has been affected by substantial geochemical changes, due to its longer residence time in groundwater.
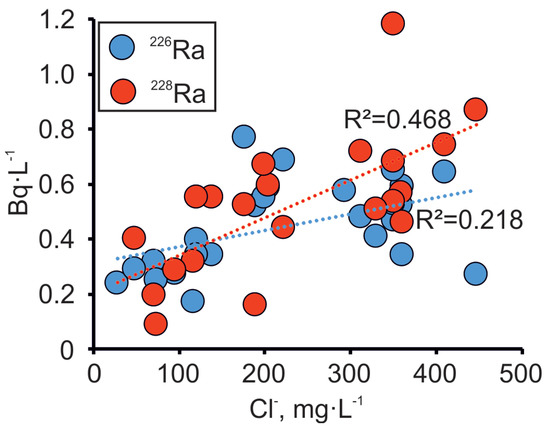
Figure 8.
Variations in the activity of Ra isotopes in dependence on Cl− concentration in the Cm-V groundwater in the Viimsi peninsula.
The clay sediments having the ability to adsorb cations [54] are more abundant in the deeper parts of the Gdov aquifer in the contact-surface between Ediacaran sandstones and the crystalline basement [54,55,56]. The increase in Cl− concentrations in the Gdov aquifer has brought about the increase in Ca2+ and Na+ concentrations (Figure 5) which can induce cation exchange [15]. In cation exchange processes, Ra behaves similarly to other divalent cations and can take part in absorption/desorption processes [57]. However, a clear inverse relationship between Ca2+ and Na+, which is indicative of absorption processes [49], is not detectable in the Gdov aquifer. Moreover, Swarzenski et al. [58] have shown that other bivalent cations (Ca2+, Mg2+) clearly prevail over Ra2+ in weakly cemented quartzose sands like Ediacaran sandstones, because the amount of rock surface where the cations could possibly be adsorbed, is smaller [30].
The second source of 226Ra could be a dissolution of carbonate cement from the aquifer matrix. 226Ra has a clear positive correlation with both the saturation index of calcite (R = 0.669) and the saturation index of disordered dolomite (R = 0.640). At the same time, 228Ra correlation with saturation indexes remains lower, 0.483 and 0.417, respectively. Chemical data from 1988 and 1991 shows anomalously high Ca2+ concentrations accompanied by increase in Mg2+ and HCO3− concentrations that were not observed in 2013 to 2016 (Table 1). Additionally, concentrations of SO42− increased and NH4+ decreased when NO3− appeared in groundwater. We interpret such changes as oxidation of pyrite and NH4+ by aerobic groundwater, in parallel with pH buffering through the dissolution of carbonates. Disordered dolomite is probably the free proton neutraliser, because it is the dominant carbonate mineral in the cement of Ediacaran sandstones in the study area [54], and its saturation indexes in Gdov groundwater are systematically below zero (Table 2). On the other hand, Table 2 shows that Gdov groundwater is mostly oversaturated with respect to calcite. Mixing between bicarbonate-rich modern groundwater and Ca-rich crystalline water might have produced calcite precipitation, due to emerged chemical disequilibrium [49], which in turn could have influenced the activity concentrations of Ra as the Ca2+ chemical analogue [58]. However, the Ra dissolution/precipitation in the peninsula needs more detailed research in the future.
Table 2.
Saturation indexes (SI) of the Cm-V groundwaters in the Viimsi peninsula.
4.3. Secondary U Deposits as the Source of 226Ra
Although higher Ra activities observed in the Cm-V aquifer system have been attributed to the prolonged contact with the rocks of the crystalline basement [26,43], Ra is also present in the Voronka aquifer (226Ra from values under the detection limit to 0.4 Bq·L−1; 228R from 0.1 to 0.3 Bq·L−1), which has no direct contact with the crystalline basement. Concentrations of Cl− and δ18O values in the Gdov aquifer have a clear mixing trend with modern groundwater, but the 226Ra values in groundwater having modern isotopic signature stay moderately high (Figure 6) and 226Ra activity percentage in total radium activity increases towards the buried valley (Figure 9). This may indicate heterogeneous spreading of U in surfaces of sedimentary rocks, in which case locally high U contents could occur resulting in higher Ra activities [59].
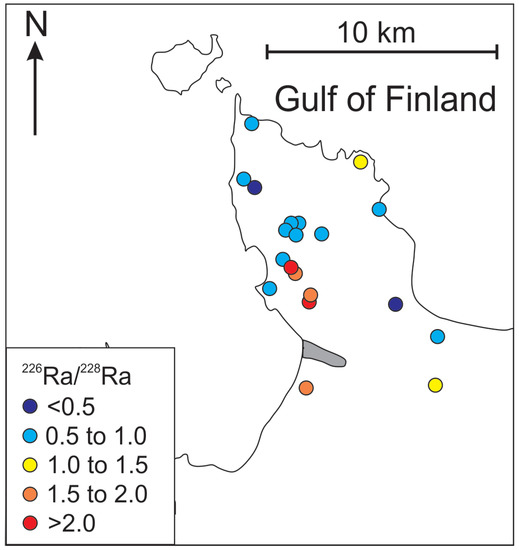
Figure 9.
Variations of Ra isotopes in Cm-V groundwater of the Viimsi peninsula.
The radium isotopes often behave in a similar manner during chemical processes. Contents of 226Ra and 228Ra in water tend to depend on the presence of their parent nuclides (238U and 232Th respectively) in the surrounding porous media [60,61]. Uranium and thorium are not fractionated significantly from each other during partial melting and subsequent differentiation in magma [62]; thus, their variations in magmatic rock, like the one encountered in the Estonian crystalline basement, should be similar. However, in fluids they behave quite differently. The 228Ra parent mineral Th stays immobile in water, whereas the 226Ra parent mineral U can be very mobile. Uranium concentrations in groundwater are strongly controlled by redox conditions, because U can be present as U4+ ion with very low solubility in anoxic conditions and as highly soluble and mobile U6+ ion in oxidizing environments [36,63,64,65]. These chemical differences can produce variations in U and Th contents in the aquifer matrix (in rock) and through this, variations of Ra isotope activity in water.
Anoxic conditions predominate in the Cm-V aquifer system, but Raidla et al. [21,48] show that oxygen-rich conditions dominated in the aquifer system in the relatively short infiltration period during the advance and maximum extent of the Scandinavian ice sheet in the Last Glacial Maximum. Vaikmäe et al. [20] have shown that groundwater in the Cm-V aquifer system in North-Estonia is characterised by enormous amounts of excess air (oversaturation of Ne up to 200–400%). The anomalous amount of excess air in groundwater has been thought to originate from air bubbles found in glacial basal ice [20]. Alternatively, Kipfer et al. [66] and Grundl et al. [67] have explained that the high Ne excess air amounts observed in groundwater of glacial origin are derived from trapped air pockets in englacial drainage systems, which behave in the same manner as trapped bubbles in porous sediments. The relation between Ar and Kr in Cm-V groundwater from the Viimsi peninsula follows the trend expected for the addition of air to air-equilibrated water (Figure 10; Table 3). These results agree with both hypotheses, because noble gas composition in ice generally corresponds to atmospheric composition, except for He and Ne, which can diffuse out of the firn during the firnification process, due to its smaller atomic radius [68]. As the concentrations of noble gases, such as Ar and Kr in subglacial meltwater correspond to atmospheric composition, we propose that a similar relationship can also be applied for other atmospheric gases, like O2. For instance, by knowing the concentration of Ar in groundwater, one can also calculate the initial oxygen concentration in glacial meltwater. Figure 10 indicates that the glacial meltwater, which intruded the aquifer system in the Pleistocene, was 1.5 to 2.5 times oversaturated with respect to O2.
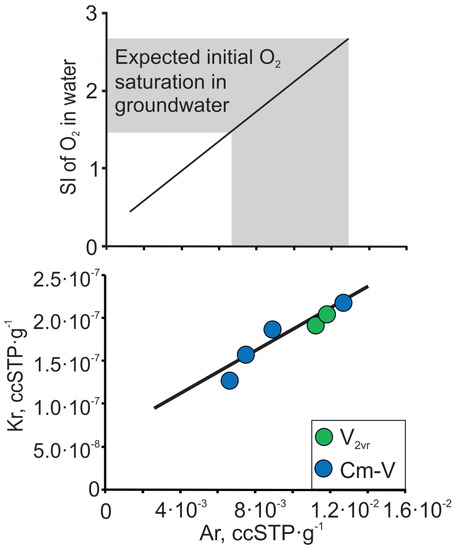
Figure 10.
Ar and Kr contents in Cm-V groundwater of the Viimsi peninsula and the expected initial O2 oversaturation in Cm-V groundwater at sea level and at 0 °C. The lines follow the trend expected for the addition of air-to-air-equilibrated water.
Table 3.
Noble gases composition of the Cm–V groundwaters in the Viimsi peninsula.
High dissolved O2 content would have supported U transport into the aquifer system from the northern direction, where subglacial meltwater would have been in contact with the outcropping crystalline basement rich in U. In aerobic conditions, the U would have become mobile and able to be transported into subsurface by infiltrating glacial meltwater. During the subsequent geochemical evolution of groundwater and the consumption of O2 during the oxidation of pyrite and organic matter [48], the infiltrated glacial meltwater would have evolved towards more reducing conditions, which would have lowered the U solubility. Furthermore, it has been shown that the precipitation of U as uranium carbonate is common near organic-rich clays [57,59,69,70]. This would mean that the Cambrian and Ediacaran clays overlying and occurring inside the Cm-V aquifer system [54] had provided a suitable environment for U precipitation. We propose a hypothesis that areas near the buried valley southwest of the Viimsi peninsula, where a large section of Lower Cambrian Lontovo clays is cut through by more recent Quaternary sediments, may have been a very suitable site for the development of paleo-redox fronts and for the precipitation of U. Thus, 226Ra may partly originate from these so-called "secondary U deposits" in the sedimentary complex. The observed pattern in 226Ra activity (Figure 9) together with the proposed explanation on its origin would further indicate that the changes in the chemical and isotopic composition of groundwater observed in the Viimsi peninsula are mainly caused by induced recharge of the aquifer system from the buried valley in the south-western part of the peninsula.
4.4. Future Prospects
Salinisation of groundwater resources is a globally significant phenomenon, which results from a high groundwater demand in coastal areas. To avoid saltwater intrusion, sustainable groundwater management strategies are required. However, in the case of the Viimsi peninsula, the salinisation had already taken place in the main groundwater intake before any measures were applied. In order to resolve this situation, a double pumping solution was deployed. This double pumping solution meant that additional groundwater abstraction wells were put into use that were located to the south from the main groundwater intake near the buried valley in the south-western part of the peninsula. This, however, probably facilitated the movement of fresh groundwater from recharge area (buried valley) to the main groundwater intake where intrusion of saline groundwater from the underlying crystalline basement had already occurred. To provide a more precise description of the current situation, a mathematical model of local groundwater dynamics should be developed based on the presented conceptual model. The modelling results would help to optimise groundwater abstraction from different production wells in order to minimise intrusion of brackish water from the underlying crystalline basement. The future management plans for Cm-V aquifer system on the Viimsi peninsula would also need to take into account the possibility of surface pollution transported by modern meteoric water from the buried valley reaching the aquifer system. The evolved dual pumping solution and an optimisation model may also be applicable in other areas facing similar problems.
Although we detected no intrusion of seawater in the Viimsi peninsula, its risk in the future cannot be ignored. As the population on the peninsula is increasing, a further rise in water consumption is inevitable and, in the end, the hydraulic head compensation through induced inflow from the crystalline basement and meteoric water infiltration through the buried valley will not be sufficient to avoid seawater intrusion. Most wells in the Viimsi peninsula are 1 to 5 km away from the outcrop area of the aquifer, and seawater intrusion to the water intake takes time. At the same time, wells in and round the buried valley are practically at the outcrop area (Figure 1), where the aquifer system is most exposed to the intrusion of water from exterior sources.
Predicting the dynamics of future seawater intrusion would require multicomponent strategies that consider intrusion in a broader context on a basin-wide scale and include integrated groundwater and surface water management. The presented conceptual model about chemical changes in the Viimsi peninsula needs a more detailed future analysis, which would include the modelling of transient groundwater dynamics and mass-transport. In addition, more studies on the changes of potentiometric levels and hydrostratigraphy in the Viimsi peninsula are necessary to build reliable solute-transport models based on conservative tracers, such as Cl− and δ18O.
Accurate three-dimensional characterisation of possible seawater intrusion requires an adequate monitoring network. For the moment, the monitoring wells are in northern and central parts of the peninsula and no wells belonging to the national groundwater-monitoring network are either on or near the buried valley. The available hydrogeological and hydrochemical information from this area can only be attained from private water supplies, which use groundwater from the Cm-V aquifer system. This setup is not well suited for studying changes in groundwater quality, as the production wells are located about 3 to 5 km away from the buried valley. Thus, any changes in groundwater quality imposed by the induced recharge from the buried valley would only be detectable in the production wells long after they have started to operate. Furthermore, the construction of some production wells currently monitored is not ideal for following changes in groundwater quality and quantity, as they open both the deeper Gdov aquifer and the shallower Voronka aquifer.
Additionally, the area is located on the trajectory of the planned tunnel between Tallinn and Helsinki [71]. The future construction of that tunnel would also affect the Cm-V aquifer system on the Viimsi peninsula. It is possible that the outcrop area of the Cm-V aquifer system that surrounds the Viimsi peninsula is covered by low-porosity sediments like clay or mud, which would prevent seawater intrusion. Thus, it is essential to plan the construction of the tunnel in such a way that the integrity of these aquitards would not be disturbed.
The groundwater of glacial origin is uncommon in Europe and widespread only in Estonia [72], but such a wide distribution of groundwater with a similar origin as in the Cm-V aquifer system has been observed in USA and Canada (Michigan, Alberta and Illinois basins) where they are an important source of drinking water [73,74,75,76,77]. Interpretation of the noble gas results indicates that the groundwater of glacial origin may have been heavily supersaturated with respect to oxygen. In appropriate geological conditions, the accumulation of redox-sensitive elements in the recharge area (e.g., Mn, U) may occur during infiltration of such waters. To know of the presence of such accumulation aids is important for the construction of new water intakes in order to avoid potential natural contamination of water with toxic microcomponents.
5. Conclusions
Trends in 226/228Ra, δ18O and major ions concentrations, in combination with additional hydrochemical information on regional hydrogeology of the Cm-V aquifer system from 1987 to 2018, were used to study the causes of the observed water quality changes induced by groundwater abstraction on the Viimsi peninsula near Tallinn, Estonia. Increased groundwater abstraction in the Viimsi area together with the current setup of production wells, distributed in very close proximity from each other in the central part of the peninsula, has led to increased concentrations of Cl− and enrichment of naturally light isotopic composition of glacial palaeogroundwater in the aquifer system. These changes are caused by mixing between glacial palaeogroundwater with water from the underlying crystalline basement and modern groundwater recharging from the buried valley in the south-western part of the peninsula, due to the lowering of potentiometric levels in the Cm-V aquifer system. Cl− concentrations increase because of the upwelling of saline water from the underlying crystalline basement. At the same time, the inflow of meteoric water through a buried valley and the scattering of groundwater production wells away from the central groundwater intake in recent years has lowered the Cl− contents and caused the enrichment in δ18O, due to wider meteoric water inflow through the buried valley and mixing with saline water.
The changes in groundwater quality have also brought about an increase in Ra activity in the study area. We propose two sources for these increased Ra activities in the aquifer system: The crystalline basement and the secondary U deposits in sedimentary sequence originating from palaeo-redox-front in the south-western part of the peninsula developed in the Pleistocene. The three-component mixing between palaeogroundwater, saline water and meteoric water is the main process controlling the 226Ra activity in the Cm-V groundwater. However, the 226Ra activities have possibly also been affected by cation exchange and dissolution/precipitation of the carbonate minerals.
The Cm-V aquifer system in the Viimsi peninsula is very vulnerable to overconsumption of groundwater, because it contains essentially non-renewable palaeogroundwater originating from Pleistocene glaciations. Thus, it is critical to understand the causes of the observed changes in water quality for the sustainable management of groundwater resources in the area. Current results give reason to believe that the present groundwater monitoring strategies may not be sufficient to understand and monitor the changes in the Cm-V aquifer system in the peninsula. Accurate three-dimensional characterisation of potential seawater intrusion will require increased use of monitoring wells opened at different depths in the south-western part of the peninsula, supplemented by innovative applications of surface and borehole geophysics. In addition, the observed differences in the distribution of 226Ra and 228Ra in groundwater and their relations with the possible paleo-redox fronts and secondary U deposits, could be a topic for wider future research especially in areas where wide distribution of glacial palaeogroundwater has also been observed (e.g. Michigan, Illinois and Alberta Basins in North America).
Author Contributions
Conceptualization, V.R.; validation, W.A., M.K., and R.M.; formal analysis, J.I., G.C., S.S., T.W. and V.S.; writing—original draft preparation, V.R.; writing—review and editing, J.P. and W.A.; visualization, V.R. and S.T.
Acknowledgments
This research was funded by the Estonian Research Council projects MOBTP25 (V.R.), PUTJD127 (V.R.) and SA Archimedes Project SLOFY12064T (M.K.). We would also like to thank the reviewers for their helpful comments, which made the manuscript clearer and more precise.
Conflicts of Interest
The authors declare no conflict of interest.
Appendix A

Figure A1.
Gamma radiation log from well 1511.
Figure A1.
Gamma radiation log from well 1511.

References
- Ferguson, G.; Gleeson, T. Vulnerability of coastal aquifers to groundwater use and climate change. Nat. Clim. Chang. 2012, 2, 342–345. [Google Scholar] [CrossRef]
- Werner, A.D.; Bakker, M.; Post, V.E.A.; van den Bohede, A.; Lu, C.; Ataie-Ashtiani, B.; Simmons, C.T.; Barry, D.A. Seawater intrusion processes, investigation and management: Recent advances and future challenges. Adv. Water Resour. 2013, 5, 3–26. [Google Scholar] [CrossRef]
- Wetzel, M.; Kühn, M. Salinization of freshwater aquifers due to subsurface fluid injection quantified by species transport simulations. Energy Procedia 2016, 97, 411–418. [Google Scholar] [CrossRef]
- Colombani, N.; Osti, A.; Volta, G.; Mastrocicco, M. Impact of climate change on salinization of coastal water resources. Water Resour. Manag. 2016, 30, 2483–2496. [Google Scholar] [CrossRef]
- Delfs, J.-O.; Nordbeck, J.; Bauer, S. Upward brine migration resulting from pressure increases in a layered subsurface system. Env. Earth Sci. 2016, 75, 1441. [Google Scholar] [CrossRef]
- Vallejos, A.; Sola, F.; Yechieli, Y.; Pulido-Bosch, A. Influence of the paleogeographic evolution on the groundwater salinity in a coastal aquifer. Cabo De Gata Aquiferse Spain J. Hydrol. 2018, 557, 55–66. [Google Scholar]
- Edmunds, W.M. Paleowater in European coastal aquifers—The goals and main conclusions of the PALAEAUX project. In Paleowaters in Coastal Europe: Evolution of Groundwater Since the Late Pleistocene; Edmunds, W.M., Milne, C.J., Eds.; Geological Society London Special Publications: London, UK, 2001; pp. 1–16. [Google Scholar]
- Cary, L.; Petelet-Giraud, E.; Bertrand, G.; Kloppmann, W.; Aquilina, L.; Martins, V.; Hirata, R.; Montenegro, S.; Pauwels, H.; Chatton, E.; et al. Origins and processes of groundwater salinization in the urban coastal aquifers of Recife (Pernambuco, Brazil): A multi-isotope approach. Sci. Total Environ. 2015, 530–531, 411–429. [Google Scholar] [CrossRef] [PubMed]
- Daniele, L.; Vallejos, A.; Corbellá, M.; Molina, L.; Pulido-Bosch, A. Hydrogeochemistry and geochemical simulations to assess water–rock interactions in complex carbonate aquifers: The case of Aguadulce (SE Spain). Appl. Geochem. 2013, 29, 43–54. [Google Scholar] [CrossRef]
- Mollema, P.; Antonellini, M.; Dinelli, E.; Gabbianelli, G.; Greggio, N.; Stuyfzand, P. Hydrochemical and physical processes influencing salinization and freshening in mediterranean low-lying coastal environments. Appl. Geochem. 2013, 34, 207–221. [Google Scholar] [CrossRef]
- Carreira, P.M.; Marques, J.M.; Nunes, D. Source of groundwater salinity in coastline aquifers based on environmental isotopes (Portugal): Natural vs. human interference—A review and reinterpretation. Appl. Geochem. 2014, 41, 163–175. [Google Scholar] [CrossRef]
- Valocchi, A.J.; Street, R.L.; Roberts, P.V. Transport of ion-exchanging solutes in groundwater: Chromatographic theory and field simulation. Water Resour. Res. 1981, 17, 1517–1527. [Google Scholar] [CrossRef]
- Appelo, C.A.J. Cation and proton exchange, pH variations, and carbonate reactions in a freshening aquifer. Water Resour. Res. 1994, 30, 2793–2805. [Google Scholar] [CrossRef]
- Appelo, C.A.J.; Willemsen, A. Geochemical calculations and observations on salt water intrusions. I: A combined geochemical/mixing cell model. J. Hydrol. 1987, 94, 313–330. [Google Scholar] [CrossRef]
- Van der Kemp, W.; Appelo, C.A.J.; Walraevens, K. Inverse chemical modeling and radiocarbon dating of palaeogroundwaters: The Tertiary Ledo-Paniselian aquifer in Flanders, Belgium. Water Resour. Res. 2000, 36, 1277–1287. [Google Scholar] [CrossRef]
- Martinez, D.E.; Bocanegra, E.M. Hydrochemistry and cation-exchange processes in the coastal aquifer of Mar Del Plata, Argentina. Hydrogeol. J. 2002, 10, 393–408. [Google Scholar] [CrossRef]
- Giménez, F.E. Dynamic of sea water interface using hydrochemical facies evolution diagram. Ground Water 2010, 48, 212–216. [Google Scholar] [CrossRef]
- Raidla, V.; Kirsimäe, K.; Vaikmäe, R.; Jõeleht, A.; Karro, E.; Marandi, A.; Savitskaja, L. Geochemical evolution of groundwater in the Cambrian–Vendian aquifer system of the Baltic Basin. Chem. Geol. 2009, 258, 219–231. [Google Scholar] [CrossRef]
- Raidla, V.; Kern, Z.; Pärn, J.; Babre, A.; Erg, K.; Ivask, J.; Kalvāns, A.; Kohán, B.; Lelgus, M.; Martma, T.; et al. A δ18O isoscape for the shallow groundwater in the Baltic Artesian Basin. J. Hydrol. 2016, 542, 254–267. [Google Scholar] [CrossRef]
- Vaikmäe, R.; Vallner, L.; Loosli, H.H.; Blaser, P.C.; Juillard-Tardent, M. Palaeogroundwater of glacial origin in the Cambrian-Vendian aquifer of northern Estonia. In Palaeowaters of Coastal Europe: Evolution of Groundwater since the late Pleistocene; Edmunds, W.M., Milne, C.J., Eds.; Geological Society: London, UK, 2001; Volume 189, pp. 17–27. [Google Scholar]
- Raidla, V.; Kirsimäe, K.; Vaikmäe, R.; Kaup, E.; Martma, T. Carbon isotope systematics of the Cambrian–Vendian aquifer system in the northern Baltic Basin: Implications to the age and evolution of groundwater. Appl. Geochem. 2012, 27, 2042–2052. [Google Scholar] [CrossRef]
- Perens, R.; Savitski, L.; Savva, V.; Jaštšuk, S.; Häelm, M. Delineation of Groundwater Bodies and Description of Their Boundaries and Hydrogeological Conceptual Models; Geological Survey of Estonia: Tallinn, Estonia, 2012. (In Estonian) [Google Scholar]
- Erg, K.; Truu, M.; Kebbinau, K.; Lelgus, M.; Tarros, S. Report of Estonian Environmental Monitoring. Monitoring of Groundwater Bodies in 2016 of State Environmental Programme; Geological Survey of Estonia: Tallinn, Estonia, 2017. (In Estonia) [Google Scholar]
- Suursoo, S.; Hill, L.; Raidla, V.; Kiisk, M.; Jantsikene, A.; Nilb, N.; Czuppon, G.; Putk, K.; Munter, R.; Koch, R.; et al. Temporal changes in radiological and chemical composition of Cambrian-Vendian groundwater in conditions of intensive water consumption. Sci. Total Environ. 2017, 601–602, 679–690. [Google Scholar] [CrossRef]
- Savitskaja, L.; Viigand, A. Report of Microcomponent and Isotope Composition Research in Cm–V Aquifer Groundwater for Estimating Drinking Water Quality in North Estonia; Geological Survey of Estonia: Tallinn, Estonia, 1994. (In Estonian) [Google Scholar]
- Mokrik, R.; Karro, E.; Savitskaja, L.; Drevaliene, G. The origin of barium in the Cambrian-Vendian aquifer system, North Estonia. Est. J. Earth Sci. 2009, 58, 193–208. [Google Scholar] [CrossRef]
- Forte, M.; Bagnato, L.; Caldognetto, E.; Risica, S.; Trotti, F.; Rusconi, R. Radium isotopes in Estonian groundwater: Measurements, analytical correlations, population dose and a proposal for a monitoring stradegy. J. Radiat. Prot. 2010, 30, 761–780. [Google Scholar] [CrossRef] [PubMed]
- Vinson, D.S.; Vengosh, A.; Hirschfeld, D.; Dwyer, G.S. Relationships between radium and radon occurrence and hydrochemistry in fresh groundwater from fractured crystalline rocks, North Carolina (USA). Chem. Geol. 2009, 260, 159–171. [Google Scholar] [CrossRef]
- Vengosh, A.; Hirschfeld, D.; Vinson, D.; Dwyer, G.; Raanan, H.; Rimawi, O.; Al-Zoubi, A.; Akkawi, E.; Marie, A.; Haquin, G.; et al. High naturally occurring radioactivity in fossil groundwater from the Middle East. Environ. Sci. Technol. 2009, 43, 1769–1775. [Google Scholar] [CrossRef] [PubMed]
- Szabo, Z.; DePaul, V.T.; Fischer, J.M.; Kraemer, T.F.; Jacobsen, E. Occurrence and geochemistry of radium in water from principal drinking-water aquifer systems of the United States. Appl. Geochem. 2012, 27, 729–752. [Google Scholar] [CrossRef]
- Langmuir, D.; Riese, A.C. The thermodynamic properties of radium. Geochim. Cosmochim. Acta 1985, 49, 1593–1601. [Google Scholar] [CrossRef]
- Kraemer, T.F.; Reid, D.F. The occurrence and behavior of radium in saline formation water of the U.S. Gulf Coast region. Chem. Geol. 1984, 2, 153–174. [Google Scholar] [CrossRef]
- Sturchio, N.C.; Banner, J.L.; Binz, C.M.; Heraty, L.B.; Musgrove, M. Radium geochemistry of ground waters in Paleozoic carbonate aquifers, midcontinent, USA. Appl. Geochem. 2001, 16, 109–122. [Google Scholar] [CrossRef]
- Swarzenski, P.W.; Baskaran, M.; Rosenbauer, R.J.; Edwards, B.D.; Land, M. A combined radio- and stable-isotopic study of a California coastal aquifer system. Water 2013, 5, 480–504. [Google Scholar] [CrossRef]
- Sherif, M.I.; Linb, J.; Poghosyan, A.; Abouelmagd, A.; Sultan, M.I.; Sturchio, N.C. Geological and hydrogeochemical controls on radium isotopes in groundwater of the Sinai Peninsula, Egypt. Sci. Total Environ. 2018, 613–614, 877–885. [Google Scholar] [CrossRef]
- Porcelli, D.; Swarzenski, P.W. The behavior of U- and Th-series nuclides in groundwater. Rev. Mineral. Geochem. 2003, 52, 317–361. [Google Scholar] [CrossRef]
- Vaaramaa, K.; Lehto, J.; Ervanne, H. Soluble and Particle-Bound 234,238U, 226Ra and 210Po in ground waters. Radiochim. Acta 2003, 91, 21–27. [Google Scholar] [CrossRef]
- Vinson, D.S.; Tagma, T.; Bouchaou, L.; Dwyer, G.; Warner, N.R. Occurrence and mobilization of radium in fresh to saline coastal groundwater inferred from geochemical and isotopic tracers. Appl. Geochem. 2013, 38, 161–175. [Google Scholar] [CrossRef]
- Perens, R.; Vallner, L. Water-bearing formation. In Geology and Mineral Resources of Estonia; Raukas, A., Teedumäe, A., Eds.; Estonian Academy Publishers: Tallinn, Estonia, 1997; pp. 137–145. [Google Scholar]
- Puura, V.; Vaher, R.; Klein, V.; Koppelmaa, H.; Niin, M.; Vanamb, V.; Kirs, J. Zoning and stratification of the rock complexes of the cristaline basement. In The Crystalline Basement of Estonian Territory; Viiding, H., Ed.; Nauka: Moscow, Russia, 1983; pp. 15–45. (In Russian) [Google Scholar]
- Kirs, J.; Puura, V.; Soesoo, A.; Klein, V.; Konsa, M.; Koppelmaa, H.; Niin, M.; Urtson, K. The crystalline basement of Estonia: Rock complexes of the Palaeoproterozoic Orosirian and Statherian and Mesoproterozoic Calymmian periods, and regional correlations. Est. J. Earth Sci. 2009, 58, 219–228. [Google Scholar] [CrossRef]
- Karro, E.; Marandi, A.; Vaikmäe, R. The origin of increased salinity in the Cambrian-Vendian aquifer system on the Kopli Peninsula, northern Estonia. Hydrogeol. J. 2004, 12, 424–435. [Google Scholar] [CrossRef]
- Savitskaja, L.; Jaštšuk, S. Determination of Radionuclides Concentrations in Groundwater from Cambrian-Vendian Aquifer System and Assessment of Its Conformity to the Norms set by EU Drinking Water Directive 98/83/EC; Geological Survey of Estonia: Tallinn, Estonia, 2001. (In Estonian) [Google Scholar]
- Suursoo, S.; Kiisk, M.; Al-Malahmeh, A.; Jantsikene, A.; Lumiste, L. 226Ra measurement by lsc as a tool to assess the efficiency of a water treatment technology for removing radionuclides from groundwater. Appl. Radiat. Isot. 2014, 93, 57–63. [Google Scholar] [CrossRef] [PubMed]
- Aeschbach-Hertig, W.; Solomon, D.K. Noble gas thermometry in groundwater hydrology. In The Noble Gases as Geochemical Tracers; Burnard, P., Ed.; Springer: Berlin, Germany, 2013; pp. 81–122. [Google Scholar]
- Yezhova, M.; Polyakov, V.; Tkachenko, A.; Savitski, L.; Belkina, V. Palaeowaters of North Estonia and their influence on changes of resources and the quality of fresh groundwaters of large coastal water supplies. Geologija 1996, 19, 37–40. [Google Scholar]
- Savitski, L.; Viigand, A.; Belkina, V.; Jashtshuk, S. The Estimation of Groundwater Resources in Tallinn. Seeking Groundwater Supplies for Tallinn and Its Vicinity; Geological Survey of Estonia: Tallinn, Estonia, 1993. (In Estonian) [Google Scholar]
- Raidla, V.; Kirsimäe, K.; Ivask, J.; Kaup, E.; Knöller, K.; Marandi, A.; Martma, T.; Vaikmäe, R. Sulphur isotope composition of dissolved sulphate in the Cambrian-Vendian aquifer system in the northern part of the Baltic Artesian Basin. Chem. Geol. 2014, 383, 147–154. [Google Scholar] [CrossRef]
- Appelo, C.A.J.; Postma, D. Geochemistry, Groundwater and Pollution, 2nd ed.; CRC Press: Boca Raton, FL, USA, 2005. [Google Scholar]
- Feistel, R.; Weinreben, S.; Wolf, H.; Seitz, S.; Spitzer, P.; Adel, B.; Nausch, G.; Schneider, B.; Wright, D.G. Density and Absolute Salinity of the Baltic Sea 2006–2009. Ocean Sci. 2010, 6, 3–24. [Google Scholar] [CrossRef]
- Arhangelski, B.N.; Fedorova, A.M. Cambrian–Vendian aquifer system. In Hydrogeology in U.S.S.R. XXX; Arhangelski, B.N., Ed.; Nedra: Moscow, Russia, 1966; pp. 170–192. (In Russian) [Google Scholar]
- Petersell, V.; Kivisilla, J.; Pukkonen, E.; Põldvere, A.; Täht, K. Evaluation of Ore Events and Mineralization Points in Estonian Bedrock and Crystalline Basement; Geological Survey of Estonia: Tallinn, Estonia, 1991. (In Russian) [Google Scholar]
- Raudsep, R. Mineral resources, mineral occurrences. In Geology and Mineral Resources of Estonia; Raukas, A., Teedumäe, A., Eds.; Estonian Academy Publishers: Tallinn, Estonia, 1997; pp. 369–372. [Google Scholar]
- Raidla, V.; Kirsimäe, K.; Bityukova, L.; Jõeleht, A.; Shogenova, A.; Šliaupa, S. Lithology and diagenesis of the poorly consolidated Cambrian siliciclastic sediments in the northern Baltic Sedimentary Basin. Geol. Q. 2006, 50, 11–22. [Google Scholar]
- Liivamägi, S.; Somelar, P.; Mahaney, W.C.; Kirs, J.; Vircava, I.; Kirsimäe, K. Late Neoproterozoic Baltic paleosol: Intense weathering at high latitude? Geology 2014, 42, 323–326. [Google Scholar] [CrossRef]
- Liivamägi, S.; Somelar, P.; Vircava, I.; Mahaney, W.C.; Kirs, J.; Kirsimäe, K. Petrology, mineralogy and geochemical climofunctions of the Neoproterozoic Baltic paleosol. Precambrian Res. 2015, 256, 170–188. [Google Scholar] [CrossRef]
- Stackelberg, P.E.; Szabo, Z.; Jurgens, B.C. Radium mobility and the age of groundwater in public-drinking-water supplies from the Cambrian-Ordovician aquifer system, north-central USA. Appl. Geochem. 2018, 89, 34–48. [Google Scholar] [CrossRef]
- Swarzenski, P.W. U/Th series radionuclides as tracers of coastal groundwater. Chem. Rev. 2007, 107, 663–674. [Google Scholar] [CrossRef] [PubMed]
- Langmuir, D. Aqueous Environmental Geochemistry, 1st ed.; Prentice Hall: New Jersey, NJ, USA, 1997. [Google Scholar]
- King, P.T.; Michel, J.; Moore, W.S. Ground water geochemistry of 228Ra, 226Ra and 222Rn. Geochim. Cosmochim. Acta 1982, 46, 1173–1182. [Google Scholar] [CrossRef]
- Chau, N.D.; Lucyna, R.; Jakub, N.; Paweł, J. Radium isotopes in the Polish Outer Carpathian mineral waters of various chemical composition. J. Environ. Radioact. 2012, 112, 38–44. [Google Scholar] [CrossRef] [PubMed]
- Rosholt, J.N. Isotopic composition of uranium and thorium in crystalline rocks. J. Geophys. Res. Solid Earth 1983, 88, 7315–7330. [Google Scholar] [CrossRef]
- Langmuir, D. Uranium solution–mineral equilibria at low temperatures with applications to sedimentary ore deposits. Geochim. Cosmochim. Acta 1978, 42, 547–569. [Google Scholar] [CrossRef]
- Herczeg, A.L.; Simpson, H.J.; Anderson, R.F.; Tfjer, R.M.; Mathieu, G.G.; Deck, B.L. Uranium and radium mobility in groundwaters and brines within the Delaware basin, southeastern New Mexico, U.S.A. Chem. Geol. 1988, 72, 181–196. [Google Scholar]
- Guerrero, J.L.; Vallejos, A.; Ceron, J.C.; Sanchez-Martos, F.; Pulido-Bosch, A.; Bolívar, J.P. U-isotopes and 226Ra as tracers of hydrogeochemical processes in carbonated karst aquifers from arid areas. J. Environ. Radioact. 2016, 158–159, 9–20. [Google Scholar] [CrossRef]
- Kipfer, R.; Aeschbach-Hertig, W.; Peters, F.; Stute, M. Noble Gases in Lakes and Groundwaters; Porcelli, D., Ballentine, C.J., Wieler, R., Eds.; Mineralogical Society of America: Washington, DC, USA, 2002; pp. 615–690. [Google Scholar]
- Grundl, T.; Magnusson, N.; Brennwald, M.S.; Kipfer, R. Mechanisms of subglacial groundwater recharge as derived from noble gas, 14C, and stable isotopic data. Earth Planet. Sci. Lett. 2013, 369–370, 78–85. [Google Scholar] [CrossRef]
- Severinghaus, J.P.; Sowers, T.; Brook, E.J.; Alley, R.B.; Michael, L.; Bender, M.L. Timing of abrupt climate change at the end of the Younger Dryas interval from thermally fractionated gases in polar ice. Nature 1998, 391, 141–146. [Google Scholar] [CrossRef]
- Gilkeson, R.H.; Cartwright, K.; Cowart, J.B.; Holtzman, R.B. Hydrogeologic and Geochemical Studies of Selected Natural Radioisotopes and Barium in Groundwater in Illinois; Final Technical Completion Report to U.S. Bureau of Reclamation, Project B-108-ILL; University of Illinois at Urbana-Champaign, Water Resources Center: St Paul, MN, USA, 1983. [Google Scholar]
- Drake, H.; Suksi, J.; Tullborg, E.-L.; Lahaye, Y. Quaternary redox transitions in deep crystalline rock fractures at the western margin of the Greenland ice sheet. Appl. Geochem. 2017, 76, 196–209. [Google Scholar] [CrossRef]
- FinEst Link. 2018. Available online: http://www.finestlink.fi/en/ (accessed on 14 January 2018).
- Pärn, J. Origin and Geochemical Evolution of Palaeogroundwater in the Northern Part of the Baltic Artesian Basin. Doctoral Thesis, Tallinn University of Technology, Tallinn, Estonia, 2018; p. 226. [Google Scholar]
- Clayton, R.N.; Friedman, I.; Graf, D.L.; Mayeda, T.K.; Meents, W.F.; Shimp, N.F. The origin of saline formation waters. Isotopic composition. J. Geophys. Res. 1966, 71, 3869–3882. [Google Scholar] [CrossRef]
- Grasby, S.E.; Osadetz, K.; Betcher, R.; Render, F. Reversal of the regional-scale flowsystem of the Williston Basin in response to Pleistocene glaciation. Geology 2000, 29, 635–638. [Google Scholar] [CrossRef]
- McIntosh, J.C.; Walter, L.M. Paleowaters in Silurian–Devonian carbonate aquifers: Geochemical evolution of groundwater in the Great Lakes region since the late Pleistocene. Geochim. Cosmochim. Acta 2006, 70, 2454–2479. [Google Scholar] [CrossRef]
- Person, M.; McIntosh, J.C.; Remenda, V.; Bense, V. Pleistocene hydrology of North America: The role of ice sheets in reorganizing groundwater systems. Rev. Geophys. 2007, 45, RG3007. [Google Scholar] [CrossRef]
- Siegel, D.I.; Mandle, R.J. Isotopic evidence for glacial meltwater recharge to the Cambrian-Ordovician aquifer, north-central United States. Quat. Res. 1984, 22, 328–335. [Google Scholar] [CrossRef]


© 2019 by the authors. Licensee MDPI, Basel, Switzerland. This article is an open access article distributed under the terms and conditions of the Creative Commons Attribution (CC BY) license (http://creativecommons.org/licenses/by/4.0/).