Article

Sumerian Pottery Technology Studied Through Neutron Diffraction and Chemometrics at Abu Tbeirah (Iraq)

1
Centro Fermi - Museo Storico della Fisica e Centro Studi e Ricerche “Enrico Fermi”, Piazza del Viminale 1, 00184 Rome, Italy
2
Physics Department & NAST Centre, Università degli Studi di Roma “Tor Vergata”, Via della Ricerca Scientifica 1, 00133 Rome, Italy
3
Dept. Instiute of Oriental Studies, Sapienza Università di Roma, Piazzale Aldo Moro 5, 00185 Rome, Italy
4
McDonald Institute for Archaeological Research, University of Cambridge, Downing street, Cambridge CB2 3EF, United Kingdom
5
Institute of Physics, Fondazione Policlinico A. Gemelli IRCCS, Università Cattolica Sacro Cuore, Largo Francesco Vito 1, 00168 Roma, Italy
6
Science and Technology Facilities Council (STFC), Rutherford Appleton Laboratory, ISIS Facility, Harwell OX11 0QX, United Kingdom
*
Author to whom correspondence should be addressed.
Geosciences 2019, 9(2), 74; https://doi.org/10.3390/geosciences9020074
Submission received: 24 October 2018 / Revised: 24 January 2019 / Accepted: 28 January 2019 / Published: 31 January 2019

Abstract

:
Pottery is the most common material found in archaeological excavations and is used as the main tool for chronological dating. Due to the geopolitical instability of the Middle East during the latter part of the last century until recent years, Sumerian pottery studies and analyses are limited. The resumption of archaeological excavations in Iraq during the last ten years allows the acquisition of new information and the study of archaeological material excavated through modern stratigraphic methodologies. This paper presents the results of the non-destructive analyses of Abu Tbeirah Sumerian pottery (Iraq) from the 3rd millennium BC and is aimed at analysing the crystallographic composition of ceramic material, therefore contributing to fill a gap in the knowledge of early Southern Mesopotamian pottery production, shedding new light on details of ancient technology and manufacturing techniques. Among the wide range of analytical techniques available, neutron-based ones have been chosen, obtaining detailed analyses in a non-destructive manner. Non-destructive and non-invasive neutron diffraction (ND) was applied in combination with chemometrics such as Principal Component Analysis (PCA) and Cluster Analysis (CA). ND confirms a general uniformity of the raw materials and a local Mesopotamian provenance through a comparison with modern local clay. Moreover, secondary minerals and their marker-temperature formation imply two different ranges of firing temperature that never exceeded 1000 °C, a temperature easily reachable through pit-firing techniques.

1. Introduction

Pottery is a human-made material that includes porous, unvitrified clay bodies fired at a wide range of temperatures from 800–900 °C up to 110–1200 °C [1]. The primary raw materials are clays, water and temper [1]. Clay is a sedimentary rock composed mainly of silicates (silicon, aluminium and oxygen, calcium, magnesium, sodium, potassium, iron, manganese and titanium). Temper is a material that includes organic substances such as dung, straw and hay, or inorganic elements like shells, sand, calcite, and sandstone, etc. Temper is added by the potter to modify the clay paste in order to allow, for example, the evaporation of water contained in the amalgam, minimizing the contraction of the clay during firing, at the same time helping the vitrification process and providing plasticity [2]. Colour and composition are dependent on manufacturing processes (kiln environment and temperature of the firing process) as well as on the nature of raw materials and amount of temper added as inclusions (such as straw, quartz, carbonates, ground fired clays, etc.) [3,4]. During firing, the original mineral structure changes and the clay becomes permanently hardened. The loss of water (adsorbed and combined water) and volatile materials in the clay mineral structure (such as organic components, some impurities and inclusions) contribute to the changing of the clay mineral itself (recrystallization and formation of new silicates), which lead to the formation of new minerals (calcium silicates or ferrosilicates), characteristic of high-temperature firings [1]. Above 900–1000 °C, additional changes, such as sintering and vitrification, are promoted by the presence of impurities and inclusions, producing a glassy, nonporous ceramic body [1]. In the case of clays with carbonate fraction, two main thermic processes are involved: clay dihydroxylation—loss of hydroxyls (ca. 400–600 °C) and decarbonation of calcareous materials (750–850 °C). It is widely accepted that quartz and feldspar do not undergo significant variations at low temperatures, except for “alpha and beta” transition at ~573 °C [5]. These changes in the original clay mineral structure can be considered an indication of the temperature reached by the clay object during firing [6]. In particular, illite/muscovite, minerals naturally present in Abu Tbeirah’s clays are stable during the firing process up to 900 °C [6]. Clay minerals such as illite/muscovite are dehydroxylated close to 950° [6]. At this temperature, new calcium minerals, such as diopside (CaMgSi2O6), are produced from calcite and dolomite reacting with other components [6]. Human modification of the clay body should be also taken into account in considering illite/muscovite and diopside as indicators of the firing temperature reached by the clay object. In particular, during slipping, a thin superficial layer of a lighter and fluid suspension of the same clay is applied before firing over the vase [7,8]; this procedure brings the finest components of the clay to the surface [9]. This external layer easily reaches high temperatures [1]; new formation minerals (e.g., diopside) can be thus found on the surface, the rest of the clay body shows mineral phases peculiar of a lower firing temperature.
ND [10] was successfully applied to the study of ancient ceramics from different geographical and historical contexts [11].
Time of flight (TOF) neutron diffraction (ND) combined with chemometric tools such as principal component analysis (PCA) and cluster analysis (CA) was carried out on the same set of ancient Sumerian pottery from the archaeological site of Abu Tbeirah (Nasiriyah, Southern Iraq) [12,13,14,15,16], currently under excavation. A total of 36 samples from two excavation campaigns have been analysed. These were also investigated in [17] through neutron resonance capture analysis (NRCA) for isotopic analysis; the NRCA technique [18] uses epithermal neutrons (in the range of 1 eV–1 keV) to investigate the isotopic/elemental composition of the irradiated sample together with a statistical approach: 39K, 56Fe and 55Mn components of the raw materials were identified together with decay products such as sodium chloride 23Na and 35Cl, giving us clues about the homogeneity of the raw materials and manufacturing of the pottery [17].
The site and the archaeological findings such as pottery assemblages date back to the 3rd millennium BC and their studies are still ongoing, evolving and enriched by the new results that each campaign is producing. Although pottery is one of most common materials found in archaeological excavations [1], comprehensive knowledge of Sumerian pottery is still far from completion due to the complex geopolitical context of the Middle East in the last 50 years, which has hampered archaeological research in this area.

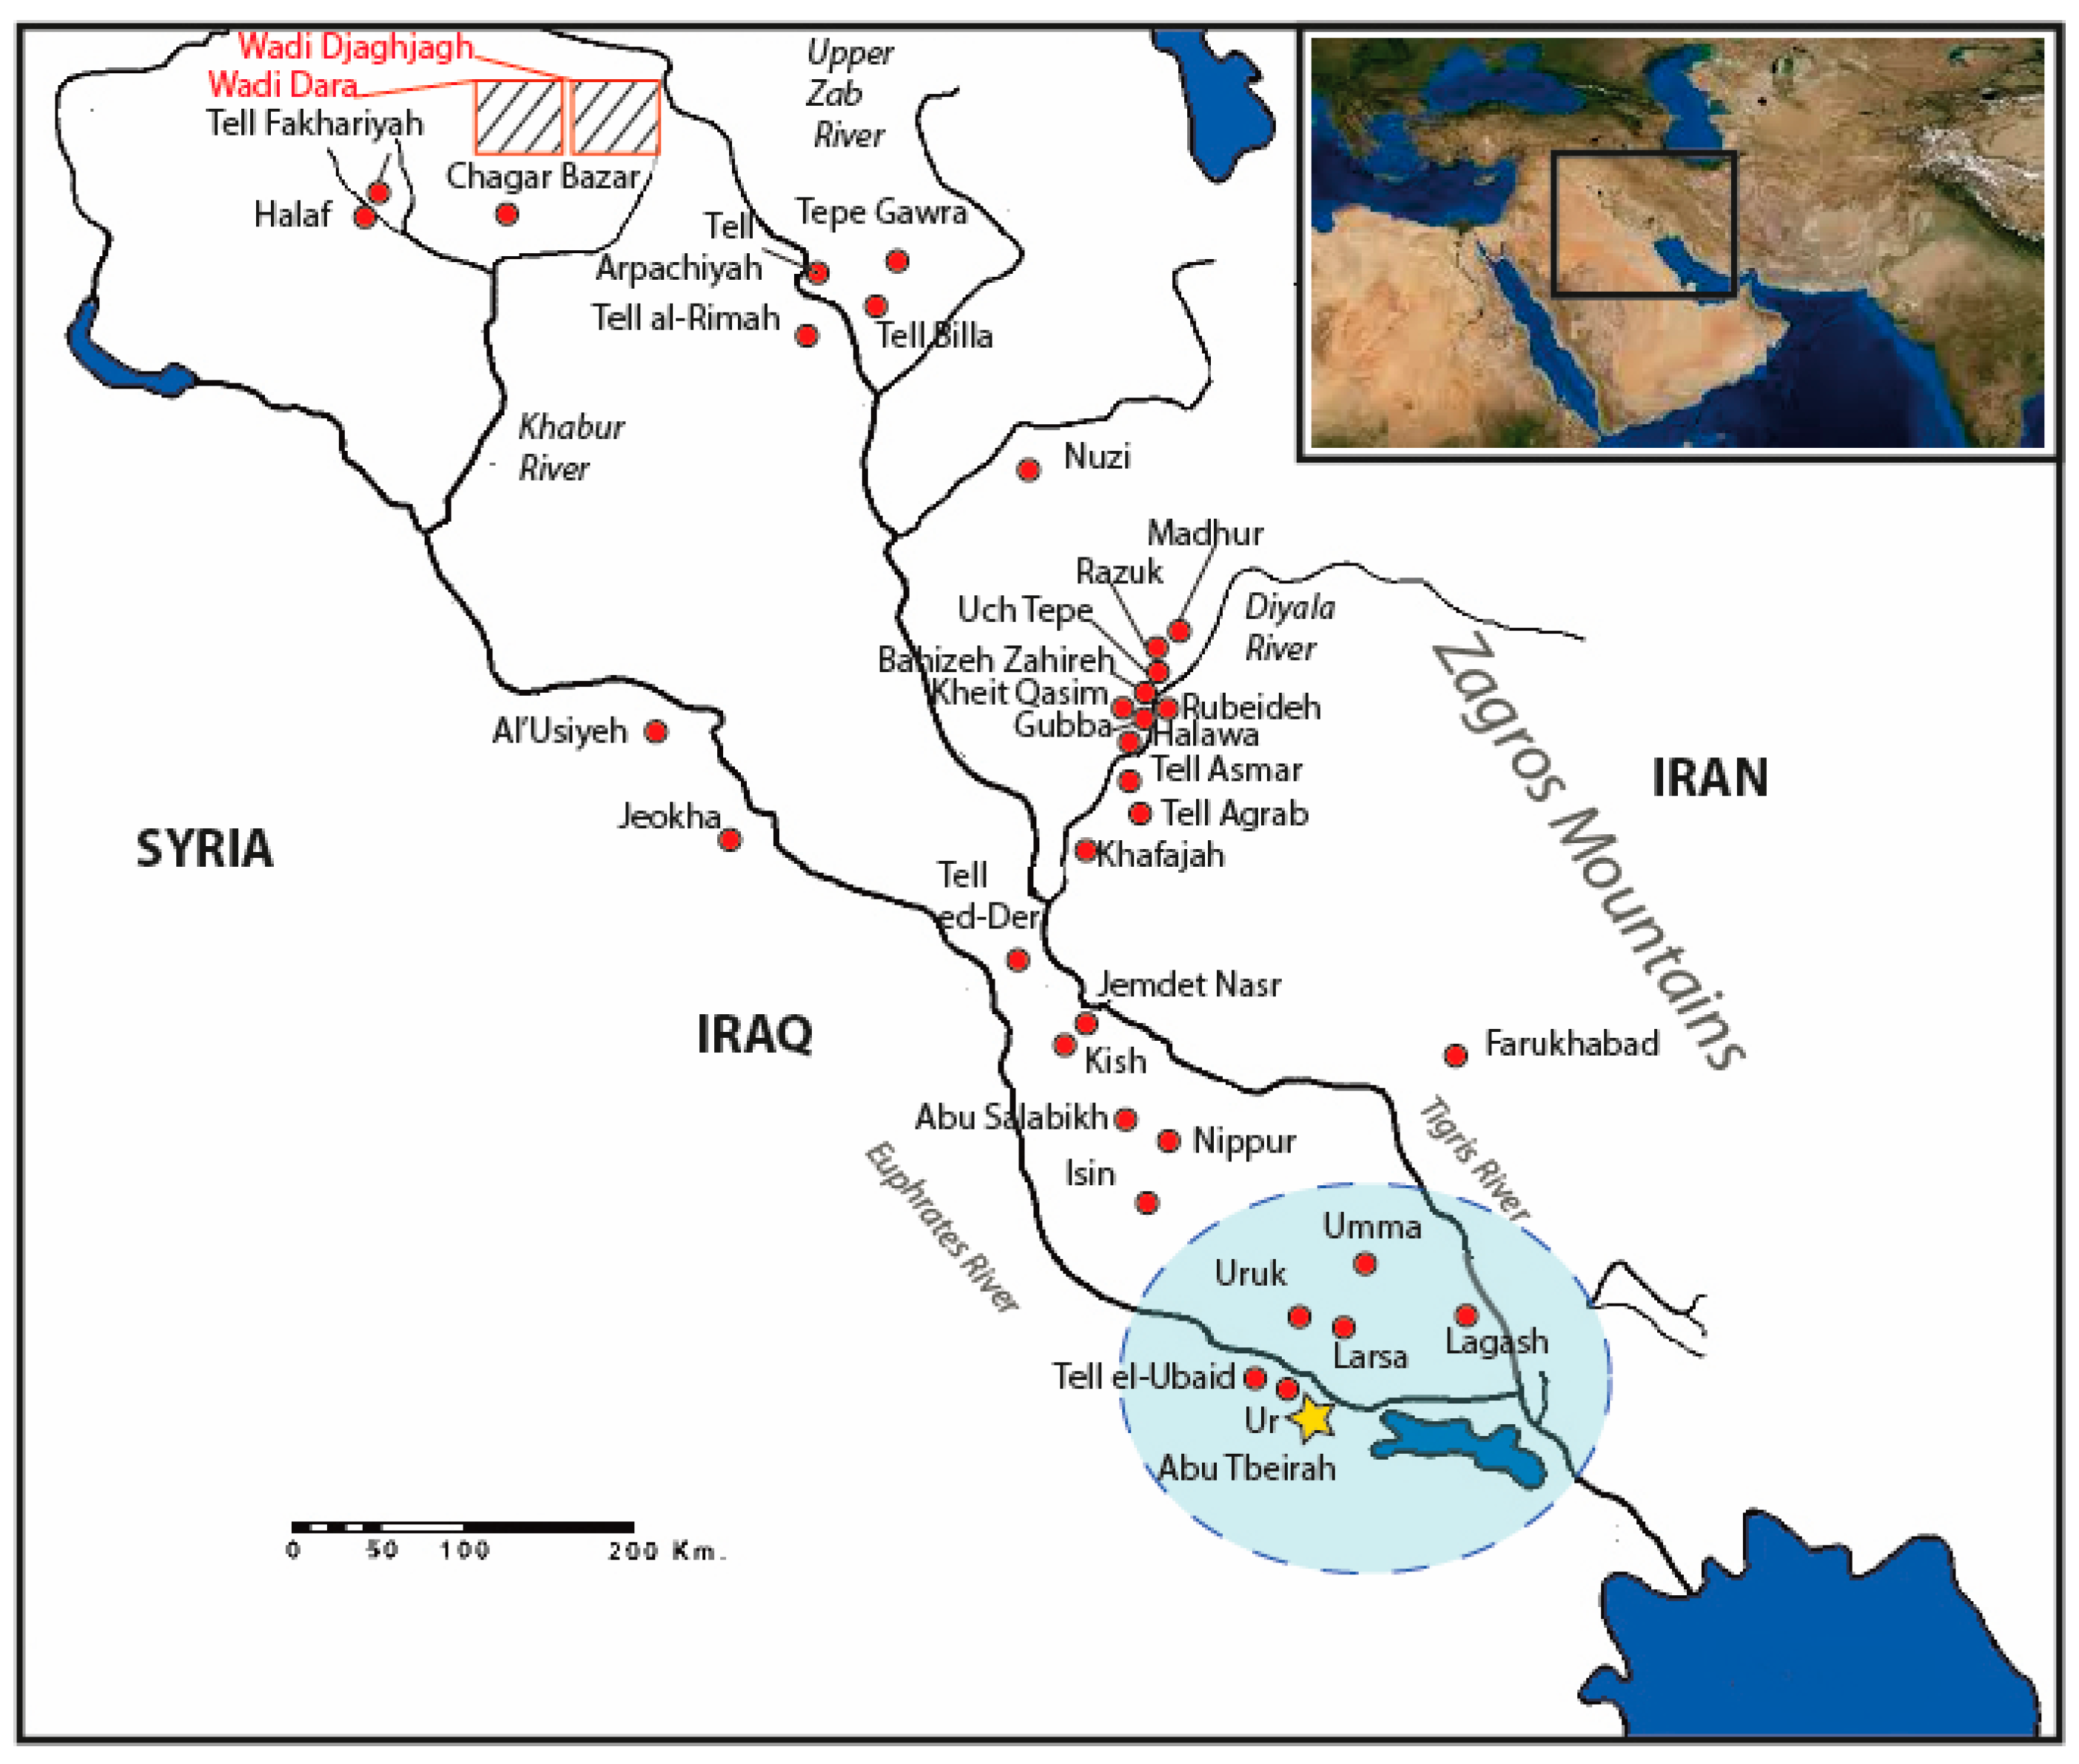
Archaeological and Geological Background

The Sumerian culture flourished in Southern Mesopotamia, modern-day Southern Iraq, from 4000 to 2000 BC. Pioneers in agriculture, craft (e.g., metalwork and pottery) and trade, Sumerians are considered as one of the world’s first civilizations. Abu Tbeirah was a significant settlement in the constellation of the city-states in which Mesopotamia was divided during the so-called Early Dynastic Period (2900–2350 BC), before the unification of the territory in the first ‘World Empire’ under the Akkadian King Sargon. The recent resumption of archaeological activities in Southern Iraq [19,20,21,22,23] offers the chance to analyse Sumerian material culture through current methodologies. Previous studies on Mesopotamian pottery [19,20,21,22,23,24] have demonstrated that the homogeneity of chemical and mineralogical compositions of clay is due to the nature of raw materials found in the alluvial plain, formed by the two great rivers Tigris and Euphrates (see Figure 1) [25].
The Mesopotamian Fluvial Basin, the geological formation context of the clay used by Sumerian potters, belongs to the so-called Zagros Fold-Thrust Belt (ZFTB), a basin enclosed between the Zagros Mountains and the Arabian Platform [26]. Sediments of fluvial, deltaic, and lacustrine origin accumulated in the basin during the Quaternary Period [8,26]. The sediments surrounding Abu Tbeirah are characterised as carbonate and clastic deposits, mainly silty sand and silty clay [27,28]. Local clay in Abu Tbeirah is composed of montmorillonite (main clay mineral (Na,Ca)0,3(Al,Mg)2Si4O10(OH)2·n(H2O)), muscovite/illite (KAl2(Si3Al)O10(OH)2 and kaolinite (Al2Si2O5(OH)4), while the main non-clay minerals are calcite (CaCO3), quartz (SiO2), feldspar and dolomite (dolomite MgCa(CO3)2) [29]. Al-Mukhtar states [30] that the heavy mineral composition of the sediment in this area consists of 40% of metamorphic origin, 7% of igneous origin and 48% of a different source. These sediments are derived from basic igneous rocks (such as gabbro and basalt), metamorphic rocks (such as schist, gneiss and amphibolites) and are in a minor proportion relative to older sedimentary rocks. Al-Mukhtar also attributes the composition of the sediments to the action of the Euphrates and Tigris Rivers, which transport the sediments of the primary source, the Taurus-Zagros Belt [30]. However, the heavy mineral concentration of the tributaries of the two main rivers differs and some peculiarities in the west area of the Euphrates (where Abu Tbeirah is located) can be related to the provenance of sediments from the Arabian Stable Shelf [31,32]. The local provenance of the clay used for the 3rd millennium BC pottery production was demonstrated by previous studies [19,20,21,22,23,24] for the Central Iraqi Diyala and Hamrin areas (Khafajah, Tell Agrab, Tell Asmar, Halwa, Gubba, Rubeideh, Bahizeh Zahireh, Uch Tepe, Razuk, Tell Madhur). Data from the Southernmost part of Mesopotamia, in which Abu Tbeirah is located, are still extremely limited: a total of 40 shards coming from several sites (Tell-ed-Der, Jemdet Nasr, Nippur, Kish, Abu Salabikh, Fara, Tell al-Wilayah, Uruk, Larsa, Lagash, Obeid, and Ur) have been analysed [19,20,22]. Mesopotamian 3rd millennium BC pottery has always been regarded as one of the first examples of the wide application of advanced manufacturing techniques [1], such as the use of the wheel for shaping vessels and pottery ovens for firing. The analyses recently carried out in the Ancient Near East, in general, and in Southern Mesopotamia [33,34], in particular, show a more nuanced picture of the evolution of this first pottery technology, with more advanced techniques coexisting with less technological ones [7,35]. Recent excavations [12,13,14,15,16] have documented, especially in the north-east-region of the Abu Tbeirah settlement, the presence of pottery production waste not connected to any visible kiln structures. However, the erosion process that characterizes the site might have hampered the visibility of the original structures. Abu Tbeirah vases often show traces of a non-uniform firing [36], a characteristic that is usually connected to pit-firing [9,37]. The analyses carried out on the 36 samples confirm the local provenance of Abu Tbeirah’s pottery and show a range of temperatures that can be attributed to pit-firing. This contributes to the general understanding of Sumerian pottery technology, highlighting the use until the 3rd millennium BC of firing techniques, such as pit-firing, considered out-dated for the period.

2. Materials and Methods

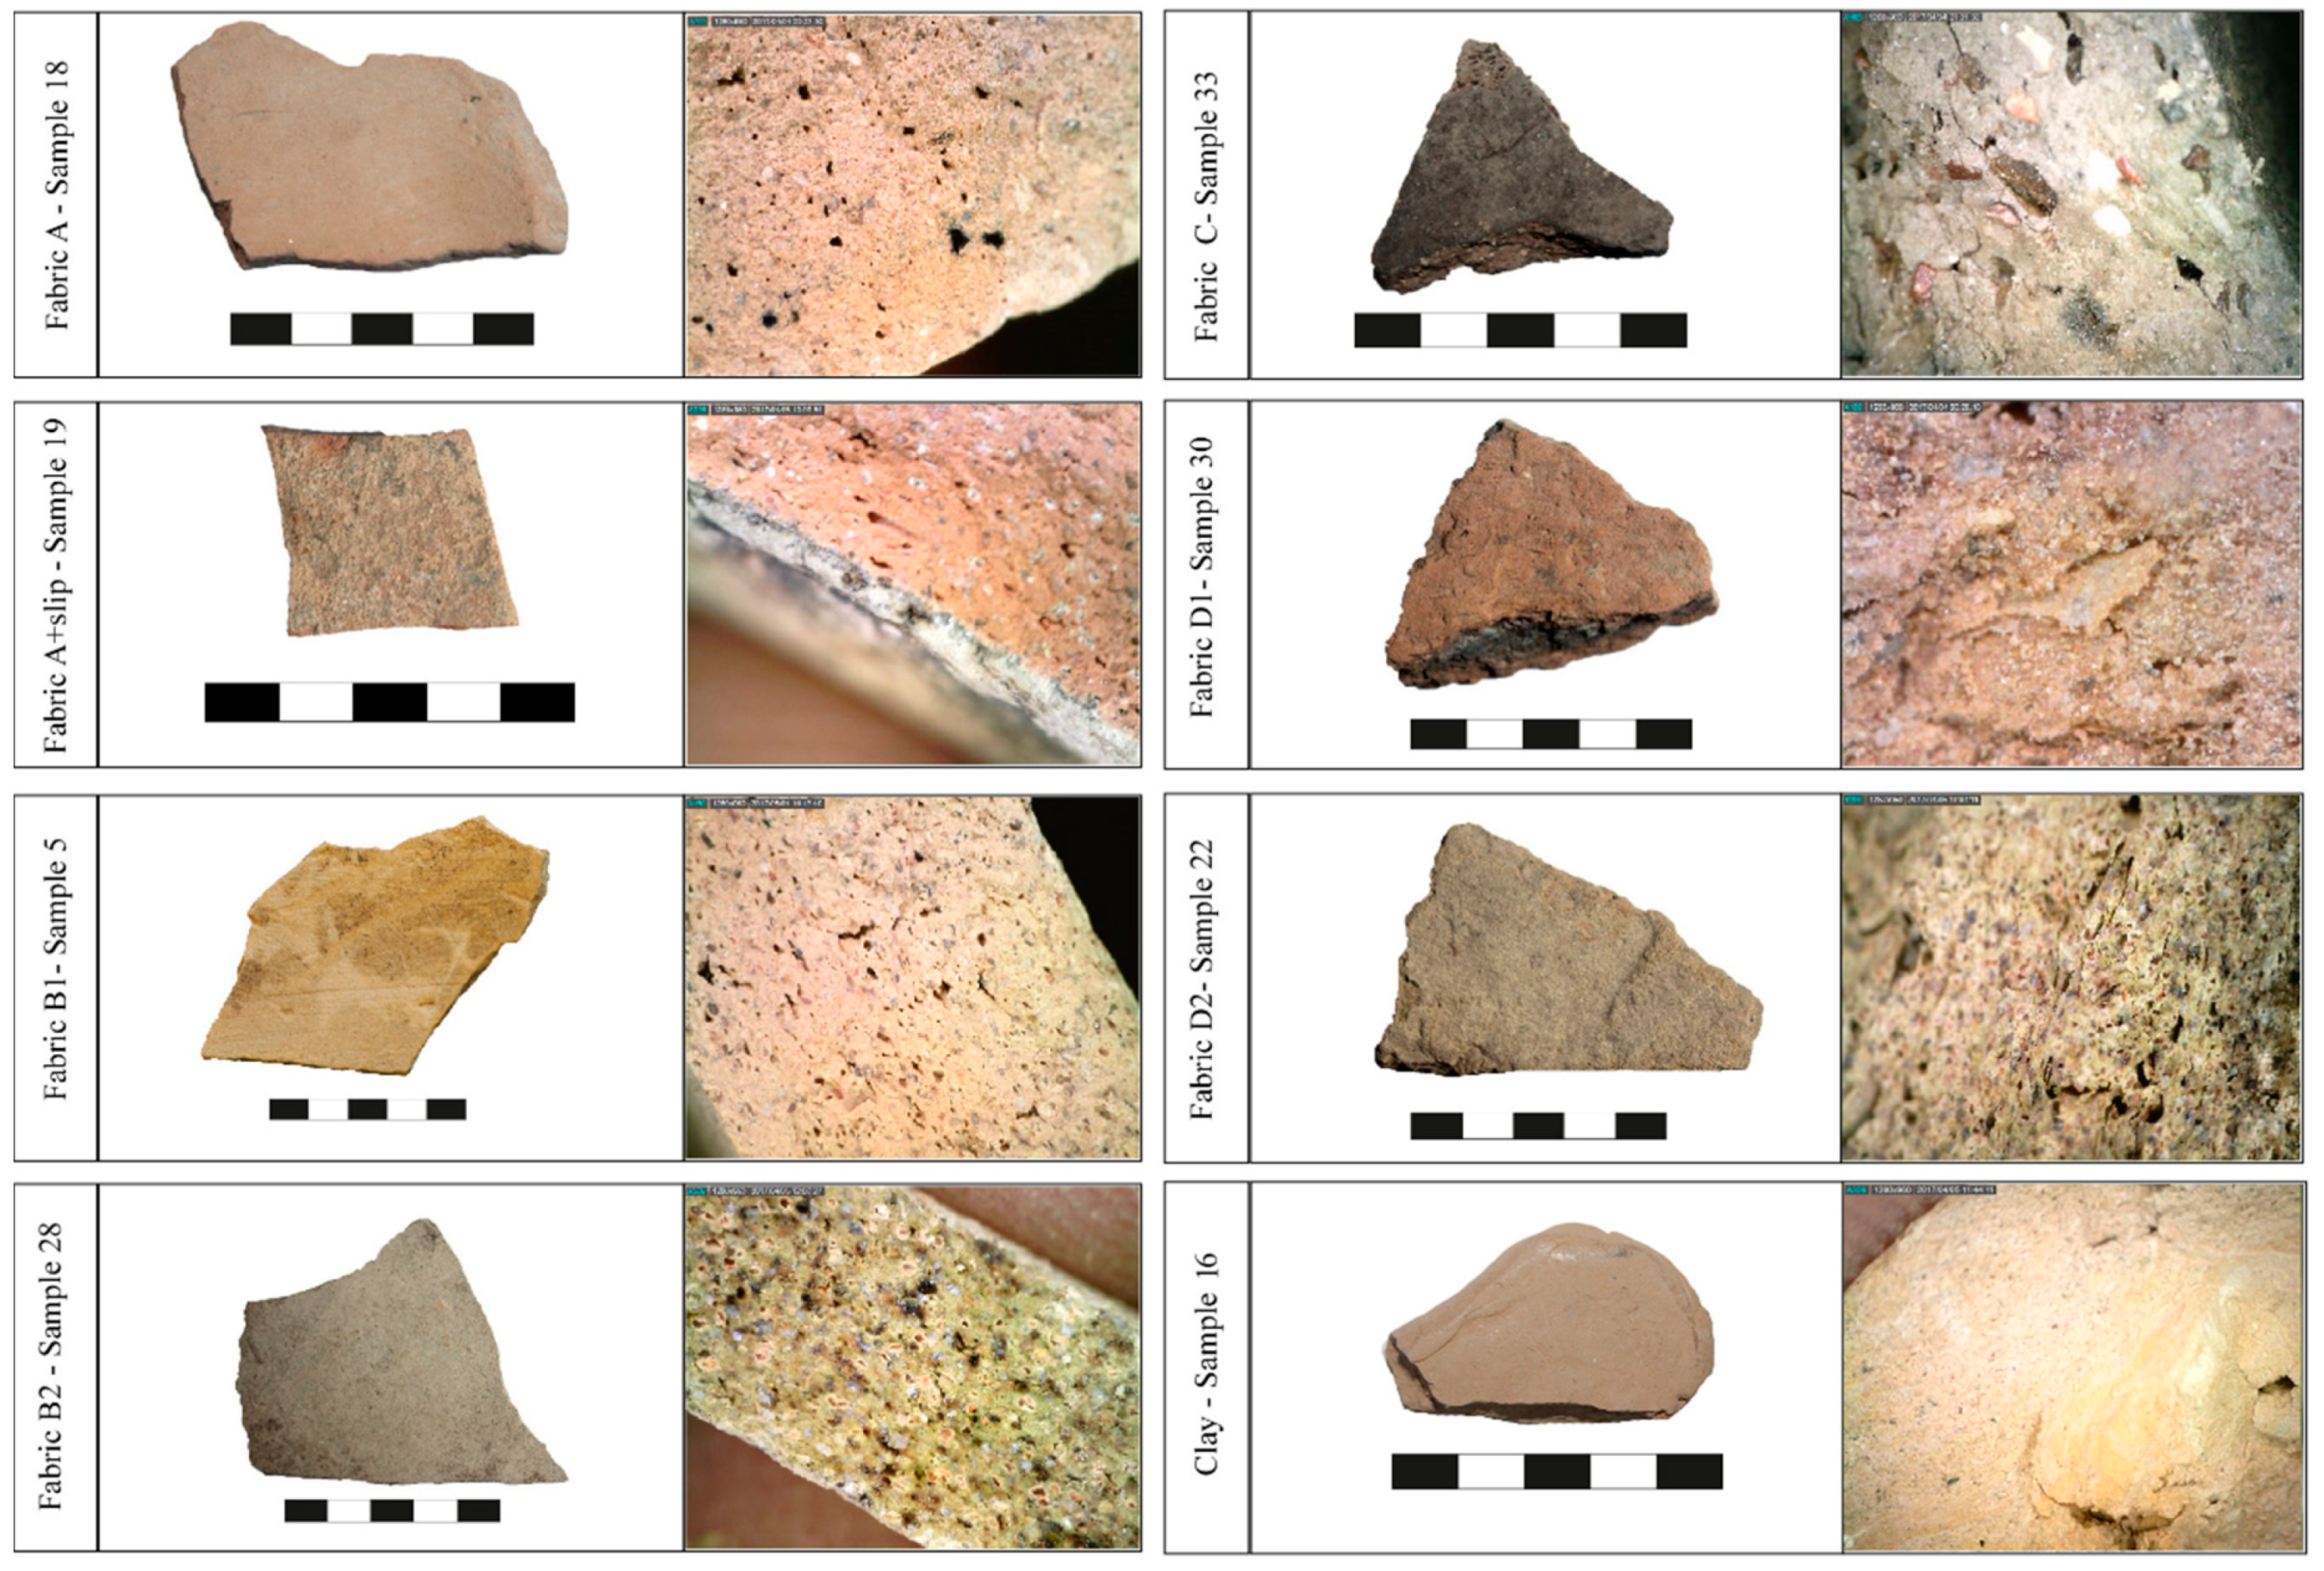
2.1. Description of the Samples

A total of 36 pottery fragments were selected from the early Dynastic-Akkadian contexts of Area 1 [12,13,14,15,16] together with one modern clay sample (sample n. 16), from the canal near the excavated site and used for comparison purposes. The samples were chosen after an autoptic subdivision into fabric-groups. The preliminary classification of ceramic pastes is based on macroscopic compositional features, such as particle size (coarse/fine-granulometry, porosity and colour). These macroscopic analyses showed differences in colour, plausibly linked to the firing temperature and/or intentional adding of temper or other inclusions. Four main macroscopic groups (6 with sub-groups) were identified and used to select samples for the present analyses. The following fabrics are reported in Figure 2.
  • Fabric A: fine-grained paste with low porosity featured by planar voids. Red-orange paste colour. Firing mainly in an oxidising atmosphere. Self-slipped or sometimes covered with clearer slip (fabric A + slip)—samples n. 2, 3, 6–9, 12, 14, 15, 17–19, 23, 31, 32, 34.
  • Fabric B1: fine-grained paste with a low porosity featured by planar voids. Yellow paste colour. Firing mainly in an oxidising atmosphere. Sometimes self-slipped—samples n. 5, 10, 20, 27, 35, 36.
  • Fabric B2: fine-grained paste with a low porosity featured by planar voids. Yellow paste colour with orange inclusions. Firing mainly in an oxidising atmosphere—samples n. 1, 13, 21, 24–26, 28.
  • Fabric C: coarse-grained paste with abundant sedimentary fragments and angular inclusions. High porosity compared to other groups. Firing mainly in an oxidising atmosphere-sample n. 33.
  • Fabric D1: fine-grained paste with abundant straw. Red-orange paste colour. Firing mainly in an oxidising atmosphere-sample n. 30.
  • Fabric D2: fine-grained paste with abundant straw. Yellow paste colour with orange inclusions. Firing mainly in an oxidising atmosphere-samples n. 4, 11, 22, 29.
The slip is defined as a lighter and fluid suspension of the same clay applied over the vase as a thin superficial layer before firing [7,8] while the self-slip is realised by wiping the surface with a wet hand or cloth, a procedure that brings the finest components of the clay to the surface [9].

2.2. Association between Fabrics and Pottery Shapes at Abu Tbeirah

Abu Tbeirah pottery presents, on the one hand, discontinuous use of the same fabric for a given vessel typology (see, for example, the beakers realized with different fabrics in Figure 3) but, on the other hand, the following general trends can be recognized: (a) drinking vessels, such as quickly wheel-thrown or wheel-coiled beakers and conical bowls, are usually realised in fabric A; (b) medium and large closed vessels are instead mainly realised in fabrics B1–B2 or fabric A, self-slipped/slip but never in fabrics C or D (with the exception of ring bases, added to stabilize jars, that are always realised in fabric D); (c) rare cooking pots are realised in fabric C, suitable for cooking purposes, withstanding the thermal shock caused by the contact with fire, thanks to its coarse-grained and porous paste. Fabric C It is rare at Abu Tbeirah due to the wider use of tannur (typical clay oven) and other peculiar firing installations for food preparation; (d) large containers, such as trays, vats or coffins are always realised in fabric D1–D2.

2.3. Experimental Set-Up
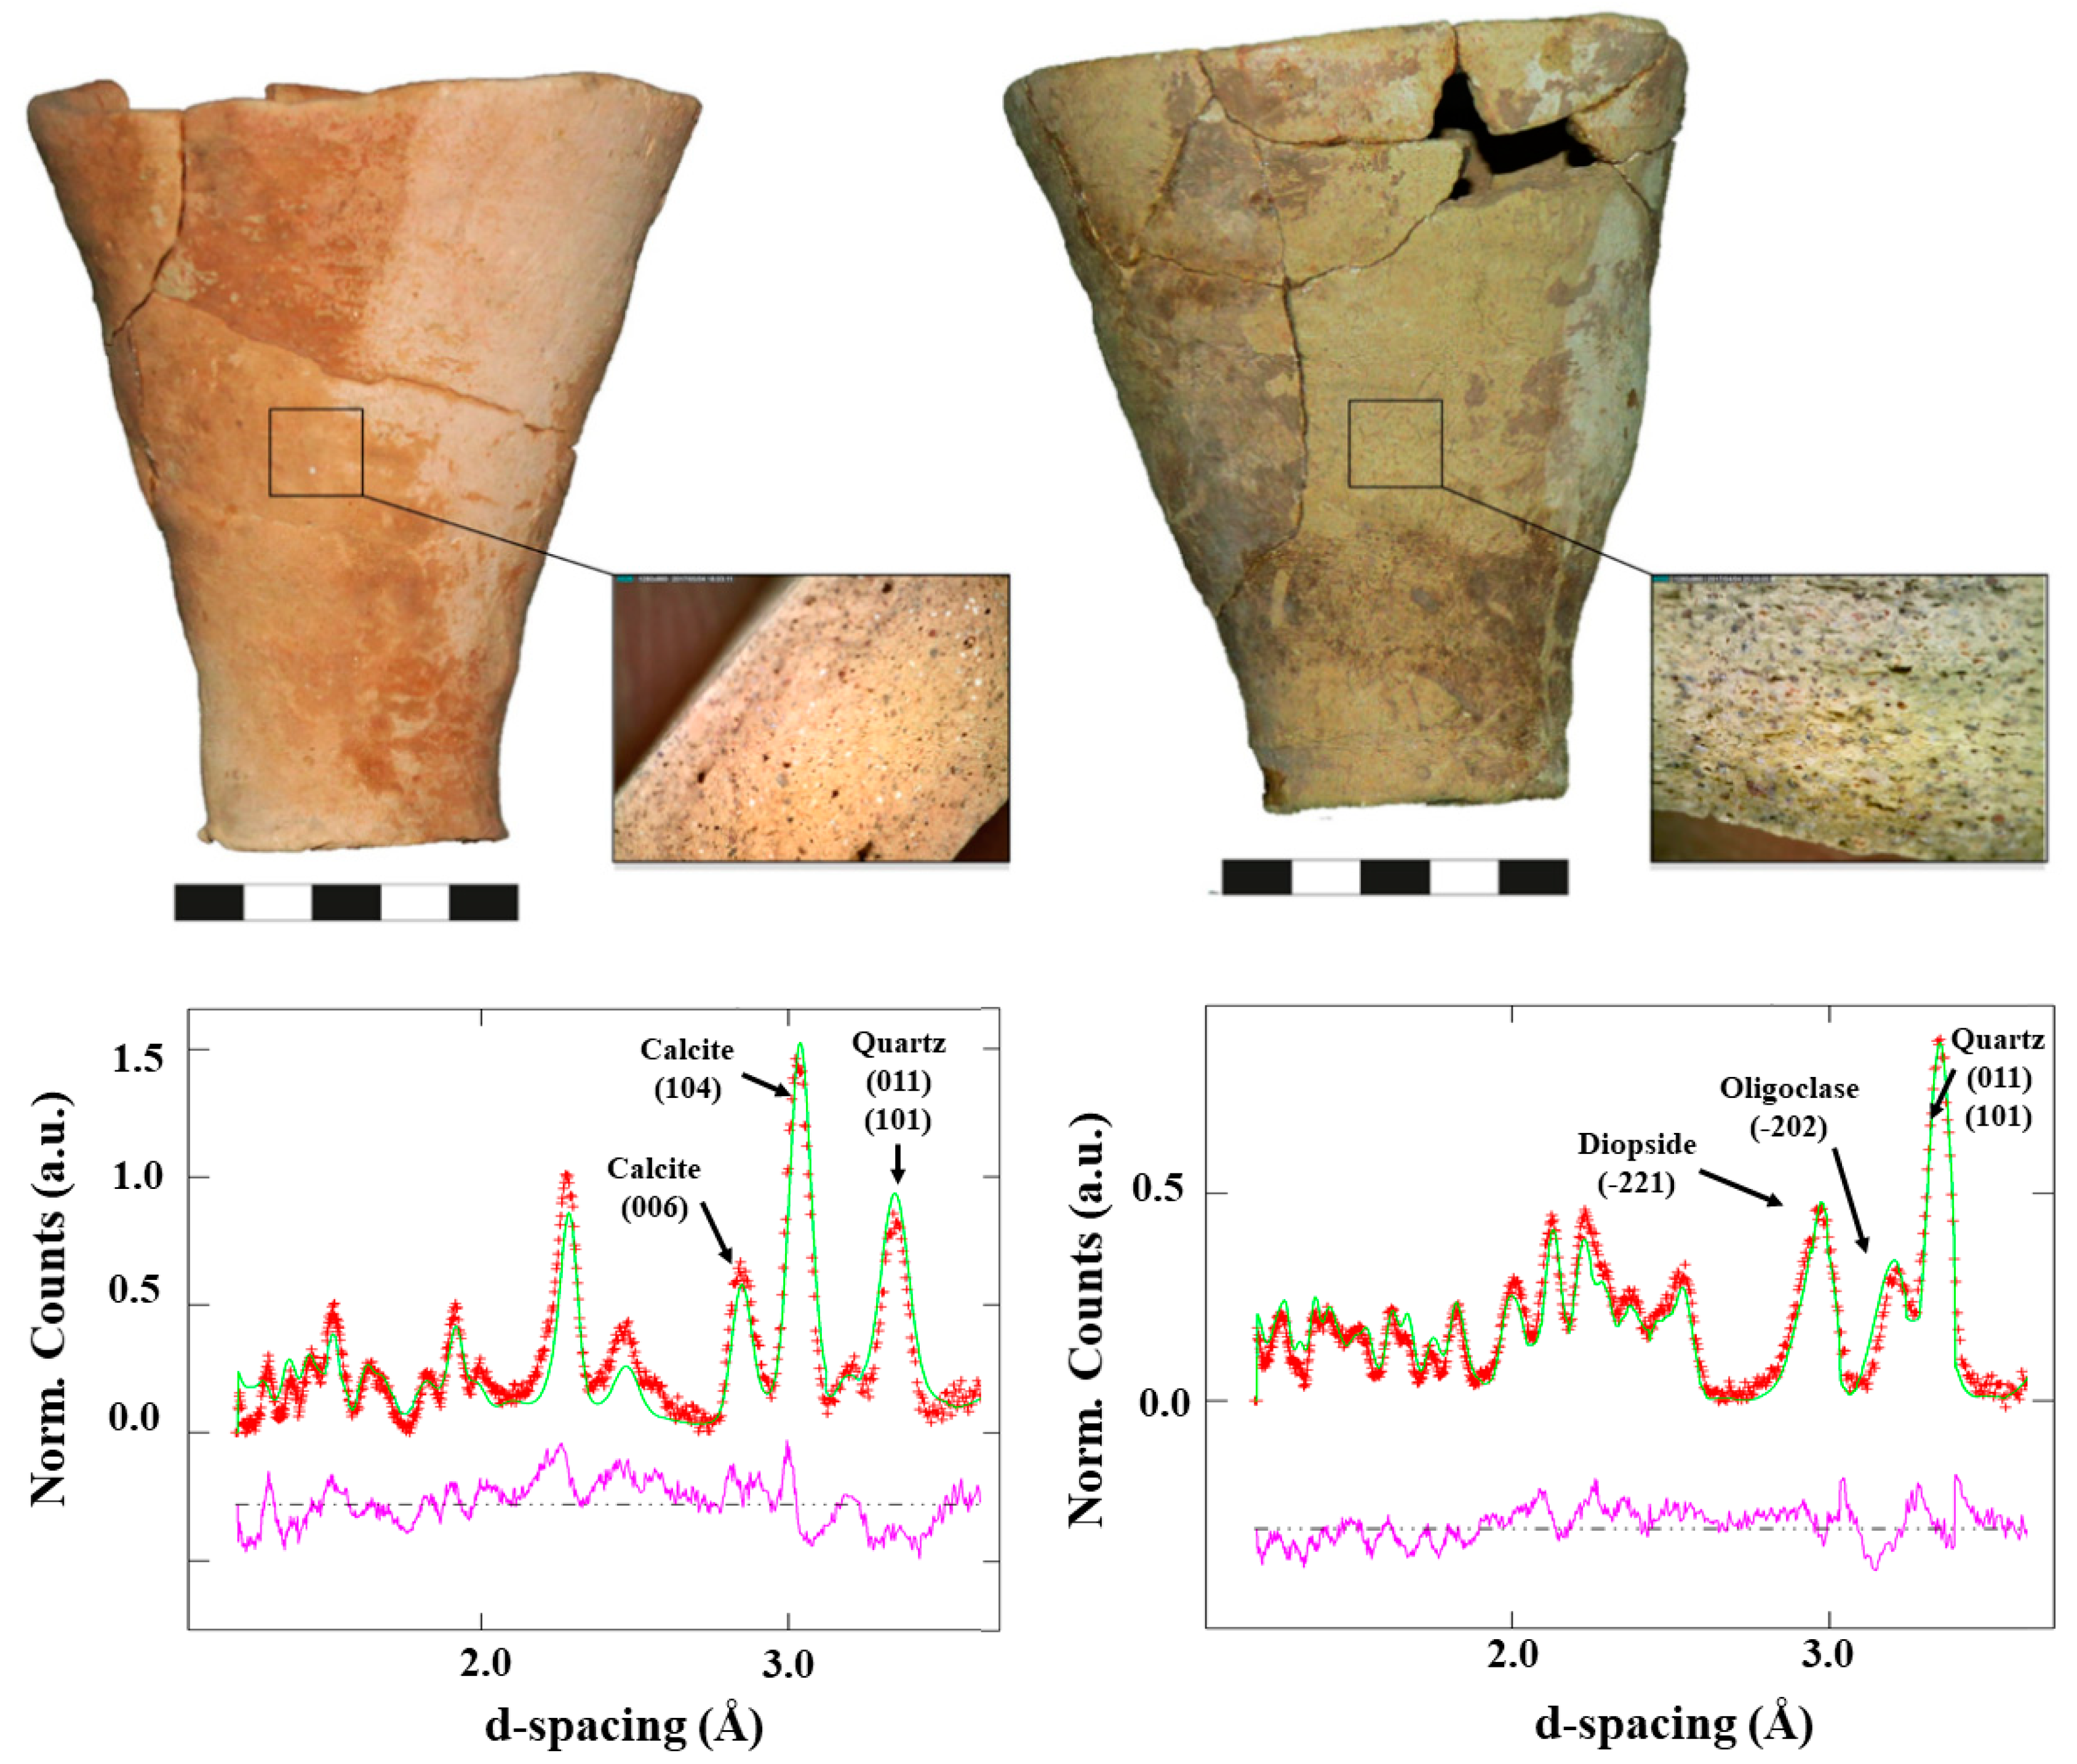
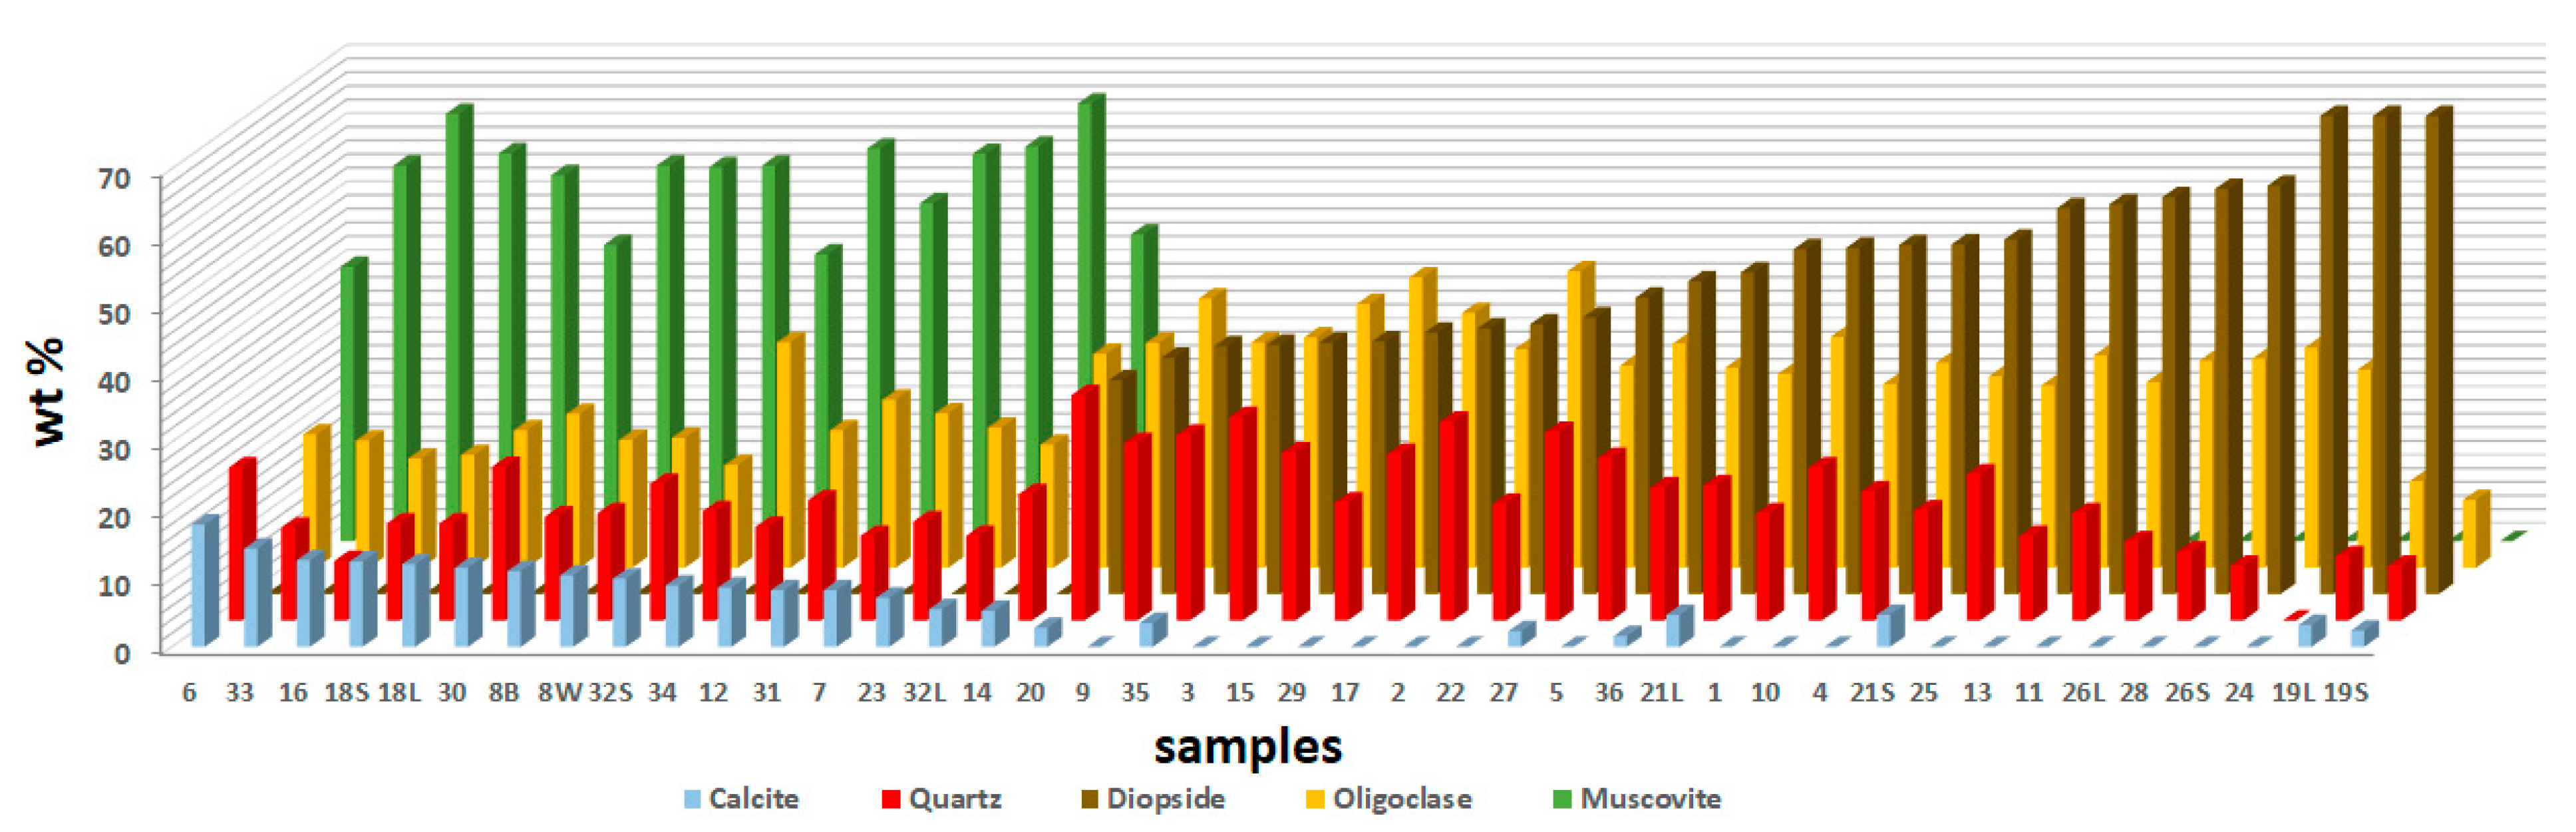
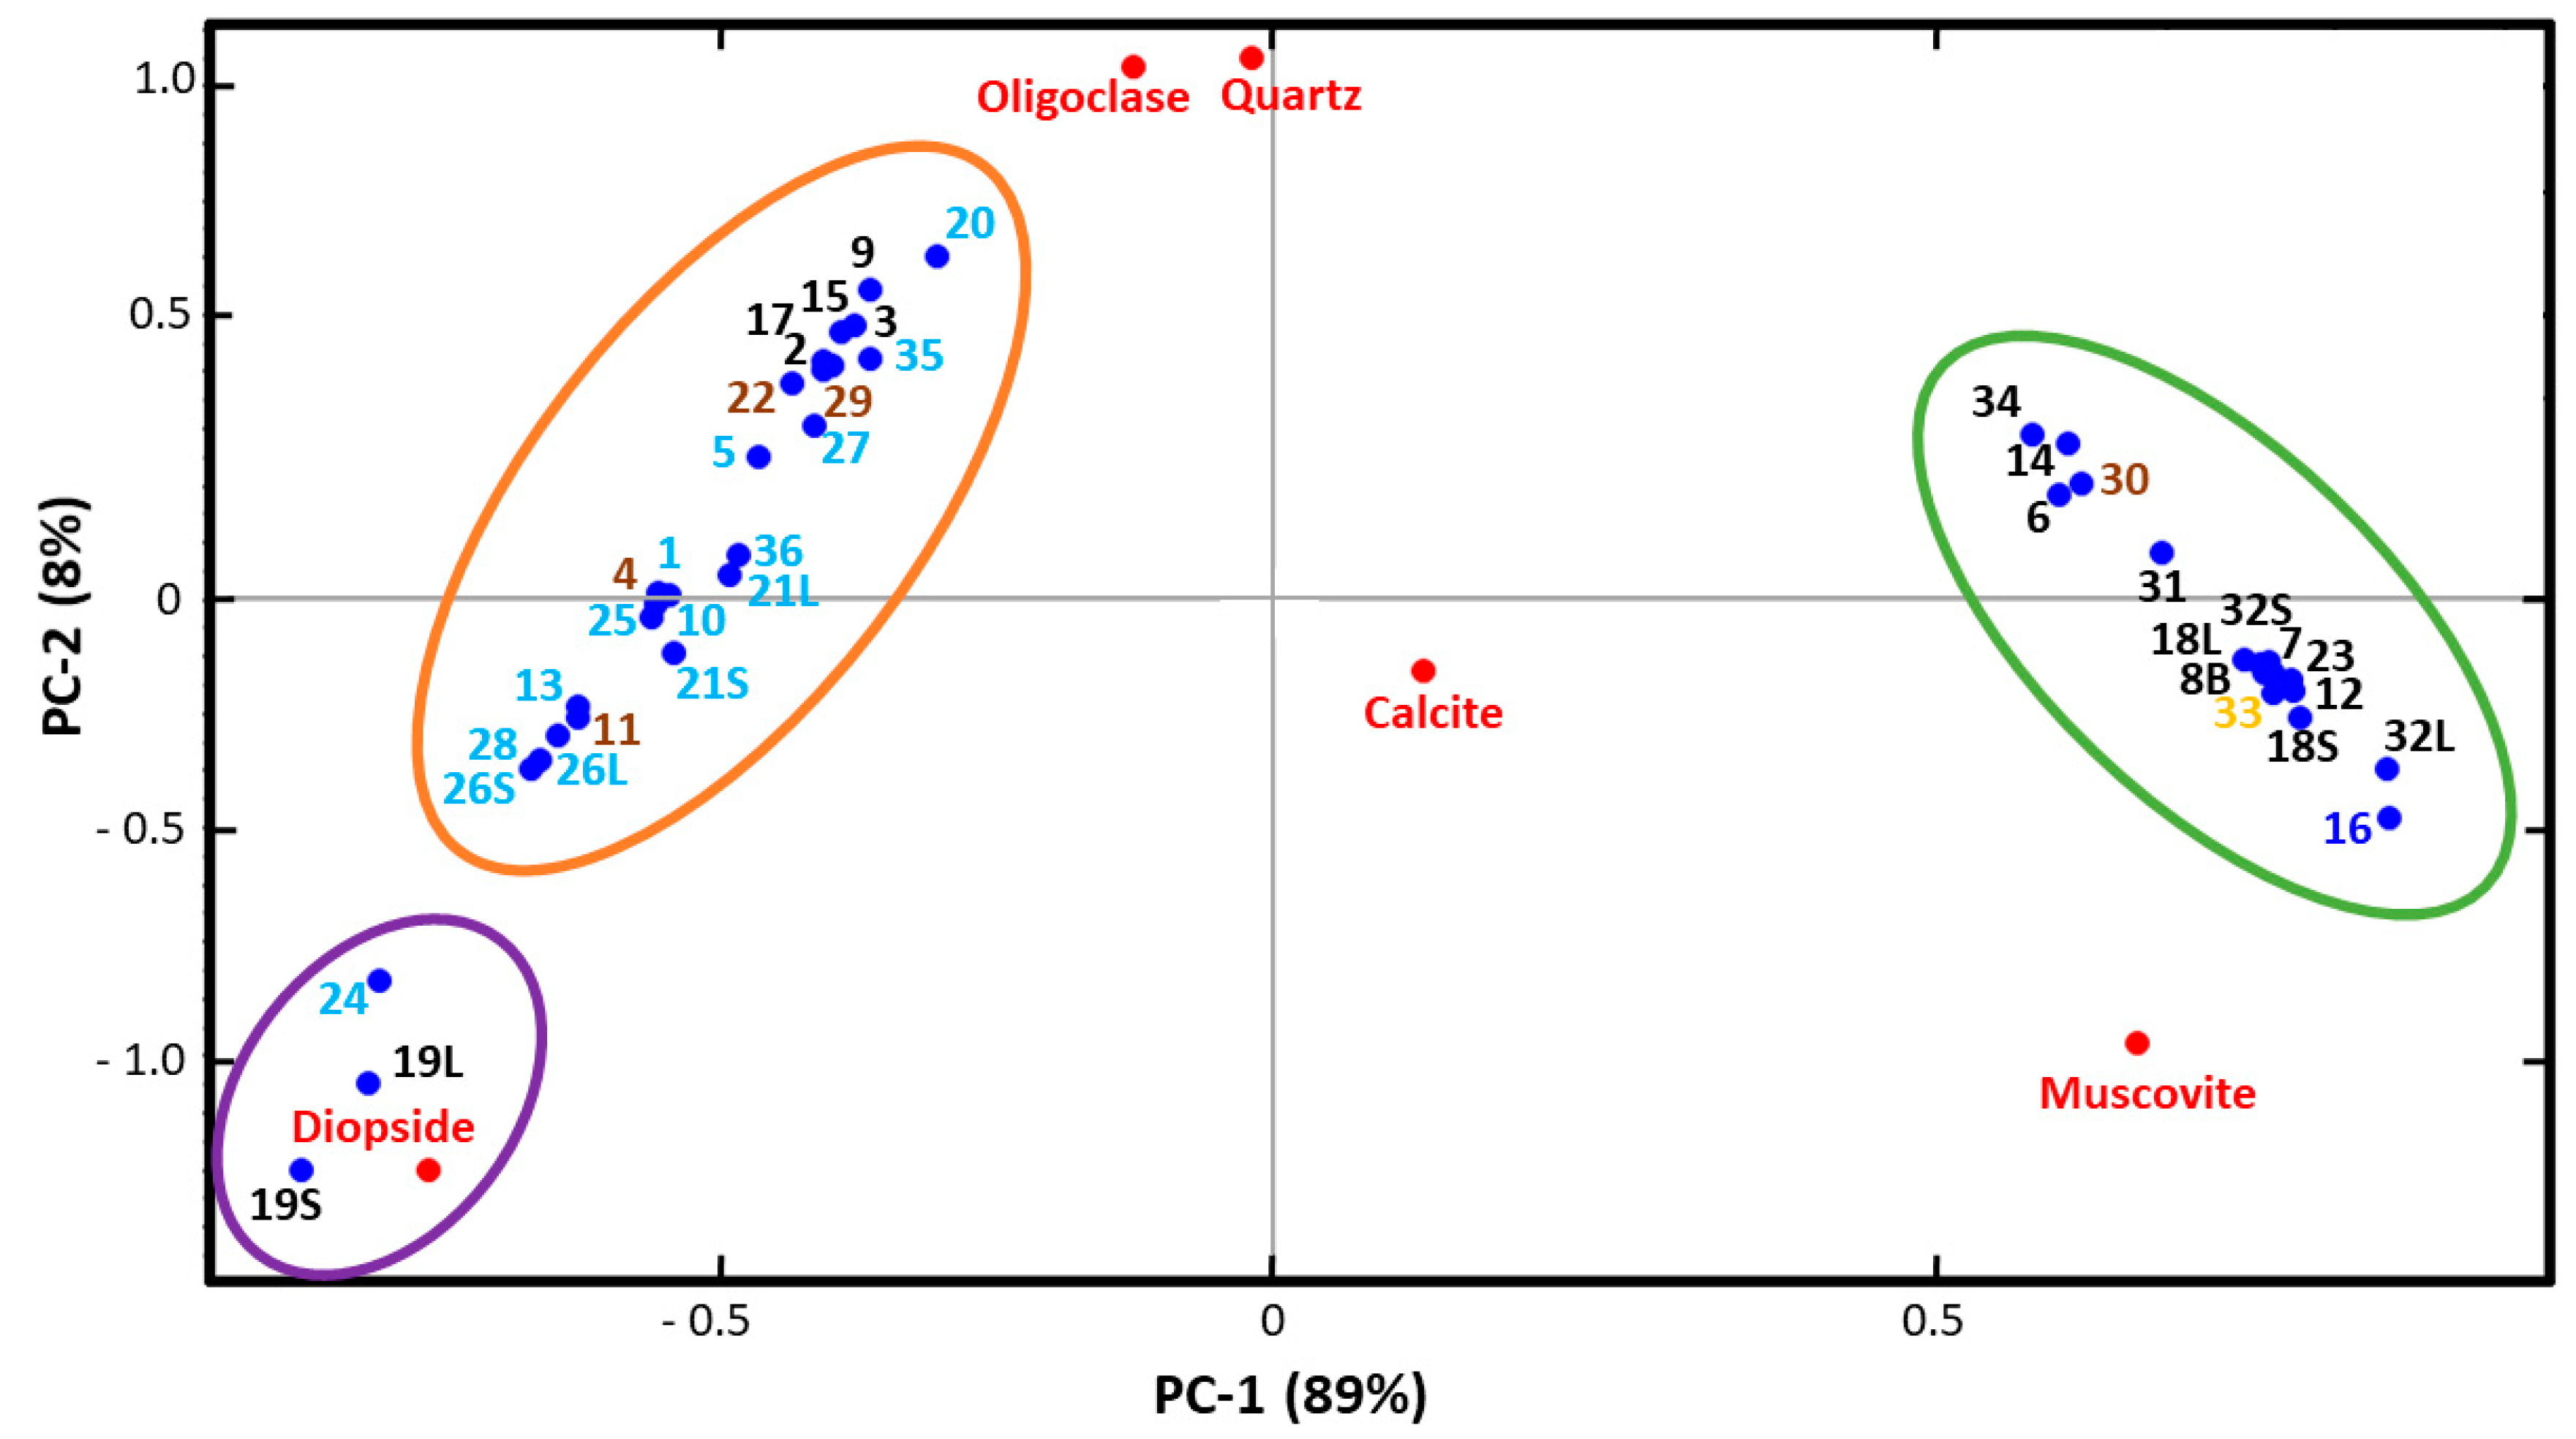
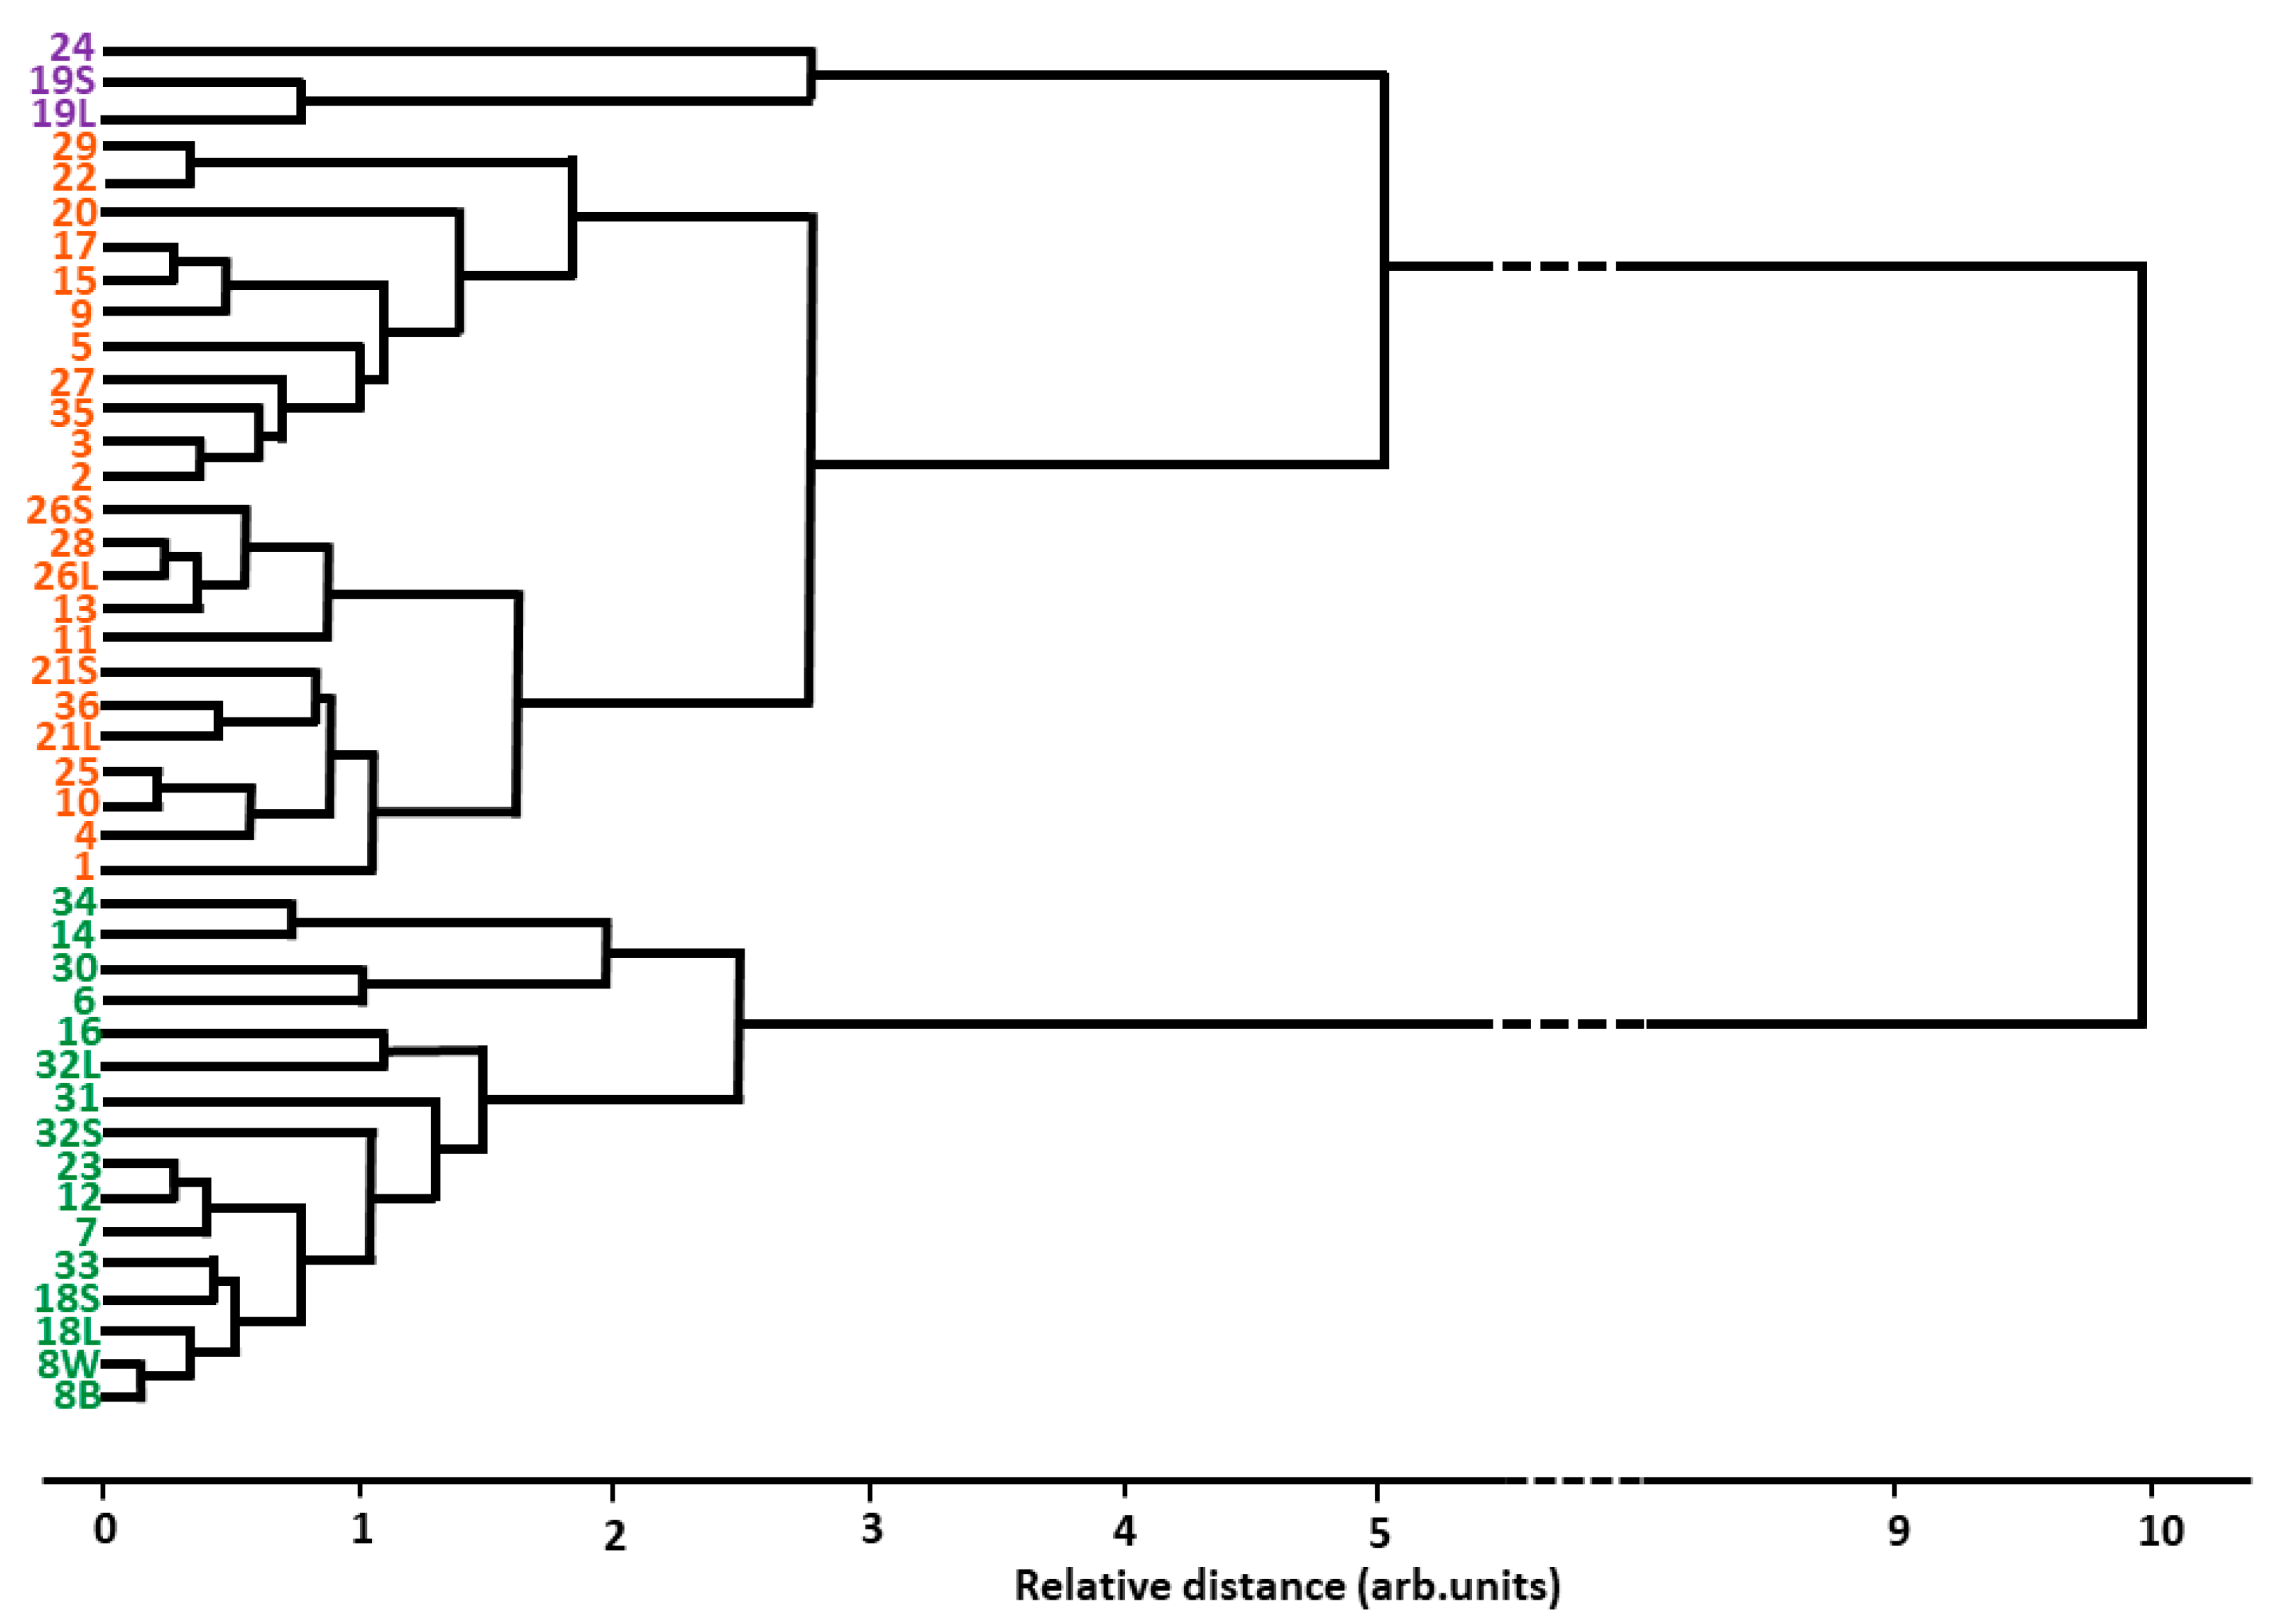
Measurements were carried out on the INES beamline, located at the ISIS Pulsed Neutron and Muon Source, Science and Technology Facility Council, UK. The instrument is a general-purpose powder diffractometer [38,39] where time of flight (TOF) neutron diffraction (ND) [39]. Nneutrons are a powerful tool to investigate the microscopic structure of materials in a non-destructive and non-invasive way. INES is equipped with 9 detector banks, each providing a full diffraction spectrum, of which each is in turn composed of 16 squashed 3He tubes with an active volume of 100 × 12.5 × 2.5 mm3. The wide angular range covered by the detectors (11.60–170.60 degree) together with the thermal neutron beam from the water moderator (incident wavelength range of 0.17–3.24 Å) covers a wide d-spacing range (between d = 0.1 Å and d = 16 Å) with high resolution up to Δd/d = 0.001.
The neutron diffraction process is described as the elastic scattering of the incident neutron beam by crystal planes (hkl), according to Bragg’s law. In the case of Time Of Flight (TOF) measurements, Bragg’s law nλ = 2dhkl sinθ0 can be rewritten as a relation between the TOF of neutrons scattered from a set of planes in the sample (TOF)hkl and the spacing between these planes, dhkl, as follows:
(TOF)hkl = (2mn/h)Ldhklsinθ0
where mn is the neutron mass, h is Planck’s constant, L is the flight path, dhkl is the d-spacing of the set of crystallographic planes hkl, and θ0 is a fixed scattering angle of a specific detector. The mean collection time was 3 h per sample and all the data were normalised to the intensity of the incident neutron beam.

3. Results

Recorded neutron diffraction spectra together with photographs of the corresponding samples are reported in Figure 3.
Diffraction data were analysed using the GSAS phase analysis software [40] and the EXPGUI (A Graphical User Interface for GSAS) [41], based on the Rietveld refinement method that provides weight fractions (wt (%)) of the phases present in the sample. Quantitative phase analysis is based on the principle that in a multi-phase sample each phase exhibits a unique set of diffraction peaks, and the peak intensity of a particular phase is proportional to its weight-fraction; the measured diffraction pattern is the weighted sum of all single-phase patterns. Quantitative diffraction results together with the classification and the sample thicknesses are reported in Table 1.
In Figure 4, the trend of the amount (wt %) of the detected phases (oligoclase, muscovite, calcite, quartz and diopside) through ND is shown.
Among the detected crystalline phases, phyllosilicate/mica (muscovite) and pyroxenes (diopside) represent track markers of firing processes [4]. In Figure 4, two main groups of samples are distinguishable. The first group (samples n. 6, 33, 16, 18S, 18L, 30, 8B, 8W, 32S, 34, 12, 31, 7, 23, 32L, 14) is characterised by the presence of calcite and phyllosilicate/mica (muscovite) while the second group (samples n. 9, 35, 3, 15, 29, 2, 22, 5, 36) is characterised by the presence of pyroxenes (diopside). Quartz presents a constant trend. In the second group, the primary calcite is completely transformed in diopside or calcite of secondary formation above 850 °C. Considering the temperature stability of the above mentioned phases, the range of firing for the set of samples can be ascribed between 800–1000 °C.
Relative weight percentages of the detected phases are analysed through a multivariate statistical approach carrying out correlation analysis namely principal component analysis (PCA) [42,43]. This technique has been successfully applied in archaeological contexts since the 1970s [43,44]. PCA is a projection method, an orthogonal bilinear matrix decomposition, where components or factors are obtained in a sequential way explaining the maximum variance where the distance between data points is the largest. These components are called principal components (PCs) and are orthogonal to each other. They are computed iteratively, in such a way that the first PC is the one that carries most information while the second PC will then carry the maximum share of the residual information (i.e., not taken into account by the previous PC). In order to classify samples and to distinguish among the most important variables to keep in a model (variables that characterise the population), a bi-plot (scores and loadings plotted together) was realised via Unscrambler X v10.3 software [45] taking into account a matrix of 42 × 5 where 42 is the number of the measurements and 5 is the total number of detected phases. In this case, the system is described by three principal components, explaining 99% of the total variance (PC1: 89%, PC2: 8%, and PC3: 2%). Singular value decomposition (SVD), which is a non-iterative algorithm that is generally used when there are few variables, and a cross method were applied to estimate the model stability and prediction ability [43]. Results are reported in Figure 5.
In order to find groups in the data without any predefined class structures, hierarchical cluster analysis (HCA) was carried out employing an average-linkage algorithm [46,47] and applying the Euclidean distance as the relative distance to define the number of the clusters, more appropriate for normalised data [46]. The dendrogram is reported in Figure 6, a visual analysis of the hierarchy classification according to the similarity of the samples: samples with similarities in composition are grouped according to their minimal relative distance (Euclidean relative distance). In the present case, the HCA is used to corroborate the macroscopic fabric classification. Figure 6 shows two main groups of clusters, highlighted in orange and green; the third cluster (coloured in violet and defined singletons), represented by samples number 24, 19S and 19L, is defined as a sub-group of the orange one. The singletons described the samples with a relative weight of diopside higher than 70%. Three clusters are also identified by ellipses in Figure 5. From Figure 6, the most similar samples are 8W and 8B (they are joint for first-minimal distance) as we expected because they are two fragments of the same vase. The following minimal relative distance is represented by samples n. 25 and n. 10, together with samples n. 28 and n. 26L, characterised by a fine-yellow-grained paste with inclusions. The three main groups, identified by the HCA, can be related to different grained pastes identified by macroscopic observations such as: (a) fine-yellow-colour-paste characterised by diopside, (b) fine-red-orange-grained paste characterised by muscovite and primary calcite, and (c) an intermediate group characterised by yellow paste colour with orange inclusions.
Therefore, PC1 in Figure 5 is attributed to the firing temperature reached (increasing with the decrease of PC1), and PC2 is attributed to the phase transitions as a function of temperature (i.e., from primary calcite to pyroxenes (diopside)).

4. Conclusions

The paper presents the systematic study, via non-destructive neutron diffraction, of 36 Sumerian pottery fragments from Abu Tbeirah (3rd millennium BC), Southern Iraq. Key results of this study were: (a) the identification of crystalline phases in the samples and (b) their classification by temperature markers through chemometric analyses of phase composition. Integration of such results with archaeological evidence and analyses permit a deeper understanding of Sumerian firing technology of this ancient period. A comparison of pottery samples with modern clay, gathered from the canal near the excavated site, suggests a local origin of the clay used for the Sumerian vases. Temperature marker classification allowed identification of three main clusters. They are characterised by: (a) red-orange paste with crystalline phase composition that indicates a firing temperature below 900°, with the coexistence of primary calcite and phyllosilicate/mica (muscovite); (b) yellow paste with orange inclusions with crystalline composition that indicates a firing temperature over 900°, with the coexistence of pyroxenes (diopside) with primary phases (such as feldspar (oligoclase) and quartz); (c) yellow paste with crystalline composition characterised by more than 70% relative weight fraction of pyroxenes (diopside) that indicates a firing temperature over 900°. The samples analysed are distributed according to an almost continuous temperature gradient.
In general, utilization of kilns has been associated with a firing temperature range between 750 °C and 1150 °C: the results presented here demonstrate that temperatures reached during firing never exceeded 900–1000 °C. Kiln firing is considered a more advanced technology compared to open or pit-fires, which are usually not considered adequate for reaching these temperatures. The presence of the kilns is confirmed in the Mesopotamian archaeological record for earlier periods, but the coeval presence of the other firing methodologies, such as pit-firings, was neglected by archaeologists in the previous century. The indication of the maximum temperatures reached during firing of Abu Tbeirah pottery together with the absence of kiln traces in the archaeological site provides a valid argument to hypothesize the use of pit-firing for pottery production.

Author Contributions

G.F. coordinated the experiments, data analysis and manuscript writing. L.R. wrote the historical account and sample’s description (§§ 1.1; 2.2); V.F. made the autoptic subdivision (§2.1) and M.N. G.F. and C.S. performed the chemometrics data analysis and the mineralogical compositional discussion. A.S. contributed to the experiments and the data processing at the INES beamline. C.A. and F.D. contributed to the theoretical discussion and the manuscript. R.S. discussed the results and contributed to the manuscript. The introduction and conclusion are common work of the authors.

Acknowledgments

This research is supported by CNR, within the CNR-STFC Agreement 2014–2020 (N. 3420), concerning collaboration in scientific research at the ISIS Spallation Neutron Source.

Conflicts of Interest

The authors declare no conflict of interest.

References

  1. Rice, P.M. Pottery Analysis: A Sourcebook. The Raw Materials of Pottery Making: Perspectives from Chemistry, Geology, and Engineering; University of Chicago Press: Chicago, IL, USA, 2015. [Google Scholar]
  2. Bland, C.; Roberts, A.L.; Popelka-Filcoff, R.S.; Santoro, C.M. Early vitrification stages identified in prehistoric earthenware ceramics from northern Chile via SEM. J. Archaeol. Sci. Rep. 2017, 16, 309–315. [Google Scholar] [CrossRef]
  3. Cardiano, P.; Ioppolo, S.; De Stefano, C.; Pettignano, A.; Sergi, S.; Piraino, P. Study and characterization of the ancient bricks of monastery of “San Filippo di Fragalà” in Frazzanò (Sicily). Anal. Chim. Acta 2004, 519, 103–111. [Google Scholar] [CrossRef]
  4. De Bonis, A.; Cultrone, G.; Grifa, C.; Langella, A.; Leone, A.P.; Mercurio, M.; Morra, V. Different shades of red: The complexity of mineralogical and physico-chemical factors influencing the colour of ceramics. Ceram. Int. 2017, 43, 8065–8074. [Google Scholar] [CrossRef]
  5. De Benedetto, G.E.; Laviano, R.; Sabbatini, L.; Zambonin, P.G. Infrared spectroscopy in the mineralogical characterization of ancient pottery. J. Cult. Herit. 2002, 3, 177–186. [Google Scholar] [CrossRef]
  6. El Ouahabi, M.; Daoudi, L.; Hatert, F.; Fagel, N. Modified Mineral Phases During Clay Ceramic Firing. Clays Clay Miner. 2015, 63, 404–413. [Google Scholar] [CrossRef]
  7. Moorey, P.R.S. Ancient Mesopotamian Materials and Industries: The Archaeological Evidence; Eisenbrauns: Warsaw, IN, USA, 1994; p. 144. [Google Scholar]
  8. Armstrong, J.A.; Gasche, H. Mesopotamian Pottery. A Guide to the Babylonian Tradition in the Second Millennium B.C; The University of Ghent: Ghent, Belgium; The Oriental Institute of the University of Chicago: Chicago, IL, USA, 2014; p. 83. [Google Scholar]
  9. Smith, A.L. Bonfire II: The Return of Pottery Firing Temperatures. J. Archaeol. Sci. 2008, 28, 991–1003. [Google Scholar] [CrossRef]
  10. Squires, G.L. Introduction to the Theory of Thermal Neutron Scattering; Cambridge University Press: Cambridge, MA, USA, 1978. [Google Scholar]
  11. Bland, C.; Roberts, A.L.; Popelka-Filcoff, R.; Santoro, C.; Carter, C.; Bennett, J.; Stopic, A. 1500 years of pottery: Neutron activation analysis of northern Chilean domestic ceramics from Caleta Vitor and clay samples from nearby valley and highland contexts. Archaeometry 2017, 59, 815–833. [Google Scholar] [CrossRef]
  12. D’Agostino, F.; Romano, L. Rediscovering Sumer. Excavations at Abu Tbeirah. Southern Iraq. In My Life Is Like the Summer Rose; Cerasetti, B., Lamberg-Karlovsky, C.C., Eds.; Maurizio Tosi e l’Archeologia Come Modo di Vivere. Papers in Honour of Maurizio Tosi for His 70th Birthday; BAR-IS 2690; Archaeopress: Oxford, UK, 2014; pp. 163–167. [Google Scholar]
  13. D’Agostino, F.; Kadhem, A.; Romano, L.; Vidale, M.; Angelozzi, M. Abu Tbeirah. Preliminary Report of the First Campaign (January–March 2012). Rivista Degli Studi Orientali 2011, 84, 17–34. [Google Scholar]
  14. D’Agostino, F.; Romano, L. Abu Tbeirah. Preliminary Report of the 2012–2013 Campaigns. In Proceedings of the 9th International Congress on the Archaeology of the Ancient Near East, Basel, Switzerland, 9–13 June 2014; Kaelin, R.S.O., Mathys, H.-P., Eds.; Harrassowitz: Wiesbaden, Germany, 2014. [Google Scholar]
  15. D’Agostino, F.; Romano, L.; Khadem, A.; Tafuri, M.A. Abu Tbeirah. Preliminary Report of the Second Campaign (October–December 2012). Rivista Degli Studi Orientali 2013, 86, 69–92. [Google Scholar]
  16. D’Agostino, F. Rediscovering and Revitalizing the History of Iraq: The Excavations at Abu Tbeirah. In Strategie e Programmazione della Conservazione e Trasmissibilità del Patrimonio Culturale; Filipovic, A., Troiano, W., Eds.; Italian Heritage Awards; Edizioni Scientifiche Fidei Signa: Roma, Italy, 2013; pp. 212–221. [Google Scholar]
  17. D’Agostino, F.; Romano, L.; Kadhem Ghanim, A. Abu Tbeirah. Nasiriyah (Southern Iraq). Preliminary Report on the 2013 Excavation Campaign. Available online: https://revistas.uam.es/isimu/article/view/3209 (accessed on 29 January 2019).
  18. Nardini, M.; Andreani, C.; Senesi, R.; Scherillo, A.; D’Agostino, F.; Romano, L.; Scatigno, C.; Festa, G. Neutron Resonance Capture Analysis and chemometric tools: An integrated approach. J. Phys. Conf. Ser. 2018, 1055, 012005. [Google Scholar] [CrossRef]
  19. Postma, H.; Schillebeeckx, P. Non-destructive analysis of objects using neutron resonance capture. J. Radioanal. Nucl. Chem. 2005, 265, 297–302. [Google Scholar] [CrossRef]
  20. Thuesen, I.; Heydorn, K.; Gwozdz, R. Investigation of 5000-Year-Old Pottery from Mesopotamia by Instrumental Neutron Activation Analysis. In Proceedings of the Second Nordic Conference on the Application of Scientific Methods in Archaeology, Helsingør, Denmark, 17 August–19 August 1981; Mejdahl, V., Ed.; Council of Europe: Strasbourg, France, 1982; Volume 2, pp. 375–381. [Google Scholar]
  21. Mynors, H.S. An Examination of Mesopotamian Ceramics Using Petrographic and Neutron Activation Analysis. In Proceedings of the 22nd Symposium on Archaeometry Held at the University of Bradford, Bradford, UK, 30 March–3 April 1982; Aspinall, A., Warren, S., Eds.; University of Bradford: Bradford, UK, 1983; pp. 377–387. [Google Scholar]
  22. Mynors, H.S.; Al Kaissi, B. Ceramic Analyses of Mesopotamian Wares in the Early Dynastic Period. In Research on the Antiquities of Saddam Dam Basin Salvage and Other Researches; Republic of Iraq, Ministry of Culture and Information, State Organization of Antiquites and Heritage: Baghdad, Iraq, 1987; pp. 134–154. [Google Scholar]
  23. Méry, S.; Schneider, G. Mesopotamian Pottery Wares in Eastern Arabia from the 5th to the 2nd Millennium BC: A Contribution of Archaeometry to the Economic History. In Proceedings of the Twenty-Ninth Meeting of the Seminar for Arabian Studies, Cambridge, UK, 20–22 July 1995; Archaeopress Publishing Ltd.: Oxford, UK, 1996; Volume 26, pp. 79–96. [Google Scholar]
  24. McGibson, G. Uch Tepe II: Technical Reports; The Oriental Institute of the University of Chicago: Chicago, IL, USA, 1990. [Google Scholar]
  25. Sanjurjo-Sánchez, J.; Montero Fenollós, J.L.; Polymeris, G.S. Technological aspects of Mesopotamian Uruk pottery: Estimating firing temperatures using mineralogical methods, thermal analysis and luminescence techniques. Archaeol. Anthropol. Sci. 2018, 10, 849–864. [Google Scholar] [CrossRef]
  26. Verhoeven, K. Geomorphological Research in the Mesopotamian Flood Plain. In Changing Watercourses in Babylonia. Towards a Reconstruction of the Ancient Environment in Lower Mesopotamia; Gasche, H., Tanret, M., Eds.; Volume I. Mesopotamian History and Environment. Series II. Memoirs V; The University of Ghent: Gent, Belgium, 1998; pp. 159–240. [Google Scholar]
  27. Yacoub, S.Y. Stratigraphy of the Mesopotamia Plain. Iraqi Bull. Geol. Min. 2011, 4, 47–82. [Google Scholar]
  28. Al-Asadi, M.M.M. The Sedimentary Model of Thi-Qar Governorate During the Holocene. South West Iraq. J Basrah Res. (Sci.) 2007, 33, 91–101. [Google Scholar]
  29. Sissakian, V.K.; Saeed, Z.B. Lithological Map of Iraq. Compiled Using GIS Techniques. Iraqi Bull. Geol. Min. 2012, 8, 1–13. [Google Scholar]
  30. Alfatlawi, E.A.M. Swelling Potential and Mineralogy of Thi-Qar University Soil. J. Thi-Qar Univ. 2011, 7, 1–15. [Google Scholar]
  31. Al-Mukhtar, L.E. Heavy Mineral Analysis of the Quaternary Sediments in the Southern Part of the Mesopotamia Plain, Iraq. Iraqi Bull. Geol. Min. 2015, 11, 59–73. [Google Scholar]
  32. Ali, M.Y.; Watts, A.B.; Searle, M.P. Seismic stratigraphy and subsidence history of the United Arab Emirates (UAE) rifted margin and overlying foreland basins. In Lithosphere Dynamics and Sedimentary Basins: The Arabian Plate and Analogues; Springer: Berlin/Heidelberg, Germany, 2013; pp. 127–143. [Google Scholar]
  33. Erb-Satullo, N.L. Alloys from Anau: The Manipulation of Metallic Properties in 3rd Millennium B.C. Southern Central Asia. MRS Proc. 2011, 1319. [Google Scholar] [CrossRef]
  34. Courty, M.A.; Roux, V. Identification of Wheel-Throwing on the Basis of Ceramic Surface Features and Microfabrics. J. Archaeol. Sci. 1995, 22, 17–50. [Google Scholar] [CrossRef]
  35. Courty, M.A.; Roux, V. Identification of Wheel-Fashioning Methods: Technological Analysis of 4th-3rd Millennium BC Oriental Ceramics. J. Archaeol. Sci. 1998, 25, 747–763. [Google Scholar]
  36. Romano, L. A Fragment of a Potter’s Wheel from Abu Tbeirah. Zeitschrift für Assyriologie 2015, 105, 220–234. [Google Scholar] [CrossRef]
  37. Roux, V.; Rosen, S. An Introduction to Technological Studies in the Archaeology of the Proto-Historic and Early Historic Periods in the Southern Levant. In Techniques and People: Anthropological Perspectives on Technology in the Archaeology of the Proto-Historic and Early Historic Periods in the Southern Levant; Rosen, S., Roux, V., Eds.; De Boccard: Paris, France, 2009; pp. 11–22. [Google Scholar]
  38. Imberti, S.; Kockelmann, W.; Celli, M.; Grazzi, F.; Zoppi, M.; Botti, A. Neutron diffractometer INES for quantitative phase analysis of archaeological objects. Meas. Sci. Technol. 2008, 19, 034003. [Google Scholar] [CrossRef] [Green Version]
  39. Windsor, C.G. Pulsed Neutron Scattering; Taylor and Francis: London, UK, 1981. [Google Scholar]
  40. Larson, A.C.; von Dreele, R.B. GSAS: General Structure Analysis System; Report LAUR 86-748; Los Alamos Laboratory: Los Alamos, NM, USA, 1986. [Google Scholar]
  41. Toby, B.H. EXPGUI, a graphical user interface for GSAS. J. Appl. Cryst. 2001, 34, 210–213. [Google Scholar] [CrossRef]
  42. Jolliffe, I.T. Principal Component Analysis; Springer: Berlin, Germany, 1986; p. 487. ISBN 978-0-387-95442-4. [Google Scholar]
  43. Husson, F.; Lê, S.; Pagès, J. Exploratory Multivariate Analysis by Example Using R; The R Series; Chapman & Hall/CRC: London, UK, 2009; 224p, ISBN 978-2-7535-0938-2. [Google Scholar]
  44. Baxter, M.J. Exploratory Multivariate Analysis in Archaeology; Edinburgh University Press: Edinburgh, UK, 1994. [Google Scholar]
  45. Available online: https://www.camo.com/unscrambler/ (accessed on 29 January 2019).
  46. Arai, K.; Barakbah, A.R. Hierarchical K-means: An algorithm for centroids initialization for K-means. Rep. Fac. Sci. Eng. 2007, 36, 25–31. [Google Scholar]
  47. Anderberg, M.R. Cluster Analysis for Applications, 1st ed.; No. OAS-TR-73-9; Elsevier: New York, NY, USA, 1973. [Google Scholar]
Figure 1. Map of Mesopotamia with the sites, reported in red, whose pottery has been analysed in previous studies. The Abu Tbeirah site is marked with a yellow star.
Geosciences 09 00074 g001
Figure 2. A selection of the pottery and clay samples analysed, divided according to the fabric classification. Photos of the fragments were acquired through a portable digital microscope. The average thickness of the samples spans between 0.5 cm and 2.3 cm.
Geosciences 09 00074 g002
Figure 3. Two Sumerian pottery vessels studied via neutron diffraction; diffraction spectra (bank n. 8) of the two vases are also reported in red (normalised number of counts as a function of d-spacing). Best fit of data (green line) is also shown together with the residue, reported in violet, and the labelling of the main diffraction peaks.
Geosciences 09 00074 g003
Figure 4. Histogram based on neutron diffraction quantitative results. The x-axis reports the number of the sample as a function of the increasing percentage of diopside; the y-axis reports the weight percentage of the detected crystal phase; z-axis reports the detected phases (yellow—feldspar (oligoclase), green—phyllosilicate/mica (muscovite), blue—calcite, red—quartz, brown—pyroxenes (diopside)).
Geosciences 09 00074 g004
Figure 5. Principal component analysis (PCA). Bi-plot of the investigated samples. The scores plot is reported in blue and identifies the measurements while the loadings plot is reported in red and identifies the detected phases; the ellipses highlights the three groups identified through the hierarchical cluster analysis. The name of the samples is coloured as a function of the main fabrics (A = black, B1–B2 = light blue, C = yellow, D1–D2 = brown).
Geosciences 09 00074 g005
Figure 6. Average linking clustering using Euclidean distance. The dendrogram shows three main groups (numbers underlined as violet, orange and green) among the diffraction dataset (Table 1) as a function of the relative distance, identifying the similarity of the pottery samples.
Geosciences 09 00074 g006
Table 1. Results of neutron diffraction analysis on the Sumerian pottery samples and fabric classification. The weight percentages of the detected phases [wt (%)] are reported. The errors are ±0.1 wt%.
SampleFabricThickness (cm)CalciteQuartz (Pyroxenes)
Diopside
(Feldspar)
Oligoclase
(Phyllosilicate/mica)
Muscovite
1B20.6-15.750.533.8-
2A0.7-29.138.932.0-
3A0.9-29.836.533.7-
4D21.9-18.951.130.0-
5B10.7-23.843.432.8-
6A0.617.922.4-19.540.2
7A0.88.312.4-22.656.7
8B*A0.611.115.2-18.755.0
8W*A0.610.515.7-19.054.8
9A0.7-26.034.639.4-
10 B10.7-22.450.726.9-
11B21.2-15.757.127.2-
12A1.08.713.7-20.157.5
13B20.5-12.456.5 31.1-
14A0.85.318.5- 31.344.9
15A0.5-24.636.8 38.6-
16Modern clay1.012.78.7- 16.0 62.6
17A0.7-24.438.3 37.3-
18L*A0.712.114.2-20.153.6
18S*A0.712.514.2-16.556.8
19L*A0.63.29.474.712.7-
19S*A0.62.48.079.79.9-
20B10.72.833.031.332.9-
21L*B20.74.719.847.128.4-
21S*B20.74.716.151.228.0-
22D21.7-17.139.543.4-
23A1.07.214.5-20.557.8
24B20.7--71.029.0-
25B20.7-21.451.926.7-
26L*B20.6-11.658.130.3-
26S*B20.6-8.059.832.2-
27B10.72.327.640.529.6-
28B20.6-10.159.330.6-
29D22.3-17.337.042.5-
30D11.711.622.5-22.543.4
31A0.98.317.6-24.649.5
32L*A1.05.512.4-18.064.1
32SA1.010.020.0-15.055.0
33C0.814.413.6-18.655.0
34A0.79.016.0-33.042.0
35B20.83.527.236.333.0-
36B20.81.619.545.829.3-
B = black, W = white, L = large, S = small.

