Abstract
The heavy rain disaster occurred in July 2017, in northern Kyushu, Japan. The river environment greatly changed due to sediment moving accompanied by erosion. It is important regarding disaster prevention to localize watersheds where sediment transportation is active. In this study, the sediment dynamics were discussed on the basis of our investigation about the stored sediment, water-flow, and silica fluxes from sub-basins. As a result, the sediment survey revealed that many sediments consist of sand or gravel and were moved secondarily by water-flow. By the hydrological survey, it was confirmed that the trend of the dissolved silica concentrations varied between the right and the left bank tributaries. It was suggested that the left bank tributaries have a various process of water-flow. Considering the distribution of collapsed slopes, the right bank tributaries have more collapsed slopes than the left bank tributaries. As suggested by the results, the range of the silica flux is wider at the left bank tributaries because the sedimentation shows various distributions. On the other hand, the right bank tributaries were estimated topographically stable since the value of the silica flux is about the same.
1. Introduction
The July 2017 disaster occurred during heavy rain, in northern Kyushu of Japan, causing serious damage to houses and river structures and producing large amounts of sediment and driftwood. More than half of the 300 reported cases of damage due to the heavy rainfall were caused by debris flows [1]. Examining the damage, it was clear that excessive sediment had been supplied from the upstream area of the Otoishi River and the damage had spread to the river valley plain due to a blockage in the river. Such a phenomenon occurred due to the over deposition because the river was clogged with the disaster waste such as driftwood and sediments. Recently, various studies were conducted about driftwood such as the influence of driftwood on structures and the behavior accompanying debris flow [2,3]. In addition, as a result of this disaster, slopes have been left structurally fragile and there is concern about the recurrence of a sediment disaster. The production of sediment is likely to occur because traces of past sediment movements were confirmed from the current study’s field surveys. While the sediment disasters in the mountain area usually occur as multiple phenomena such as sediment transport, slope failures and flood, most of the existing warning systems or disaster prevention plans only consider a single hazard. A comprehensive evaluation is required for preventing such a phenomenon [4].
The safety of the river structure and the stability of the slopes should be evaluated before disasters. It is difficult to make countermeasures against heavy rain, which has been increasing recently [5] because many sites are dangerous from the disasters. Generally, the priority is determined by using statistical data or statistical models [6,7] to identify the more dangerous sites for the disasters. However, the disasters cannot be predicted by statistics in research sites which have no data on past disasters. As a fundamental study to predict the occurrence of the sediment disasters due to topography and geology, this paper discusses the relationship between slope failures and the water-flow.
In the current study, sediment deposition and slope failure locations were investigated and the distribution of silica fluxes in the mainstream and/or tributaries were observed in the Otoishi River basin, Asakura City, Fukuoka Prefecture. The sediment dynamics of the basin were also investigated on the basis of the observed sedimentation, silica fluxes, and characteristics of the catchment’s topography.
The river varied greatly because of the inflow of sediment from each sub-basin. The effects of the disaster were represented by various phenomena like erosion, sedimentation, and destruction of artificial structures. Due to this complex situation, it was necessary to investigate what types of phenomenon had occurred. The produced sedimentation was classified by its structure and thickness based on the distribution of slope failures.
Silica flux from the mountainous regions can be explained by the water-rock reaction [8] and this value is often used as an indicator of long-term rock weathering [9] because it is easily observed. Silica fluxes are also used in the research of short-term hydrological phenomena, such as temporal changes in the water discharge from mountain streams due to rainfall [10] because the water-rock reaction elutes the silica easily from the soil.
The catchment topography was analyzed using a model equation for topographical analysis [11] by Ikemi et al. [12]. In the analysis, the topographical development was evaluated using topographical parameters like catchment area and slope gradient. The difference in the topographical development was analyzed as the difference in the values between the left sub-basin and the right sub-basin of the Otoishi River basin. It was expected that the sediment dynamics would be evaluated according to this difference.
2. Study Area
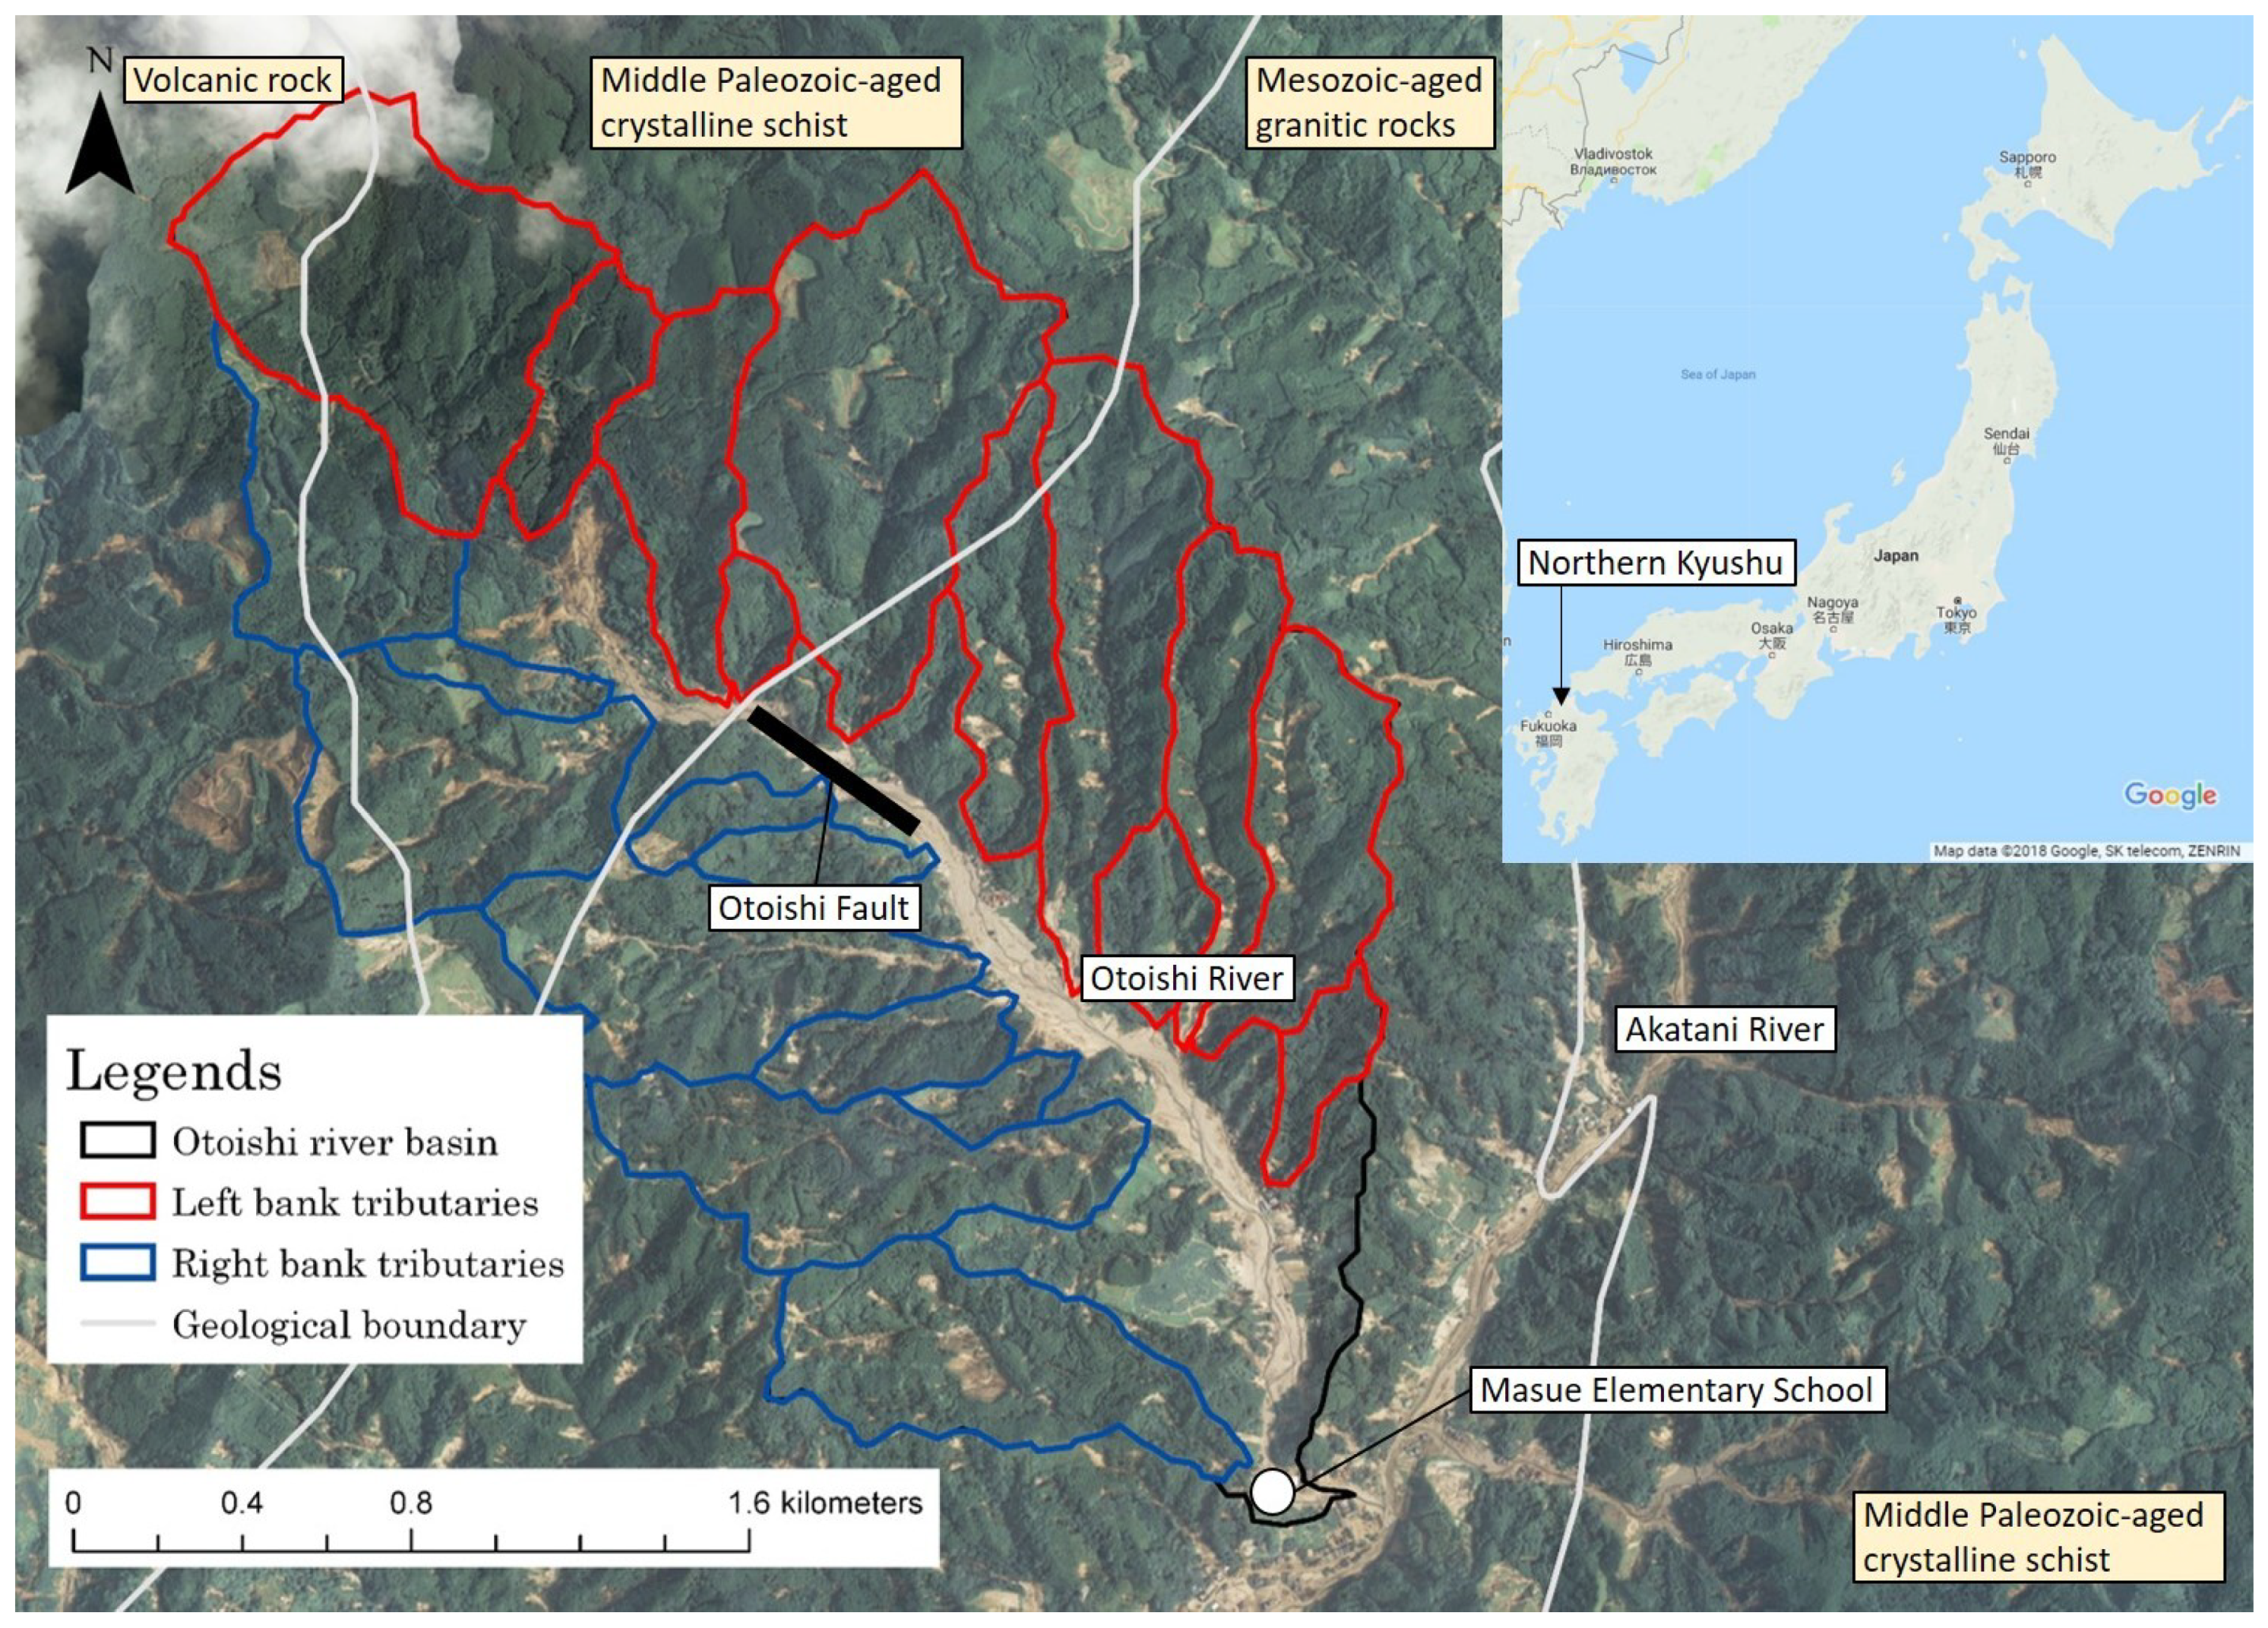
Figure 1 shows the Otoishi River basin study area. The river is a tributary, on the right bank, to the Akatani River, which is a branch of the Chikugo River [13,14] that flows through Asakura City, Fukuoka Prefecture, Japan. The mainstream direction of the Otoishi River is toward the northwest-southeast and the watershed is surrounded by three mountains. The catchment area is 5.9 km2 and consists of 20 or more small tributary areas. The tributaries are regularly aligned—the tributaries on the right bank are aligned in an east-west direction and the tributaries on the left bank are aligned in a north-south direction.
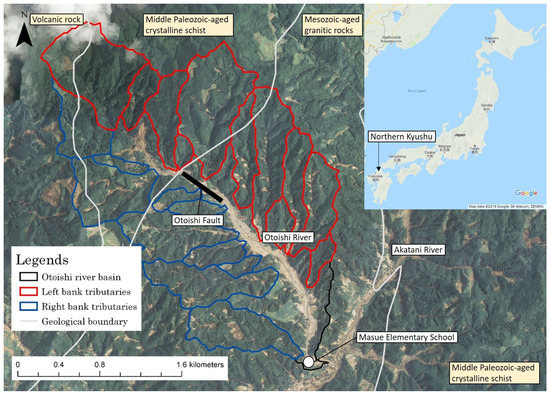
Figure 1.
Map of the Otoishi River basin (the background picture is an aerial photograph taken after the disaster, released by the Geospatial Information Authority of Japan).
The geology of the Otoishi River basin is mainly Middle Paleozoic-aged crystalline schist in the upstream area and Mesozoic-aged granitic rocks in the downstream area. The distribution is shown in Figure 1. Mesozoic granite is widely distributed in northern Kyushu, for example, at Mt. Seburisan [15] and Mt. Sangunsan [16]. This rocky body can be confirmed from the lattice-like valley topography seen in aerial photographs and is especially noticeable at Mt. Seburisan, located on the boundary between the Fukuoka and Saga Prefectures. The topography is presumably derived from lattice-like cracks that accompanied cooling near the top of the batholith [17] or active structures oriented north-south and north-west [18]. It is thought that the regular distribution of the valley topography is the result of similar phenomena in the Otoishi River basin.
Field surveys have confirmed that fault zones, at least 10 m wide, are oriented in the same direction as the river’s mainstream. During the July 2017 disaster, uncovered by the erosion of the valley plain, a left lateral slip fault (the Otoishi Fault), accompanied by vertical components, was found in the upstream part of Otoishi River [19]. The Otoishi Fault runs northwest-southeast in the same direction as the river’s mainstream. Therefore, the topography of the Otoishi River basin is distinctive, which suggests that geological structural factors have influenced the formation of the valley plain.
3. Field Survey and Observations of Dissolved Silica in the River
To determine the outline of the sediment disaster, a field survey, to investigate the flood sediments and a hydrological survey were conducted. The deposition of the sediments was sketched and their thicknesses measured.
The hydrological survey was conducted during the dry season, from November to December, when rainfall is reduced. River flow rates were measured using either a dilution method or a vessel method. River water samples were collected to determine silica content. The suspended matter was filtered using a 0.45 μm filter and the dissolved silica was measured by the molybdenum yellow colorimetric method [20,21]. The silica flux of a river depends on the water-rock reaction [8] and it is often used as an indicator of long-term rock weathering [9]. However, since silica in soil is easily eluted by reaction with water, silica flux is also used in the study of short-term hydrological phenomena, such as temporal changes in the flow rates of mountain streams due to rainfall [10]. The current study’s sediment dynamics investigations refer to the report by Ikemi et al. [12].
4. Results and Discussion
4.1. River Erosion and Flood Sediment Characteristics
Sediment investigations in the Otoishi River basin were conducted during August, September, and November 2017. As the sediment had already been artificially moved in November, the evaluation of the erosion and the characteristics of the flood sediment were based on the results of the August and September surveys.
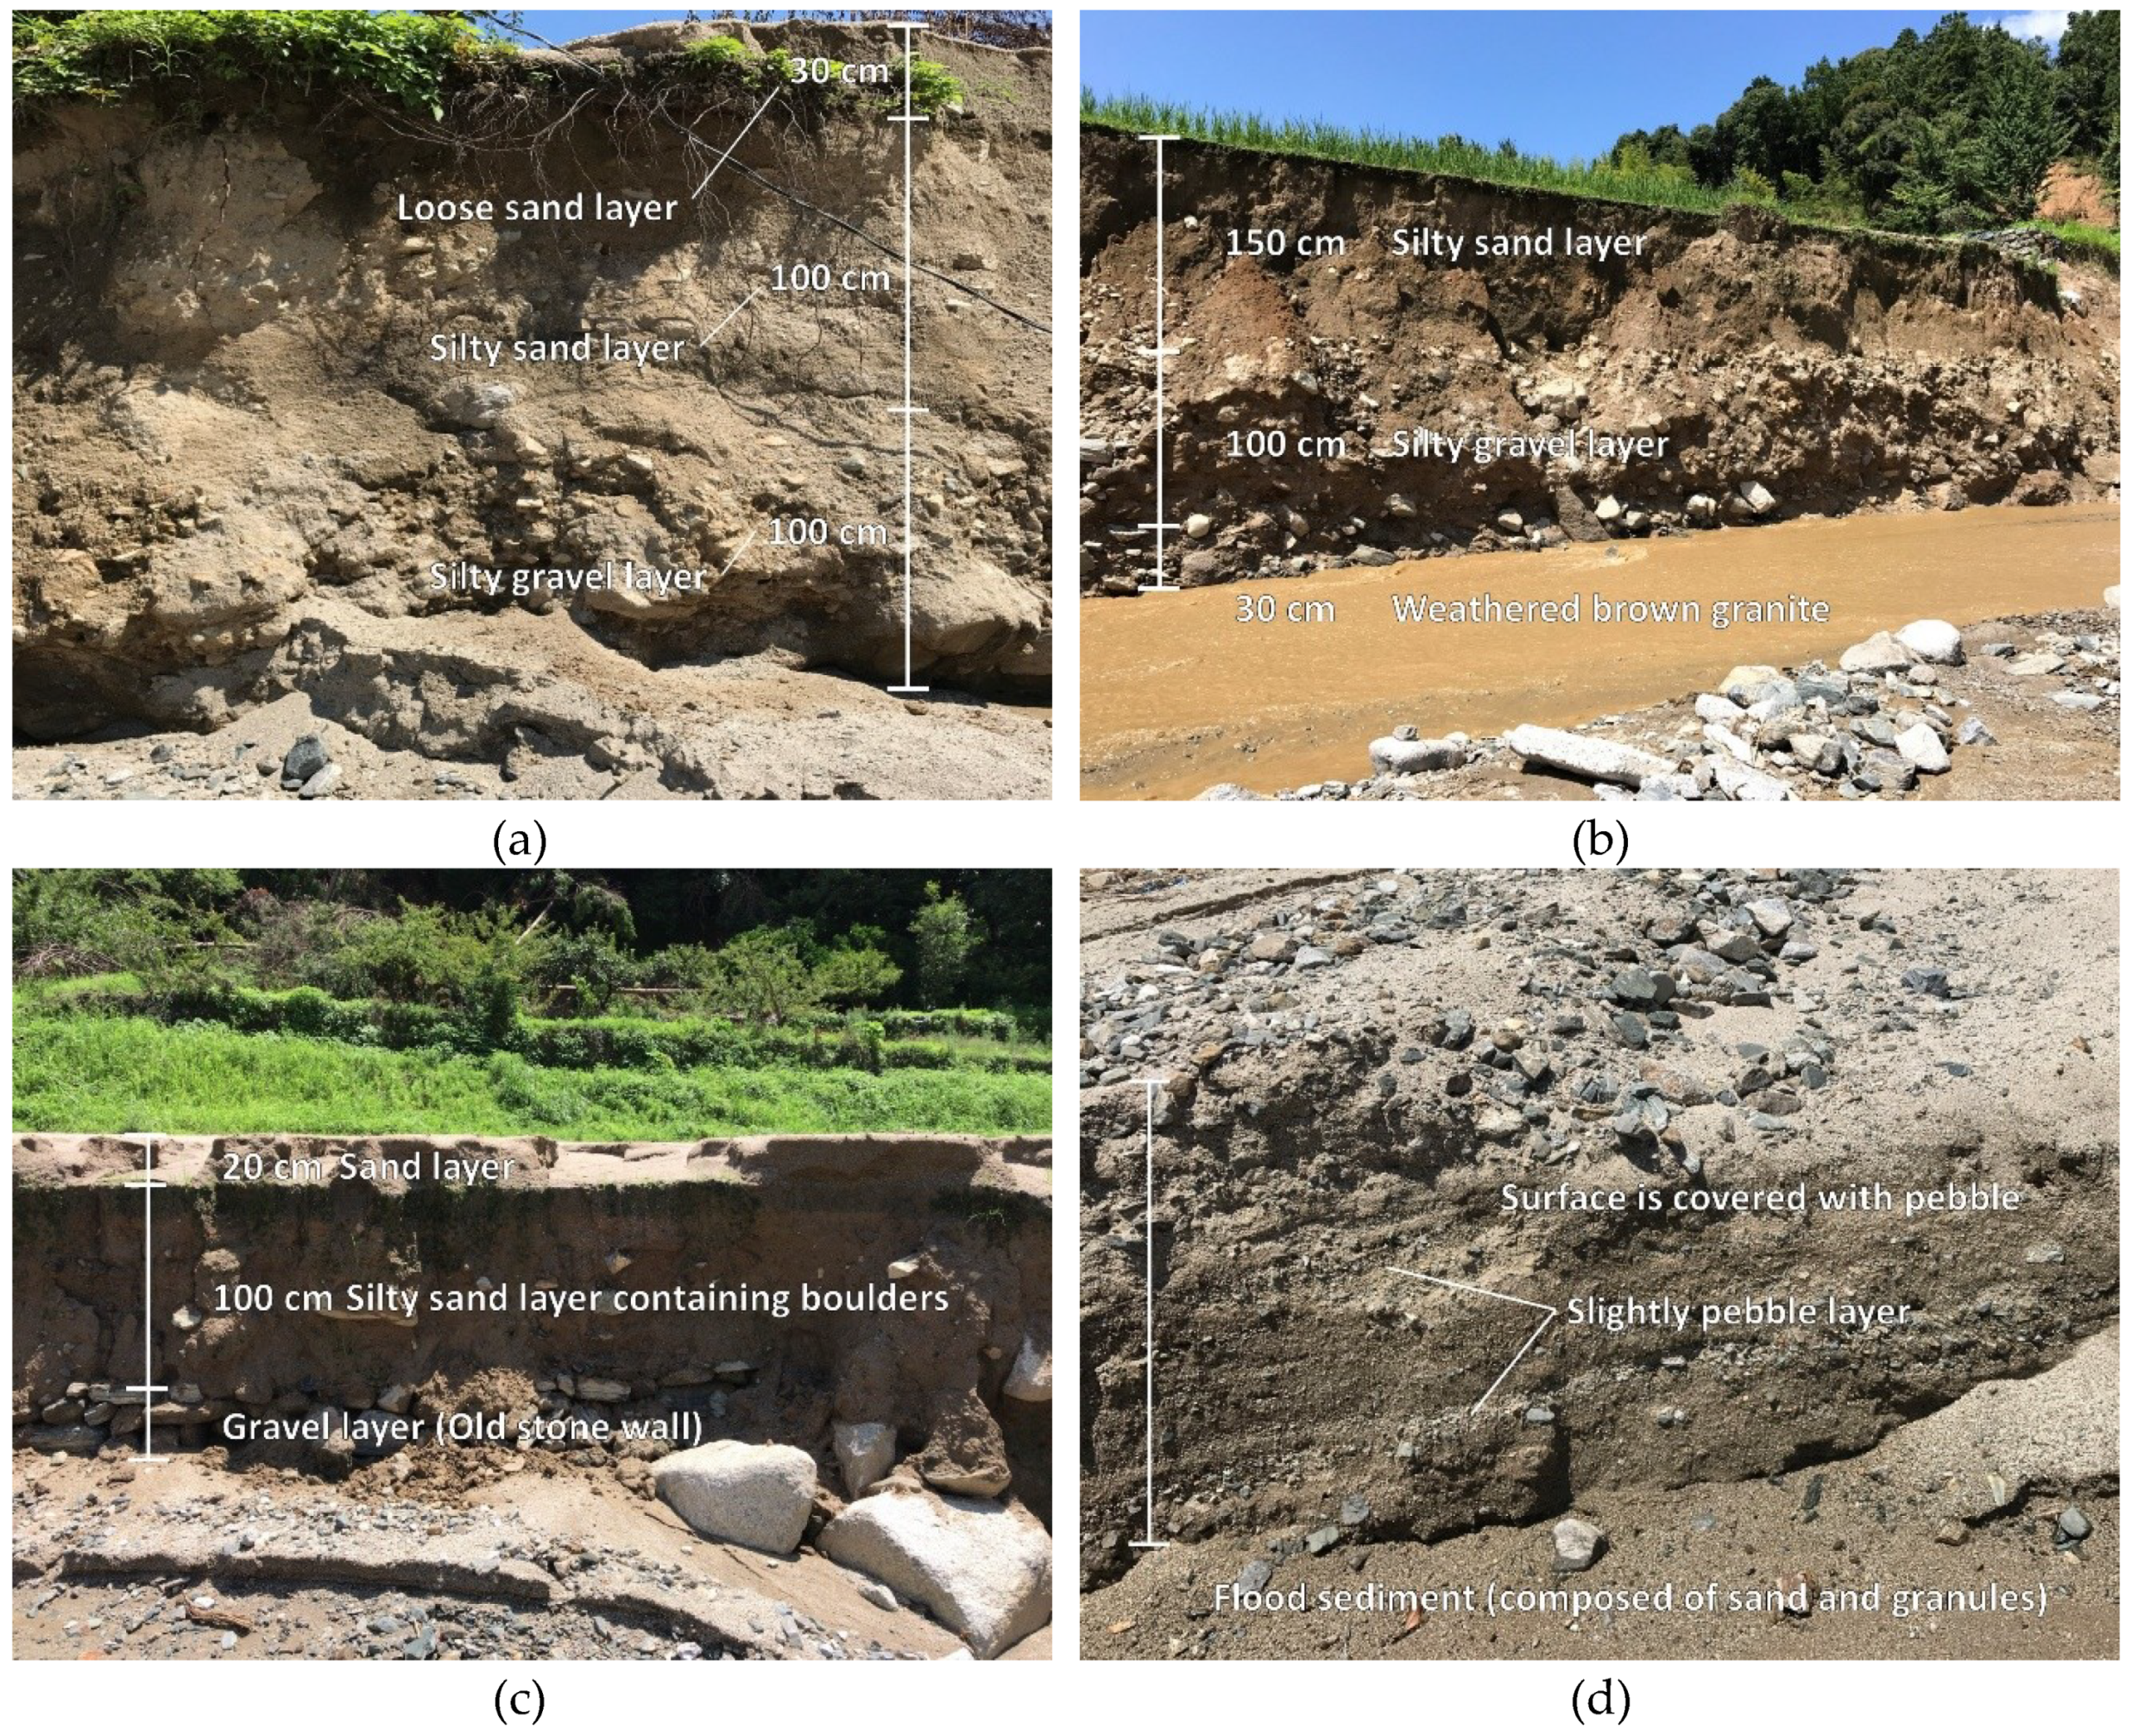
Figure 2a shows the left bank of the Otoishi River near the Masue Elementary School. It was confirmed that a buried pipeline had been exposed by erosion. A cross-section of the riverbank shows a lowermost 1 m thick silty gravel layer overlain by a 1 m thick silty sand layer, a layer of vegetation, and an uppermost 30 cm thick loose sand layer. The layers below the vegetation are sediments deposited by past disasters, which were exposed by the recent erosion. The gravel layer at the base of the section comprises pebble- to boulder-sized gravel, composed of plate-crystal schist with some granite, without a regular structure. Parallel laminae were seen in the overlying sand layer, near the boundary with the lower gravel layer. The center of this sand layer included some pebble-sized gravel. The loose sand layer overlying the vegetation resembled the sediment on the bottom of the river after the disaster and it is considered to be sediment laid down during the disaster; it is mainly composed of quartz and feldspar sand and fine gravel, including mica, and is generally considered to be decomposed granite.

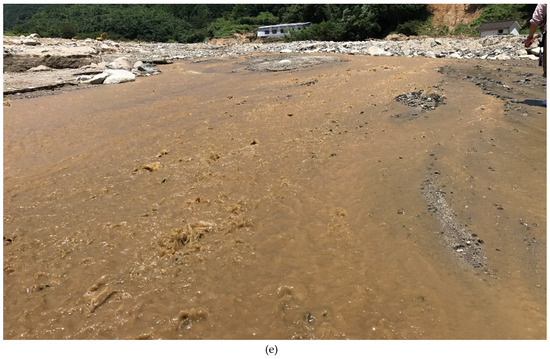
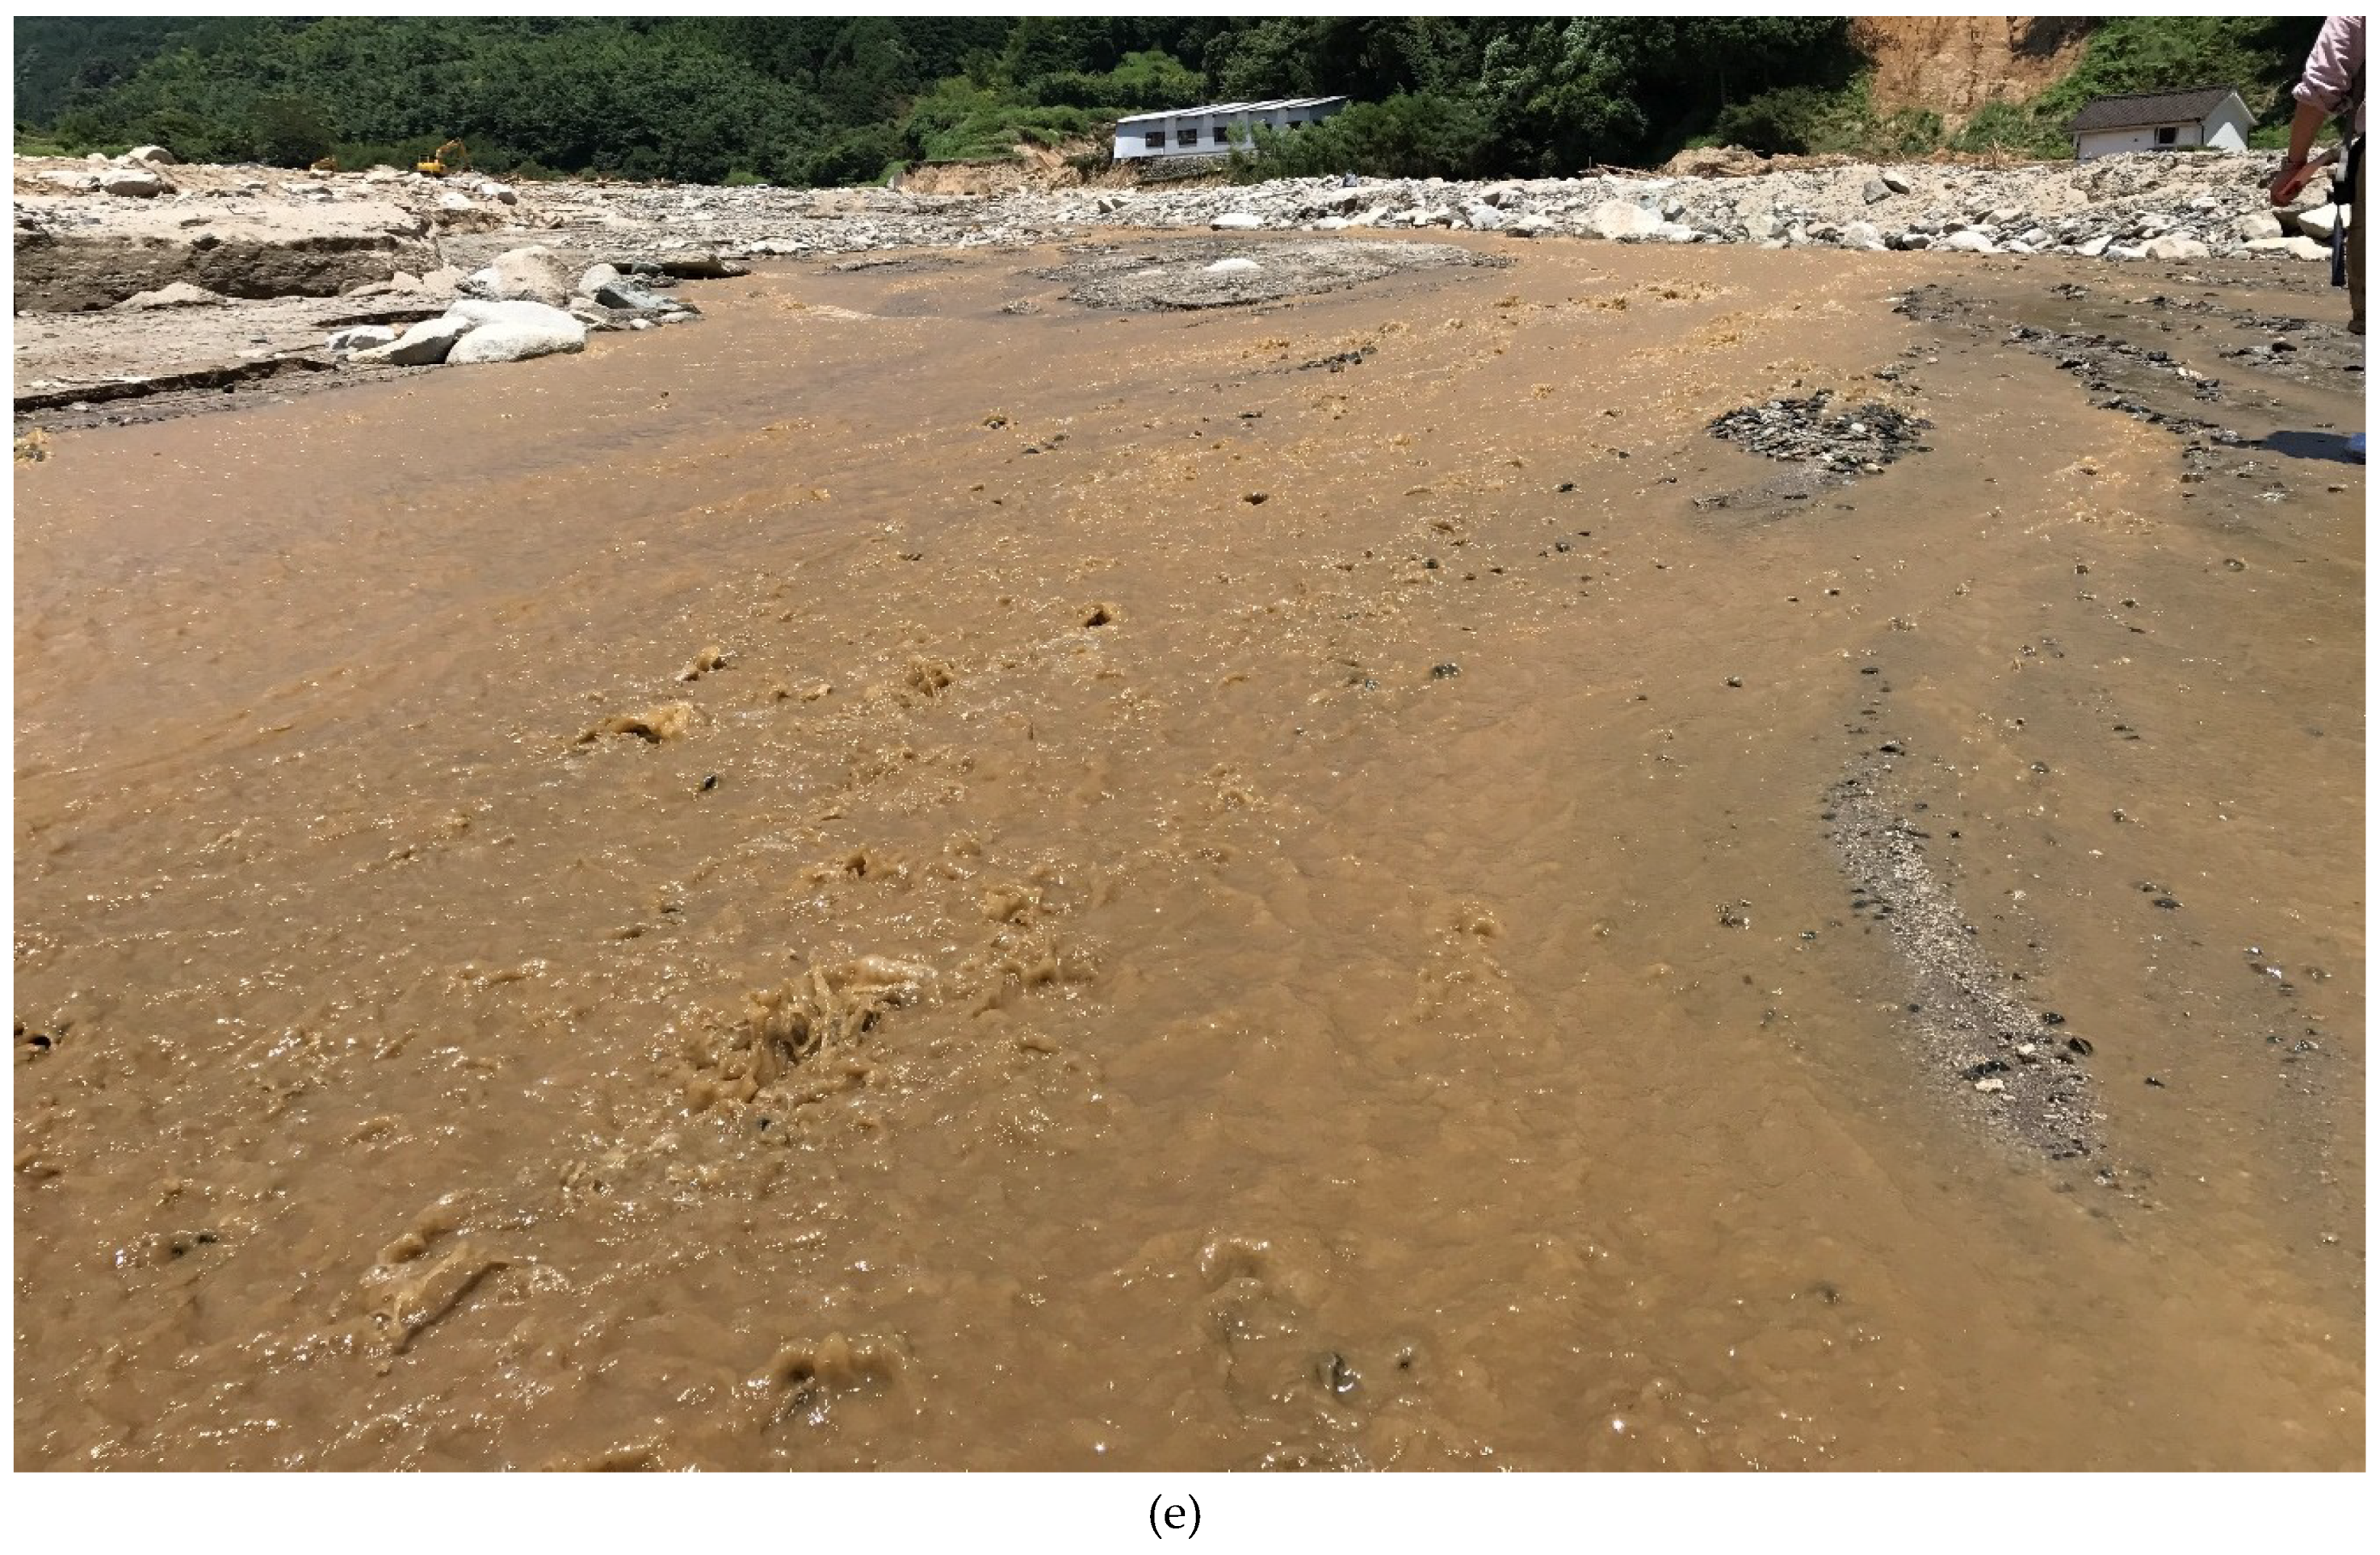
Figure 2.
These are photographing about sediment or river environment after the disaster (2 August 2017). (a) Photo of a left bank section exposed by erosion near the Masue Elementary School; (b) photo of erosion of the right bank in the downstream area; (c) photo of a sand layer, including gravel, exposed by erosion; (d) photo of flood sediments comprising a sand and pebble layer; (e) photo showing black gravel rolling on the riverbed due to water-flow.
Figure 2b shows erosion on the right bank, 180 m upstream of the Masue Elementary School. On the left side of the photo, brown granite, weathered to about 30 cm from the water surface can be seen, and a silty gravel layer of about 1 m is distributed over the granite layer. A 1.5 m thick silty sand layer is distributed above this. The granite in the right side of the picture is much thicker, and there is less gravel compared with the left side. There was also a hole, or pipe, in the boundary between the granite and the sand layer, which was able to confirm the washed gravel and gully under the hole.
Figure 2c is a photo of erosion on the left bank, 365 m upstream from Figure 2b. A 1 m thick silty sand layer containing boulders is distributed above the gravel layer, which seems to be an old stone wall. A new 20 cm thick sand layer is distributed over the top of the ground surface at the base of the present stone wall and it was confirmed here that the gravel of the crystal schist overlapped.
Figure 2d shows the flood sediment of this disaster. This sediment was confirmed throughout the Otoishi River basin and it is considered to have been transported from a source of collapsed soil and debris flow sediment accompanying slope failures. It was confirmed that the flood sediment is composed of sand and granules, including a slightly pebbly layer. Characteristically, the sediment is covered with pebbles. There is little clay because it is fragile when dry and crumbles easily.
Figure 2e shows the state of the Otoishi River in August near the location of Figure 2d. The river is turbid but it was possible to confirm that gravel was rolling on the riverbed. The riverbed consisted mainly of sand and granules, which were moved continuously by the water-flow. The pebbles were able to be transported on the riverbed because the riverbed had been smoothed by the moving sand and granules. It appeared that this phenomenon created the deposition seen in Figure 2d. The locations of the photos are indicated in Figure 3, together with the collapsed slopes.

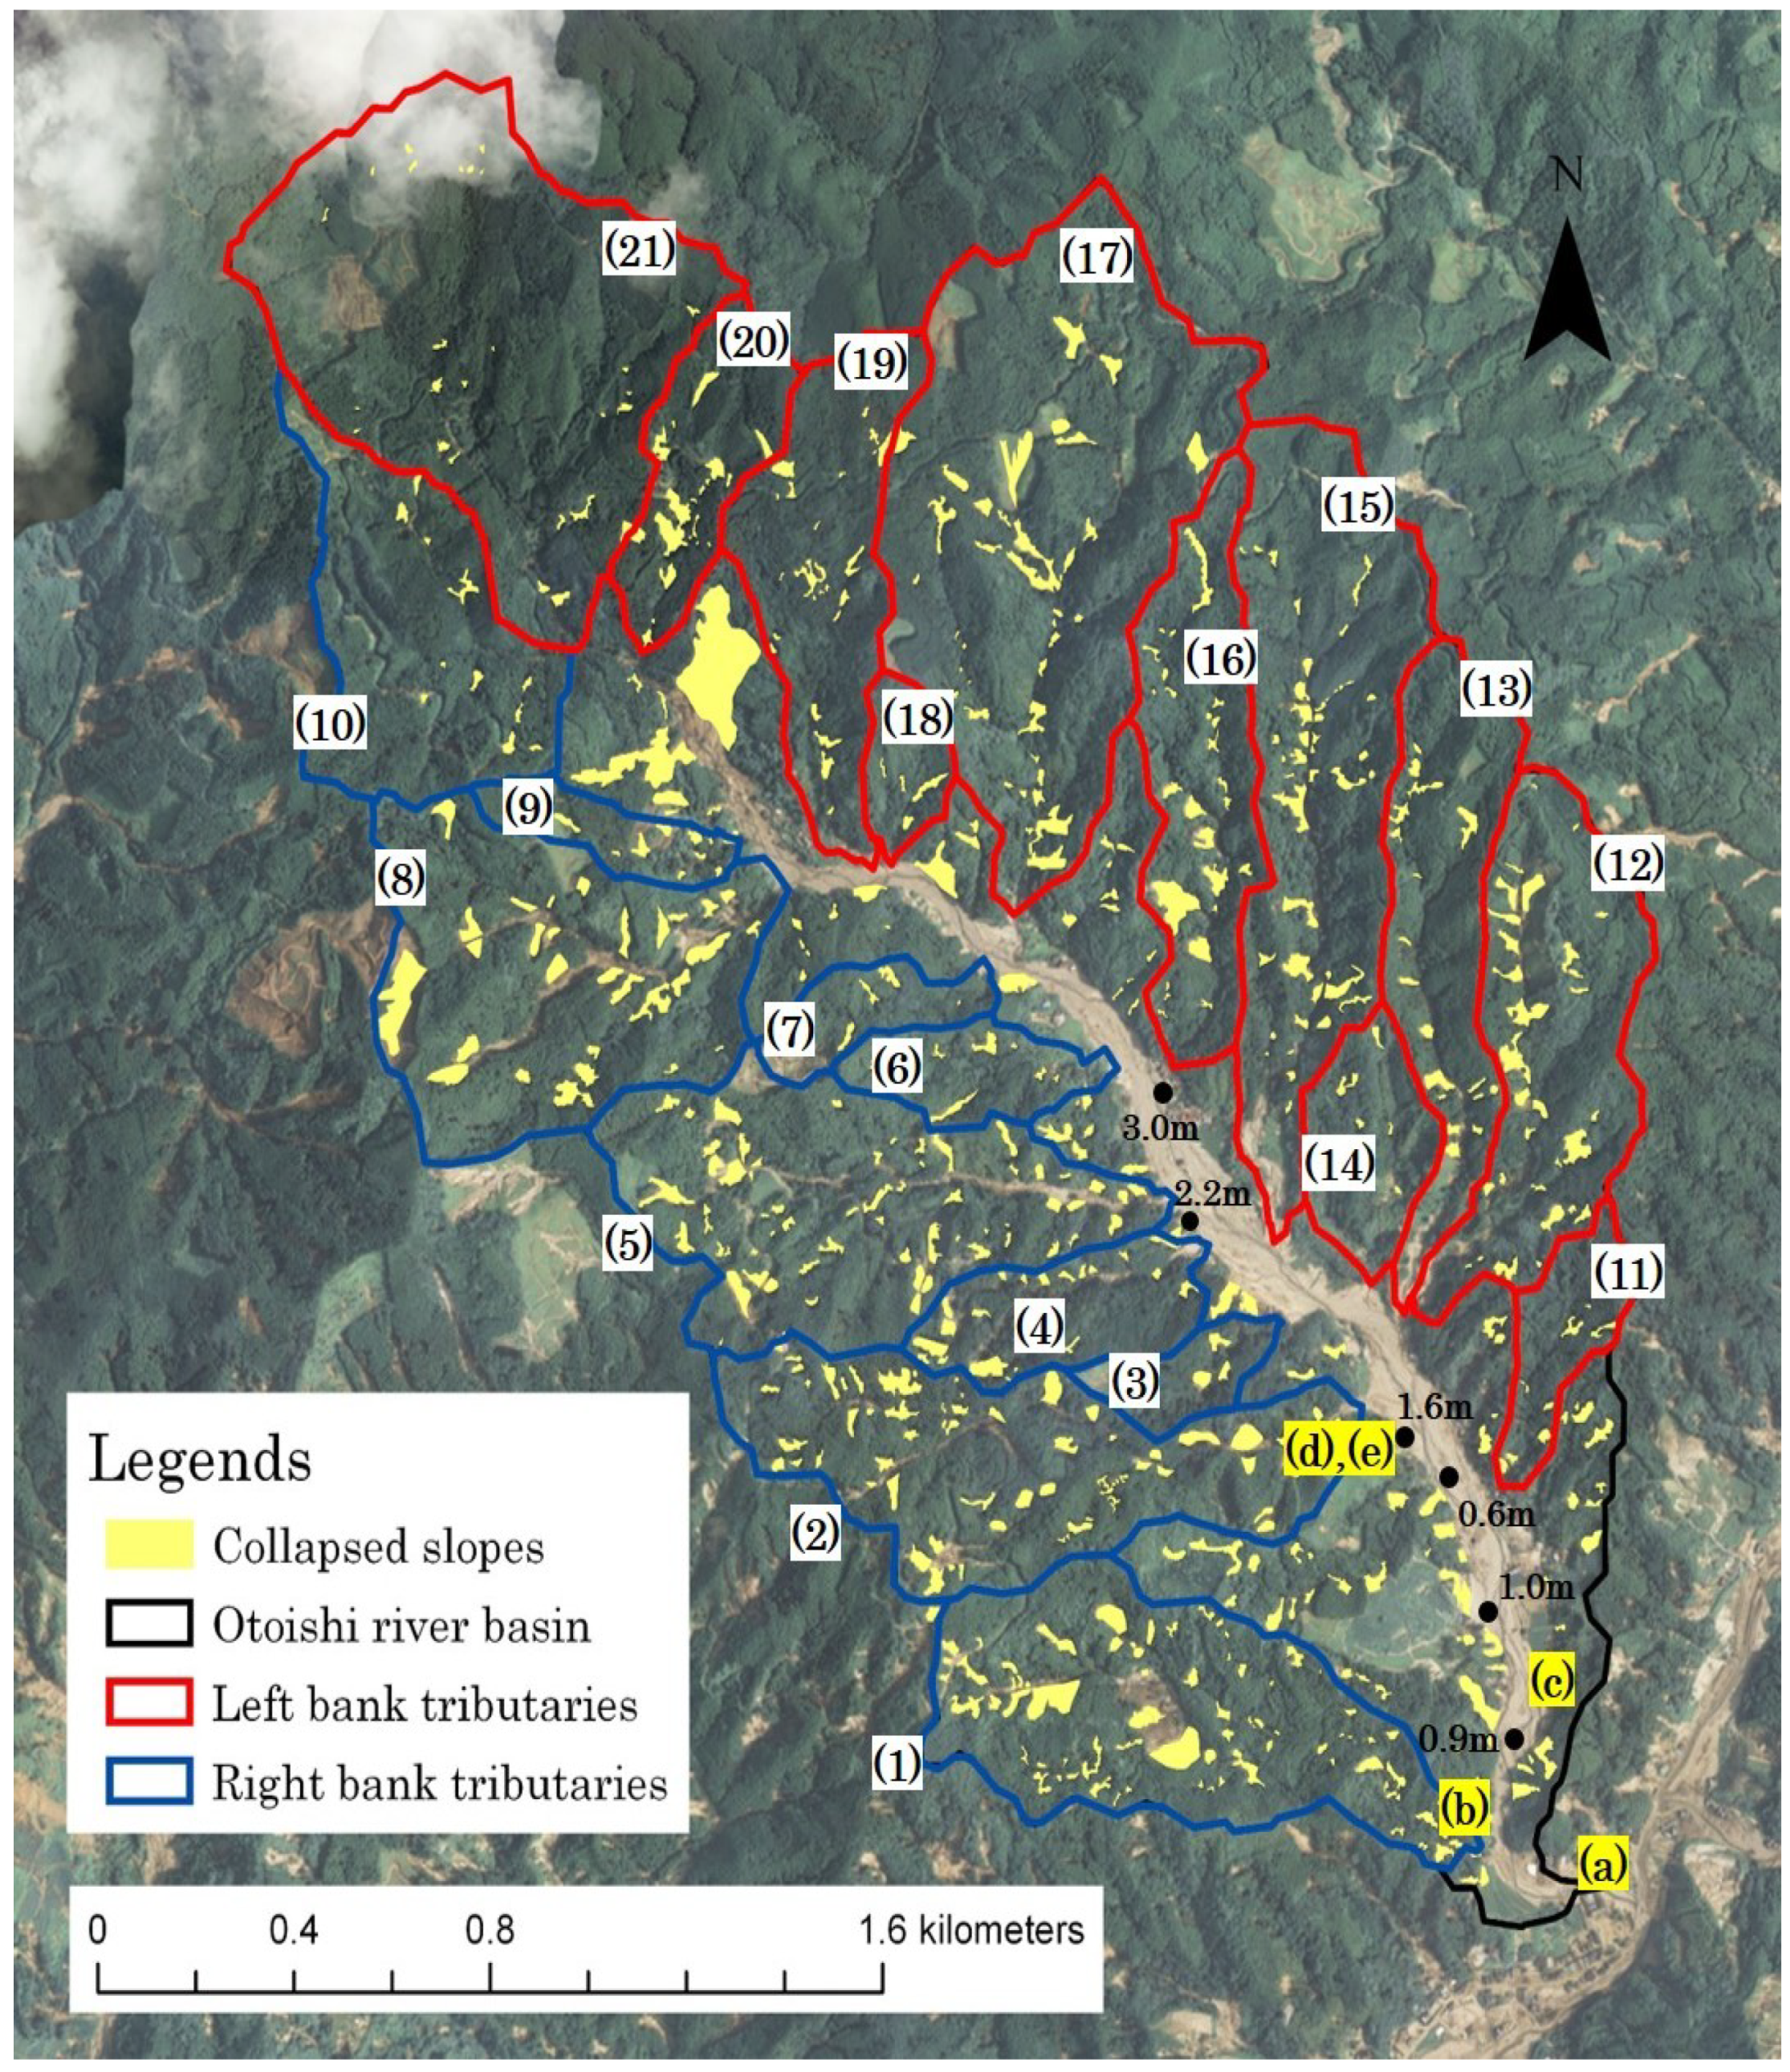
Figure 3.
The distribution of collapsed slopes mapped from aerial photographs in the Otoishi River (the photo sites and the sediment thickness are described in this figure).
4.2. Measurement of Sediment Thickness
Sediment thickness was measured at six locations in September, just after river excavation by heavy machinery had begun. The maximum deposit thickness was 3 m. The measured positions and deposition thickness is shown in Figure 3. The thickness was not uniform, and the deposition thickness tended to increase on the upstream side of the valley’s narrow pass. Normally, there were many deposits composed of sand and/or granule layers with a pebble layer, as shown in Figure 2d. However, silt deposits, including boulders and pebbles, without laminae were confirmed further upstream. The upstream site where 2.2 m thick sediments are measured is a confluence point with a tributary and 1.8 m thick sediments were deposited over the 40 cm thick flood deposit with no laminae.
The deposit thicknesses measured in this survey only covered the downstream area because, in September, the sediments that had been deposited on the plain were still too great and places, where the thickness could be measured, were limited—it was difficult to investigate. It was also difficult to verify the sediments since the survey had to be conducted rapidly because of the restoration of the road.
Figure 3 summarizes the distribution of the collapsed positions of the mountain slope and the deposition in the river channel, as reported by Ikemi et al. [12], who estimated 100,000 m3 of sediment with 230,000 m3 of erosion, which is more than double the amount of the sedimentation.
4.3. River Flow and Dissolved Silica Concentration
The hydrological survey of nine tributary sites was conducted in November to confirm the water-flow only. The investigation of December clarified the water-flow and the silica fluxes in 21 tributaries. The average river flow rate (daily flow rate per unit area) was 2.4 mm/day in November and 2.1 mm/day in December. “Automated Meteorological Data Acquisition System” of the Japan Meteorological Agency measured the rainfall at the disaster. The system is abbreviated commonly as AMeDAS. According to AMeDAS, the monthly precipitation in Asakura City, Fukuoka Prefecture, for October, November, and December 2017 was 295.5, 22.5, and 17.0 mm, respectively. It was also obvious that the river flow rate decreased according to the rainfall.
The average dissolved silica concentration was 290 μmol/L in the tributary in both November and December and in the mainstream, in December, it was unchanged at 280 μmol/L. The dissolved silica concentration does not tend to change compared with a flow rate in other granite basins in northern Kyushu.
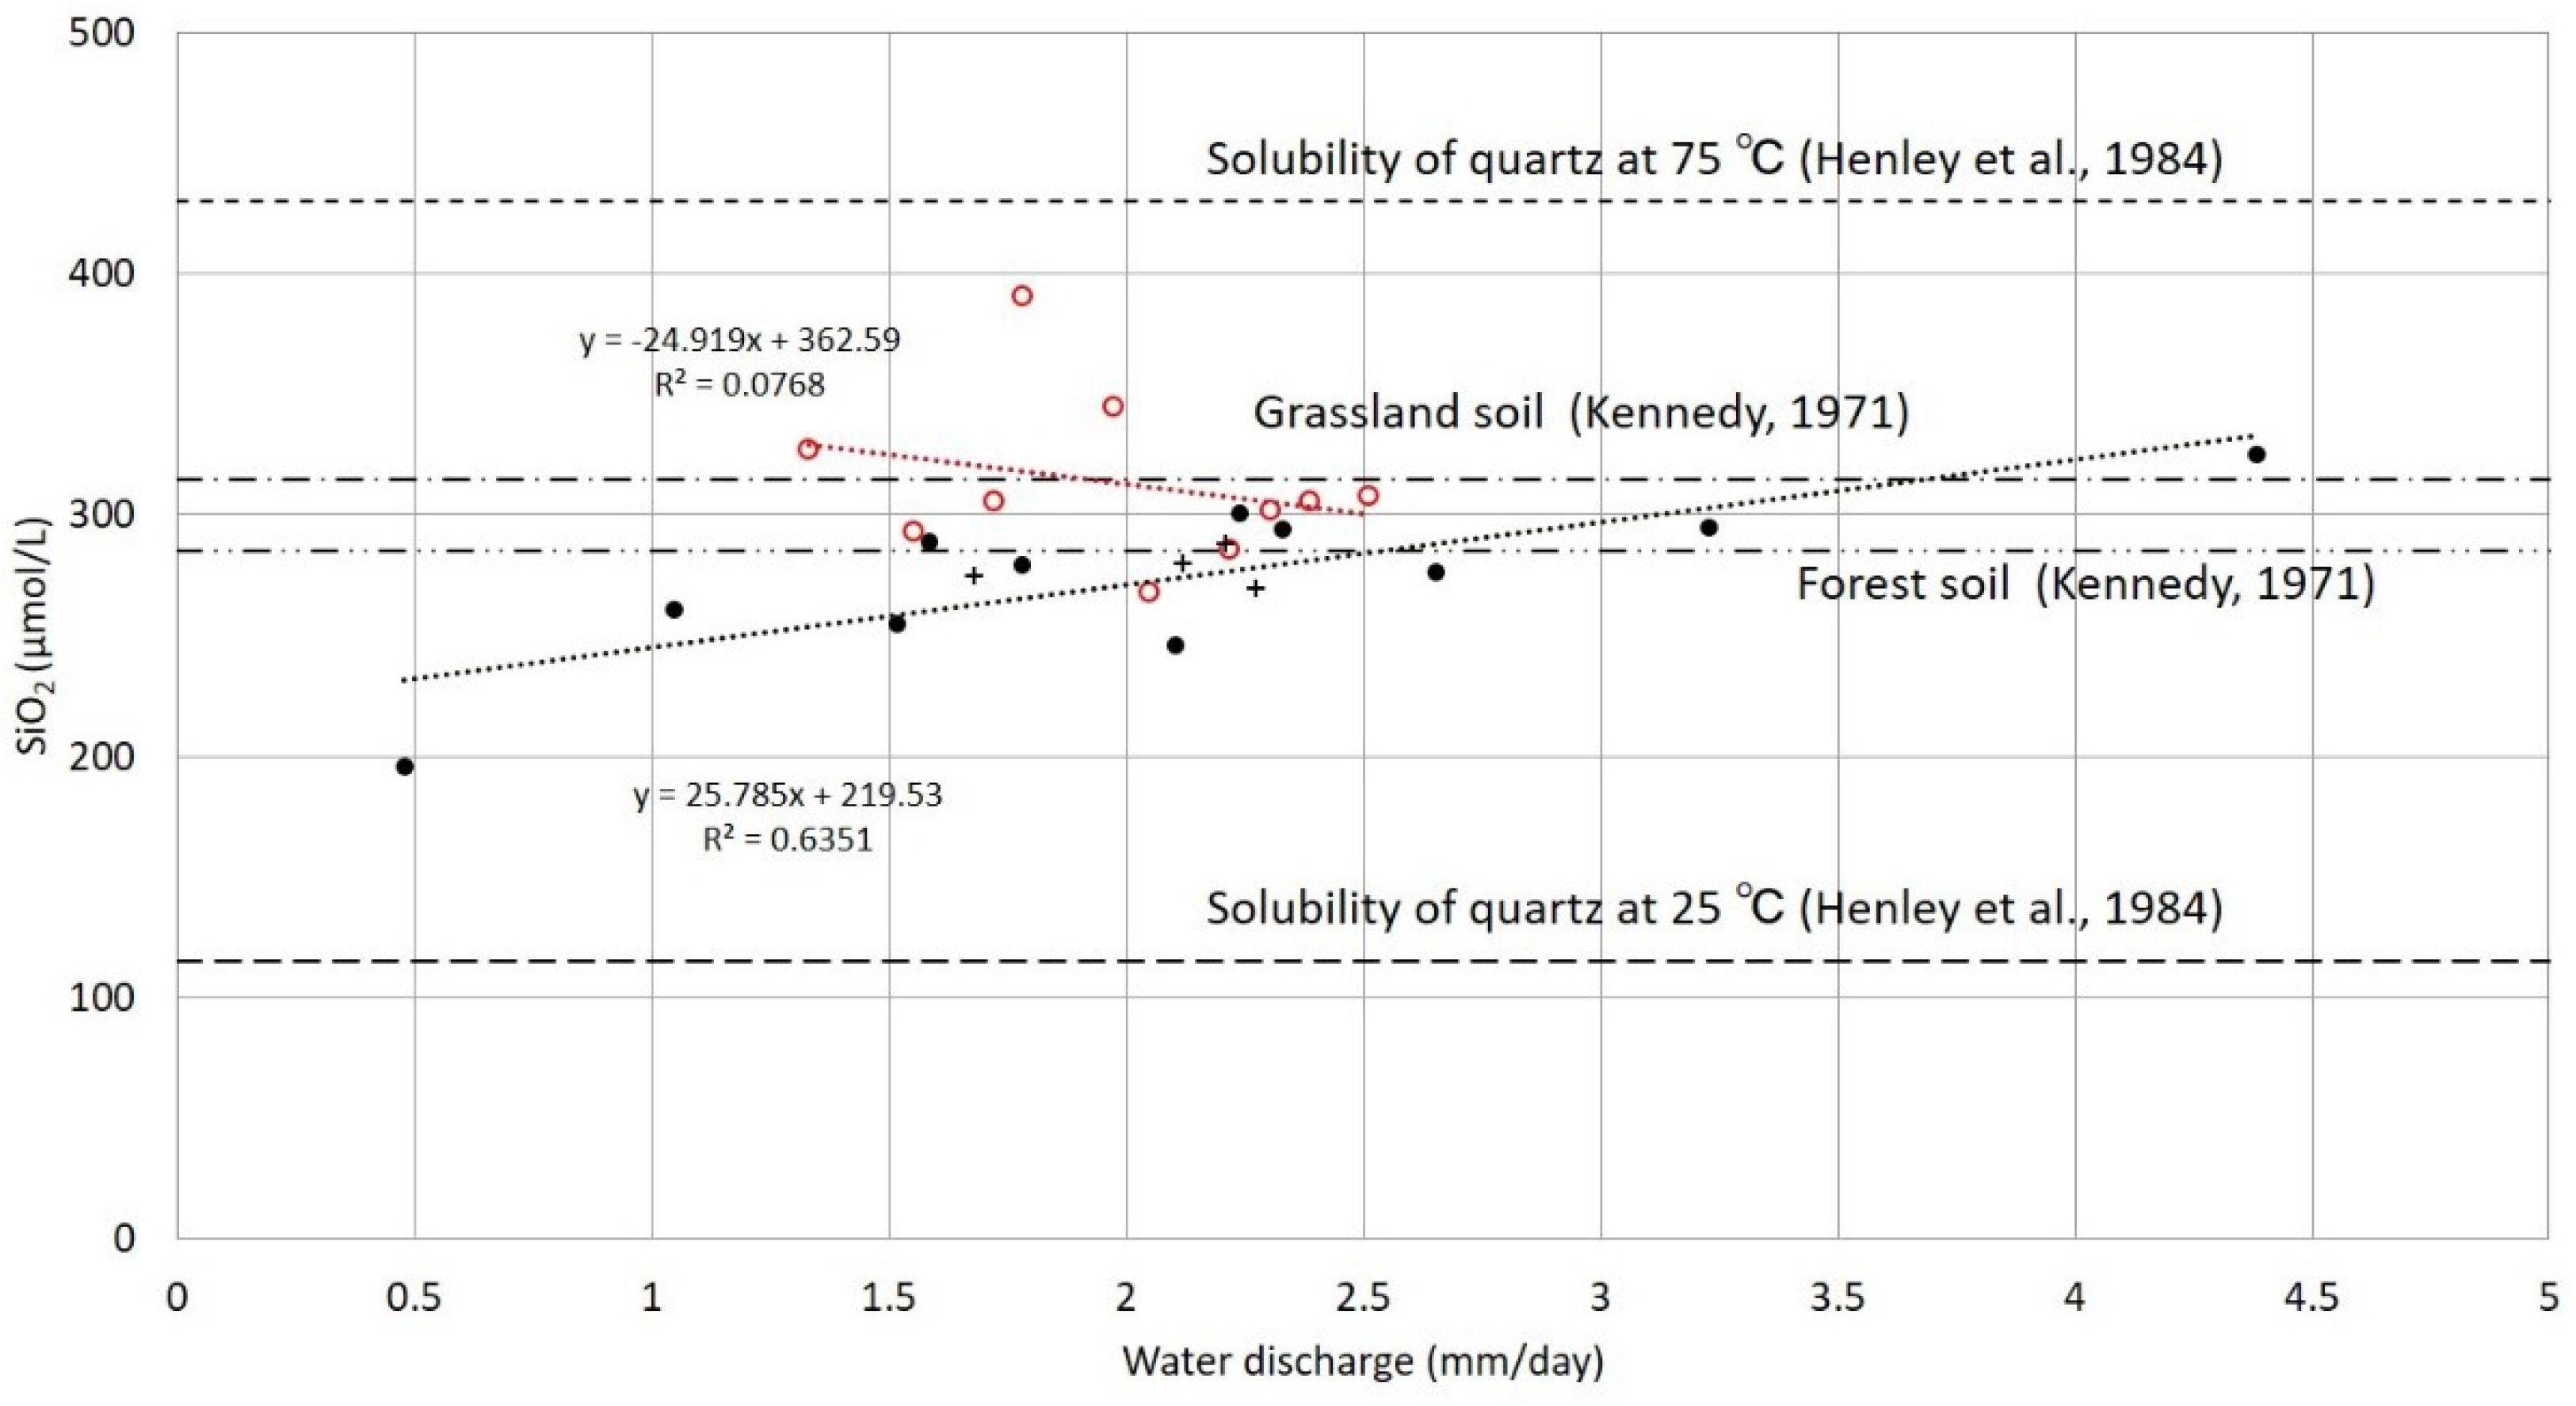
Figure 4 shows the relation between the water discharge (mm/day) of each sub-basin and the dissolved silica concentration (µmol/L). The values of the right bank tributaries are shown in the red circles and the values of the left bank tributaries are shown in the black circles. The mainstream value is shown in the plus sign. The water discharge ranged from 1 to 3.5 mm/day in the right bank tributaries and from 0.5 to 4.5 mm/day in the left bank tributaries. The dissolved silica concentration was roughly steady, with the highest concentrations found in the right bank tributaries and the lowest concentrations confirmed in the left bank tributaries. The correlation coefficient of these values confirmed that the water discharge had a strong correlation with the silica concentration in the left bank tributaries.
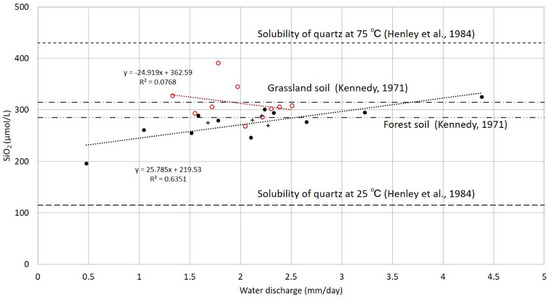
Figure 4.
The relationship between the water discharge (mm/day) and the dissolved silica concentration (µmol/L). (In Figure 4, the black circle shows the data of the left bank tributaries, the red circle shows the data of the right bank tributaries and the plus sign shows the mainstream data. The values of solubility of quartz at 25 and 75 °C are shown in Figure 4 as reference [22]. The reference values of grassland soil and forest soil are also shown [10].).
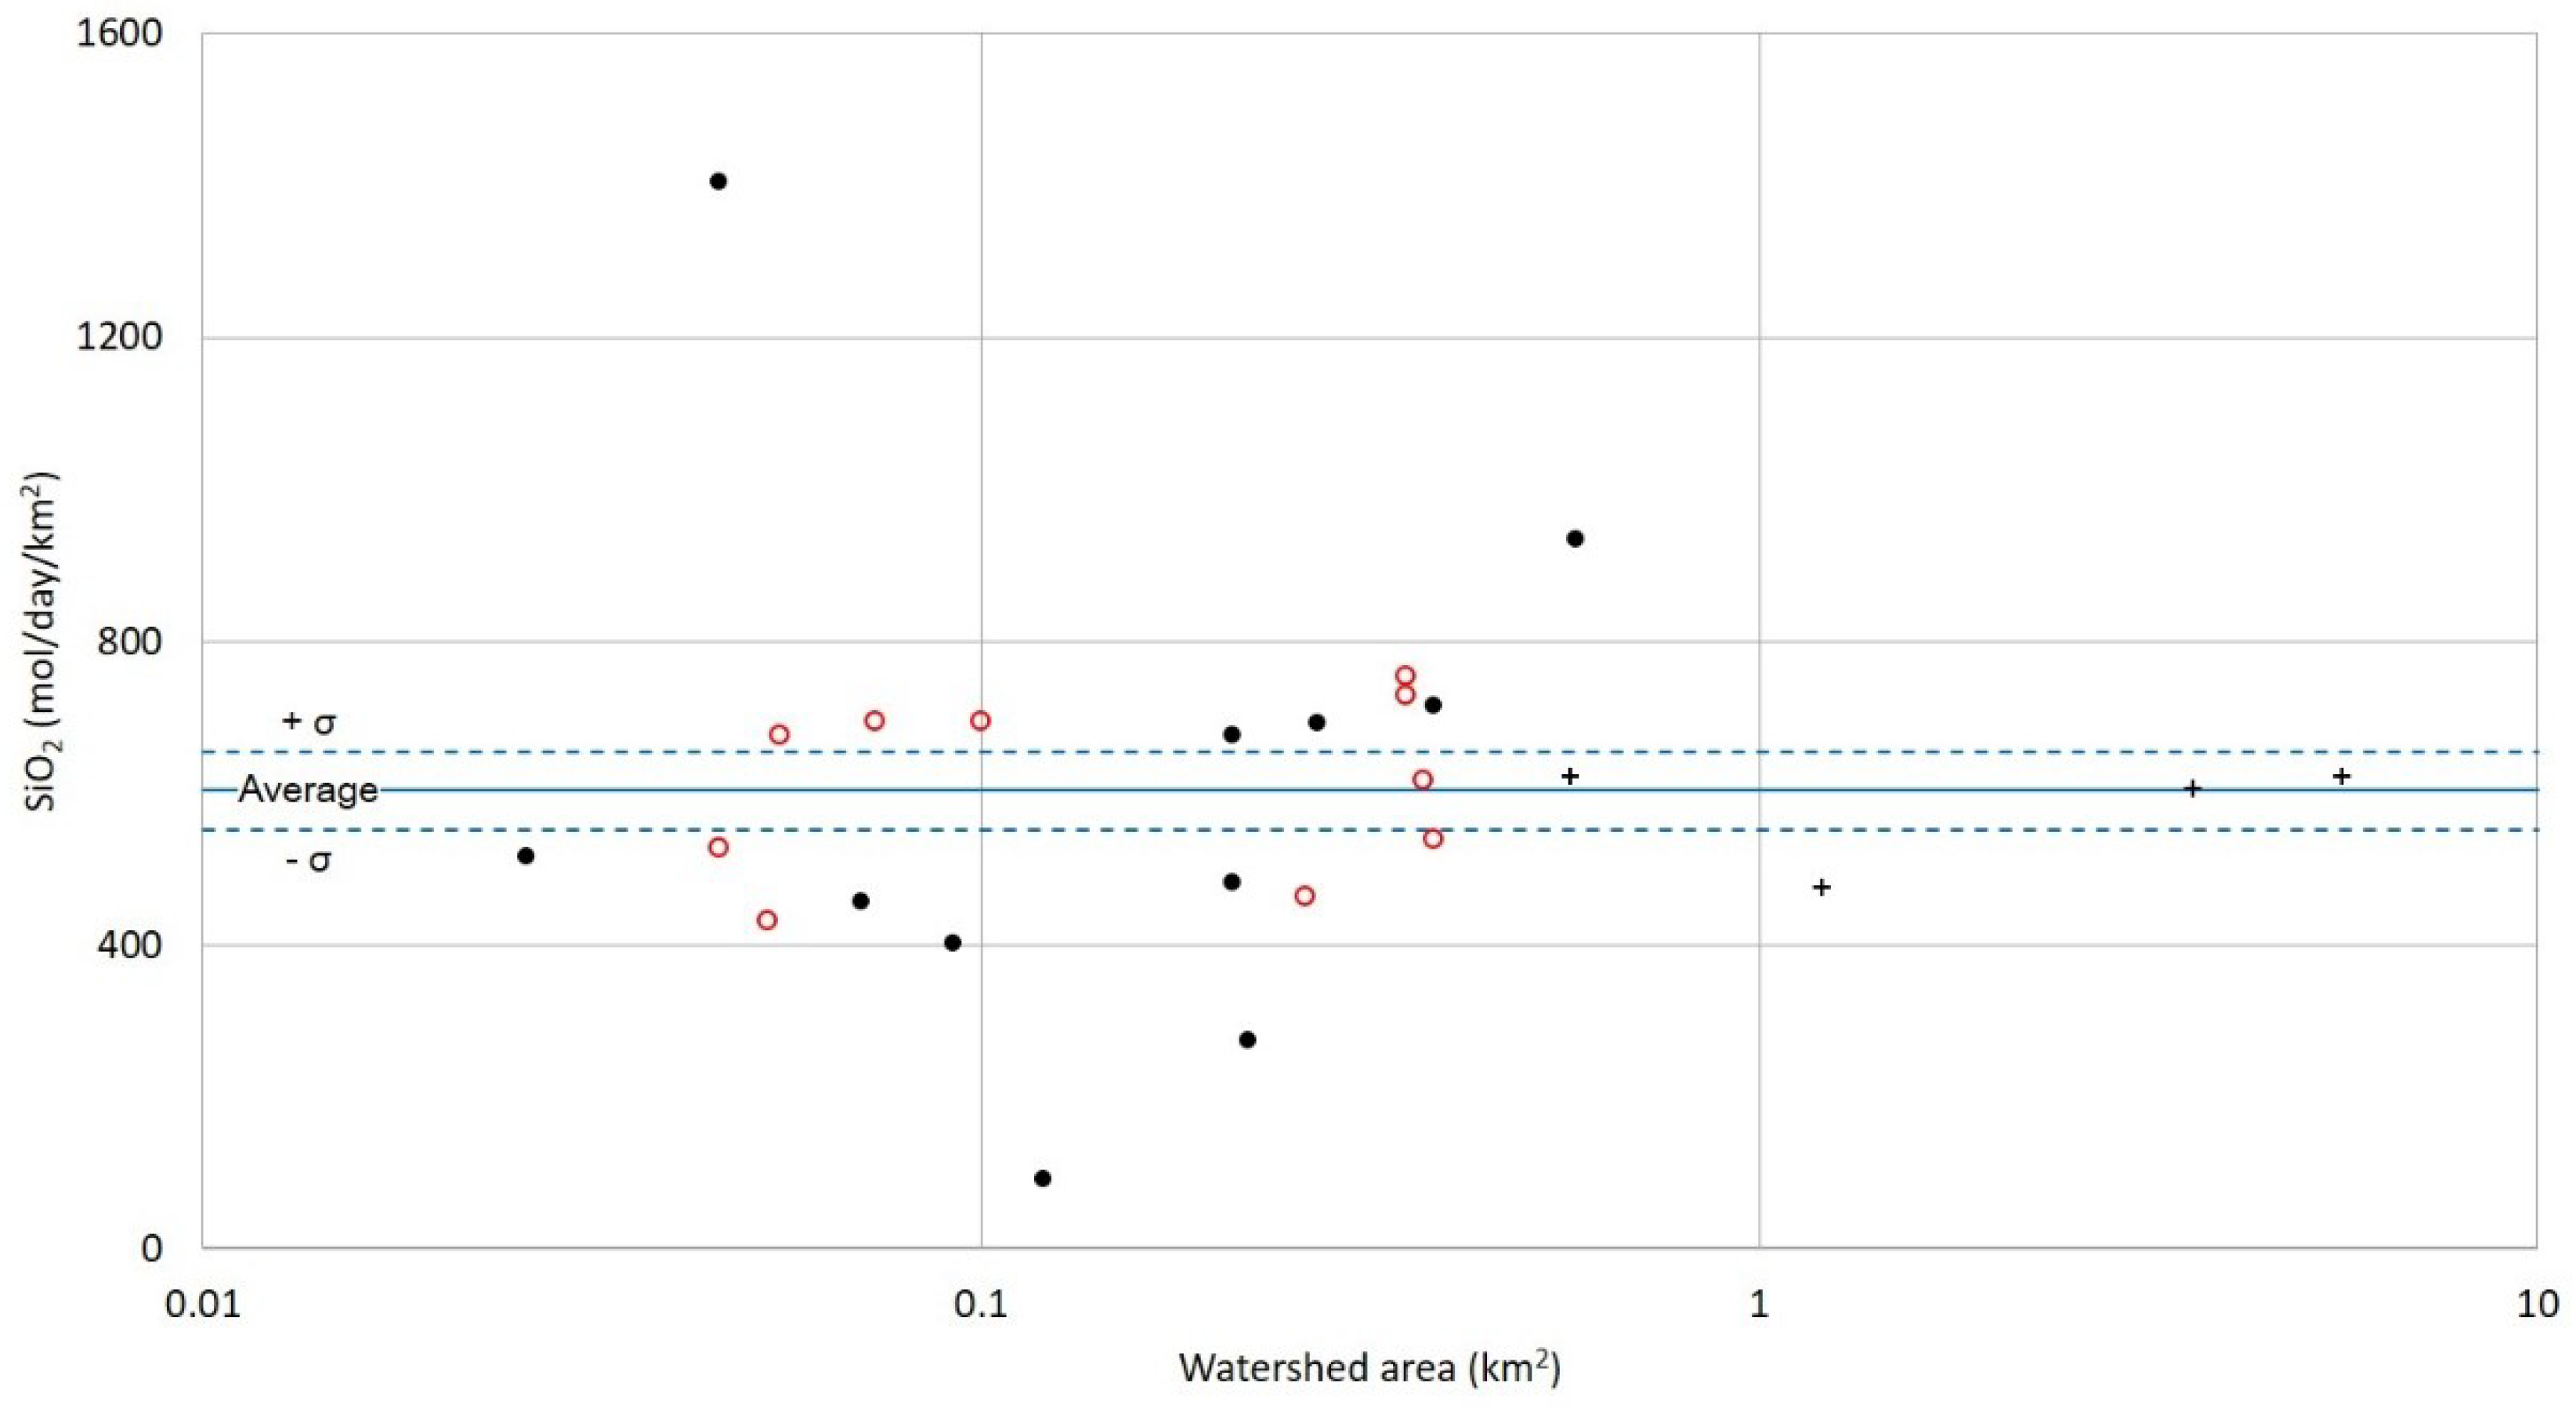
Figure 5 shows the relation between the watershed area (km2) in the sub-basins and the silica fluxes (mol/day/km2) based on the water discharge and concentration. The silica fluxes on the right bank tributaries exhibited a narrow range regardless of the catchment area, whereas the silica fluxes on the left bank tributaries exhibited a wide range. Particularly, it was confirmed that the variations in small catchment area were wider. In Figure 5, the average values of the silica fluxes and the values of the average ± the standard error (σ) are shown by the blue lines. The silica fluxes of the mainstream were distributed within this range.
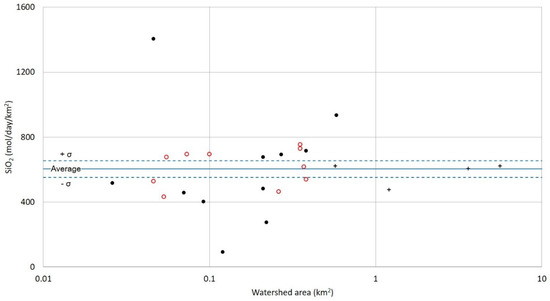
Figure 5.
The relationship between the watershed area (km2) and the silica fluxes (mol/day/km2). (In Figure 5, the black circle shows the data of the left bank tributaries, the red circle shows the data of the right bank tributaries and the plus sign shows the mainstream data. The blue line shows the average silica flux of all data, the represented the standard error from the average.)
4.4. The Relationship Between the Distribution of Collapsed Slopes and Silica Flux
Ikemi et al. [12] examined the relationship between the distribution of collapsed slopes and the catchment topography; the topographical analysis was examined using an equation based on the development of the topography. The following Equation (1) was proposed by Perron et al. [11]. The parameter D/K was calculated as the indicator of the topographical development in the analysis.
where A is the watershed area, is the terrain gradient, is the curvature and the differentiated gradient. is the ridge curvature, D is the soil diffusivity, K and m are constants.
Equation (1) implies a power-law relationship between the watershed area A and the quantity , which is abbreviated to S*. S* and A are calculated from Digital Elevation Model, the parameter D/K and m are found from least-squares regression of log10(S*) against log10(A). It is considered that if the parameter D/K is high, the parameter m is also high and the correlation between the watershed area and the terrain gradient is strong.
As for Ikemi’s result, the topographical analysis for the left bank tributaries showed a strong correlation between the catchment area and the topographic gradient. It was reported that water-flow, as a topographical characteristic, may influence more to the topography. The relationship between the parameter D/K and the collapsed area against the watershed area was also reported. The correlation coefficient was ~0.36 for the whole area of the Otoishi River and it increased to ~0.52 for the analyzed tributaries in the case that the collapsed area against the watershed area is more than 5%.
Table 1 represents the data on the terrain before the disaster and the collapsed area. The data were calculated to confirm the terrain characteristics in the tributaries where the hydrological survey was conducted. The sum of the collapsed area is 113,054 m2 in left bank tributaries and 151,469 m2 in right bank tributaries. However, considering the topography, the left bank tributaries seem to be not much different from the right bank tributaries.

Table 1.
Statistical data of 21 tributaries (the tributary number is the same in Figure 3).
On the other hand, Equation (1) is represented as the following Equation (2) according to Perron et al. [11]
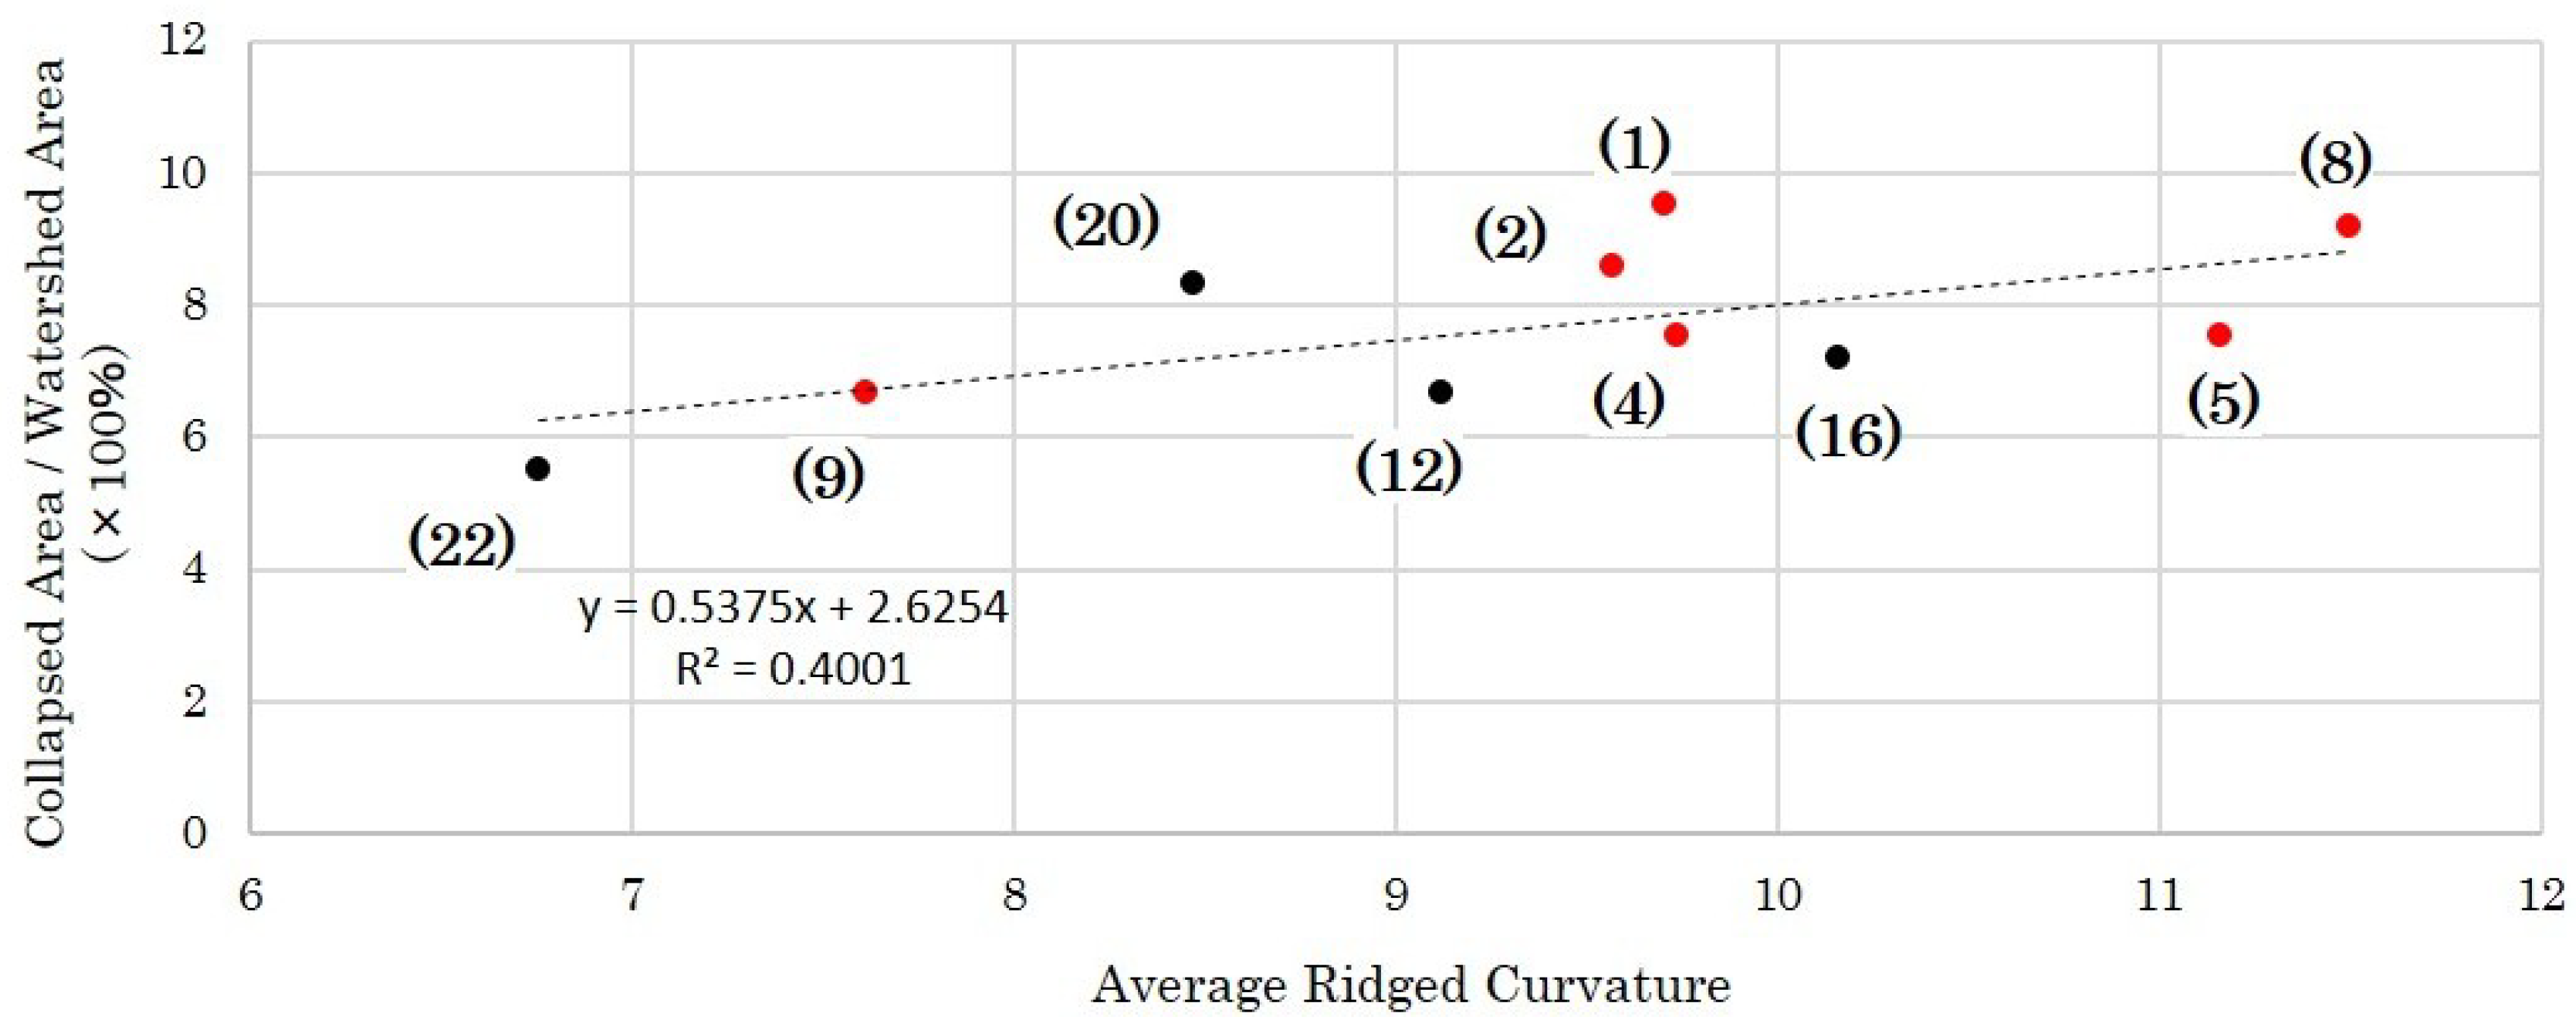
where U is the surface uplift rate. Since U is constant in a narrow region, rises with the erosion of the basin. From Table 1, the relationship between the collapsed slopes and the ridged curvature was examined (Figure 6). The correlation coefficient was ~0.63 for the analyzed tributaries in the case that the collapsed area against the watershed area is more than 5%. It is assumed that the correlation was confirmed only in some tributaries because the stage of geomorphic development is different. The result suggests there are many watersheds that tend to erode in the right bank tributaries.

Figure 6.
The relationship between the collapsed slope and the ridged curvature. (In this figure, the black circle shows the data of the left bank tributaries, the red circle shows the data of the right bank tributaries).
The current study determined that the sediment on the valley plain of the Otoishi River basin is composed of sand and gravel and transported by water-flow rather than by slope failure. Much sediment, considered to be past debris flows, was confirmed in the area where the river bank was eroded. These results suggest that much sediment has accumulated in each tributary of the Otoishi River and this sediment continues to move by water-flow.
The silica concentration range is explained by the mixing of various waters; Figure 4 shows the dissolved silica concentration assumed by the water-rock reaction and elution from the soil. The elution of silica by the water-rock reaction depends on the temperature and when quartz and water are in a chemical equilibrium state at 25 °C, the dissolved silica concentration was 200 μmol/L or less. It reached over 400 μmol/L at equilibrium with quartz at 75 °C. It is assumed that 25 °C is the common temperature of groundwater and 75 °C is the temperature of hot spring water. It has also been reported that silica is easily eluted from the soil, even at low temperatures, with concentrations of ~300 μmol/L. The current case corresponds to intermediate-type groundwater flowing through a mountainous slope surface.
The fluctuation of the silica flux, seen in Figure 4, seems to indicate various water-flows and mixing. On the right bank tributaries, a slightly higher silica concentration was observed. Generally, the silica flux was stable because the river water was formed by steadily mixing groundwater and intermediate streams. However, the left bank tributaries showed that the water-flow was diverse in each sub-basin.
The left bank tributaries had a lower rate of slope collapse for the watershed area than the right bank. The topography is strongly influenced by water-flow. The silica concentration was low in the river and the silica flux varied greatly. From these results, it was hypothesized that sediment often moves in the left bank tributaries. The distribution of sediment is heterogeneous in each sub-basin because of frequent sediment transport. It was also presumed that the left bank tributaries exhibit the various river conditions. For example, groundwater is dominant in the river water and the intermediate flow is dominant because of much sedimentation. It is considered that the values of the silica fluxes were stable in the right bank tributaries because more sediments remain in the basin.
5. Conclusions
This study investigated the distribution of sediment and silica fluxes in the Otoishi River basin. In addition, the sediment kinetics and significance of the silica flux in the mountain streams were examined to compare the research results with the topography or the distribution of the collapsed slopes. Debris flow sediment could not be confirmed and much of the sediment was composed of sands and gravel, moved secondarily by water-flow. In the hydrological survey, it was confirmed that the water-flow is stable in the right bank tributaries from the values of the dissolved silica concentrations, while the left bank tributaries have a various process of the river. Considering the ridged curvature, it was estimated that the right bank tributaries are more eroded than the left bank tributaries, much sediment was produced relatively from the right bank tributaries. In addition, it was clarified from the survey of the silica fluxes that the water movement path is different between the right bank tributaries and the left bank tributaries. Especially, the left bank tributaries tend to have the complex water movement path. Therefore, it was speculated that a large amount of sediment flowed out from the left bank tributaries, and the tendency of silica fluxes changed due to the amount of sediment remaining in the tributary area. It is suggested that the silica flux of mountain streams is an effective index for the evaluation of sediment dynamics in mountain stream regions in combination with topographical analysis.
Author Contributions
Formal analysis, R.N.; Investigation, R.N., A.B., T.T. and H.I.; Data curation, A.B. and T.T.; Writing—original draft preparation, R.N.; Writing—review and editing, R.N. and H.I.; Supervision, Y.M. and H.I.; Funding acquisition, H.I.
Funding
This work was supported by JSPS KAKENHI Grant Number JP17K01228.
Acknowledgments
We would like to thank Geographical Survey Institute for providing the aerial photograph.
Conflicts of Interest
The authors declare no conflict of interest.
References
- Ministry of Land, Infrastructure and Transport. Summary of Sediment Disaster Caused by Heavy Rain in Northern Kyushu in July 2017. [Heisei 29 nen 7 gatsu Kyushu Hokubu Gouu ni yoru Dosha Saigai no Gaiyou]. 2017, Volume 6. Available online: http://www.mlit.go.jp/river/sabo/h29_kyushu_gouu/gaiyou.pdf (accessed on 20 October 2017).
- Kimura, I.; Kitazono, K. Studies on Driftwood Motions around Obstacles by Laboratory and Numerical Experiments. E3S Web Conf. 2018, 40, 02032. [Google Scholar] [CrossRef]
- Tateishi, R.; Horiguchi, T.; Ishikawa, N.; Shima, J.; Mizuyama, T.; Sonoda, Y. Experimental study on blockage of driftwood roots and sediment by steel open-type Sabo dam. J. Jpn. Soc. Eros. Control Eng. 2017, 70, 11–18. [Google Scholar]
- Chen, C.; Fujita, M. Simulation of sediment disasters due to slope failures and the following sediment runoff. Int. J. Eros. Control Eng. 2014, 7, 19–31. [Google Scholar] [CrossRef]
- Japan Meteorological Agency. Abnormal Weather Risk Map—Increasing of Heavy Rain. 2018. Available online: https://www.data.jma.go.jp/cpdinfo/riskmap/heavyrain.html (accessed on 5 November 2018).
- Pan, X.; Nakamura, H.; Nozaki, T.; Huang, X. A GIS-based landslide hazard assessment by multivariate analysis. J. Jpn. Landslide Soc. 2008, 45, 187–195. [Google Scholar] [CrossRef]
- Zhao, J. Study on the Evaluation System of Slope Stability Analysis Based on GIS and Its Application. Open Cybern. Syst. J. 2014, 1205–1210. [Google Scholar] [CrossRef]
- Holland, H.D. The Chemistry of the Atmosphere and Oceans; John Wiley & Sons Inc.: Hoboken, NJ, USA, 1978; p. 369. [Google Scholar]
- Maher, K.; Chamberlain, C.P. Hydrologic Regulation of Chemical Weathering and the Geologic Carbon Cycle. Science 2014, 343, 1502–1504. [Google Scholar] [CrossRef] [PubMed]
- Kennedy, V.C. Silica Variation in Stream Water with Time and Discharge in Nonequilibrium Systems in Natural Water Chemistry; Advances in Chemistry Series 106; American Chemistry Society: Washington, DC, USA, 1971; pp. 94–130. [Google Scholar]
- Perron, J.T.; Kirchner, J.W.; Dietrich, W.E. Formation of evenly spaced ridges and valleys. Nature 2009, 460, 502–505. [Google Scholar] [CrossRef]
- Ikemi, H.; Nakanishi, R.; Baba, A.; Okajima, Y.; Mitani, Y. Spatial Distribution of Collapse, Erosion, and Sedimentation in Otoishi River due to the Heavy Rain Disaster in the North Part of Kyushu, 2017 [Heisei 29 Nen Kyushu Hokubu Gouu Saigai ni yoru Otoishi Ryuuiki no Houkai, Shinshoku, Taiseki no Kuukan Bunpu]; Report on the Western District Division of Natural Disaster Research Council; Natural Disaster Research Council: Fukuoka, Japan, 2018; Volume 42, pp. 71–75. [Google Scholar]
- Azhikodan, G.; Yokoyama, K. Sediment transport and fluid mud layer formation in the macro-tidal Chikugo river estuary during a fortnightly tidal cycle, Estuarine. Coast. Shelf Sci. 2018, 202, 232–245. [Google Scholar] [CrossRef]
- Shoji, J.; Ohta, T.; Tanaka, M. Effects of river flow on larval growth and survival of Japanese seaperch Lateolabrax japonicus (Pisces) in the Chikugo River estuary, upper Ariake Bay. J. Fish Biol. 2006, 69, 1662–1674. [Google Scholar] [CrossRef]
- Owada, M.; Jikihara, S.; Osanai, Y.; Yamamoto, K. Low P/T metamorphic rocks from Sefuri Mountains and its correlation with low P/T type metamorphic rocks in Kyushu, southwest Japan. Mem. Geol. Soc. Jpn. 2000, 56, 229–240. [Google Scholar]
- Pachri, H.; Mitani, Y.; Ikemi, H.; Jiang, W. Spatial variation of soil depth and shallow slope failures in Sangun mountains, Fukuoka Prefecture, Japan. Int. J. Geosci. 2015, 6, 813–820. [Google Scholar] [CrossRef]
- Chorley, R.J.; Schumm, S.A.; Sugden, D.E. Geomorphology; Methuen & Co. Ltd.: London, UK, 1985; p. 605. [Google Scholar]
- Kyushu Active Structure Study Group. Active Structure in Kyushu [Kyushu no Katsukouzou]; University of Tokyo Press: Tokyo, Japan, 1989; p. 562. [Google Scholar]
- Yada, J.; Yano, K.; Yamamoto, S.; Hosoya, T. The Northern Kyushu Heavy Rain Disaster in July 2017, Possibility of the Geological Predisposition of Fault Fracture Zone and a Large Amount of Sediment Discharge Accompanying Otoishi Fault (Tentative Name) [Heisei 29 nen 7 gatsu Kyushu Hokubu Gouu Saigai Otoishi Dansou (Kashou) ni tomonau Dansou Hasaitai to taryou no Dosha Ryuushutsu no Chishitsuteki Soin no Kanousei]. 2017. Available online: http://www.jseg.or.jp/kyushu/#disasterreport (accessed on 6 December 2017).
- Kobayashi, H.; Takano, S.; Fukasawa, S. Determination of Silica in Hot Springs by Weight Method and Molybdosilicic Acid Yellow Spectrophotometry; Annual Report of the Yamanashi Institute for Public Health; Yamanashi Institute for Public Health: Yamanashi, Japan, 1994; Volume 38, pp. 1–4. [Google Scholar]
- Umezaki, Y. Simultaneous colorimetric theorem of silicic acid and phosphoric acid [Keisan oyobi Rinsan no Douji Hishoku Teiri]. J. Jpn. Chem. (Nihon Kagaku Zasshi) 1961, 82, 851–855. [Google Scholar]
- Henley, R.W.; Truesdell, A.H.; Barton, P.B.; Whitney, J.A., Jr. Reviews in Economic Geology. In Fluid-Mineral Equilibria in Hydrothermal Systems; Society of Economic Geologists: Littleton, CO, USA, 1984; Volume 1, p. 267. [Google Scholar]
© 2019 by the authors. Licensee MDPI, Basel, Switzerland. This article is an open access article distributed under the terms and conditions of the Creative Commons Attribution (CC BY) license (http://creativecommons.org/licenses/by/4.0/).