Article

Thermal Conductivity of Frozen Sediments Containing Self-Preserved Pore Gas Hydrates at Atmospheric Pressure: An Experimental Study

Skolkovo Institute of Science and Technology (Skoltech), 3, Nobel st., Innovation Center Skolkovo, Moscow 121205, Russia
*
Author to whom correspondence should be addressed.
Geosciences 2019, 9(2), 65; https://doi.org/10.3390/geosciences9020065
Submission received: 12 December 2018 / Revised: 13 January 2019 / Accepted: 24 January 2019 / Published: 29 January 2019
(This article belongs to the Special Issue Gas and Gas Hydrate in Permafrost)

Abstract

:
The paper presents the results of an experimental thermal conductivity study of frozen artificial and natural gas hydrate-bearing sediments at atmospheric pressure (0.1 MPa). Samples of hydrate-saturated sediments are highly stable and suitable for the determination of their physical properties, including thermal conductivity, due to the self-preservation of pore methane hydrate at negative temperatures. It is suggested to measure the thermal conductivity of frozen sediments containing self-preserved pore hydrates by a KD-2 needle probe which causes very little thermal impact on the samples. As shown by the special measurements of reference materials with known thermal conductivities, the values measured with the KD-2 probe are up to 20% underestimated and require the respective correction. Frozen hydrate-bearing sediments differ markedly in thermal conductivity from reference frozen samples of the same composition but free from pore hydrate. The difference depends on the physical properties of the sediments and on changes in their texture and structure associated with the self-preservation effect. Namely, it increases proportionally to the volumetric hydrate content, hydrate saturation, and the percentage of water converted to hydrate. Thermal conductivity is anisotropic in core samples of naturally frozen sediments that enclose visible ice-hydrate lenses and varies with the direction of measurements with respect to the lenses. Thermal conductivity measurements with the suggested method provide a reliable tool for detection of stable and relict gas hydrates in permafrost.

1. Introduction

Gas hydrates are ice-like metastable mineral compounds that form from water and gas under certain pressures and temperatures [1,2] and can exist naturally at both positive and negative temperatures. They store highly concentrated natural gas (mainly methane) and may be a promising new energy source due to their extensive geographical occurrence.
Natural gas hydrates occur in marine bottom sediments and in permafrost [3]. The zone of gas hydrate stability spans a depth interval between 200–250 m in permafrost and 800–1500 m below it. Intrapermafrost and subpermafrost gas hydrates were discovered in northern West Siberia, in Alaska and Canadian Arctic (onshore and offshore), and in the Tibet highlands [4,5,6,7,8,9,10,11]. Subpermafrost hydrate deposits existing at >0 °C are well known from the Mackenzie Delta, Canada (Mallik methane hydrate reservoir) [12], Alaska [13] and Tibet [14].
The presence of gas hydrates in shallow permafrost within 150 m has been inferred from field data and some implicit indicators [15,16]. Methane gas hydrates may exist in the metastable zone [9,17,18] of frozen sediments above the zone of hydrate stability. They are remnant (relict) gas hydrates that formed earlier in frozen sediments under more favorable thermobaric conditions, became metastable in the course of later paleoclimatic events and permafrost evolution, and have survived due to the effect of self-preservation at negative temperatures [19,20]. The relict gas hydrate may be responsible for methane emission and gas explosion hazard in shallow permafrost during drilling and production in gas fields of northern West Siberia [18]. The metastable gas hydrate formations are extremely sensitive to various influences, including the anthropogenic impact and, in their turn, affect the physical properties of frozen sediments [21,22]. Permafrost gas hydrate creates a serious geologic hazard and poses risks to oil and gas exploration and development and requires special studies. The physical (especially, thermal and mechanical) properties of frozen sediments with self-preserved pore gas hydrate can be investigated in experiments, with implications for geotechnical prediction and monitoring. These data are essential for assessing the thawing halos in permafrost horizons containing relict gas around production wells, as well as prediction of the wellbore stability during relict hydrates dissociation. Unfortunately, today there is practically no experimental data of thermal properties of gas hydrates and hydrate-bearing sediments at non-equilibrium conditions (at temperature below 0 °C), except only few publications [23,24] (because most of the publications have covered the thermal properties of gas hydrates and hydrate-contain sediments at stable conditions which are important for methane production from gas hydrates reservoirs [25,26,27,28,29,30,31,32,33,34,35]). The obtained results at non-equilibrium conditions show that the thermal conductivity of frozen hydrate-bearing sediments may change by several times during the self-preservation effect and differs from the thermal conductivity of frozen hydrate-free and hydrate-bearing soils contain stable gas hydrates [36,37]. This study is a continuation of the early works and it is important for understanding the processes of hydrates dissociation in both natural and technical conditions since the processes of heat transfer often determine the rate of these processes. Obtained results can be useful for mathematical modeling of hydrate dissociation phenomena in permafrost.

2. Methods

The thermal conductivity of frozen hydrate-bearing soils was studied at a gas pressure below the equilibrium, at 1 atm (0.1 MPa), in sandy and silty samples (Table 1). The soils were sampled from shallow permafrost in gas reservoirs in the northern part of West Siberia presumably containing relict gas hydrates [9,17,18] and artificially saturated with hydrate. Additionally, measurements were applied to natural frozen hydrate-bearing core samples of Lake Baikal bottom sediments with coarse methane hydrate lenses recovered under a water depth of 1364 m during the Baikal Drilling Project [38,39,40]. In their natural occurrence, the bottom sediments have positive temperatures around +3.4 °C but they were frozen up (−9 to −11 °C) and stored at the conditions favorable for methane hydrate self-preservation. The frozen mud samples were dark gray with massive cryostructure; some samples (from 70 cm below the lake bottom and deeper) enclosed hydrate lenses, up to 2.5 cm thick (elongate) and 3 cm in diameter (isometric). The gas hydrates were white, dense, with distinct oblique layering. The gas content right after the core recovery was ~80 cm3/g.
In this study pure methane (99.98%) was used as a prime hydrate-forming gas which was stored in a gas bomb at a pressure of ~8–10 MPa. For comparison in few tests, we used carbon dioxide (99.99%) hydrates. Water-saturated samples were prepared with a specified initial moisture content (W, %) about 17–20 wt. % and placed into a test pressure cell (working volume ~700 cm3), which was then sealed, vacuumed, cooled and filled with the hydrate-forming gas (CH4 or CO2) creating the conditions for pore hydrate formation in the samples [41]. Hydrate formation started at temperatures below 0 °C (about −4 to −6 °C). In our case, gas hydrate was growing directly upon pore ice, which blocked moisture migration and ensured uniform distribution of hydrate in the samples. Then the temperature was raised gradually (approximately 0.5–0.7 °C every 48 h) to low positive values (+1 to +3 °C). Pore hydrate formed faster as the ice melted and produced additional gas-water contacts [42]. When the hydrate formation stopped (gas pressure is almost constant for 48 hours at a temperature above 0 °C), the test cell with hydrate-bearing sediments was cooled down to −6 ± 1 °C, whereby the residual pore water not converted to hydrate froze up. Hydrate saturation in thus obtained sediment samples reached 60% or more. Then the methane pressure in the test cell (at a temperature below 0 °C) was reduced to 0.1 MPa and the frozen hydrate-bearing sediments were taken out (Figure 1 and Figure 2). The samples had a massive (dissemination) ice–hydrate texture with pore hydrate contents uniformly distributed over the sample height [18]. The pore gas hydrates remained stable at ~−6 ± 1 °C for a long time due to self-preservation at negative temperatures [19,20,43,44,45]. In our case (temperature and pressure conditions) gas hydrate dissociation was processed with the formation of supercooled water. Temperature range −5 to −7 °C was used in this study because it is typical for gas realizing permafrost horizons in the northern part of Western Siberia, where natural relict gas hydrates can exist [18]. The frozen samples contain relict gas hydrates were perfectly suitable for measurements of moisture content (W, wt. %), density ( ρ , g/cm3), dry density ( ρ d , g/cm3), porosity (n), gas content and thermal conductivity (λ, W/m·K).
Gas contents were estimated by measuring the volume of gas released (with 3–4 times repeatability) as the samples were thawing in a saturated NaCl solution. The obtained values were used to estimate hydrate saturation [21,23,34], assuming a hydrate number of 5.9 for methane hydrate [46,47]:
The volume content of hydrate (Hv, %) was found as
H v = V h V s a m · 100 %
where Vh is the volume of methane hydrate (cm3); V s a m is the sample volume (cm3).
Hydrate saturation or percentage of pore space filled with hydrate (Sh, %) is inferred from the volume content of hydrate as
S h = H v n
where n is the sample porosity (u.f.). Accuracy of hydrate saturation (Sh, %) was estimated to be about 0.5–1%.
Ice saturation or percentage of pore space filled with ice (Si, %) as
S i = I v n
where I v is the ice volume.
Hydrate coefficient or the fraction of water converted to hydrate (Kh, u.f.) is given by
K h = W h W
where Wh is the percentage of water converted to hydrate (wt., % of dry sample weight) and W is the total amount of water (wt., %).
Some hydrate-bearing samples were stored at negative temperatures −6 ± 1 °C for thermal conductivity monitoring during the self-preservation of pore hydrate.
Thermal conductivity in frozen hydrate-free and hydrate-bearing sediments was measured by a Decagon KD-2 needle probe (USA). This is a 6.5 cm long cylindrical probe, 1.2 mm in diameter, equipped with a 16-bit microprocessor, which automatically calculates thermal conductivity (λ, W/(m·K)) and takes soil surface temperature to an accuracy of 0.1 °C [23]. The unit employs the transient line heat source to calculate and display thermal conductivity within 90-seconds. For details of the method see [48]. The measurements are performed through small holes (~1.2 mm in diameter) drilled in thermally stabilized samples after exposure to −5 to −7 °C for 5–10 min.
The temperature of samples near the sensors rose no more than 0.5 °C during the measurements. This minor warming caused no significant effect on hydrate dissociation in the test cell where the temperature was maintained at −6 ± 1 °C. Reputability of thermal conductivity measurements was run three–four times and then average values were calculated. Sometimes when a difference between serial measurements was more than 0.05 W/(m·K) reputability was more than four times till precision will be 5% or less.
The behavior of gas content was monitored additionally during the thermal conductivity measurements. Reference replica samples free from pore hydrate were used to pick the effect of the gas hydrate component on the thermal conductivity of frozen sediments.
Special thermal conductivity measurements were carried out in reference materials with known thermal conductivities to evaluate the uncertainty (quantitative expression of the accuracy [49]) of the KD-2 tool and its applicability for measuring the thermal parameters (Table 2). The thermal conductivities of the reference materials (quartz glass, limestone and marble), air-dried at room temperature (20 to 25 °C) and fit for such measurements [50], were measured by optical scanning [51] an accuracy of 2%, at a confidence level of 0.95, the needle probe was coated with an inert thermal transfer paste, of ~0.8 W/(m·K), to improve the thermal contact between the probe and the tested samples.
The calibration showed that the thermal conductivity measured with the KD-2 probe was 7% underestimated for both water and glycerin. Correspondingly, we can expect that the uncertainty (total error) in the thermal conductivities of wet and cold (at temperature below 0 °C without pore ice) sediments measured with KD-2 reached 10%, as estimated to 0.95 confidence, which was attributed to the presence of a liquid phase (pore water) between the probe and the sample. The thermal conductivity of solid samples, free from pore water, was at least 20% underestimated: constant trueness (systematic error) of 20% was observed in measurements of three reference materials (Table 2). Therefore, the true thermal conductivity of solid samples can be obtained by adding 20% to the KD-2 readings. The precision (relative error) in the corrected thermal conductivity was no worse than 5% in all cases. Thus, the KD-2 needle probe is applicable for measuring thermal conductivity at negative temperatures, in frozen sediments with low contents of unfrozen water, in the absence of water at the probe-sample contact. The measured values have to be corrected by adding 20% to estimate the true thermal conductivity of frozen sediments with uncertainty ~5%.

3. Results and Discussion

The measurements in sandy and silty samples saturated with hydrate and frozen prior to the tests revealed various trends in the behavior of thermal conductivity.
After the equilibrium pressure in the test cell dropped to 0.1 MPa, the pore gas hydrates in the samples kept at negative temperatures (−6 ± 1 °C) remained stable due to self-preservation. The preservation effect in pore gas hydrates was substantiated by previous experimental results which showed that CH4 hydrates formed with hydrophilic beads could be stable till ~273 [52,53]. According to measurements of hydrate contents in the frozen samples 30 min after the gas pressure drop, 20% to 60% of pore moisture existed in the hydrate form. The presence of pore gas hydrate in frozen samples affects their thermal conductivity which is different in ice and hydrate. The effect of the hydrate component on thermal conductivity is evident on a comparison between hydrate-saturated and hydrate-free samples (Table 3).
The thermal conductivity of hydrate-bearing samples at 0.1 MPa is markedly lower than that of the reference hydrate-free frozen samples (Table 3). The difference may reach several times: it is much greater in the sand that in silty samples and is the greatest (>4 times) for fine sand-2 (W = 21%) with a high percentage of water converted to hydrate (Kh = 0.60) and high hydrate saturation (Sh = 75%). The reason may be in the formation of gas hydrate at grain boundaries in sand samples exposed to alternating freezing and thawing for better hydrate saturation [29,45].
In the experiments of J.F. Wright et al. [32], the thermal conductivity difference between hydrate-bearing and hydrate-free frozen sand was within 70%. However, studied [32] stable gas hydrates at a high pressure (~5–8 MPa) while we applied non-equilibrium conditions (P = 0.1 MPa and t = −6 ± 1 °C) in which the pressure drop and the ensuing partial dissociation of pore hydrates subject to self-preservation may cause the formation of numerous microcracks and structural defects in ice-hydrate crystals. Similar deformation of an ice-hydrate aggregate upon pressure drop to 0.1 MPa was observed earlier under an optical microscope [54]. Microcracks in pore ice-hydrate aggregates may significantly reduce the thermal conductivity of samples in non-equilibrium conditions and increase the difference between hydrate-bearing and hydrate-free frozen sediments.
In our tests, this difference was the smallest (15–30%) for sandy clay samples (Table 3) with quite a high density (1.49–1.56 g/cm3) and a low fraction of pore moisture converted to hydrate (0.2–0.3), possibly due to the absence of hydrates at grain boundaries, as well as to dispersion of the hydrate inclusions over the samples. The thermal conductivity of frozen sand and silt samples saturated with methane and carbon dioxide did not show much difference (Figure 3): 1.80 W/(m·K) in silty sand with pore methane hydrate (W = 22%; Kh = 0.19) and 1.75 W/(m·K) in the case of CO2 saturation, at W = 22%, and Kh = 0.16. The thermal conductivity values are similar in these samples because they are originally similar in pure methane and CO2 hydrates [55], as well as because the hydrates of both gases are distributed in a similar way in the pore space of rocks and are subject to self-preservation.
Thermal conductivity studied as a function of hydrate saturation (Sh) in silty sand with W = 17% (Figure 4) showed a decrease from 1.79 W/(m·K) to 1.24 W/(m·K) in the saturation range 24 to 36%. The thermal conductivity difference of hydrate-saturated samples from that of reference hydrate-free frozen samples (where it was originally 1.95 W/(m·K)) increases with increasing Sh.
A joint effect of hydrate and ice saturation on thermal conductivity is evident in silty sand samples all having Kh around 0.3 (Table 4). Although Kh of the samples was the same, their thermal conductivity increased from 1.00 to 1.77 W/(m·K) upon Sh and Si increase, because a greater pore space volume became filled with ice and hydrate, while the difference between hydrate-saturated and hydrate-free frozen samples reduced.
Other experiments focused on the time-dependent behavior of thermal conductivity in frozen samples upon slow dissociation of pore gas hydrates at atmospheric pressure. As it was shown earlier [23,56], pore gas hydrates in frozen sediments can remain stable after gas pressure drop in the test cell, for quite a long time depending on lithology and PT conditions [18,46]. Pore hydrates dissociate rapidly right after the pressure drop and then the dissociation rate decays to zero. The decay is due to the self-preservation effect in pore gas hydrates (Figure 5). Pore ice that forms upon freezing of residual water not converted to hydrate (non-clathrate water) plays a special role in the self-preservation of gas hydrates. It increases the stability of gas hydrate and maintains its primary preservation. Pore hydrates in samples with higher ice contents commonly dissociate more rapidly after the pressure drops to below the equilibrium. For instance, the dissociation of pore hydrates in the sandy clay sample with the highest initial water content began decaying a few hours after the pressure drop (Figure 5a, red circles).
As the hydrate saturation of soil samples decreases, the contents of ice that forms upon hydrate dissociation increases: Sh and Si of fine sand-2 (W = 17%) were, respectively, 36% and 30% at the run start and became 9% and 58%, respectively, in 55 hours. Note also that the fraction of water converted to hydrate reduced during the experiment from 0.43 to 0.13.
The experimentally observed time-dependent thermal conductivity of frozen hydrate-saturated sediments at non-equilibrium conditions increases as a result of slow dissociation of pore hydrates. The increase is especially rapid in the first few hours and then thermal conductivity stabilizes as the hydrate dissociation slows down. Namely, the thermal conductivity of the frozen hydrate-bearing fine sand-2 sample increases from 0.50 to 1.65 W/(m·K) in the first ten hours but becomes only 6% higher (1.75 W/(m·K)) for the following 40 hours. Most likely, this behavior results from concurrent hydrate content decrease and ice content increase, while the ice undergoes metamorphism: it becomes less porous and more monolithic, as it was shown in a special study [57]. Note that samples with methane and carbon dioxide hydrates demonstrate similar trends (Table 5). Namely, the thermal conductivity of frozen fine sand-1 with pore CH4 hydrate, at 0.1 MPa, was 1.11 W/(m·K) 30 min after the pressure drop and 1.80 W/(m·K) in 240 h, while Sh decreased from 14 to 6% for this time. The sample saturated with CO2 hydrate behaved in the same way: its thermal conductivity increased from 1.17 W/(m·K) at Sh = 32% to 1.71 W/(m·K) at Sh = 4% for 135 hours, while the reference frozen sample had an invariable conductivity of λfr = 2.05 W/(m·K).
Time-dependent changes in thermal conductivity upon pore hydrate dissociation were also observed in the samples of silty sand (W = 17%) and sandy clay (W = 22%) (Figure 5b), but the difference between the initial and final conductivity values was smaller than in the case of sand. The explanation may be that fine-grained porous soils lack hydrate at grain boundaries, though the initial hydrate saturation may be quite high (Sh = 22% in sandy clay). Furthermore, the samples of silty sand and sandy clay become less heavily cracked upon dissociation of pore hydrate, possibly, because unfrozen pore water relieves stress between the soil particles and the ice+hydrate aggregate in the pores. This may be the reason of relatively high thermal conductivity (1.57 W/(m·K)) of hydrate-bearing silty sand (W = 17%) at the run start (Figure 5, open squares), which increased to 1.77 W/(m·K) in the end, at Sh = 4%, or 13% higher, in 100 h. Note that the thermal conductivity of the reference hydrate-free silty sand sample was 1.87 W/(m·K).
The thermal conductivity of sandy clay (W = 22%) with hydrate saturation as high as 85% increased as well (Figure 5b, red circles), though moderately: from 1.75 W/(m·K) in the beginning to 2.1 W/(m·K) in 170 h (20%). Hydrate dissociation began decaying as early as 3 h after the pressure drop, due to high ice contents which favor the self-preservation of hydrates.
The sample of frozen hydrate-bearing fine sand-2 had its initial thermal conductivity much lower than the silty samples (0.5 W/(m·K) against 1.5 W/(m·K) the lowest), possibly, due to the presence of hydrates at its grain boundaries, as well as to numerous microcracks in the ice+hydrate aggregates in the pores caused by the pressure drop and hydrate dissociation.
Unlike the sand samples, the silty rocks are expected to lack hydrates at grain boundaries and to be less heavily deformed as a result of stress release through unfrozen pore water. Note that frozen sand soils lack unfrozen pore water and their pore ice and hydrate are prone to intense cracking.
The thermal conductivity behavior in natural hydrate-bearing sediments was studied also in three frozen mud samples recovered by drilling from the Lake Baikal bottom. Two of them (S-2 and S-3) enclosed visible hydrate lenses. The samples were kept frozen in conditions favorable for gas hydrate self-preservation (t = −9 to −11 °C). Generally, the frozen samples with and without pore hydrate had similar mineralogy, and their water content was in a range of 45 to 50 %, the bulk density from 1.36 to 1.52 g/cm3, and the porosity about 0.6–0.65. The similarity is due to the fact that the samples were recovered from the same lithological unit, but above or below the hydrate stability line.
Sample S-1 had no visible hydrate inclusions and lacked pore hydrate, according to data on gas contents. Samples S-2 and S-3 enclosed large hydrate lenses, elongate (up to 2.5 cm thick) or isometric (up to 3 cm in diameter). The ice-hydrate aggregate was white, with a density of 0.66 to 0.9 g/cm3. At the run start, the ice-hydrate lenses contained 40–46% hydrate. The gas released from the hydrate was pure methane (up to 99% CH4), of biogenic origin judging by low δ13C = −60‰.
The hydrate-free frozen sample showed almost no anisotropy of thermal conductivity, which was within 1.24–1.40 W/(m·K) irrespective of direction, and the anisotropy coefficient was 0.94 (Figure 6). Unlike this, the thermal conductivity of hydrate-bearing samples was anisotropic and varied with the direction of measurements relative to the hydrate lenses (Figure 7). Specifically, it was lower along than across the ice-hydrate lenses: 0.77 to 0.82 W/(m·K) against 1.07 and 1.36 W/(m·K) in sample S-2 and 0.76 to 0.91 W/(m·K) against 1.17 W/(m·K) in S-3 (Figure 7), with the coefficients 0.63 and 0.70, respectively. The anisotropy results from the fact that the thermal conductivity across the ice-hydrate lenses mainly represents the mineral component while that along the lenses corresponding to the ice+hydrate component. The thermal conductivities of the lenses vary as a function of relative percentages of ice and hydrate (Figure 8) and is higher in the case of lower hydrate contents (within 10%) than in the samples with up to 46% hydrate. Thus, the presence of gas hydrate lenses and layers in rocks leads to heterogeneity in their thermal conductivity.

4. Conclusions

The thermal conductivity of frozen sediments with self-preserved pore hydrates can be measured at a gas pressure below equilibrium with a KD-2 needle probe which causes a very little thermal effect on the test samples. The reported experimental study performed with this method at atmospheric pressure has revealed several prominent trends in the thermal conductivity behavior of natural and manmade samples of frozen hydrate-bearing sediments.
  • Frozen samples of the same composition with and without pore hydrates differ markedly in thermal conductivity measured at non-equilibrium conditions (at P = 0.1 MPa and t = −6 ± 1 °C). The difference may reach tens of percent or more, depending on the composition and structure of sediments, due to about four-fold thermal conductivity difference between pore ice and hydrate. It is the highest in the sand with high hydrate saturation where cracked gas hydrate forms at the boundaries of soil particles and impedes heat transfer. For instance, the thermal conductivity of frozen hydrate-bearing fine sand-2 (W = 10%) is 1.28 W/(m·K) but 2.09 W/(m·K) in the absence of pore hydrate.
  • As the fraction of pore water converted to hydrate (and hydrate saturation) increases, the thermal conductivity of frozen samples decreases and becomes ever more different from that of hydrate-barren sediments.
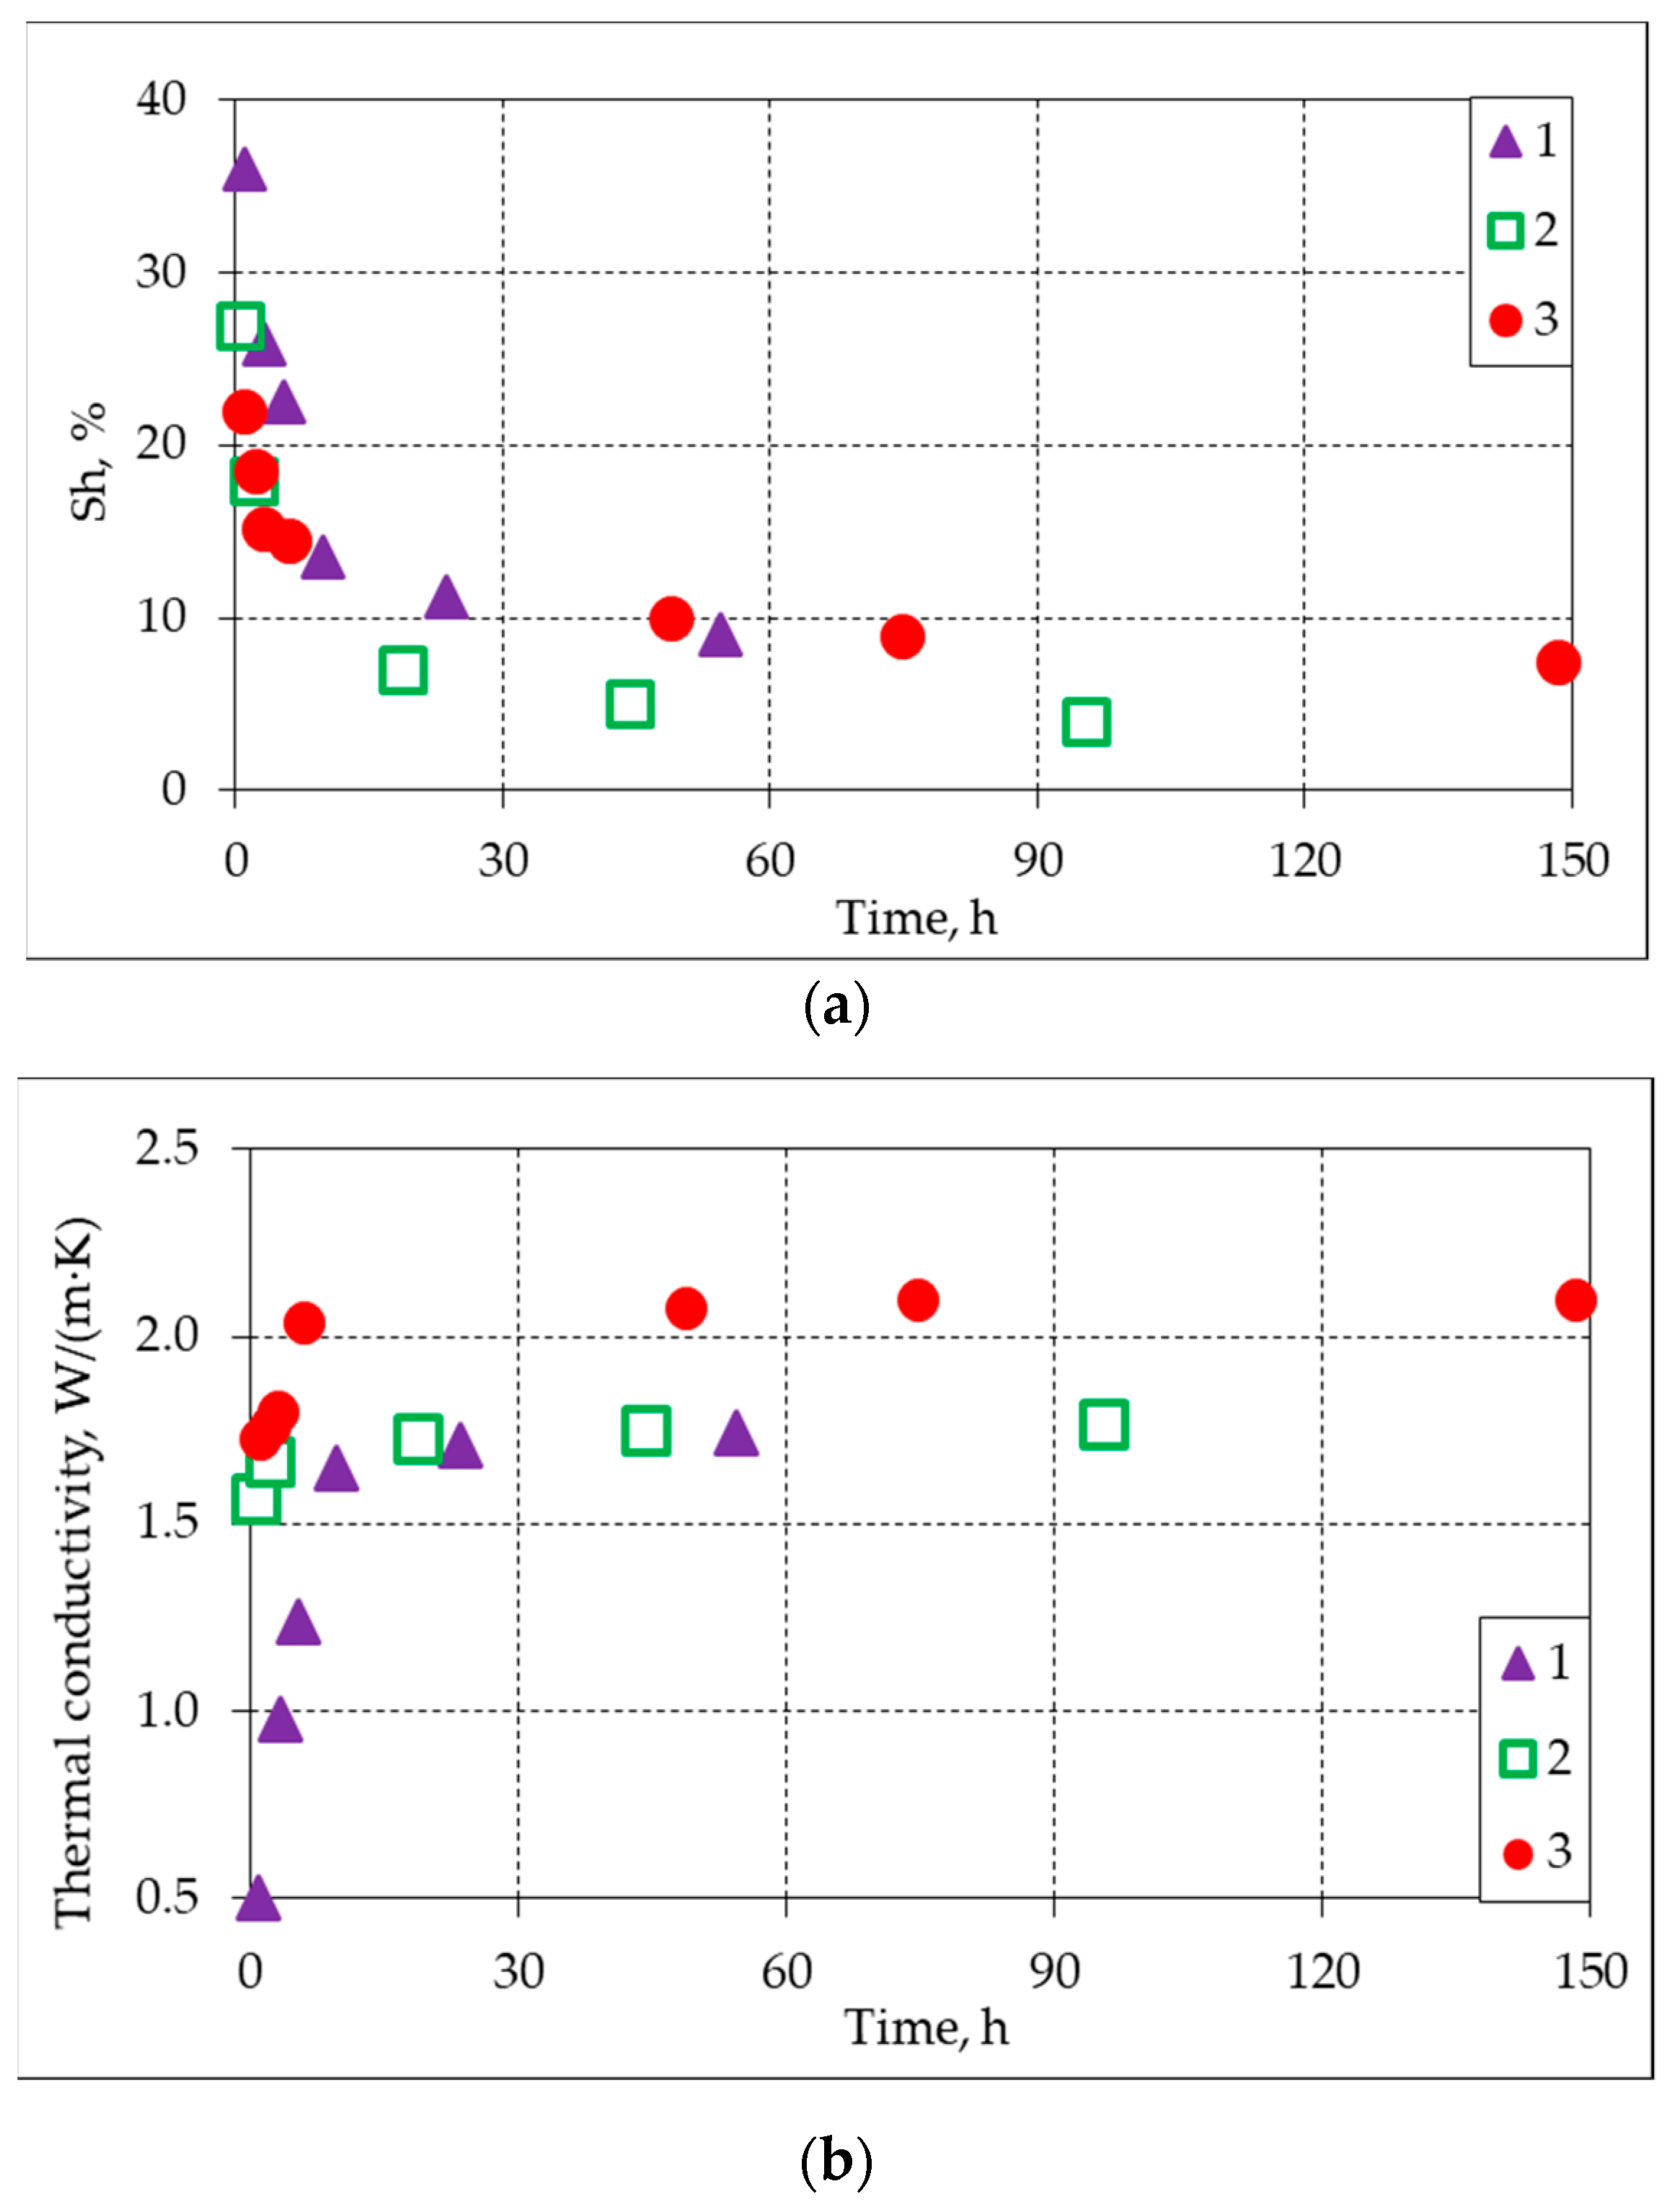
  • After the pressure in the test cell drops to 0.1 MPa, the thermal conductivity of frozen hydrate-bearing sediments increases as a result of slow pore hydrate dissociation and additional ice formation. For instance, it increased from 0.5 W/(m·K) to 1.74 W/(m·K) in 55 hours in fine sand-1, at t = −6 ± 1 °C, while the hydrate saturation reduced 36 to 9%.
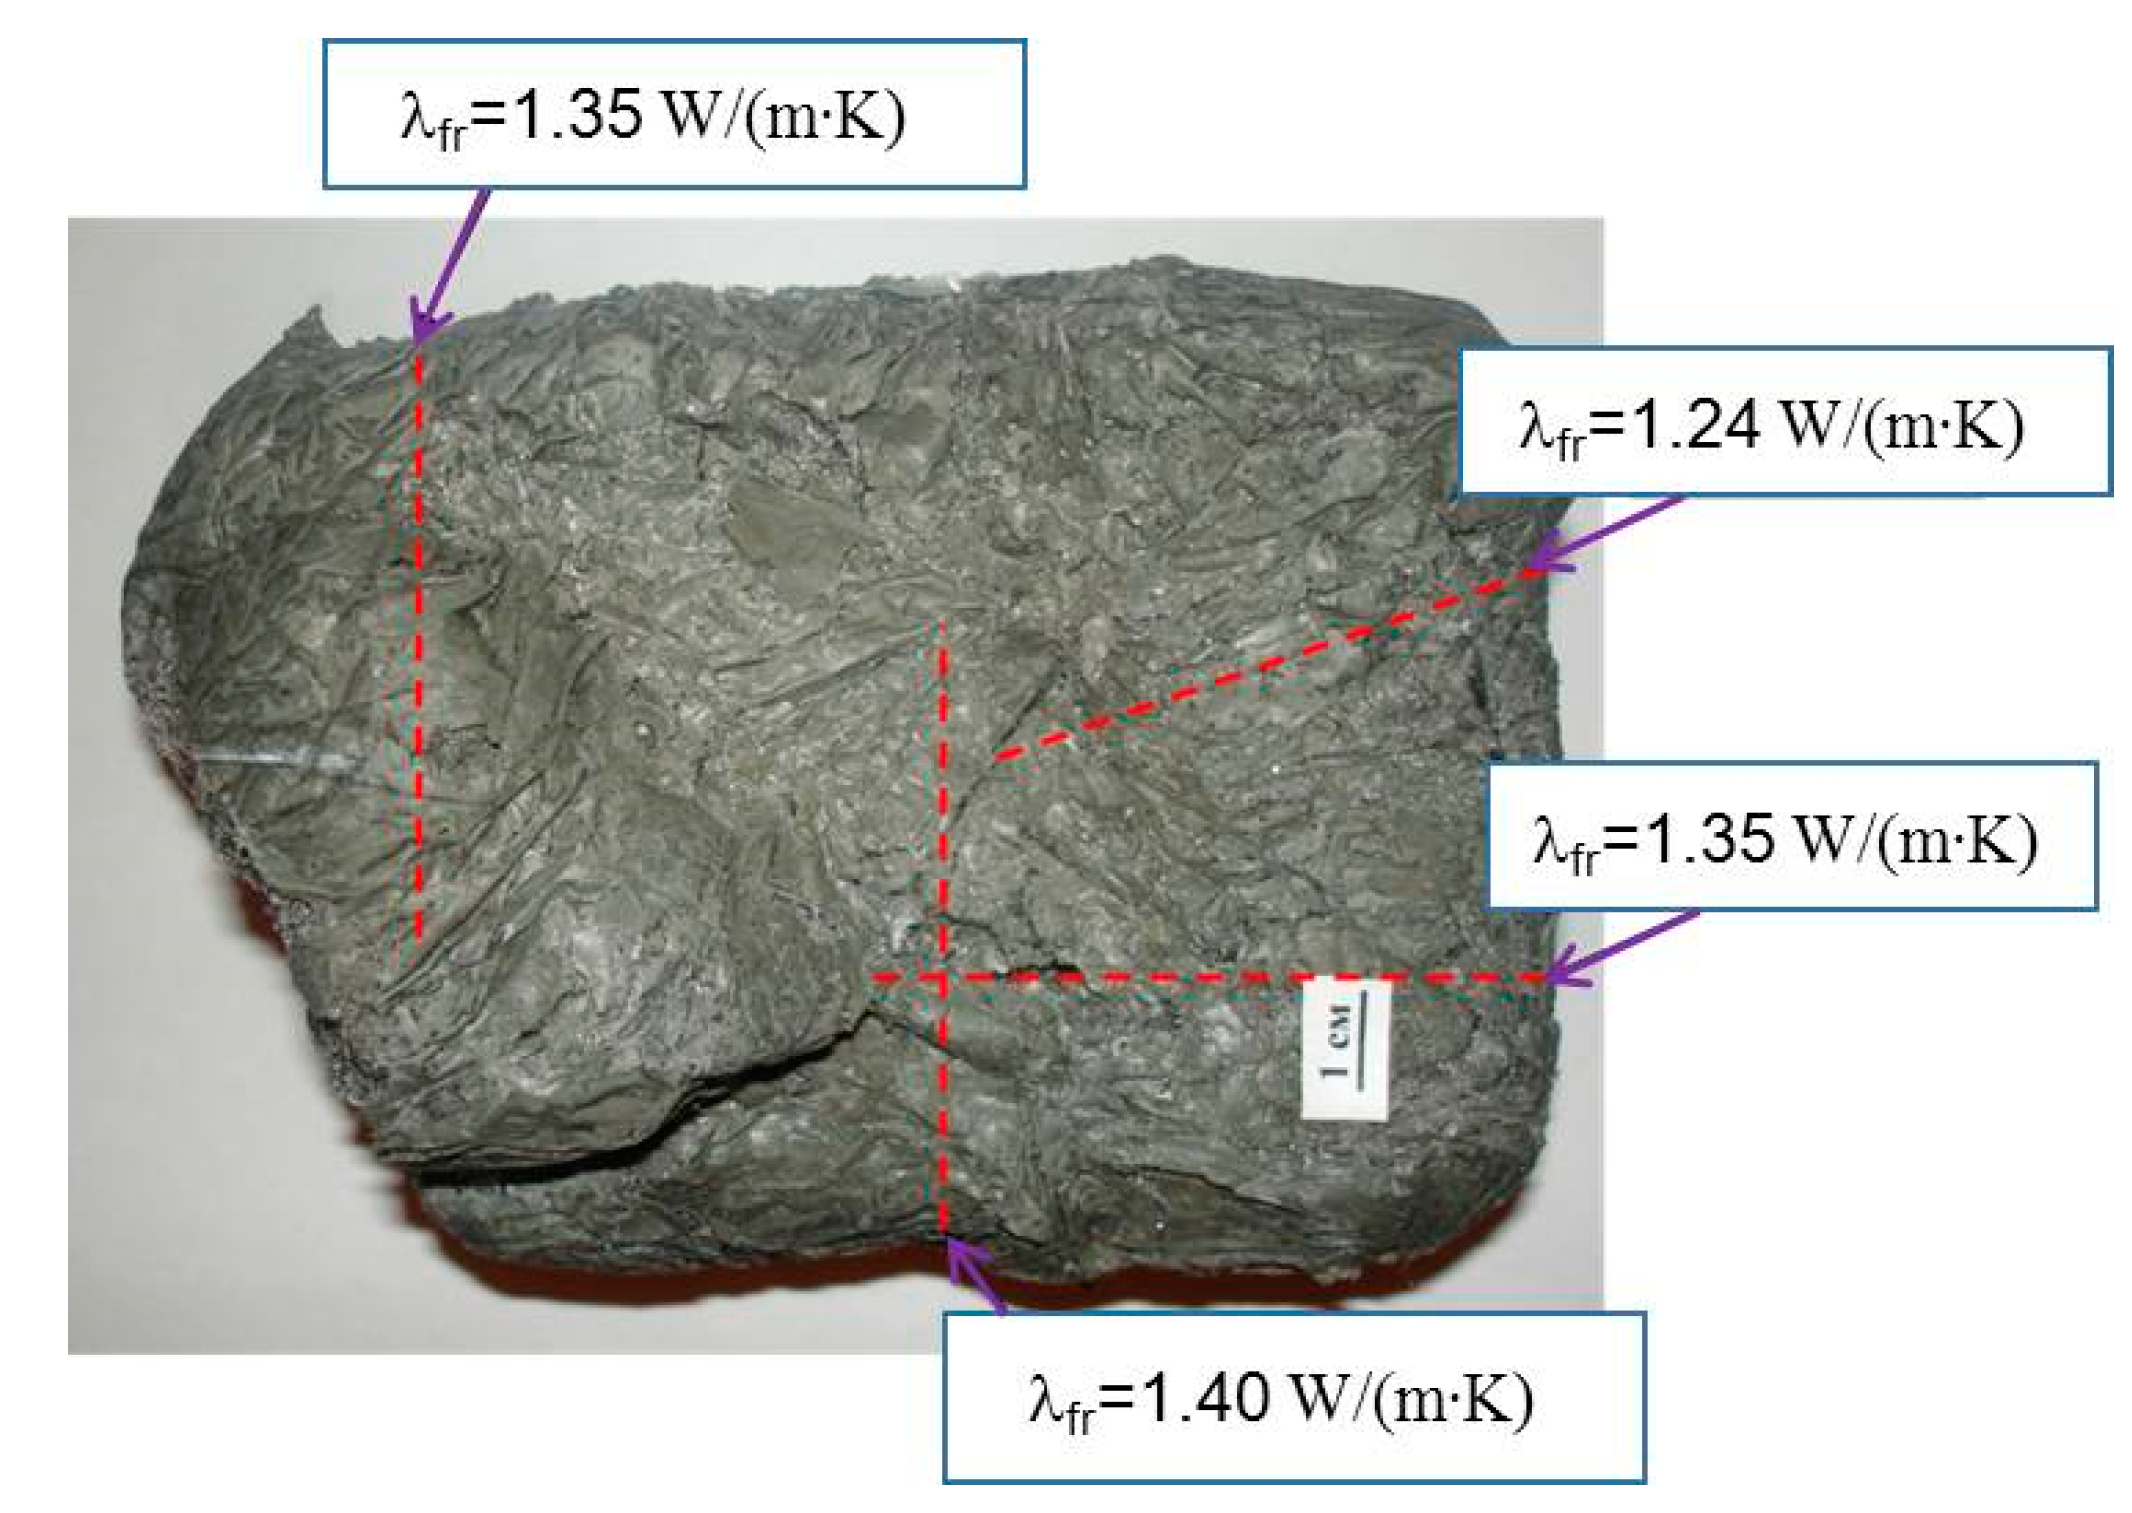
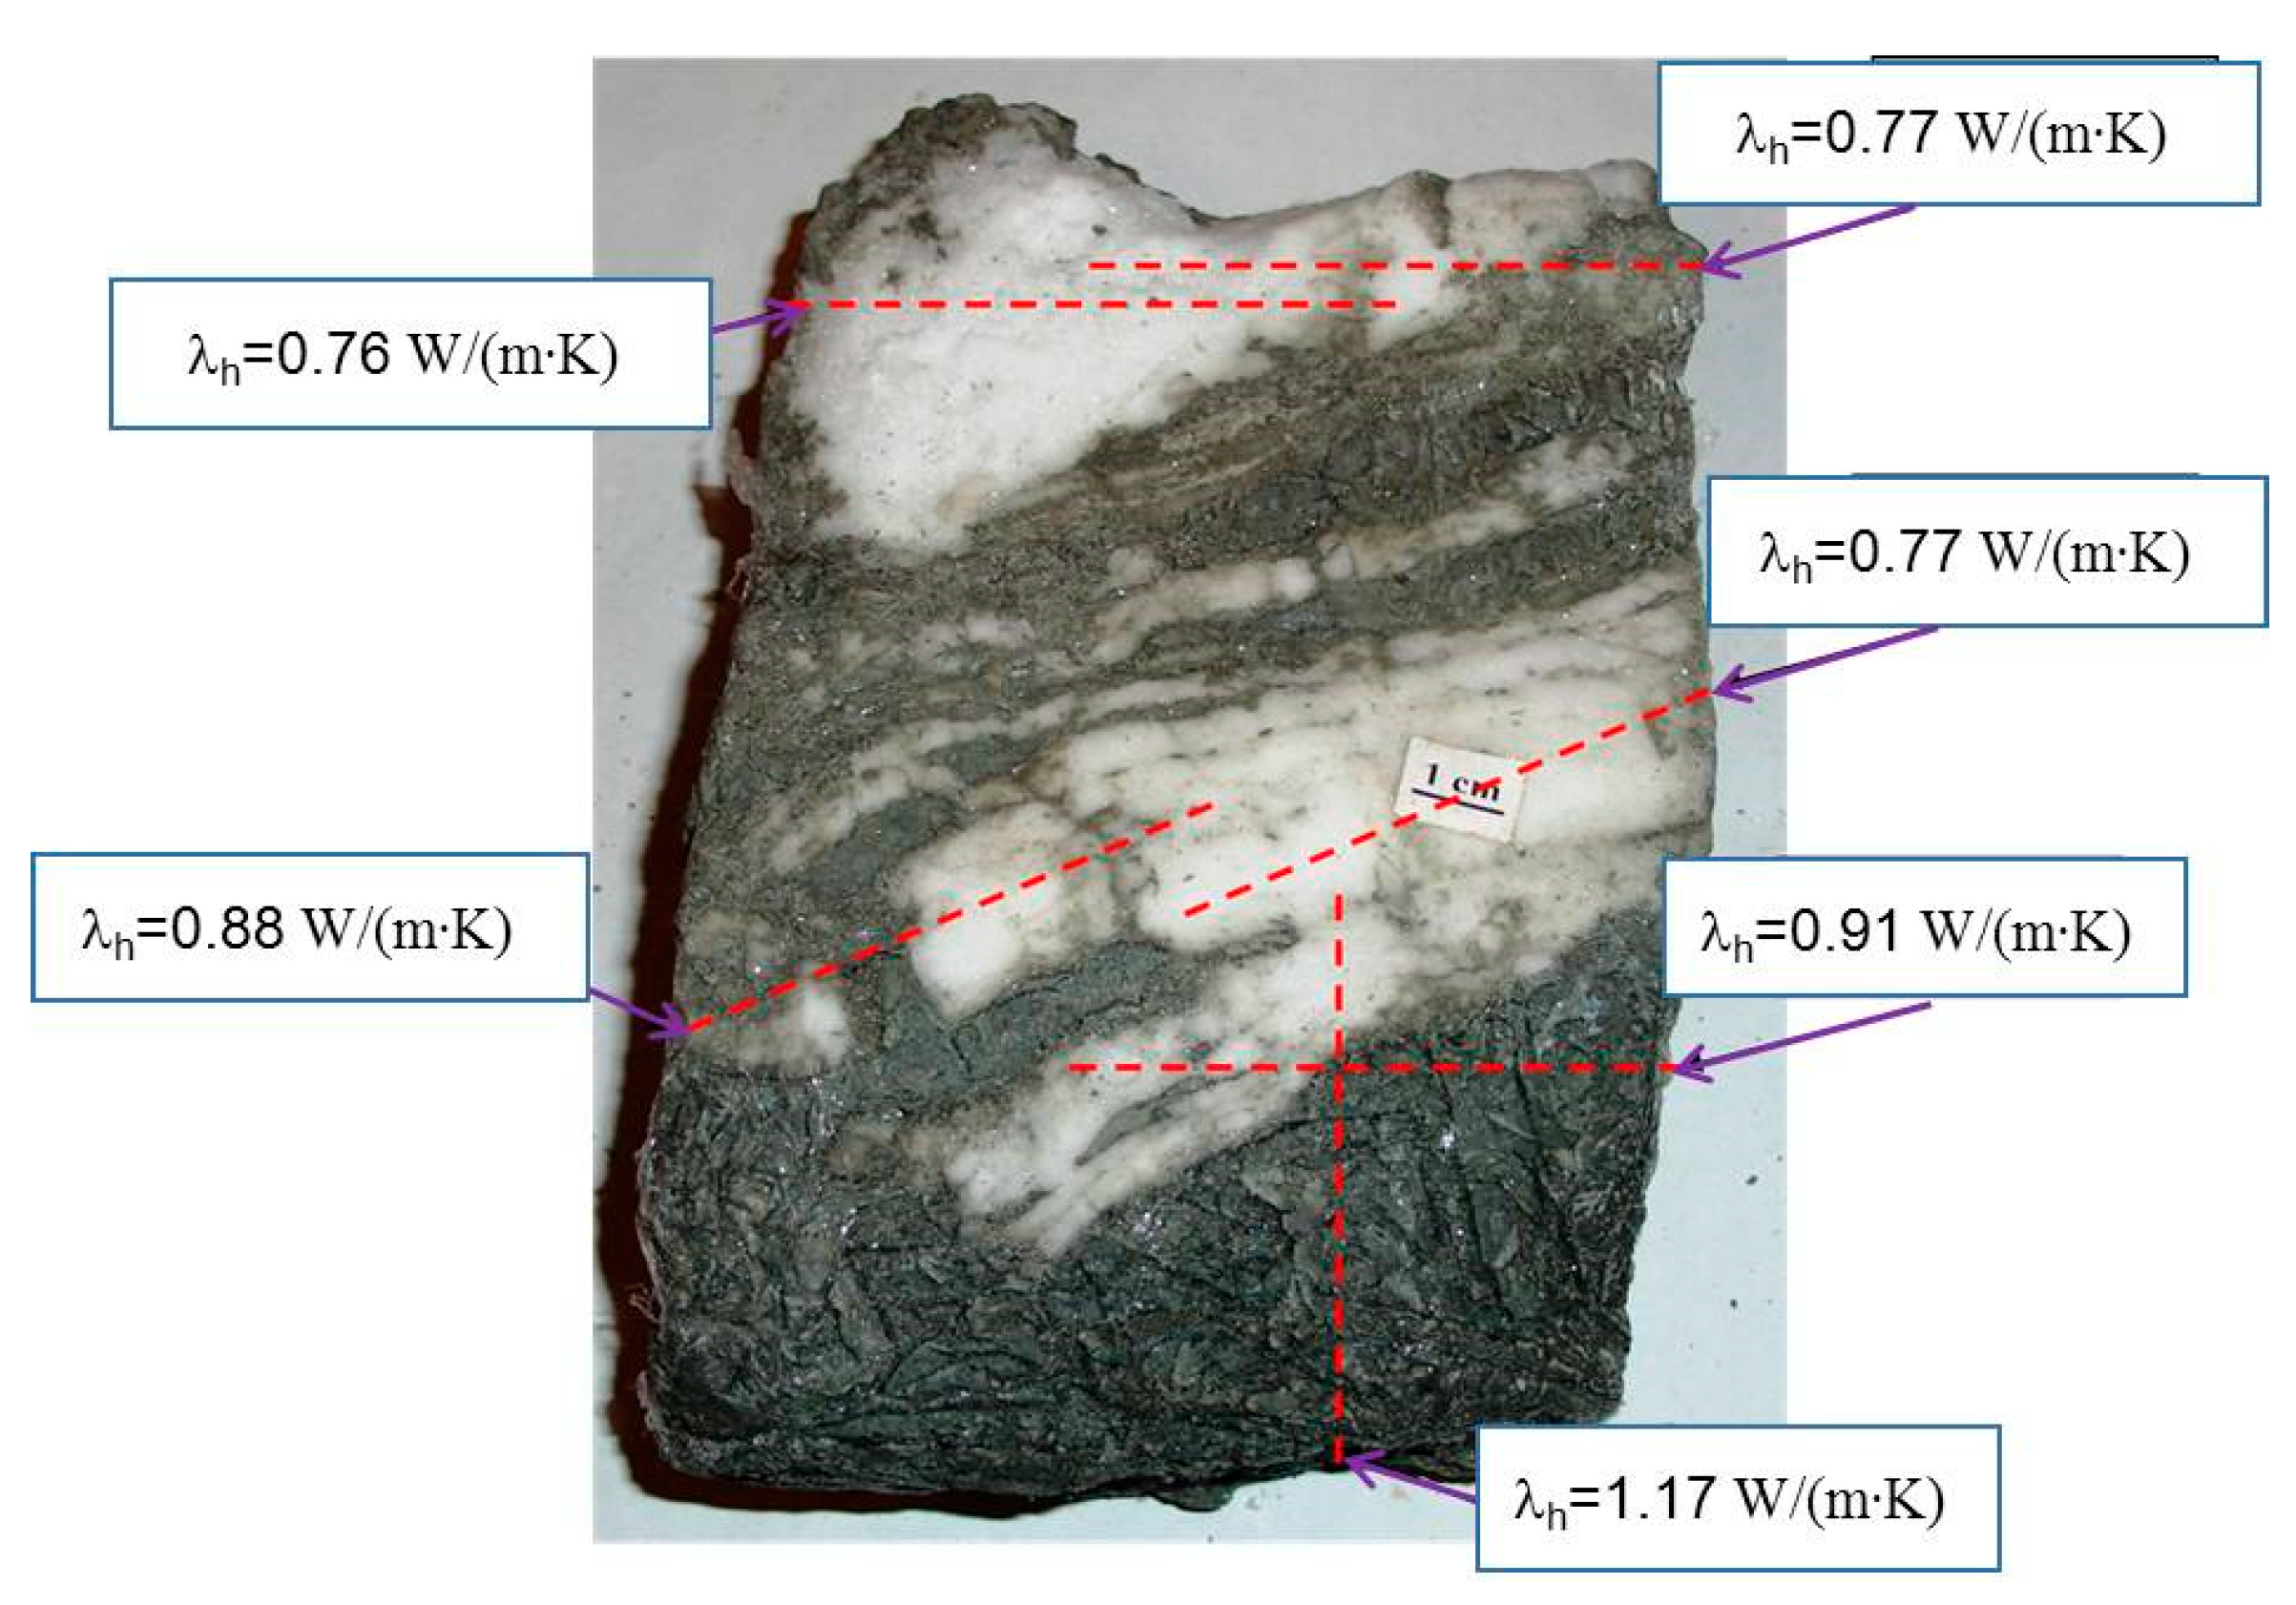
  • The thermal conductivity of frozen natural hydrate-bearing core samples of Lake Baikal bottom sediments is anisotropic and varies with the direction of measurements with respect to ice-hydrate lenses: from 0.77 W/(m·K) along the lenses to 1.37 W/(m·K) in the orthogonal direction.
In general, the obtained results demonstrate that measuring thermal conductivity is a promising tool for the detection and mapping of permafrost-associated stable or relict pore gas hydrates.

Author Contributions

conceptualization, supervision, E.C.; experimental methodology, carry out experiments, processing and analysis, writing manuscript and editing, E.C., B.B.

Funding

The research was supported by the Russian Science Foundation (grants Nos. 16-17-00051 and 18-77-10063).

Conflicts of Interest

The authors declare no conflict of interest.

References

  1. Makogon, Y.F. Hydrates of Natural Gases; NEDRA: Moscow, Russia, 1974; p. 208. ISBN 978-0878141654. (In Russian) [Google Scholar]
  2. Sloan, E.D.; Koh, C.A. Clathrate Hydrates of Natural Gases, 3rd ed.; CRC Press: Boca Raton, FL, USA, 2008; p. 752. ISBN 978-0-8493-9078-4. [Google Scholar]
  3. Max, D.M.; Johnson, A.H.; Dillon, W.P. Natural Gas Hydrate—Arctic Ocean Deepwater Resource Potential; Springer: Dordrecht, The Netherlands, 2013; p. 113. ISBN 978-3-319-02508-7. [Google Scholar]
  4. Cherskiy, N.V.; Tsarev, V.P.; Nikitin, S.P. Investigation and prediction of conditions of accumulation of gas resources in gas-hydrate pools. Pet. Geol. 1985, 21, 65–89. (In Russian) [Google Scholar]
  5. Bird, K.J.; Magoon, L.B. Petroleum Geology of the Northern Part of the Arctic National Wildlife Refuge, Northeastern Alaska. U.S. Geological Survey, Bulletin 1778; US Government Printing Office: Washington, DC, USA, 1987; p. 329.
  6. Judge, A.S.; Majorowicz, J.A. Geothermal conditions for gas hydrate stability in the Beaufort-Mackenzie area: The global change aspect. Glob. Planet. Chang. 1992, 98, 251–263. [Google Scholar] [CrossRef]
  7. Judge, A.S.; Smith, S.L.; Majorowicz, J.A. The current distribution and thermal stability of gas hydrates in the Canadian Polar Region. In Proceedings of the Fourth Offshore and Polar Engineering Conference, Osaka, Japan, 10–15 April 1994; pp. 307–313. [Google Scholar]
  8. Dallimore, S.R.; Uchida, T.; Collett, T.S. Scientific Results from JAPEX/JNOC/GSC Mallik 2L-38 Gas Hydrate Research Well, Mackenzie Delta, Northwest Territories, Canada. Geological Survey of Canada, Bulletin 544; US Government Printing Office: Washington, DC, USA, 1999; p. 403. ISBN 0-660-17777-3.
  9. Yakushev, V.S.; Chuvilin, E.M. Natural gas and hydrate accumulation within permafrost in Russia. Cold Reg. Sci. Technol. 2000, 31, 189–197. [Google Scholar] [CrossRef]
  10. Liang, Y.P.; Li, X.S.; Li, B. Assessment of gas production potential from hydrate reservoir in Qilian mountain permafrost using five-spot horizontal well system. Energies 2015, 8, 10796–10817. [Google Scholar] [CrossRef]
  11. Ruppel, C. Permafrost-associated gas hydrate: Is it really approximately 1 % of the global system? J. Chem. Eng. Data 2015, 60, 429–436. [Google Scholar] [CrossRef]
  12. Henninges, J.; Schrötter, J.; Erbas, K.; Huenges, E. Temperature field of the Mallik gas hydrate occurrence-implications on phase changes and thermal properties. In Scientific Results from the Mallik 2002 Gas Hydrate Production Research WellPmgram, Mackenzie Delta, Northwest Territories, Canada. Geological Survey of Canada, Bulletin 585; Dallimore, S.R., Collett, T.S., Eds.; Ottawa, ON, Canada, 2005; p. 14. [Google Scholar]
  13. Collett, T.S.; Lee, M.W.; Agena, W.F.; Miller, J.J.; Lewis, K.A.; Zyrianova, M.V.; Boswell, R.; Inks, T.L. Permafrost associated natural gas hydrate occurrences on the Alaskan North Slope. Mar. Pet. Geol. 2011, 28, 279–294. [Google Scholar] [CrossRef]
  14. Fang, H.; Xu, M.; Lin, Z.; Zhong, Q.; Bai, D.; Liu, J.; Pei, F.; He, M. Geophysical characteristics of gas hydrate in the Muli area, Qinghai province. J. Nat. Gas Sci. Eng. 2017, 37, 539–550. [Google Scholar] [CrossRef]
  15. Dallimore, S.R.; Collett, T.S. Intrapermafrost gas hydrates from a deep core hole in the Mackenzie Delta, Northwest Territories, Canada. Geology 1995, 23, 527–530. [Google Scholar] [CrossRef]
  16. Dallimore, S.R.; Chuvilin, E.M.; Yakushev, V.S.; Grechischev, S.E.; Ponomarev, V.; Pavlov, A. Field and laboratory characterization of intrapermafrost gas hydrates, Mackenzie Delta, N.W.T., Canada. In Proceedings of the 2nd International Conference on Natural Gas Hydrates, Toulouse, France, 2–6 June 1996; pp. 525–531. [Google Scholar]
  17. Chuvilin, E.M.; Yakushev, V.S.; Perlova, E.V. Gas and possible gas hydrates in the permafrost of Bovanenkovo gas field, Yamal Peninsula, West Siberia. Polarforschung 2000, 68, 215–219. [Google Scholar]
  18. Chuvilin, E.; Bukhanov, B.; Davletshina, D.; Grebenkin, S.; Istomin, V. Dissociation and self-preservation of gas hydrates in permafrost. Geosciences 2018, 8, 431. [Google Scholar] [CrossRef]
  19. Yershov, E.D.; Lebedenko, Yu.P.; Chuvilin, E.M.; Istomin, V.A.; Yakushev, V.S. Features of gas hydrates in permafrost. Dokl. Akad. Nauk. 1991, 321, 788–791. (In Russian) [Google Scholar]
  20. Stern, L.; Circone, S.; Kirby, S.H.; Durham, W. Anomalous preservation of pure methane hydrates at 1 atm. J. Phys. Chem. 2001, 105, 537–542. [Google Scholar] [CrossRef]
  21. Chuvilin, E.M.; Bukhanov, B.A.; Grebenkin, S.I.; Doroshin, V.V.; Iospa, A.V. Shear strength of frozen sand with dissociating pore methane hydrate: An experimental study. Cold Reg. Sci. Technol. 2018, 153, 101–105. [Google Scholar] [CrossRef]
  22. Yakushev, V.S.; Semenov, A.P.; Bogoyavlensky, V.I.; Medvedev, V.I.; Bogoyavlensky, I.V. Experimental modeling of methane release from intrapermafrost relic gas hydrates when sediment temperature change. Cold Reg. Sci. Technol. 2018, 31, 189–197. [Google Scholar] [CrossRef]
  23. Bukhanov, B.A.; Chuvilin, E.M.; Guryeva, O.M.; Kotov, P.I. Experimental study of the thermal conductivity of the frozen sediments containing gas hydrate. In Proceedings of the 9th International Conference on Permafrost, Fairbanks, AK, USA, 23 June–3 July 2008; pp. 205–209. [Google Scholar]
  24. Li, D.; Liang, D.; Fan, S.; Peng, H. Estimation of ultra-stability of methane hydrate at 1 atm by thermal conductivity measurement. J. Nat. Gas Chem. 2010, 19, 229–233. [Google Scholar] [CrossRef]
  25. Stoll, R.D.; Bryan, G.M. Physical properties of sediments containing gas hydrates. J. Geophys. Res. 1979, 84, 1629–1634. [Google Scholar] [CrossRef]
  26. Groysman, A.G. Thermal Properties of Gas Hydrates; Nauka: Novosibirsk, Russia, 1985; p. 94. (In Russian) [Google Scholar]
  27. Huang, D.; Fan, S. Measuring and modeling thermal conductivity of gas hydrate-bearing sand. J. Geophys. Res. 2005, 110, B01311. [Google Scholar] [CrossRef]
  28. Rosenbaum, E.J.; English, N.J.; Johnson, J.K.; Shaw, D.W.; Warzinski, R.P. Thermal conductivity of methane hydrate from experiment and molecular simulation. J. Phys. Chem. B 2007, 111, 13193–13205. [Google Scholar] [CrossRef]
  29. Waite, W.F.; Stern, L.A.; Kirby, S.H.; Winters, W.J.; Mason, D.H. Simultaneous determination of thermal conductivity, thermal diffusivity and specific heat in sI methane hydrate. Geophys. J. Int. 2007, 169, 767–774. [Google Scholar] [CrossRef] [Green Version]
  30. Warzinski, R.P.; Gamwo, I.K.; Rosenbaum, E.J.; Myshakin, E.M.; Jiang, H.; Jordan, K.D.; English, N.J.; Shaw, D.W. Thermal properties of methane hydrate by experiment and modeling and impacts upon technology. In Proceedings of the 6th International Conference on Gas Hydrates, Vancouver, BC, Canada, 6–10 July 2008; pp. 1–9. [Google Scholar]
  31. Asher, G.B. Development of a Computerized Thermal Conductivity Measurement System Utilizing the Transient Needle Probe Technique: An Application to Hydrates in Porous Media. Ph.D. Thesis, Dissertation T-3335. Colorado School of Mines, Golden, CO, USA, 1987; p. 179. [Google Scholar]
  32. Wright, J.F.; Nixon, F.M.; Dallimore, S.R.; Henninges, J.; Cote, M.M. Thermal conductivity of sediments within the gas-hydrate-bearing interval at the JAPEX/JNOC/GSC et al. Mallik 5L-38 gas hydrate production research well. In Mallik 5L-38 Gas Hydrate Production Research Well. Geological Survey of Canada, Bulletin 585; Dallimore, S.R., Collett, T.S., Eds.; US Government Printing Office: Washington, DC, USA, 2005; p. 10. [Google Scholar]
  33. Duchkov, A.D.; Manakov, A.Y.; Kazantsev, S.A.; Permyakov, M.E.; Ogienko, A.G. Experimental modeling and measurement of thermal conductivity of sediments containing methane hydrates. Dokl. Earth Sci. 2006, 409, 732–735. [Google Scholar] [CrossRef]
  34. Muraoka, M.; Ohtake, M.; Susuki, N.; Yamamoto, Y.; Suzuki, K.; Tsuji, T. Thermal properties of methane hydrate-bearing sediments and surrounding mud recovered from Nankai Trough wells. J. Geophys. Res. Solid Earth 2014, 119, 8021–8033. [Google Scholar] [CrossRef] [Green Version]
  35. Muraoka, M.; Susuki, N.; Yamaguchi, H.; Tsuji, T.; Yamamoto, Y. Thermal properties of a supercooled synthetic sand–water–gas–methane hydrate sample. Energy Fuels 2015, 29, 1345–1351. [Google Scholar] [CrossRef]
  36. Chuvilin, E.M.; Bukhanov, B.A. Effect of hydrate accumulation conditions on thermal conductivity of gas-saturated soils. Energy Fuels 2017, 31, 5246–5254. [Google Scholar] [CrossRef]
  37. Chuvilin, E.; Bukhanov, B.; Cheverev, V.; Motenko, R.; Grechishcheva, E. Effect of ice and hydrate formation on thermal conductivity of sediments. In Impact of Thermal Conductivity on Energy Technologies; Shahzad, A., Ed.; IntechOpen: London, UK, 2018; pp. 115–132. [Google Scholar] [CrossRef]
  38. De Batist, M.; Klerkx, J.; Van Rensbergen, P.; Vanneste, M.; Poort, J.; Golmshtok, A.Y.; Kremlev, A.A.; Khlystov, O.M.; Krinitsky, P. Active hydrate destabilization in Lake Baikal, Siberia. Terra Nova 2005, 14, 436–442. [Google Scholar] [CrossRef]
  39. Matveeva, T.V.; Mazurenko, L.L.; Soloviev, V.A.; Klerkx, J.; Kaulio, V.V.; Prasolov, E.M. Gas hydrate accumulation in the subsurface sediments of Lake Baikal (Eastern Siberia). Geo.-Mar. Lett. 2003, 23, 289–299. [Google Scholar] [CrossRef]
  40. Khlystov, O.; De Batist, M.; Shoji, H.; Hachikubo, A.; Nishio, S.; Naudts, L.; Poort, J.; Khabuev, A.; Belousov, O.; Manakov, A.; Kalmychkov, G. Gas hydrate of Lake Baikal: Discovery and varieties. J. Asian Earth Sci. 2013, 62, 162–166. [Google Scholar] [CrossRef]
  41. Chuvilin, E.M.; Lupachik, M.V.; Guryeva, O.M. Kinetics research of ice transition into gas hydrate in porous media. In Physics and Chemistry of Ice; Furukawa, Y., Sazaki, G., Uchida, T., Watanabe, N., Eds.; Hokkaido University Press: Sapporo, Japan, 2011; pp. 127–132. [Google Scholar]
  42. Chuvilin, E.M.; Ebinuma, T.; Kamata, Y.; Uchida, T.; Takeya, S.; Nagao, J.; Narita, H. Effects of temperature cycling on the phase transition of water in gas-saturated sediments. Can. J. Phys. 2003, 81, 343–350. [Google Scholar] [CrossRef]
  43. Yakushev, V.S.; Istomin, V.A. Gas-hydrates self-preservation effect. In Physics and Chemistry of Ice; Maeno, N., Hondoh, T., Eds.; Hokkaido University Press: Sapporo, Japan, 1992; pp. 136–139. [Google Scholar]
  44. Kuhs, W.F.; Genov, G.; Staykova, D.K.; Hansen, T. Ice perfection and onset of anomalous preservation of gas hydrates. Phys. Chem. Chem. Phys. 2004, 6, 4917–4920. [Google Scholar] [CrossRef]
  45. Falenty, A.; Kuhs, W.F.; Glockzin, M.; Rehder, G. “Self-preservation” of CH4 hydrates for gas transport technology: Pressure-temperature dependence and ice microstructures. Energy Fuels 2014, 28, 6275–6283. [Google Scholar] [CrossRef]
  46. Chuvilin, E.M.; Kozlova, E.V. Experimental estimation of hydrate-bearing sediments stability. In Proceedings of the 5th International Conference on Gas Hydrate, Thermodynamic Aspects, Trondheim, Norway, 13–16 June 2005; Volume 3, pp. 1562–1567. [Google Scholar]
  47. Chuvilin, E.M.; Davletshina, D. Formation and accumulation of pore methane hydrates in permafrost: experimental modeling. Geosciences 2018, 8, 467. [Google Scholar] [CrossRef]
  48. Bristow, K.; White, R.D.; Kluitenberg, G.J. Comparison of single and dual probes for measuring soil thermal properties with transient heating. Aust. J. Soil Res. 1994, 32, 447–464. [Google Scholar] [CrossRef]
  49. Menditto, A.; Patriarca, M.; Magnusson, B. Understanding the meaning of accuracy, trueness and precision. Accred. Qual. Assur. 2007, 12, 45–47. [Google Scholar] [CrossRef]
  50. Côté, J.; Konrad, J.-M. Thermal conductivity of base-course materials. Can. Geotech. J. 2005, 42, 61–78. [Google Scholar] [CrossRef]
  51. Popov, Y.; Beardsmore, G.; Clauser, C.; Roy, S. ISRM suggested methods for determining thermal properties of rocks from laboratory tests at atmospheric pressure. Rock Mech. Rock Eng. 2016, 49, 4179–4207. [Google Scholar] [CrossRef]
  52. Hachikubo, A.; Takeya, S.; Chuvilin, E.; Istomin, V. Preservation phenomena of methane hydrate in pore spaces. Phys. Chem. Chem. Phys. 2011, 13, 17449–17452. [Google Scholar] [CrossRef]
  53. Takeya, S.; Fujihisa, H.; Gotoh, Y.; Istomin, V.; Chuvilin, E.; Sakagami, H.; Hachikubo, A. Methane clathrate hydrates formed within hydrophilic and hydrophobic porous media: Kinetics of dissociation and distortion of host structure. J. Phys. Chem. C 2013, 117, 7081–7085. [Google Scholar] [CrossRef]
  54. Yershov, E.D.; Lebedenko, Yu.P.; Chuvilin, E.M.; Yakushev, V.S. Microstructure of an ice–methane hydrate agglomerate: An experimental study. Eng. Geol. 1990, 3, 38–44. [Google Scholar]
  55. Sloan, E.D. Clathrate Hydrates of Natural Gases, 2nd ed.; Marcel Dekker, Inc.: New York, NY, USA, 1998; p. 705. ISBN 0824799372. [Google Scholar]
  56. Chuvilin, E.M.; Guryeva, O.M. Experimental study of self-preservation effect of gas hydrates in frozen sediments. In Proceedings of the 9th International Conference on Permafrost, Fairbanks, AK, USA, 23 June–3 July 2008; pp. 263–267. [Google Scholar]
  57. Shimada, W.; Takeya, S.; Kamata, Y.; Uchida, T.; Nagao, J.; Ebinuma, T.; Narita, H. Mechanism of self-preservation during dissociation of methane clathrate hydrate. In Proceedings of the 5th International Conference on Gas Hydrate, Trondheim, Norway, 13–16 June 2005; pp. 208–212. [Google Scholar]
Figure 1. Frozen fine sand‒2 with massive (dissemination) pore ice and CH4 hydrate (W = 10%; Kh = 0.42) [18].
Geosciences 09 00065 g001
Figure 2. Frozen silty sand with massive (dissemination) pore ice and CH4 hydrate (W = 20%; Kh = 0.42) [18].
Geosciences 09 00065 g002
Figure 3. Thermal conductivities of frozen soil samples with CH4 and CO2 pore hydrates at t = −6 ± 1 °C. 1—fine sand-1, W = 15%, Kh = 0.33; 2—silty sand, W = 22%, Kh = 0.18.
Geosciences 09 00065 g003
Figure 4. Thermal conductivity as a function of hydrate saturation in frozen silty sand (W = 17%), at P = 0.1 MPa and t = −6 ± 1 °C.
Geosciences 09 00065 g004
Figure 5. Time-dependent hydrate saturation (a); and thermal conductivity (b) in frozen samples with pore hydrate subject to self-preservation at t = −5−6 °C and P = 0.1 MPa. 1-fine sand-2 (W = 17%); 2-silty sand (W = 17%); 3-sandy clay (W = 22%).
Geosciences 09 00065 g005
Figure 6. Thermal conductivity of the mud sample (S-1) measured in different directions.
Geosciences 09 00065 g006
Figure 7. Thermal conductivity variations with the direction of measurements in sample S-3 containing pore ice and hydrate.
Geosciences 09 00065 g007
Figure 8. Thermal conductivity at different hydrate contents.
Geosciences 09 00065 g008
Table 1. Particle size distribution, mineral composition and salinity of soils.
Type of SedimentSampling Site (Depth of Recovery)Particle Size Distribution, %Mineralogy, %Salinity, %
1–0.05 mm0.05–0.001 mm<0.001 mm
Fine sand-194.83.12.1Quartz > 900.012
Fine sand-2Yamburg GCF
(64 m)
83.214.42.4Quartz − 38
Microcline + albite − 45
Illite − 9
Kaolinite + chlorite − 5
0.09
Silty sandVorkuta41.853.74.5Quartz − 64
Microcline − 9
Albite − 5
0.08
Sandy clayZapolarnoe
OGCF (199 m)
87.64.18.3Quartz − 64
Microcline − 9
Albite − 5
0.2
Bottom siltLake Baikal
(water depth 1364 m)
7.160.532.4Quartz − 66
Plagioclase − 12
Cristobalite − 10
Illite + smectite − 6
Kaolinite − 4
0.01
Note: GCF = gas-condensate field; OGCF = oil-gas-condensate field. The listed mineral phases have percentages > 1%.
Table 2. Precision and trueness of KD-2 thermal conductivity measurements.
Type of MaterialReference Value, W/(m·K)Average Value, W/(m·K)Number of MeasurementsRandom Error, W/(m·K)Relative Error (precision), %Systematic Error (trueness), %
Water0.60
(at +20 °C)
0.56
(at +17 °C)
210.035.7−7
Glycerin0.28
(at +20 °C)
0.30
(at +22 °C)
210.000.07
Marble2.642.15150.052.3−23
Limestone (Carbon Tan)1.771.47250.064.3−20
Quartz glass (TC)1.5431.2780.032.0−21
Note: The precision and trueness are normalized to a confidence level of 0.95.
Table 3. Thermal conductivities of frozen soil samples with (λh) and without (λfr) pore methane hydrate (T = −6 ± 1 °C, P = 0.1 MPa).
Soil TypeW, %⍴, g/cm3Khλh, W/(m·K)λfr, W/(m·K)
Fine sand-1141.430.231.051.67
Fine sand-1161.530.281.112.07
Fine sand-2101.680.311.071.75
Fine sand-2211.680.600.512.32
Silty sand151.770.291.041.61
Silty sand231.940.191.862.15
Sandy clay211.800.291.792.12
Table 4. Joint effect of hydrate and ice saturation on thermal conductivity of frozen silty sand samples with Kh ≈ 0.3 at t = −6 ± 1 °C and P = 0.1 MPa.
W, %Sh, %Si, %λh, W/(m·K)λfr, W/(m·K)
1426331.001.52
1730451.591.93
2232511.772,15
Table 5. Time-dependent thermal conductivity of frozen hydrate-bearing sand samples at non-equilibrium conditions, T = −6 ± 1 °C and P = 0.1 MPa.
Type of SedimentHydrate Forming GasTime after Gas Pressure Drop, hoursSh, %Si, %λh, W/(m·K)
Fine sand-1
(W = 16%)
CH40.514281.11
2406351.80
Fine sand-1
(W = 14%)
CO20.532351.17
1354551.71

