Abstract
Plastic particles are ubiquitous in the marine environment. Given their low density, they have the tendency to float on the sea surface, with possible impacts on the sea surface microlayer (SML). The SML is an enriched biofilm of marine organic matter, that plays a key role in biochemical and photochemical processes, as well as controlling gas exchange between the ocean and the atmosphere. Recent studies indicate that plastics can interfere with the microbial cycling of carbon. However, studies on microplastic accumulation in the SML are limited, and their effects on organic matter cycling in the surface ocean are poorly understood. To explore potential dynamics in this key ocean compartment, we ran a controlled experiment with standard microplastics in the surface and bulk water of a marine monoculture. Bacterial abundance, chromophoric dissolved organic matter (CDOM), and oxygen concentrations were measured. The results indicate an accumulation of CDOM in the SML and immediate underlying water when microplastic particles are present, as well as an enhanced oxygen consumption. If extrapolated to a typical marine environment, this indicates that alterations in the quality and reactivity of the organic components of the SML could be expected. This preliminary study shows the need for a more integrated effort to our understanding the impact of microplastics on SML functioning and marine biological processes.
1. Introduction
1.1. The Structure of the Sea Surface Microlayer, and the Air–Sea Interface
The sea surface microlayer (SML) is the uppermost oceanic boundary; it is an organic surface biofilm [1] up to 1 mm thick, [2,3,4]. It is observable on sunny low-wind days with calm waters when the surface of the sea appears as a smooth perfectly reflecting film. Its formation relies on biologically derived compounds ascending through the water column to the surface and their surface-active properties. Within the SML, marine microorganisms are present in high concentrations with respect to the water column, thanks to its enriched organic matter content [1,3,5,6]. Early studies on the biological features of the SML first appeared in the 1960s in the Sargasso Sea, when Trichodesmium blooms formed visible surface slicks covering areas up to 25 km [7].
The SML is simultaneously both a source and a repository for airborne particles [1,3], and it plays a mediating role in air–sea interactions like gas exchange and marine aerosol emission, with consequences on global ocean dynamics and climate change [6,8,9,10]. The SML is naturally enriched in organic matter and, thus, organic carbon compounds. However, while bulk dissolved organic carbon (DOC) is not generally enriched in the SML, specific organic matter fractions are present at much higher concentrations than in the underlying water. These enriched pools of organic matter include a vast array of organic molecules both in the dissolved and particulate phase, as well as microorganisms, referred to as neuston [2]. These comprise carbohydrates, amino acids, and lipids, amphiphilic compounds with both hydrophobic and hydrophilic moieties that enhance their surface-active properties, facilitating their adsorption at the water–air interface [11]. Surface tension further stimulates collision between dissolved precursors, resulting in the formation and growth of polysaccharidic marine gels [4], insoluble macromolecules derived from dissolved organic matter (DOM) polymers exuded by marine microorganisms during metabolic processes. Marine gels link the dissolved and the particulate organic matter pools [12] that span over a range of dimensions (nm to mm). Present in higher concentrations, marine gels make the SML a gel-like biofilm [13,14,15].
Another important component of the SML is chromophoric dissolved organic matter (CDOM) [16,17,18,19], which constitutes between 20% and 70% of the DOM in oceanic waters and is the principal light-absorbing constituent of DOM [20]. CDOM plays a major role in the attenuation of solar ultraviolet (UV) wavelengths and can reduce the availability of underwater photosynthetically active radiation for primary production [21]. The SML receives elevated solar radiation, and exposure to solar UV radiation modifies the structure of natural components that are present; UV inhibits the aggregation of marine gels [22], and stimulates the bacterial release of extracellular polymeric exudates as UV protection [23,24], contributing to the gelatinous character of the SML. At the same time, UV radiation modifies the molecular characteristics of CDOM, increasing the production of low-molecular-weight organic compounds via photochemical breakdown and increasing the bioavailability of carbon for microbial growth [25]. This results in increased productivity and CO2 production (aerobic degradation), and the generation of reactive chemical species [26]. Elevated DOM degradation in the SML could represent a localized net source of CO2 to the atmosphere, with respect to the overall balance of organic matter production and its biological degradation [27,28].
1.2. Plastic Accumulation and Other Pollutants in the Sea Surface Microlayer
The very first description of marine surface layers was related to anthropogenic pollution and dates back to 1773 when Benjamin Franklin observed ship’s oil spills on the sea surface [2]. The SML is a repository of anthropogenic pollutants, enriched up to a hundred times with respect to the underlying water [8]. These components include persistent organic pollutants (POPs) such as hydrocarbons, organochlorine compounds (polychlorinated biphenyls, for example), and pesticides, as well as heavy metals [10,29,30].
However, the increased production of plastic in the last half century led to its accumulation in marine environments, with an estimated five trillion plastic items present in today’s oceans [31]. There is extensive research on plastic’s impacts on marine life, showing the need for more research and policy measures [32,33,34,35,36]. Microplastics (plastics less than 5 mm in size) [29] are present in particularly elevated concentrations; while the global production of plastic is expected to double over the next two decades [37], in 1972 scientists observed, for the first time, that due to the massive use of plastic, micro-sized particles accumulated in the sea surface acted as biological substrates for the growth of many marine microorganisms [38,39]. More recent studies also showed that the sea surface microlayer accumulates high quantities of low-density microplastics [40,41,42].
As ubiquitous marine constituents, microplastics are likely to have effects at both local and global scales. Locally, the transfer of the plastic debris along the food chain affects fish populations and fisheries. Contaminants adsorbed on microplastic surfaces can be ingested or released during degradation, allowing for transport to even the most remote environments [43,44]. Importantly, microplastics are often less dense than seawater, representing an additional mechanism for POPs to accumulate in the SML [29,44].
The accumulation of anthropogenic compounds of terrestrial origin can have serious ecotoxicological consequences for the marine system. The SML is a unique micro habitat for a variety of organisms: fish eggs of many commercial species, (i.e., Atlantic cod) and larvae (echinoderm, clam) bacteria, micro-invertebrates, and marine algae. Contaminants in this layer are likely to increase mortality, suppress growth rates, and encourage the development of abnormalities and prolonged incubation time for fish eggs [30]. The combination of wastewater discharge, agricultural and industrial run-off, shipping activities, and atmospheric deposition of combustion residues makes coastal areas, bays, and harbors highly enriched in these pollutants compared to the open ocean [30]. These areas are also widely utilized as spawning grounds for a range of different species. It was suggested that the accumulation of pollutants in these areas is influenced by the enrichment of organic matter in the SML; the reduced surface tension caused by a high density of particulate organic matter provides a substrate for pollutant enrichment, leading to formation of visible slicks [45]. Studies showed that DOM and POM can control the concentration and fate of heavy metals in the SML [30]; metal-complexing moieties in the colloidal organic matter phase are known [46] and the DOC pool also contains polyanionic polysaccharides that bind metal cations in solution [47,48].
Studies on the effects of plastics in the SML are limited. However, there is a rising concern that microplastics can interfere with the microbial cycling of organic matter in the oceans [49,50]. Low-density microplastic accumulation in the SML may be particularly important in coastal areas, where concentrations of particulate organic matter are elevated [45]. This modified organic “skin” has the potential to influence the flux of gases across the air–water interface [51]. As the biological response to ocean change affects the SML compounds and processes [10,13,52,53,54], we expect that plastic pollution will have tangible effects on SML composition and reactivity as well.
We present a pilot laboratory study aimed at examining the impact of microplastics on the cycling of organic matter on the ocean’s surface. This preliminary study was based on the hypothesis that microplastics in the SML increase the microbial production of DOM, changing the physical, biological, and chemical properties of the SML with potential impacts on SML functioning. CDOM production, bacterial abundance, and oxygen concentrations were measured in controlled conditions, with and without standard inert microplastics.
2. Materials and Methods
2.1. Experimental Set-Up
The study was a modification of the methodology outlined in Galgani et al. (2018) [49]. A non-axenic strain of Chaetoceros socialis, a marine diatom, was obtained by the Scottish Association of Marine Sciences (CCAP nr. 1010/19) and grown in pre-filtered (0.2 µm) and autoclaved Guillard’s f/2 + Si medium for marine diatoms prepared from artificial seawater according to recipe nr. 1 of the Woods Hole Marine Biological Laboratory [55]. The culture was grown in a 2-L flask on a 12:12 light/dark cycle (light intensity 54.4 ± 0.12 µmol·m−2·s−1) between 18 °C and 20 °C reaching the abundance of 1.94 × 10⁴ cells·mL−1, which was measured microscopically and calibrated with optical density measurements at 420 nm.
After the growth phase, the culture was filtered through a 1-µm membrane to remove only phytoplankton cells while maintaining the DOM and bacteria concentrations. Then, 450 mL of the filtrate was distributed in equal proportions to four 10-L capacity settling aquaria, previously acid-washed (10% HCl), and rinsed with Milli-Q water, measuring 31 cm × 17 cm × 20 cm (height), each containing 4550 mL of filtered and autoclaved seawater, with a density of 1.022 and a salinity of 30 practical salinity units (PSU). In two of the settling aquaria, 5 µL of an aqueous solution of 30-µm-diameter transparent polystyrene beads (density of 1.05 g/m3, SIGMA) were added to reach a final concentration of approximately 1300 particles·L−1 (microplastic, MP treatments). The particles used in the experiment were chosen as the best standard available having a density close to seawater and to the artificial seawater used, while also being inert and of constant size. Two settling aquaria did not receive the microbeads addition (controls). All four aquaria were covered and gently aerated for 24 hours, to ensure proper mixing of the various components and to induce an accumulation of organic material at the surface.
After the incubation, the SML was sampled from each aquarium with a sterile glass syringe to a total of 100 mL (50 mL each), sampling from an average thickness of ~1 mm (Figure 1). After the SML sampling, the underlying water (ULW; ~15 cm) was sampled (to a total of 100 mL) from each settling aquarium with a separate sterile glass syringe and sterile needle.

Figure 1.
The experimental set-up of the pilot experiment.
The SML and ULW collected from the two controls and MP treatments were used to fill 12 quartz cuvettes of 28 mL capacity each (10 cm path length, Hellma 120-QS, Quartz SUPRASIL, Helma Analytics, Müllheim, Germany). Eight of the cuvettes were exposed for 24 hours to a pseudo solar spectrum (Philips OSRAM Metal halide lamp, HQI-TS, 150 W/D, Osram AG, Munich, Germany) at a constant temperature 26 ± 2 °C. The exposition was measured constantly at the surface of the cuvettes (with a 10-nm waveband and center wavelengths of 380, 440, 590, and 670, Skye Instruments). Four cuvettes were maintained in the dark at 18 ± 2 °C. CDOM absorbance and oxygen were measured from each cuvette at the beginning (t0), then after 6, 18, and 24 hours. Bacterial abundance was measured at t0 and after 24 hours.
2.2. Parameters
The parameters here reported are CDOM absorption, bacterial abundance, and dissolved oxygen concentrations. To exclude possible CDOM release from polystyrene particles, a blank control experiment was also run [49].
The CDOM absorbance spectrum was measured with a Lambda 10 ultraviolet–visible light (UV–Vis) Spectrophotometer (Perkin Elmer) from 210 to 750 nm at 960 nm/min, 1 nm wavelength resolution, and room temperature (20 °C ± 2 °C). The instrument was factory calibrated. Baseline corrections were applied each day of analysis and repeated every 10 samples scanned. Spectra were corrected for Milli-Q water each day of analysis and for scattering by subtracting the absorbance values at 700 nm. Absorption coefficients a(λ) were calculated from absorbance values (Aλ) following Bricaud et al. (1981) [56], as shown in Equation (1).
where L is the path length of the cuvette (0.10 m). Absorption (m−1) at 355 nm, a(355), was used as an indicator of CDOM concentration.
a(λ), m−1 = 2.303Aλ/L,
A volume of 1.5 mL was collected from each cuvette for bacterial cell enumerations at the beginning (t0) and at the end of the experiment (after 24 hours). Samples were preserved in 25% glutaraldehyde at −20 °C. Flow cytometry analysis was conducted in a Becton and Dickinson FACSCalibur instrument by detecting the bacteria signature at 488-nm excitation in a plot of side scatter (SSC) versus green fluorescence (FL1). Samples were previously stained with SYBR Green I. Yellow-green latex beads (0.5 µm) were used as an internal standard. Particle-attached bacteria were not measured.
Oxygen concentrations were used as a proxy of microbial activity (consumption). Oxygen was measured with a FireSting Oxygen needle-type optical probe and temperature sensor, PyroScience® (Aachen, Germany). The oxygen sensor was calibrated shortly before the experiment with temperature correction in air-saturated water for a duration of at least 10 minutes or until reaching a plateau in the oxygen curve, against a 0% O2 factory calibration. The oxygen measurements were corrected for temperature and salinity.
2.3. Analysis and Statistics
The enrichment factor (EF), defined as the accumulation of compounds in the SML with respect to the ULW, was calculated as follows [51]:
where (X) is the concentration or absorption in the SML ((X)SML) or in the ULW ((X)ULW). EFs above 1 refer to an enrichment in the SML with respect to the ULW.
EF = (X)ML/(X)ULW,
Both parametric and non-parametric tests were used to compare treatments and light conditions, in relation to the distribution of the data analyzed (normally or non-normally distributed). CDOM and O2 data were normally distributed (unless otherwise stated), while bacterial abundance was not. Paired and unpaired t-tests between samples were performed to answer different questions. To compare between light and dark exposure, an unpaired t-test (normal distribution) and Mann–Whitney tests (non-normal distribution) were used, as the sample groups were considered to be independent, with the null hypothesis of the group A mean (or mean rank) having no difference from group B mean (or mean rank).
To compare samples from SML and ULW pairs and controls versus MP treatment pairs (either SML or ULW) from the same sampling time, the sample groups were considered dependent, and the null hypothesis tested was that the mean difference of all the pairs was equal to zero. Paired t-tests (on normal distributed data) and Wilcoxon signed rank tests (on non-normal distributed data) were used.
Statistical analysis was performed with SigmaPlot (Systat) and Prism7.03 (GraphPad Software, San Diego, CA, USA). Statistical significance was accepted for p < 0.05.
3. Results
3.1. Differences between Dark and Light Conditions
In both controls (Table 1a) and MP treatments (Table 1b), O2 concentration was higher in the dark samples, both in the SML and ULW. CDOM a(355) was higher in the SML of light-exposed samples both in controls and in MP treatments, but showed no significant light-dependent changes in the ULW. Bacterial abundance did not show significant differences between the light/dark incubation in either the SML or in the ULW.

Table 1.
Mean values for parameters measured in both sea surface microlayer (SML) and underlying water (ULW), dark and light samples, and relative standard error of the mean (SE) for control (1a) and microplastics (MP) treatments (1b) separately. It should be noted that not all data were normally distributed, allowing for cases when the mean ± SE of comparative datasets had some overlap. (*) indicates that statistically significant differences (p < 0.05) were found comparing SML against SML and ULW against ULW, separately (unpaired t-tests for O2 and chromophoric dissolved organic matter (CDOM), and Mann–Whitney tests for bacterial abundance, N = 6); and (**) indicates statistically significant differences (p < 0.05) found when comparing SML against ULW in the light and separately in the dark (paired t-tests for O2 and CDOM, and Wilcoxon tests for bacterial abundance, N = 6). a(355)—absorbance at 355 nm.
Considering each dark/light condition separately, there was no significant difference in O2 concentrations between SML and ULW both for controls and MP treatments in the dark (paired t-test p > 0.05). In the light samples, the difference between SML and ULW was significant for MP treatments only (Wilcoxon test, p = 0.02) with a lower O2 concentration in the ULW (Table 1b). In controls (Table 1a), CDOM a(355) was different in the SML of dark samples with respect to the ULW (Wilcoxon test, p = 0.02) while no significant difference was observed between SML and ULW in the samples exposed to light. In MP treatments (Table 1b), the concentration of CDOM a(355) in the SML and ULW was significantly different both in the dark and in the light-exposed samples (paired t-tests, p < 0.05). Similar abundances between SML and ULW in both light and dark samples were instead observed for bacterial cells.
3.2. Differences between Controls and MP Treatments
To compare controls and MP treatments, all dark and light incubations were pooled together. In the SML, controls and MP treatments showed no difference in mean O2 concentrations, while O2 concentrations in the ULW were significantly higher in control samples with respect to MP treatments (paired t-test, p < 0.05) (Figure 2). Mean CDOM concentrations differed significantly both for the SML (Wilcoxon test, p < 0.01) and for the ULW (Wilcoxon test, p < 0.05) pooled samples, with higher concentrations in the MP treatments in both cases. Bacterial abundance did not show significant differences, even though it was slightly higher in the SML of controls and in the ULW of MP treatments (Table 1) (Wilcoxon test, p > 0.05).

Figure 2.
Plots of Tukey mean difference between control and microplastic (MP) treatments, reporting log-transformed (base 2) data means against data differences (MP treatments−controls) for O2 (a,b), CDOM (c,d) concentrations as a(355), and bacterial abundances (e,f) in both sea surface microlayer (SML; left: a,c,e) and underlying water (ULW; right: b,d,f). Significance of the paired t-tests (or Wilcoxon tests) was accepted for p < 0.05.
3.3. Correlations between Parameters
All parameters changed over time; O2 decreased in both the SML (controls, r2 = 0.50, p = 0.006, n = 12; MP treatments, r2 = 0.44, p = 0.011, n = 12) and the ULW (controls, r2 = 0.35, p = 0.024, n = 12; MP treatments, r2 = 0.32, p = 0.033, n = 12); CDOM increased in the SML (controls, r2 = 0.47, p = 0.008, n = 12; MP treatments, r2 = 0.41, p = 0.015, n = 12), but only in the MP treatments in the ULW (controls, r2 = 0.0, p > 0.05, n = 12; MP treatments, r2 = 0.38, p = 0.019, n = 12); bacterial cell numbers increased over time both in the SML (controls, r2 = 0.88, p = 0.004, n = 6; MP treatments, r2 = 0.90, p = 0.003, n = 6) and in the ULW (controls, r2 = 0.79, p = 0.011, n = 6; MP treatments, r2 = 0.85, p = 0.006, n = 6). As expected for such a simplified system, concentrations in the SML were closely related to concentrations in the ULW (Table 2). This confirms the bottom-up enrichment that is often observed in the open sea [57].
Table 2.
Spearman rank order correlations between SML and ULW concentrations of O2, CDOM, and bacterial abundance both in controls and in MP treatments. All correlations were positive and significant (p < 0.05).
Bacterial abundance did not show any correlation with the other parameters in controls or MP treatments (Spearman rank correlation, p > 0.05). O2 concentration in both the SML and the ULW was correlated with CDOM in the MP treatments (Figure 3a,b). In the controls, the relationship was only observed for the SML (Figure 3c,d). By comparing the slopes of the regression lines in the ULW, there was a significant difference in the rate of O2 decrease associated with increased CDOM between controls and MP treatments (p = 0.0396, n = 12). This difference suggests an increased O2 loss rate with CDOM processing in the presence of microplastics as shown below.

Figure 3.
O2 concentrations and CDOM concentrations as a(355) in microplastic (MP) treatments (a,b; red triangles) and controls (c,d; blue dots) in the SML (a,c; left panel) and in the ULW (b,d; right panel). The decrease in O2 in both the SML and ULW in MP treatments was associated with CDOM concentration in the ULW (a,b), while no relationship was found in control samples (c,d).
- Controls-ULW: O2 = 244.30 µmol·L−1−(30.15 × a(355));
- MP treatments-ULW: O2 = 286.96 µmol·L−1−(98.69 × a(355)).
3.4. Enrichment Factors
To test for significant differences in the frequency distribution of EF values, Kolmogorov–Smirnov tests were performed on EF cumulative distributions. EFs for O2 ranged between 0.97 and 1.04 (controls) and 0.84 and 1.20 (MP treatments). Clear differences in the frequency distributions were observed (p = 0.0348 between controls and MP treatments). Changes mostly relied on the distribution of EFs toward higher values in controls (Figure 4a,b). On the contrary, EFs for CDOM a(355) were shifted towards higher values in the MP treatments (Figure 4c,d). EFs ranged from 0.48 to 1.02 (controls) and from 0.50 to 1.80 (MP treatments), with significant differences (p = 0.028). EFs for bacterial abundance ranged between 0.87 and 1.80 (controls) and between 0.94 and 1.51 (MP treatments), but the differences between controls and MP treatments were not significant (p > 0.05).
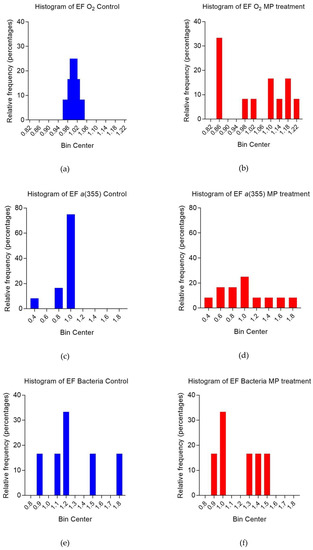
Figure 4.
Frequency distributions (percentages) of enrichment factors (EFs) for O2 (a,b), CDOM as a(355) (c,d), and bacterial abundances (e,f) in both controls (blue bars, left panel) and microplastic (MP) treatments (red bars, right panel).
4. Discussion
This simple experiment explored potential impacts of microplastics on SML composition and functioning. To keep the system as simple as possible, and due to methodological constraints, limited parameters were measured in a non-destructive manner; CDOM and oxygen were chosen as representatives of organic matter presence and processing. As the microcosms contained filtered organic matter produced by the marine diatom Chaetoceros socialis and bacteria that remained in the systems after filtration, original phytoplankton-generated organic matter was the same throughout.
The results confirm that the SML strongly depends on the ULW, also reflecting its composition [58,59]. In these controlled conditions, O2, CDOM, and bacterial cell concentrations in the SML varied in relation to their respective concentrations in the ULW (Table 2). This was reinforced through gentle aeration, as bubble scavenging transports organic material to the SML [1].
The largest difference between SML and ULW was observed in the light-exposed samples, indicating that light altered the composition of the SML organic material that was originally present. The marine SML is exposed to elevated solar radiation and higher temperature with respect to the ULW [6]. Clear differences between this experiment’s SML and ULW composition at simulated ambient solar radiation was the most representative scenario of reality. When considering all light and dark samples together, and comparing these findings to the diurnal light/dark cycle in SML functioning, controls and MP treatments showed evident differences in O2 and CDOM concentration. Lower O2 levels and higher CDOM occurred in the presence of microplastics, especially in the ULW samples (Figure 2). Clearly, enrichment in the SML in this experiment was driven by ULW concentration. Therefore, differences in enrichment factors (EFs) are mostly related to differences in the ULW of both controls and MP treatments. O2 was higher in the controls and led to a distribution toward higher EFs, despite the fact that concentrations in the SML and ULW were similar (Figure 4a,b). EFs for CDOM instead were shifted towards higher values in the MP treatments, leading to a CDOM-enriched SML in the presence of microplastics (Figure 4c,d). Bacterial abundances were not significantly different between controls and MP treatments in SML and ULW (Figure 2e,f) and, therefore, no clear differences in EFs were observed (Figure 4e,f). This could be explained by a lack of substrate for microbial attachment in the controls, favoring free living bacteria while particle-attached bacteria were not measured. The decrease in O2 concentration with increasing CDOM, clear in the MP treatments (Figure 3a,b) might, therefore, suggests a plastic-associated enhanced microbial respiration.
This experiment had clear limitations, and further studies are needed to address the effects of microplastics on the biogeochemistry of the SML. Here, the light/dark dynamics of SML and ULW samples amended with polystyrene microplastics were compared to microplastic-free controls. The parameters were chosen for a replicable setting with robust and non-invasive measurements. Bacterial cell numbers were only measured at the beginning and at the end of the experiment: no sample water was collected to keep the system as undisturbed as possible and not to infer on the concentration of microplastics. Therefore, the lack of differences in bacterial cell numbers between controls and MP treatments, as well as the lack of a statistically significant relationship between bacterial abundance and O2 content might have been biased by the limited number of samples for bacterial counts. The number of bacterial cells increased over time and particularly in the dark samples, probably indicating a productive microbial community responsible for the O2 decrease, especially in the ULW. In our recent study with a similar experimental set-up, the microbial production of CDOM increased in the presence of the same type of polystyrene microplastics [49]. The present study adds evidence that increased CDOM production in microplastic-treated waters may actually lead to an increased CDOM accumulation in the SML and to a higher microbial respiration, ultimately reflected in an oxygen-depleted environment.
All particles in aquatic systems provide potential surfaces for high microbial activity and organic matter production [60,61]. Microplastics are no exception, representing new habitats for marine microbial life [62,63]. Recent results on marine bacteria, taken during the TARA Expedition in the Mediterranean Sea, showed that plastic-associated bacteria have higher cell enrichment factors than natural organic particle-associated bacteria with respect to their free-living fraction [64]. Therefore, the increasing presence of microplastics poses urgent questions on the wider dynamics of these anthropogenic particles, in addition to their potential toxicological effects.
Our study was focused on potential impacts from inert plastic particles, which are similar to other inorganic particles at sea, but whose concentration is increasing due to anthropogenic activities. The use of inert polystyrene spheres, with a density of 1.05 g/m3, was chosen to represent typical sea surface microplastics, but it should be noted that there is lack of a shared microplastic reference standard, making comparison between studies more difficult. Polystyrene accumulation in the SML was documented since the 1970s [38,39] and two recent studies showed that low-density plastic particles, such as polystyrene, are the most abundant polymers found in the SML with enrichment factors >70 with respect to the underlying water [40,41]. Depth profile measurements of the North Atlantic subtropical gyre evidenced that most buoyant particles are present at the surface or near the surface [65], confirming earlier observations on microplastic enrichment in the SML [38,39,40,41]. However, little is still known on the residence time of microplastics in the SML and especially on the factors influencing their buoyancy and fate. Biofilms can modify particles’ vertical transport, potentially promoting the permanence of microplastics at intermediate depths [66]. Solar radiation, high in the SML [1,6] can modify particles’ density and buoyancy; exposure to UV light can initiate the photo-oxidative degradation of plastics [67], while absorption of visible light (400–700 nm) accelerates their thermal degradation [68]. Moreover, solar radiation also promotes the emission of methane and ethylene from low-density plastics such as polyethylene, in particular when these plastics are exposed to air rather than completely submerged in water [69].
5. Conclusions
The SML is an organic biofilm which, by controlling ocean–atmosphere interaction, has an essential function for marine biogeochemistry and climate regulation, able to reduce the air–sea exchange of CO2 by 15% [13]. Specific marine bacteria release polymeric exudates as a protection against UV [23,24], contributing to the gelatinous character of the SML; therefore, specific CDOM components can be present in higher concentrations with respect to the ULW as a result of photo-protection mechanisms, cell lysis processes, and microbial reworking of organic matter [16]. Both the photochemical breakdown of DOM [25] and carbon leached from plastics [50] can stimulate microbial growth in the ocean. Surface slicks are often associated with a high bacterial biomass comparable to biofilms on solid surfaces [13], and the SML microbial community could potentially produce significant amounts of CO2 at the ocean–air interface [28].
In the light of these considerations, we expect that microplastic enrichment in the SML could have multiple effects on the biogeochemistry of the SML itself, with direct and indirect impacts on gas exchange between the ocean and atmosphere, influencing the ocean’s oxygen content, the ocean’s production of climate relevant gases, and, ultimately, climate regulation.
This study was intended to explore new perspectives for future research on SML dynamics in a high-plastic ocean. Given the increasing presence of plastics in all marine environments and their role in microbial proliferation [50,61,62,70], new studies are needed to assess feedbacks across specific and wider biogeochemical cycles. This study indicates that microplastic-driven changes in the SML could occur. Whether or not these modifications interfere with gas exchange has profound implications. Research should focus on field quantification and monitoring, experimental studies on enrichment processes, and models on plastic residence time in the SML, as well as on their interaction with the microbial and photochemical turnover of organic matter. In particular, modeling studies on plastic transport from the surface should consider the biogenic composition of the ocean’s surface itself, as well as the physical environment that could promote or even accelerate photo-oxidative and thermal plastic degradation.
Considering these variables is essential to begin understanding the timing of potential global-scale effects of floating plastics and their fate in the marine environment.
Author Contributions
L.G. and S.A.L conceived the experiments. L.G. conducted the experiment, analyzed the data and wrote the manuscript. S.A.L. revised the data analysis and the statistics and commented on the manuscript throughout the whole submission and review process.
Funding
This work received funding from the European Union’s Horizon 2020 research and innovation program under the Marie Skłodowska-Curie grant agreement No. 702747 POSEIDOMM to L. Galgani.
Acknowledgments
The authors greatly acknowledge A. Corsi for support during the experiment, T. Klüver for bacterial analysis, A. Engel, and past and present colleagues at GEOMAR, IOW, UCSD, UNISI, and HCMR for the work done together studying the ocean’s surface.
Conflicts of Interest
The authors declare no conflict of interest.
References
- Hardy, J.T. The sea surface microlayer: Biology, chemistry and anthropogenic enrichment. Progr. Oceanogr. 1982, 11, 307–328. [Google Scholar] [CrossRef]
- Sieburth, J.M. Microbiological and organic-chemical processes in the surface and mixed layers. In Air-Sea Exchange of Gases and Particles; D. Reidel Publishing Company: Dordrecht, The Netherlands, 1983. [Google Scholar]
- Williams, P.M. Sea surface chemistry: Organic carbon and organic and inorganic nitrogen and phosphorus in surface films and subsurface waters. Deep-Sea Res. Oceanogr. Abstr. 1967, 14, 791–800. [Google Scholar] [CrossRef]
- Wurl, O.; Wurl, E.; Miller, L.; Johnson, K.; Vagle, S. Formation and global distribution of sea-surface microlayers. Biogeosciences 2011, 8, 121–135. [Google Scholar] [CrossRef]
- Hardy, J.T.; Apts, C.W.; Crecelius, E.A.; Fellingham, G.W. The sea-surface microlayer: Fate and residence times of atmospheric metals. Limnol. Oceanogr. 1985, 30, 93–101. [Google Scholar] [CrossRef]
- Liss, P.S.; Duce, R.A. The Sea Surface and Global Change; Cambridge University Press: Cambridge, UK, 2005. [Google Scholar]
- Sieburth, J.M.; Conover, J.T. Slicks associated with trichodesmium blooms in the sargasso sea. Nature 1965, 205, 830. [Google Scholar] [CrossRef]
- Cunliffe, M.; Engel, A.; Frka, S.; Gašparović, B.; Guitart, C.; Murrell, J.C.; Salter, M.; Stolle, C.; Upstill-Goddard, R.; Wurl, O. Sea surface microlayers: A unified physicochemical and biological perspective of the air-ocean interface. Progr. Oceanogr. 2013, 109, 104–116. [Google Scholar] [CrossRef]
- Engel, A.; Bange, H.W.; Cunliffe, M.; Burrows, S.M.; Friedrichs, G.; Galgani, L.; Herrmann, H.; Hertkorn, N.; Johnson, M.; Liss, P.S.; et al. The ocean’s vital skin: Toward an integrated understanding of the sea surface microlayer. Front. Mar. Sci. 2017, 4, 165. [Google Scholar] [CrossRef]
- Wurl, O.; Ekau, W.; Landing, W.M.; Zappa, C.J. Sea surface microlayer in a changing ocean—A perspective. Elem. Sci. Anthr. 2017, 5. [Google Scholar] [CrossRef]
- Henrichs, S.M.; Williams, P.M. Dissolved and particulate amino acids and carbohydrates in the sea surface microlayer. Mar. Chem. 1985, 17, 141–163. [Google Scholar] [CrossRef]
- Verdugo, P. Marine microgels. Annu. Rev. Mar. Sci. 2012, 4, 375–400. [Google Scholar] [CrossRef] [PubMed]
- Wurl, O.; Stolle, C.; Van Thuoc, C.; The Thu, P.; Mari, X. Biofilm-like properties of the sea surface and predicted effects on air–sea CO2 exchange. Progr. Oceanogr. 2016, 144, 15–24. [Google Scholar] [CrossRef]
- Wurl, O.; Holmes, M. The gelatinous nature of the sea-surface microlayer. Mar. Chem. 2008, 110, 89–97. [Google Scholar] [CrossRef]
- Cunliffe, M.; Murrell, J.C. The sea-surface microlayer is a gelatinous biofilm. ISME J. 2009, 3, 1001–1003. [Google Scholar] [CrossRef] [PubMed]
- Galgani, L.; Engel, A. Changes in optical characteristics of surface microlayers hint to photochemically and microbially mediated Dom turnover in the upwelling region off the coast of Peru. Biogeosciences 2016, 13, 2453–2473. [Google Scholar] [CrossRef]
- Tilstone, G.H.; Airs, R.L.; Vicente, V.M.; Widdicombe, C.; Llewellyn, C. High concentrations of mycosporine-like amino acids and colored dissolved organic matter in the sea surface microlayer off the iberian peninsula. Limnol. Oceanogr. 2010, 55, 1835–1850. [Google Scholar] [CrossRef]
- Mustaffa, N.I.H.; Ribas-Ribas, M.; Wurl, O. High-resolution variability of the enrichment of fluorescence dissolved organic matter in the sea surface microlayer of an upwelling region. Elem. Sci. Anthr. 2017, 5. [Google Scholar] [CrossRef]
- Zhang, J.; Yang, G. Chemical properties of colored dissolved organic matter in the sea-surface microlayer and subsurface water of Jiaozhou bay, China in autumn and winter. Acta Oceanol. Sin. 2013, 32, 26–39. [Google Scholar] [CrossRef]
- Coble, P.G. Marine optical biogeochemistry: The chemistry of ocean color. Chem. Rev. 2007, 107, 402–418. [Google Scholar] [CrossRef] [PubMed]
- Bracchini, L.; Dattilo, A.M.; Falcucci, M.; Hull, V.; Tognazzi, A.; Rossi, C.; Loiselle, S.A. Competition for spectral irradiance between epilimnetic optically active dissolved and suspended matter and phytoplankton in the metalimnion. Consequences for limnology and chemistry. Photochem. Photobiol. Sci. 2011, 10, 1000–1013. [Google Scholar] [CrossRef] [PubMed]
- Orellana, M.V.; Verdugo, P. Ultraviolet radiation blocks the organic carbon exchange between the dissolved phase and the gel phase in the ocean. Limnol. Oceanogr. 2003, 48, 1618–1623. [Google Scholar] [CrossRef]
- Flemming, H.-C.; Wingender, J. The biofilm matrix. Nat. Rev. Microbiol. 2010, 8, 623–633. [Google Scholar] [CrossRef]
- Ortega-Retuerta, E.; Passow, U.; Duarte, C.M.; Reche, I. Effects of ultraviolet b radiation on (not so) transparent exopolymer particles. Biogeosciences 2009, 6, 3071–3080. [Google Scholar] [CrossRef]
- Kieber, D.J.; McDaniel, J.; Mopper, K. Photochemical source of biological substrates in sea water: Implications for carbon cycling. Nature 1989, 341, 637–639. [Google Scholar] [CrossRef]
- Loiselle, S.; Vione, D.; Minero, C.; Maurino, V.; Tognazzi, A.; Dattilo, A.M.; Rossi, C.; Bracchini, L. Chemical and optical phototransformation of dissolved organic matter. Water Res. 2012, 46, 3197–3207. [Google Scholar] [CrossRef] [PubMed]
- Del Giorgio, P.A.; Duarte, C.M. Respiration in the open ocean. Nature 2002, 420, 379–384. [Google Scholar] [CrossRef] [PubMed]
- Garabétian, F. Production de CO2 à l’interface air-mer. Une approche par l’étude des phénomènes respiratoires dans la microcouche de surface. CO2 production at the sea-air interface. An approach by the study of respiratory processes in surface microlayer. Int. Rev. Gesamten Hydrobiol. 1990, 75, 219–229. [Google Scholar] [CrossRef]
- Andrady, A.L. Microplastics in the marine environment. Mar. Pollut. Bull. 2011, 62, 1596–1605. [Google Scholar] [CrossRef]
- Wurl, O.; Obbard, J.P. A review of pollutants in the sea-surface microlayer (SML): A unique habitat for marine organisms. Mar. Pollut. Bull. 2004, 48, 1016–1030. [Google Scholar] [CrossRef]
- Eriksen, M.; Lebreton, L.C.M.; Carson, H.S.; Thiel, M.; Moore, C.J.; Borerro, J.C.; Galgani, F.; Ryan, P.G.; Reisser, J. Plastic pollution in the world’s oceans: More than 5 trillion plastic pieces weighing over 250,000 tons afloat at sea. PLoS ONE 2014, 9, e111913. [Google Scholar] [CrossRef]
- Worm, B.; Lotze, H.K.; Jubinville, I.; Wilcox, C.; Jambeck, J. Plastic as a persistent marine pollutant. Annu. Rev. Environ. Resour. 2017, 42, 1–26. [Google Scholar] [CrossRef]
- Villarrubia-Gómez, P.; Cornell, S.E.; Fabres, J. Marine plastic pollution as a planetary boundary threat—The drifting piece in the sustainability puzzle. Mar. Policy 2018, 96, 213–220. [Google Scholar] [CrossRef]
- Lavender Law, K. Plastics in the marine environment. Annu. Rev. Mar. Sci. 2017, 9, 205–229. [Google Scholar]
- Vegter, A.C.; Barletta, M.; Beck, C.; Borrero, J.; Burton, H.; Campbell, M.L.; Costa, M.F.; Eriksen, M.; Eriksson, C.; Estrades, A.; et al. Global research priorities to mitigate plastic pollution impacts on marine wildlife. Endanger. Species Res. 2014, 25, 225–247. [Google Scholar] [CrossRef]
- Wilcox, C.; Puckridge, M.; Schuyler, Q.A.; Townsend, K.; Hardesty, B.D. A quantitative analysis linking sea turtle mortality and plastic debris ingestion. Sci. Rep. 2018, 8, 12536. [Google Scholar] [CrossRef] [PubMed]
- Geyer, R.; Jambeck, J.R.; Law, K.L. Production, use, and fate of all plastics ever made. Sci. Adv. 2017, 3, e1700782. [Google Scholar] [CrossRef] [PubMed]
- Carpenter, E.J.; Anderson, S.J.; Harvey, G.R.; Miklas, H.P.; Peck, B.B. Polystyrene spherules in coastal waters. Science 1972, 178, 749–750. [Google Scholar] [CrossRef] [PubMed]
- Carpenter, E.J.; Smith, K.L. Plastics on the sargasso sea surface. Science 1972, 175, 1240–1241. [Google Scholar] [CrossRef] [PubMed]
- Song, Y.K.; Hong, S.H.; Jang, M.; Kang, J.-H.; Kwon, O.Y.; Han, G.M.; Shim, W.J. Large accumulation of micro-sized synthetic polymer particles in the sea surface microlayer. Environ. Sci. Technol. 2014, 48, 9014–9021. [Google Scholar] [CrossRef] [PubMed]
- Song, Y.K.; Hong, S.H.; Jang, M.; Han, G.M.; Shim, W.J. Occurrence and distribution of microplastics in the sea surface microlayer in Jinhae bay, South Korea. Arch. Environ. Contam. Toxicol. 2015, 69, 279–287. [Google Scholar] [CrossRef] [PubMed]
- Chae, D.-H.; Kim, I.-S.; Kim, S.-K.; Song, Y.K.; Shim, W.J. Abundance and distribution characteristics of microplastics in surface seawaters of the Incheon/Kyeonggi coastal region. Arch. Environ. Contam. Toxicol. 2015, 69, 269–278. [Google Scholar] [CrossRef] [PubMed]
- Koelmans, A.A.; Besseling, E.; Wegner, A.; Foekema, E.M. Plastic as a carrier of pops to aquatic organisms: A model analysis. Environ. Sci. Technol. 2013, 47, 7812–7820. [Google Scholar] [CrossRef] [PubMed]
- Teuten, E.L.; Rowland, S.J.; Galloway, T.S.; Thompson, R.C. Potential for plastics to transport hydrophobic contaminants. Environ. Sci. Technol. 2007, 41, 7759–7764. [Google Scholar] [CrossRef] [PubMed]
- Garabetian, F.; Romano, J.-C.; Paul, R.; Sigoillot, J.-C. Organic matter composition and pollutant enrichment of sea surface microlayer inside and outside slicks. Mar. Environ. Res. 1993, 35, 323–339. [Google Scholar] [CrossRef]
- Wells, M.L.; Kozelka, P.B.; Bruland, K.W. The complexation of ‘dissolved’ Cu, Zn, Cd and Pb by soluble and colloidal organic matter in Narragansett bay, Ri. Mar. Chem. 1998, 62, 203–217. [Google Scholar] [CrossRef]
- Benner, R. Chemical composition and reactivity. In Biogeochemistry of Marine Dissolved Organic Matter; Hansell, D.A., Carlson, D.J., Eds.; Academic Press—Elsevier: Cambridge, MA, USA, 2002; pp. 59–90. [Google Scholar]
- Benner, R.; Pakulski, J.D.; McCarthy, M.; Hedges, J.I.; Hatcher, P.G. Bulk chemical characteristics of dissolved organic matter in the ocean. Science 1992, 255, 1561–1564. [Google Scholar] [CrossRef] [PubMed]
- Galgani, L.; Engel, A.; Rossi, C.; Donati, A.; Loiselle, S.A. Polystyrene microplastics increase microbial release of marine chromophoric dissolved organic matter in microcosm experiments. Sci. Rep. 2018, 8, 14635. [Google Scholar] [CrossRef] [PubMed]
- Romera-Castillo, C.; Pinto, M.; Langer, T.M.; Álvarez-Salgado, X.A.; Herndl, G.J. Dissolved organic carbon leaching from plastics stimulates microbial activity in the ocean. Nat. Commun. 2018, 9, 1430. [Google Scholar] [CrossRef] [PubMed]
- GESAMP. The Sea-Surface Microlayer and Its Role in Global Change; WMO: Geneva, Switzerland, 1995; Volume 52, p. 92. [Google Scholar]
- Galgani, L.; Piontek, J.; Engel, A. Biopolymers form a gelatinous microlayer at the air-sea interface when arctic sea ice melts. Sci. Rep. 2016, 6, 29465. [Google Scholar] [CrossRef] [PubMed]
- Galgani, L.; Stolle, C.; Endres, S.; Schulz, K.G.; Engel, A. Effects of ocean acidification on the biogenic composition of the sea-surface microlayer: Results from a mesocosm study. J. Geophys. Res.-Oceans 2014, 119, 7911–7924. [Google Scholar] [CrossRef]
- Rahlff, J.; Stolle, C.; Giebel, H.-A.; Brinkhoff, T.; Ribas-Ribas, M.; Hodapp, D.; Wurl, O. High wind speeds prevent formation of a distinct bacterioneuston community in the sea-surface microlayer. FEMS Microbiol. Ecol. 2017, 93, fix041. [Google Scholar] [CrossRef] [PubMed]
- Cavanaugh, G.M. Formulae and Methods IV [i.e., 4th ed.] of the Marine Biological Laboratory Chemical Room; The Marine Biological Laboratory: Woods Hole, MA, USA, 1975; Volume 2016. [Google Scholar]
- Bricaud, A.; Morel, A.; Prieur, L. Absorption by dissolved organic matter of the sea (yellow substance) in the uv and visible domains. Limnol. Oceanogr. 1981, 26, 43–53. [Google Scholar] [CrossRef]
- Engel, A.; Galgani, L. The organic sea-surface microlayer in the upwelling region off the coast of Peru and potential implications for air–sea exchange processes. Biogeosciences 2016, 13, 989–1007. [Google Scholar] [CrossRef]
- Dreshchinskii, A.; Engel, A. Seasonal variations of the sea surface microlayer at the Boknis Eck Times Series Station (Baltic Sea). J. Plankton Res. 2017, 39, 943–961. [Google Scholar] [CrossRef]
- Mustaffa, N.I.H.; Badewien, T.H.; Ribas-Ribas, M.; Wurl, O. High-resolution observations on enrichment processes in the sea-surface microlayer. Sci. Rep. 2018, 8, 13122. [Google Scholar] [CrossRef] [PubMed]
- Paerl, H.W. Microbial attachment to particles in marine and freshwater ecosystems. Microb. Ecol. 1975, 2, 73–83. [Google Scholar] [CrossRef] [PubMed]
- Rummel, C.D.; Jahnke, A.; Gorokhova, E.; Kühnel, D.; Schmitt-Jansen, M. Impacts of biofilm formation on the fate and potential effects of microplastic in the aquatic environment. Environ. Sci. Technol. Let. 2017, 4, 258–267. [Google Scholar] [CrossRef]
- Zettler, E.R.; Mincer, T.J.; Amaral-Zettler, L.A. Life in the “plastisphere”: Microbial communities on plastic marine debris. Environ. Sci. Technol. 2013, 47, 7137–7146. [Google Scholar] [CrossRef]
- Reisser, J.; Shaw, J.; Hallegraeff, G.; Proietti, M.; Barnes, D.K.A.; Thums, M.; Wilcox, C.; Hardesty, B.D.; Pattiaratchi, C. Millimeter-sized marine plastics: A new pelagic habitat for microorganisms and invertebrates. PLoS ONE 2014, 9, e100289. [Google Scholar] [CrossRef]
- Dussud, C.; Meistertzheim, A.L.; Conan, P.; Pujo-Pay, M.; George, M.; Fabre, P.; Coudane, J.; Higgs, P.; Elineau, A.; Pedrotti, M.L.; et al. Evidence of niche partitioning among bacteria living on plastics, organic particles and surrounding seawaters. Environ. Pollut. 2018, 236, 807–816. [Google Scholar] [CrossRef]
- Kooi, M.; Reisser, J.; Slat, B.; Ferrari, F.F.; Schmid, M.S.; Cunsolo, S.; Brambini, R.; Noble, K.; Sirks, L.-A.; Linders, T.E.W.; et al. The effect of particle properties on the depth profile of buoyant plastics in the ocean. Sci. Rep. 2016, 6, 33882. [Google Scholar] [CrossRef]
- Kooi, M.; Nes, E.H.V.; Scheffer, M.; Koelmans, A.A. Ups and downs in the ocean: Effects of biofouling on vertical transport of microplastics. Environ. Sci. Technol. 2017, 51, 7963–7971. [Google Scholar] [CrossRef] [PubMed]
- Andrady, A.L. Persistence of plastic litter in the oceans. In Marine Anthropogenic Litter; Bergmann, M., Gutow, L., Klages, M., Eds.; Springer International Publishing: Cham, Switzerland, 2015; pp. 57–72. [Google Scholar]
- Sikandar, S.S.; Imtiaz, A.; Muhammad, I. Degradation study of used polystyrene with UV irradiation. Adv. Mater. Sci. 2017, 2, 1–6. [Google Scholar] [CrossRef]
- Royer, S.-J.; Ferrón, S.; Wilson, S.T.; Karl, D.M. Production of methane and ethylene from plastic in the environment. PLoS ONE 2018, 13, e0200574. [Google Scholar] [CrossRef] [PubMed]
- Galloway, T.S.; Cole, M.; Lewis, C. Interactions of microplastic debris throughout the marine ecosystem. Nat. Ecol. Evol. 2017, 1, 0116. [Google Scholar] [CrossRef] [PubMed]


© 2019 by the authors. Licensee MDPI, Basel, Switzerland. This article is an open access article distributed under the terms and conditions of the Creative Commons Attribution (CC BY) license (http://creativecommons.org/licenses/by/4.0/).